a review of nowcasting of convective weather over …घकन क रम कस सम क ष ह...
TRANSCRIPT

MAUSAM, 70, 3 (July 2019), 465-484
551.509.316
(465)
A review of Nowcasting of convective weather over the Indian region
SOMA SEN ROY, M. MOHAPATRA, AJIT TYAGI and S. K. ROY BHOWMIK
India Meteorological Department, Lodi Road, New Delhi – 110 003, India
email : [email protected]
सार – हाल के वर्षों में, पे्रक्षण और संगणना संजालों, पवूाानमुान तकनीक तथा संचार चनैलों में सुधार के साथ, स् थान शवषेर्ष के ममसम के सक क पवूाानमुान कस सावाजकनक मांग ़ र रह है। यह आवश् यकता शवषेर्ष ूपप से ोटक ववि ध के मेसटस् केल ममसम प्रणायलयों के यलम महसूस कस जाती है, जजसके समाधान कस कारावाई करने के यलम कम समय हटता है। वतामान लेख ़हुत कम समय वतंराल में भारत में गजा के साथ तूफान का पवूाानमुान देने कस हाल के घकनाक्रमों कस समीक्षा है । इस लेख में पहले भारतीय क्षेत्र में गजा के साथ तूफान के जलवाय ुशवज्ञान, इसकस ममसमी, स् थाकनक मव ं दैकनक पवरवकताता पर संषक्षप् त चचाा कस गई है। इसके ़ाद नम पे्रक्षण ससंाधनों कस चचाा कस गई है जट वतामान पी र के उपग्रह डेका तथा उत पादों, डॉपलर रेडार, तड़ित संसूचन सजंाल और सतह मव ंउपवरतन वाय ुसजंाल के वेधषालाओ ंसे पवरचालनात मक गजा के साथ तूफान का पवूाानमुान देने के यलम उपलब् ध हट रहे हं। इसके ़ाद संख यात मक ममसम का पवूाानमुान देने के यलम संवहनीय ममसम का वल् पववि ध का तात कायलक वनमुान देने कस दकुनया भर में उपलब् ध संख यात मक तकनीकों कस चचाा कस गई है जजन मॉडलों कट भारत में प्रचालनात मक ूपप में लाग ूिकया गया है, उनके सॉफ्कवेयर के सत यापन से प्राप् त पवरणामों कट सकं्षेप में दषााते हुम वि धक शवस् तार से चचाा कस गई है। वगले खंड में भारत ममसम शवज्ञान शवभाग (आई मम डी) में प्रचालनात मक तात कायलक वनमुान कस वतामान प्रिक्रया का शववरण ददया गया है जजसमें तात कायलक पवूाानमुान के तंत्र कट सुधारने के यलम िकम गम नवीन प्रयास षायमल हं। सत यापन के पवरणाम इस तथ् य कट दषााते हं िक इन उपायों कट सफलतापवूाक लागू िकया गया है और भारतीय क्षेत्र में गजा के साथ तूफान का पवूाानमुान देने में उल् लेखनीय सुधार हुआ है। वकंतम खंड में शवयभन् न सरकार और कनजी मजेंयसयों ्वारा गजा के साथ तूफान और इससे सं़िं धत ममसम तथा गजा के साथ तूफान के प्रभाव का आकलन करने के यलम कस गई पहलों का शववरण है। इस खंड में गजा के साथ तूफान का पवूाानमुान देने वाले पवूाानमुानकताा समुदायों के समक्ष प्रस् तुत चनुमकतयों का भी जजक्र िकया गया है।
ABSTRACT. In recent years, with the improvement of observation and computation networks, prediction
techniques as well as communication channels, there is an increasing public demand for location specific accurate
forecast of weather. This need is especially felt for short duration mesoscale weather systems, for which there is less time for taking safety measures. The present article is a brief review of the recent developments in the field of operational
thunderstorm prediction over India in the short to very short time scale. The article first briefly discusses the climatology
of thunderstorms over the Indian region, its seasonal, spatial and diurnal variability. It then discusses the new observation resources that are now becoming available for operational thunderstorm forecasting including the current generation of
satellites, Doppler radars, lightning detection network, as well as the surface and upper air network of observatories. This
is followed by a discussion of numerical techniques available worldwide for very short range to nowcast scale forecasting
of convective weather. The models that have been operationally implemented in India are discussed in greater detail
along with brief mention of the results from the verification of these softwares. The next section details the current
procedure of operational nowcasting in India Meteorological Department (IMD) including the recent efforts undertaken to improve the nowcast mechanism. The verification results bear out the fact that these measures have been successfully
implemented and there has been significant improvement in operational forecasting of thunderstorms over the Indian
region. The final section details the initiatives taken by various government and private agencies to improve the forecasting of thunderstorms and associated weather and impact assessment of thunderstorms. The present challenges
before the community of thunderstorm forecasters is also detailed in this section.
Key words – Thunderstorm, Nowcasting, Lightening.
1. Introduction
Most of the Indian landmass is prone to several
natural disasters, with severe cyclones affecting the east
and west coasts, large-scale flooding in the major river
systems such as Ganges, Brahmaputra during the
monsoon season, etc. There have also been instances of
localized heavy rainfall events that have resulted in
widespread devastation in the region of interest. This
includes instances like the Mumbai rainfall episode of 26th
July, 2005 when more than 100 cm of rainfall was
received in 24 hours over a very small area (20-30 km)
and the cloudburst over Leh on 6th
August, 2010 during
which 225 people died. The current technology level for

466 MAUSAM, 70, 3 (July 2019)
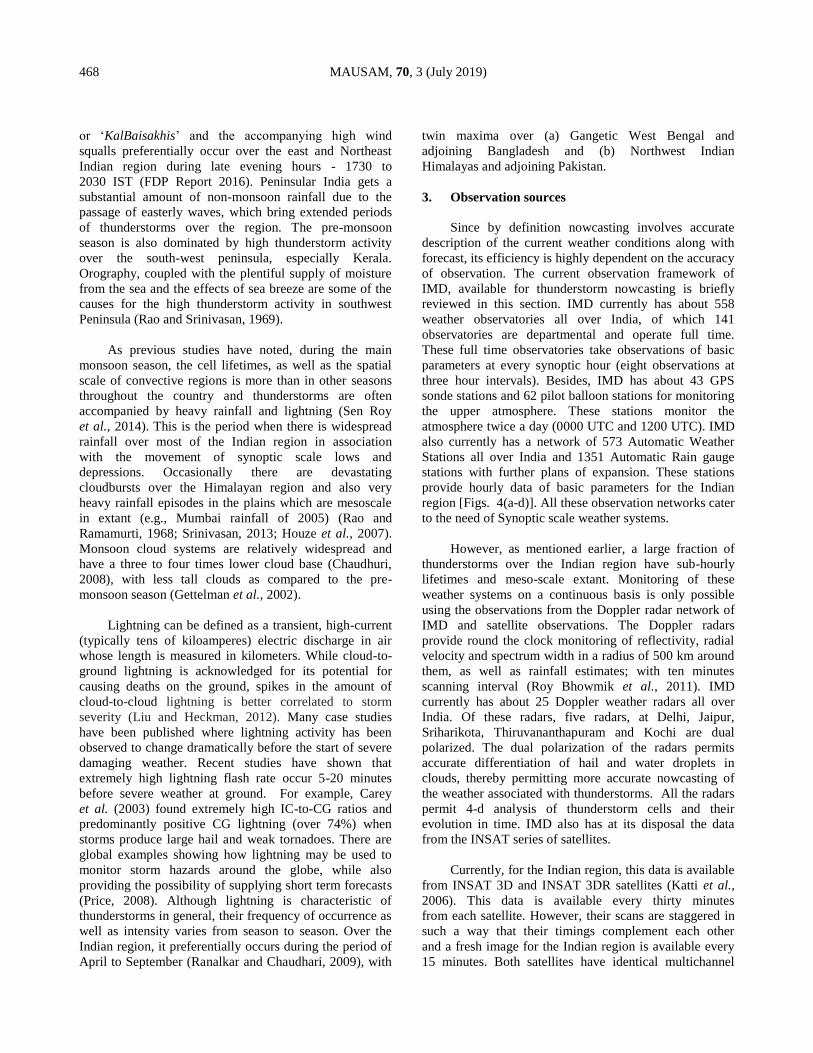
Fig. 1. Annual no. of deaths due to thunderstorms
(Source:https://ndma.gov.in/images/pdf/Draft-Guidelines-thundersto rm.pdf)
prediction of damages associated with large scale natural
phenomena such as tropical cyclones is improving every
year for the Indian region and accurate forecast of track
and intensity of such phenomena are available with
reasonable accuracy for up to five days in advance
(Mohapatra et al., 2013 a,b; Kotal et al., 2014), which has
resulted in substantial decrease of human mortality
(Haque et al., 2012; Peduzzi et al., 2012; Mohapatra et al.,
2012; Mohanty et al., 2015). However, on account of the
population density over the Indian subcontinent region
and the increasing economic activity, the human and
economic cost due to smaller scale convective weather
phenomena such as thunderstorms is increasing every year
(Fig. 1 displays the deaths due to thunderstorms and
lightning during 2001 to 2017 (source: https://ndma.
gov.in/images/pdf/Draft-Guidelines-thunderstorm.pdf).
Recently, high winds associated with thunderstorms,
resulted in the death of 134 people in Rajasthan and Uttar
Pradesh on 2nd
May, 2018. Heavy rainfall and high winds
from small weather systems in urban areas, causes
cascading breakdown of infrastructure systems/networks
in civil society. Public awareness of the scope of these
weather phenomena is increasing in recent years and there
is a growing demand for location specific accurate
forecasts of such severe weather events for day to day
activities as well as major events such as the
Commonwealth Games 2010 in Delhi. However, these
mesoscale severe weather events have short life period of
about three hours and are highly localized. As a result, it is
difficult to detect such phenomena with limited
observation network as well as predict by global NWP
models in short to medium range. Hence, worldwide there
have been attempts to improve the observation network
including satellite, Radar, AWS, for better detection;
improved mesoscale models outputs with high resolution
and local data assimilation; and thence to develop an
expert system to provide accurate very short range
forecast of weather.
As mentioned by Tyagi (2000), local severe weather
systems can be divided into three groups:
(i) Those that are primarily forced by surface in
homogeneities (terrain-induced mesoscale systems),
e.g., sea and land breeze, valley winds, urban circulations.
(ii) Those that are primarily forced by instabilities
traveling in large-scale disturbances (synoptically induced
mesoscale system), e.g., squall lines and mesoscale cloud
clusters.
(iii) Combinations of the above where instabilities of
large-scale features get accentuated and/or persist for
longer periods due to orographic features, e.g., heavy
precipitation and severe thunderstorm activity at certain
locations.
When separated in scale, Thunis and Borstein (1996)
noted that weather systems can be in the range of :
(a) meso-gamma scale – Spatial scale of a few km with
lifetime of less than an hour
(b) Meso-beta scale – Spatial scale of 20 to 200 km with
lifetime of less than six hours
(c) Meso-alpha scale – Spatial scale of 200-2000 km
with lifetime of greater than six hours.
While the first type of systems, due to their short
temporal and spatial existence, can be difficult to forecast
with long lead period, the forecasting accuracy and lead
period improves for both the other two types of weather
systems. Thunderstorm systems, over the Indian region,
exist in all three scales. However, they are pre-dominantly
in the meso-beta and meso-gamma scale, especially
during the pre-monsoon season (March to May) when
they are most hazardous.
The definition and meaning of “nowcasting” have
gone through some subtle changes down the years.
Originally defined as a combination of description of
current situation and extrapolation of recent trends up to
two hours ahead (Browning, 1982), it can now extend to
several hours ahead with increasingly blurred distinction
between “nowcasting” and “very short range forecasting”
(VSRF). In view of its increasing importance, in 2010, the
WMO Working Group on Nowcasting Research has re-
defined the scope of forecasting for such mesoscale
phenomena as Nowcasting, which is defined as:
forecasting with local detail, by any method, over a period
from the present to 6 hours ahead, including a detailed
description of the present weather (WMO, 2017). In
addition to using Nowcasting for warning the public and

SEN ROY et al. : NOWCASTING OF CONVECTIVE WEATHER OVER THE INDIAN REGION 467
Fig. 2. Annual Spatial distribution of thunderstorms over the Indian
region during 1951 to 1980 [Source: Fig. 5 from Tyagi, 2007.
Thunderstorm climatology over Indian region, Mausam, 58,
2, p189].
disaster managers of hazardous weather, it is also used for
aviation weather forecasts in the terminal and en-route
environment, marine safety, water and power
management, off-shore oil drilling, construction industry
and leisure industry. Though mesoscale events include
various types of severe weather like heavy rainfall events,
thunderstorms etc., this article looks at different aspects of
nowcasting of thunderstorms and reviews the challenges
for nowcasting the different aspects of these weather
systems in the Indian context. It is mainly because of the
fact that the deaths due to thunderstorms in India are
manifold as compared to that due to other events like
cyclones and heavy rainfall causing floods. The
climatological aspect of thunderstorms over Indian region
is presented in Section 2. The observational sources,
nowcast tools and their verification, current status of
nowcasting in India and its verification, and future scope
and challenges of nowcasting are presented in the
following sections.
2. Thunderstorms over the Indian region
India Meteorological Department defines a
thunderstorm as a meteorological phenomenon in which
one or more sudden electrical discharges manifested by a
flash of light (Lightning) and a sharp rumbling sound
(thunder) occurs from a cloud of vertical development.
Most localized severe weather over the Indian region
occurs in association with thunderstorms. Associated with
Fig. 3. Intra-Annual frequency of thunderstorms over the Indian
region during 2016 and 2017 (Source: IMD)
thunderstorms, over the Indian region, primarily five
phenomena result in widespread damages: (i) High winds
(ii) Dust storms (iii) Hailstorm (iv) Lightning (v) Heavy
rainfall. However, studies have noted that all five
phenomena rarely occur concurrently in association with a
thunderstorm event over the Indian region, although more
than one can occur simultaeously. Fig. 2 displays the
annual spatial climatological frequency of thunderstorms
over India during 1951-1980 (Tyagi, 2007) over the
Indian region, while Fig. 3 displays the monthly frequency
of thunderstorms over the Indian region during 2016 and
2017. As may be noted, there are maxima in thunderstorm
occurrence along the coast of Kerala and Gangetic West
Bengal, as well as along the foothills of the Himalayas. As
Fig. 3 indicates, their annual frequency over the Indian
region is also primarily uniimodal, peaking in the months
of May and June.
However, the character of thunderstorms, as well as
their spatial scale and lifetimes shows wide variation
during the course of the year and varies regionally
(Romatschke et al., 2010). The severity of thunderstorms
over the Indian region is predominant during the pre-
monsoon season (March to May). Most thunderstorms
during these seasons are of meso-beta or more commonly,
meso-gamma spatial and temporal scale and triggered by
meso-scale forcings. Over Northwest India plain regions,
in the absence of adequate moisture in the atmosphere,
frequent dry convective dust storms called “Aandhi” occur
during this season. Hailstorms preferentially occur over
Northwest India (especially over the Himalayan mountain
region) and during the afternoon period 1430 to 1730 IST
(FDP Report, 2016). Over eastern India and adjoining
Bangladesh, the thunderstorm systems are of large spatial
extant, often organized into bow-shaped squall line
systems and result in heavy localized rainfall accompanied
by high winds and tornadoes and more frequent in the
orographically dominant regions as well as the coastal
areas (Singh et al., 2011). These are called ‘Nor’westers’
468 MAUSAM, 70, 3 (July 2019)
or ‘KalBaisakhis’ and the accompanying high wind
squalls preferentially occur over the east and Northeast
Indian region during late evening hours - 1730 to
2030 IST (FDP Report 2016). Peninsular India gets a
substantial amount of non-monsoon rainfall due to the
passage of easterly waves, which bring extended periods
of thunderstorms over the region. The pre-monsoon
season is also dominated by high thunderstorm activity
over the south-west peninsula, especially Kerala.
Orography, coupled with the plentiful supply of moisture
from the sea and the effects of sea breeze are some of the
causes for the high thunderstorm activity in southwest
Peninsula (Rao and Srinivasan, 1969).
As previous studies have noted, during the main
monsoon season, the cell lifetimes, as well as the spatial
scale of convective regions is more than in other seasons
throughout the country and thunderstorms are often
accompanied by heavy rainfall and lightning (Sen Roy
et al., 2014). This is the period when there is widespread
rainfall over most of the Indian region in association
with the movement of synoptic scale lows and
depressions. Occasionally there are devastating
cloudbursts over the Himalayan region and also very
heavy rainfall episodes in the plains which are mesoscale
in extant (e.g., Mumbai rainfall of 2005) (Rao and
Ramamurti, 1968; Srinivasan, 2013; Houze et al., 2007).
Monsoon cloud systems are relatively widespread and
have a three to four times lower cloud base (Chaudhuri,
2008), with less tall clouds as compared to the pre-
monsoon season (Gettelman et al., 2002).
Lightning can be defined as a transient, high-current
(typically tens of kiloamperes) electric discharge in air
whose length is measured in kilometers. While cloud-to-
ground lightning is acknowledged for its potential for
causing deaths on the ground, spikes in the amount of
cloud-to-cloud lightning is better correlated to storm
severity (Liu and Heckman, 2012). Many case studies
have been published where lightning activity has been
observed to change dramatically before the start of severe
damaging weather. Recent studies have shown that
extremely high lightning flash rate occur 5-20 minutes
before severe weather at ground. For example, Carey
et al. (2003) found extremely high IC-to-CG ratios and
predominantly positive CG lightning (over 74%) when
storms produce large hail and weak tornadoes. There are
global examples showing how lightning may be used to
monitor storm hazards around the globe, while also
providing the possibility of supplying short term forecasts
(Price, 2008). Although lightning is characteristic of
thunderstorms in general, their frequency of occurrence as
well as intensity varies from season to season. Over the
Indian region, it preferentially occurs during the period of
April to September (Ranalkar and Chaudhari, 2009), with
twin maxima over (a) Gangetic West Bengal and
adjoining Bangladesh and (b) Northwest Indian
Himalayas and adjoining Pakistan.
3. Observation sources
Since by definition nowcasting involves accurate
description of the current weather conditions along with
forecast, its efficiency is highly dependent on the accuracy
of observation. The current observation framework of
IMD, available for thunderstorm nowcasting is briefly
reviewed in this section. IMD currently has about 558
weather observatories all over India, of which 141
observatories are departmental and operate full time.
These full time observatories take observations of basic
parameters at every synoptic hour (eight observations at
three hour intervals). Besides, IMD has about 43 GPS
sonde stations and 62 pilot balloon stations for monitoring
the upper atmosphere. These stations monitor the
atmosphere twice a day (0000 UTC and 1200 UTC). IMD
also currently has a network of 573 Automatic Weather
Stations all over India and 1351 Automatic Rain gauge
stations with further plans of expansion. These stations
provide hourly data of basic parameters for the Indian
region [Figs. 4(a-d)]. All these observation networks cater
to the need of Synoptic scale weather systems.
However, as mentioned earlier, a large fraction of
thunderstorms over the Indian region have sub-hourly
lifetimes and meso-scale extant. Monitoring of these
weather systems on a continuous basis is only possible
using the observations from the Doppler radar network of
IMD and satellite observations. The Doppler radars
provide round the clock monitoring of reflectivity, radial
velocity and spectrum width in a radius of 500 km around
them, as well as rainfall estimates; with ten minutes
scanning interval (Roy Bhowmik et al., 2011). IMD
currently has about 25 Doppler weather radars all over
India. Of these radars, five radars, at Delhi, Jaipur,
Sriharikota, Thiruvananthapuram and Kochi are dual
polarized. The dual polarization of the radars permits
accurate differentiation of hail and water droplets in
clouds, thereby permitting more accurate nowcasting of
the weather associated with thunderstorms. All the radars
permit 4-d analysis of thunderstorm cells and their
evolution in time. IMD also has at its disposal the data
from the INSAT series of satellites.
Currently, for the Indian region, this data is available
from INSAT 3D and INSAT 3DR satellites (Katti et al.,
2006). This data is available every thirty minutes
from each satellite. However, their scans are staggered in
such a way that their timings complement each other
and a fresh image for the Indian region is available every
15 minutes. Both satellites have identical multichannel

SEN ROY et al. : NOWCASTING OF CONVECTIVE WEATHER OVER THE INDIAN REGION 469
Figs. 4(a-d). Observatory network of IMD in 2018 (a) Surface observatory network (558 nos.), (b) Automatic Weather Station network (573 nos),
(c) GPS sonde network (43 nos) (d) Doppler Weather Radar (25 nos) (Source: IMD)
imager as well as a sounder payload to suitably
complement each other. In addition to brightness images
from different channels, various products derived from
data using a combination of channels, is also produced
from these satellites. Different satellite derived products
such as improved precipitation type and amount estimates
from the “Hydroestimator” technique (Varma et al.,
2015), Atmospheric Motion vectors (Deb et al., 2016),
vertical temperature and humidity profiles
(Krishnamoorthy et al., 2016) greatly aid in analysis of
convection over the Indian region. All these data are
transmitted and made available for forecasting centres
using latest communication tools. Additionally, a web
based application RAPID (Real Time Analysis of
Products and Information Dissemination) has been
developed jointly by Space Applications Centre (SAC),
(a) (b)
(c) (d)

470 MAUSAM, 70, 3 (July 2019)
ISRO, Ahmedabad and IMD (https://www.isro.gov.
in/rapid-gateway-to-indian-weather-satellite-data). This
application is hosted in IMD website (rapid.imd.gov.in).
This tool permits quick interactive visualization and
4-Dimensional analysis of weather based on Indian
INSAT satellite data. Data from non-Indian satellites such
as Meteosat is also available in a rapid updating mode and
provides additional information of the weather
(http://foreignsat.imd.gov.in/)
In view of the short lifetime and mesoscale nature of
thunderstorms, a ground-based lightning detection
network is a useful aid for real-time detection of location
and intensity of thunderstorm cells. The Indian Institute of
Tropical Meteorology has a ground based Lightning
Detection Network with about 48 sensors over various
parts of the country and connected to central processing
unit at IITM, Pune supplied by Earth Networks. The Earth
Networks Total Lightning Network (ENTLN) sensors
operate in a frequency range from 1 Hz to 12 MHz
(spanning the ELF, VLF, LF, MF and HF ranges). Both
cloud and CG lightning discharges are reported by the
sensors. When lightning occurs, electromagnetic energy is
emitted in all directions. Every ENLS sensor that detected
the waveforms records and sends the waveforms to the
central lightning detection server via the Internet. The
precise arrival times are calculated by correlating the
waveforms from all the sensors that detected the strokes of
a flash. The waveform arrival time and signal amplitude
can be used to determine the peak current of the stroke
and its exact location including latitude, longitude and
altitude. Although, a comparison with the satellite based
Lightning Imaging Sensor (LIS) data for a period of 18
months indicates that the ENTLN data has seasonally and
spatially varying coincidence percent (CP) value with the
LIS data; however, it was better that other ground based
networks (Thompson et al., 2014). The Indian Air Force
has a similar network. The data from both networks is
currently available to India Meteorological Department for
display and aid in detection of severity of thunderstorms.
Three sets of products have been developed and kept on
the IMD website: lightning data overlaid on INSAT 3D
satellite and radar image for the last 30 minutes (http://
www.imd.gov.in/section/satmet/lightning/), lightning data
overlaid on Meteosat image (http://foreignsat. imd.gov.in/)
while a third product displays current lightning data
overlaid on radar and satellite data
(http://ddgmui.imd.gov.in/radar/leaflet-map-csv-master/
mosaic.php). The third product also provides district-wise
report of occurrence of lightning, every fifteen minutes.
4. Available nowcasting techniques
A variety of heuristic approaches with varying
degrees of complexity and automation are used by
different nowcasting systems. Most nowcasting systems
concentrate on forecasting of rainfall, or parameters, such
as reflectivity, that are directly related to rainfall and its
evolution and movement of the rain giving systems. The
currently employed approaches to this can be classified in
three distinct categories: extrapolation, explicit storm
models and expert systems. A list of some operational
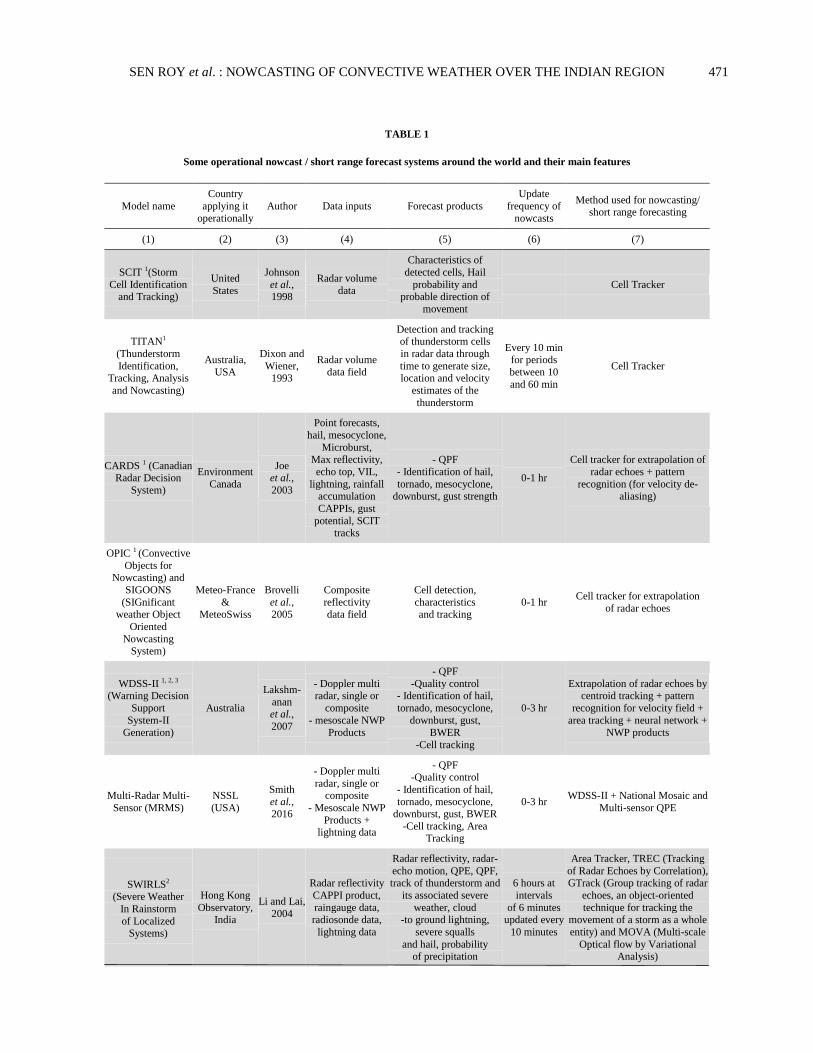
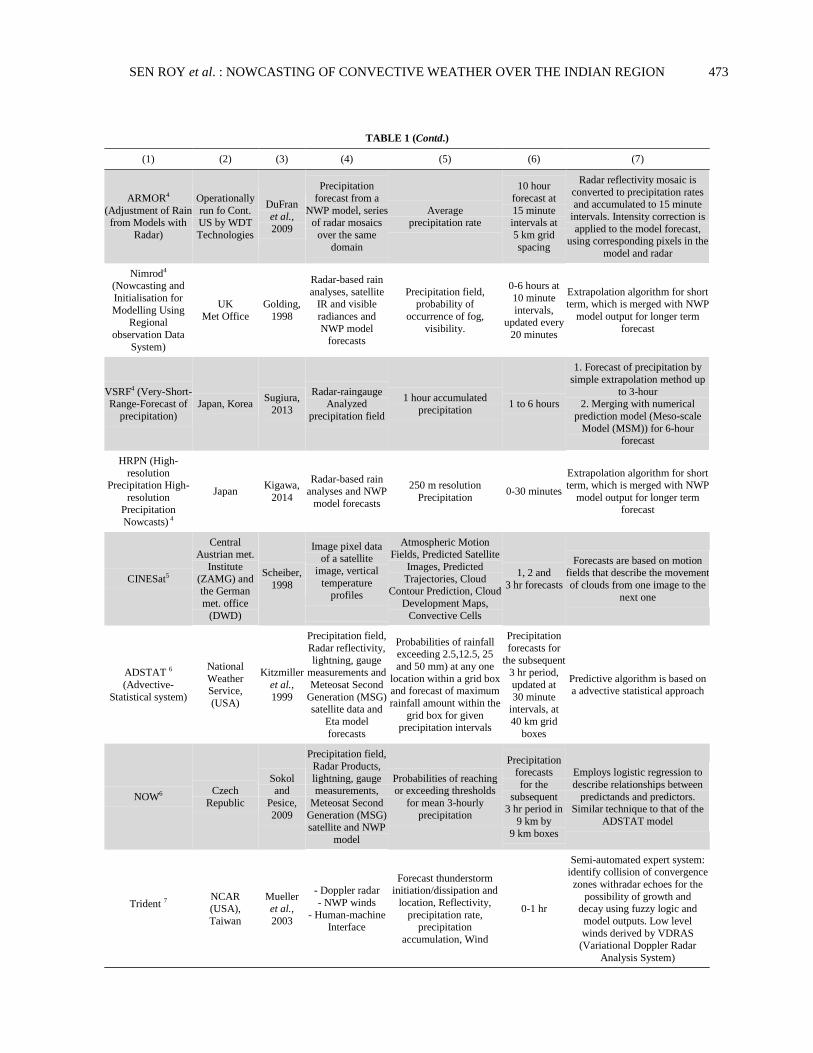
nowcast systems around the world, are listed in Table 1.
Simpler nowcasting systems are based on radar echo
tracking and extrapolation to produce 0-2 hour usable
nowcasts over the Indian region. This is because; radar
data is very detailed and picks out the size, shape,
intensity, speed and direction of movement of individual
storm cells on a practically continuous basis. These cells
have limited lifetimes (often sub hourly) and non-uniform
rate of growth and speed of movement during their
lifetimes. The techniques for extrapolating precipitation
echoes may either be “area trackers” (Kessler, 1966) or
“cell trackers” (Barclay and Wilk, 1970). Cell trackers
identify individual storms and then obtain the motion of
each storm centroid. Cell trackers have been particularly
useful for tracking and warning for individual severe
storms. Three of the nowcasting systems mentioned in
Table 1, TITAN (Dixon and Wiener, 1993), CARDS (Joe
et al., 2003) and Storm Cell Identification and Tracking
(SCIT) system (part of the National Severe Storms
Laboratory Warning Decision Support System)
(Lakshmanan et al., 2007; Johnson et al., 1998) are
examples of cell trackers. One advantage of cell trackers
is that, since the identified cells have different forecast
directions and speeds, they can be allowed to converge
and intensify or diverge and dissipate independently. A
disadvantage in SCIT and all other cell trackers is, finding
cells that are consistently identified for one hour. This
disadvantage is a major problem over India, where cell
lifetimes in thunderstorms are most often sub-hourly (Sen
Roy et al., 2014). In this case, the cell may change
identification and the nearest identified cell may not result
in an accurate propagation estimation of what appears to
be a continuous storm.
When different nowcasting techniques using the
same data and the same space-time resolution were
compared, it was concluded that cross-correlation methods
on area trackers, gave better skill scores of forecast,
than the centroid tracking schemes (Elvander et al., 1976)
In the simplest area tracker techniques, the computer is
used to cross correlate 2-d radar reflectivity images
separated in time to find the motion (Lakshmanan
et al., 2007). WDSS-II (Warning Decision Support
System - Integrated Information) suite of algorithms was
used operationally for the Indian region (Sen Roy et al.,
2014). In this suite, the quality controlled reflectivity
data from multiple radars is time shifted to a common
SEN ROY et al. : NOWCASTING OF CONVECTIVE WEATHER OVER THE INDIAN REGION 471
TABLE 1
Some operational nowcast / short range forecast systems around the world and their main features
Model name
Country
applying it
operationally
Author Data inputs Forecast products
Update
frequency of
nowcasts
Method used for nowcasting/ short range forecasting
(1) (2) (3) (4) (5) (6) (7)
SCIT 1(Storm
Cell Identification and Tracking)
United
States
Johnson
et al., 1998
Radar volume
data
Characteristics of
detected cells, Hail
probability and probable direction of
movement
Cell Tracker
TITAN1
(Thunderstorm
Identification, Tracking, Analysis
and Nowcasting)
Australia,
USA
Dixon and
Wiener, 1993
Radar volume
data field
Detection and tracking of thunderstorm cells
in radar data through
time to generate size, location and velocity
estimates of the
thunderstorm
Every 10 min for periods
between 10
and 60 min
Cell Tracker
CARDS 1 (Canadian Radar Decision
System)
Environment
Canada
Joe et al.,
2003
Point forecasts,
hail, mesocyclone,
Microburst, Max reflectivity,
echo top, VIL,
lightning, rainfall accumulation
CAPPIs, gust
potential, SCIT tracks
- QPF
- Identification of hail,
tornado, mesocyclone, downburst, gust strength
0-1 hr
Cell tracker for extrapolation of
radar echoes + pattern
recognition (for velocity de-aliasing)
OPIC 1 (Convective
Objects for Nowcasting) and
SIGOONS
(SIGnificant weather Object
Oriented
Nowcasting System)
Meteo-France
& MeteoSwiss
Brovelli
et al., 2005
Composite
reflectivity data field
Cell detection,
characteristics and tracking
0-1 hr Cell tracker for extrapolation
of radar echoes
WDSS-II 1, 2, 3
(Warning Decision
Support
System-II
Generation)
Australia
Lakshm-
anan et al.,
2007
- Doppler multi radar, single or
composite
- mesoscale NWP
Products
- QPF
-Quality control - Identification of hail,
tornado, mesocyclone,
downburst, gust,
BWER
-Cell tracking
0-3 hr
Extrapolation of radar echoes by centroid tracking + pattern
recognition for velocity field +
area tracking + neural network +
NWP products
Multi-Radar Multi-
Sensor (MRMS)
NSSL
(USA)
Smith
et al., 2016
- Doppler multi
radar, single or composite
- Mesoscale NWP
Products + lightning data
- QPF -Quality control
- Identification of hail,
tornado, mesocyclone, downburst, gust, BWER
-Cell tracking, Area Tracking
0-3 hr WDSS-II + National Mosaic and
Multi-sensor QPE
SWIRLS2 (Severe Weather
In Rainstorm
of Localized Systems)
Hong Kong
Observatory, India
Li and Lai,
2004
Radar reflectivity
CAPPI product,
raingauge data, radiosonde data,
lightning data
Radar reflectivity, radar-
echo motion, QPE, QPF, track of thunderstorm and
its associated severe
weather, cloud -to ground lightning,
severe squalls
and hail, probability of precipitation
6 hours at
intervals
of 6 minutes updated every
10 minutes
Area Tracker, TREC (Tracking
of Radar Echoes by Correlation), GTrack (Group tracking of radar
echoes, an object-oriented
technique for tracking the movement of a storm as a whole
entity) and MOVA (Multi-scale
Optical flow by Variational Analysis)

472 MAUSAM, 70, 3 (July 2019)
TABLE 1 (Contd.)
(1) (2) (3) (4) (5) (6) (7)
RainCast / COTREC2
(Continuity of
Tracking Radar Echoes by
Correlation
vectors
Czech Republic
since 2003,
Switzerland
Novak, 2007,
Schmid et al.,
2000
PseudoCAPPI
2 km-elevation reflectivity with
1-km horizontal
resolution, Raingauge data
PseudoCAPPI 2 km -elevation reflectivity
with 1- km horizontal
resolution
90 min in
10-min time steps
Area Tracker, the echo motion field is determined by comparing
two consecutive radar images
using mean absolute difference as the similarity criterion. Motion
wind field is constant in time and
no growth/decay of radar echo
S-PROG3 (Spectral
Prognosis
nowcaster)
BAMS
( Australia), Also used in
STEPS
Seed, 2003
Rain field, in terms
of reflectivity Z [dBZ] or rain
intensity R [mm/h]
Rain field, in terms of
reflectivity Z [dBZ] or
rain intensity R [mm/h]
5 min,
30 min & 60 min forecast
of track
Spectral decomposition model
which uses scale dependent temporal evolution to formulate
forecasts
MAPLE3 (McGill
Algorithm for Precipitation
Nowcasting by
Lagrangian Extrapolation)
Korea
MeteorologicalAdministration
Canada,
U.S.A.
Germanna
nd Zawadzki,
2002,
2004
Radar derived
Reflectivity, precipitation rate,
precipitation
accumulation Quantitative
precipitation
estimation
Hourly Precipitation forecasts, probabilistic
QPF 9-12 hours
Variational echo-tracking with semi-Lagrangian advection of
radar reflectivity and correlation
of the forecast with the observation. Area tracking
method
MUSIC3 (Multiple-
Sensor Precipitation Measurements,
Integration,
Calibration and Flood forecasting)
European
Commission
Burton
et al., 2003
Radar, Meteosat
and raingauge observations
Rainfall estimation and
forecasting
6 hours ahead with a spatial
resolution of
about 2 km
Decompose a radar image into
features. These are tracked from one image to the next using an
object-orientated methodology.
The tracking uses lag-correlation to estimate velocity
STEPS3,4 (Short-
Term Ensemble Prediction
System)
UK Met Office,
Bowler
et al.,
2006
Radar-based rain
analyses and NWP model
forecasts
Probability of precipitation
at threshold rain
rates of 0.125, 0.25, 0.5 and 1 mm h-1
10-90 min at
1 km
resolution,
updated every
10 minutes
Decompose NWP and rainfall
field into a cascade Blend each
level in the radar & NWP cascades using weights that are a
function of scale and lead time
dependant forecast error Add noise component to the
deterministic blend Combine the
cascade levels to form a forecast
Severe Weather
Automatic Nowcast System (SWAN)
China Feng, 2012
Weather radars base data +
MYNOS+SWIFT
data
Reflectivity and
Quantitative precipitation forecast (QPF)
Greater than 1 hour
A regional 3D reflectivity mosaic is produced. COTREC
(continuous tracking radar echo
by correlation) vectors are derived from moving radar
reflectivity patterns through grid-
to-grid cross-correlation blended with mesoscale numerical
prediction model output for 2-3
hour nowcasts
NoCAWS China Tao Wei,
2011 Mobile Radar data + NWP model data
Reflectivity and
Quantitative precipitation forecast (QPF) +
Lightning
Greater than 1 hour
COTREC winds are used to nowcast cell motion
Shanghai Typhoon
Institute-WRF ADAS-3DVar
Rapid Refresh
system (STI-WARR)
China
Wang Haibin
et al.,
2016
NWP model data NWP model variables 12 hours
3 Km Resolution, 51 level
Data assimilation every hour, 12-hour prediction
GRAPES-SWIFT4 (Global/ Regional
Assimilation and Prediction System-
Severe Weather
Integrated Forecast Tool)
China
Liang et al.,
2010
Radar derived reflectivity field
and NWP model
output
Reflectivity, precipitation rate, precipitation
accumulation, Quantitative precipitation
estimation, Wind,
Initiation, growth decay, Hail, strong winds
0-3 hours
Extrapolation algorithm for short term, which is merged
with GRAPES NWP model
output for longer term forecast
SEN ROY et al. : NOWCASTING OF CONVECTIVE WEATHER OVER THE INDIAN REGION 473
TABLE 1 (Contd.)
(1) (2) (3) (4) (5) (6) (7)
ARMOR4
(Adjustment of Rain from Models with
Radar)
Operationally
run fo Cont. US by WDT
Technologies
DuFran
et al.,
2009
Precipitation
forecast from a
NWP model, series of radar mosaics
over the same
domain
Average precipitation rate
10 hour
forecast at
15 minute intervals at
5 km grid
spacing
Radar reflectivity mosaic is
converted to precipitation rates and accumulated to 15 minute
intervals. Intensity correction is
applied to the model forecast, using corresponding pixels in the
model and radar
Nimrod4 (Nowcasting and
Initialisation for
Modelling Using
Regional
observation Data
System)
UK
Met Office
Golding,
1998
Radar-based rain
analyses, satellite IR and visible
radiances and
NWP model forecasts
Precipitation field, probability of
occurrence of fog,
visibility.
0-6 hours at
10 minute
intervals,
updated every
20 minutes
Extrapolation algorithm for short term, which is merged with NWP
model output for longer term
forecast
VSRF4 (Very-Short-Range-Forecast of
precipitation)
Japan, Korea Sugiura,
2013
Radar-raingauge Analyzed
precipitation field
1 hour accumulated
precipitation 1 to 6 hours
1. Forecast of precipitation by
simple extrapolation method up
to 3-hour 2. Merging with numerical
prediction model (Meso-scale
Model (MSM)) for 6-hour forecast
HRPN (High-
resolution Precipitation High-
resolution Precipitation
Nowcasts) 4
Japan Kigawa,
2014
Radar-based rain analyses and NWP
model forecasts
250 m resolution
Precipitation 0-30 minutes
Extrapolation algorithm for short term, which is merged with NWP
model output for longer term forecast
CINESat5
Central Austrian met.
Institute
(ZAMG) and the German
met. office
(DWD)
Scheiber,
1998
Image pixel data of a satellite
image, vertical
temperature profiles
Atmospheric Motion Fields, Predicted Satellite
Images, Predicted
Trajectories, Cloud Contour Prediction, Cloud
Development Maps,
Convective Cells
1, 2 and
3 hr forecasts
Forecasts are based on motion fields that describe the movement
of clouds from one image to the
next one
ADSTAT 6
(Advective-
Statistical system)
National
Weather Service,
(USA)
Kitzmiller
et al.,
1999
Precipitation field,
Radar reflectivity,
lightning, gauge measurements and
Meteosat Second
Generation (MSG) satellite data and
Eta model
forecasts
Probabilities of rainfall exceeding 2.5,12.5, 25
and 50 mm) at any one
location within a grid box and forecast of maximum
rainfall amount within the
grid box for given precipitation intervals
Precipitation
forecasts for
the subsequent 3 hr period,
updated at
30 minute intervals, at
40 km grid
boxes
Predictive algorithm is based on a advective statistical approach
NOW6 Czech
Republic
Sokol and
Pesice,
2009
Precipitation field,
Radar Products,
lightning, gauge measurements,
Meteosat Second
Generation (MSG) satellite and NWP
model
Probabilities of reaching or exceeding thresholds
for mean 3-hourly
precipitation
Precipitation forecasts
for the
subsequent 3 hr period in
9 km by
9 km boxes
Employs logistic regression to
describe relationships between
predictands and predictors. Similar technique to that of the
ADSTAT model
Trident 7 NCAR (USA),
Taiwan
Mueller et al.,
2003
- Doppler radar
- NWP winds
- Human-machine Interface
Forecast thunderstorm initiation/dissipation and
location, Reflectivity,
precipitation rate, precipitation
accumulation, Wind
0-1 hr
Semi-automated expert system: identify collision of convergence
zones withradar echoes for the
possibility of growth and decay using fuzzy logic and
model outputs. Low level
winds derived by VDRAS
(Variational Doppler Radar
Analysis System)

474 MAUSAM, 70, 3 (July 2019)
TABLE 1 (Contd.)
(1) (2) (3) (4) (5) (6) (7)
TIFS 8
(Thunderstorm
Identification and Forecasting
System)
BAMS
(Australia), China
Bally,
2004
Automated
thunderstorm cell
detections and tracks from
TITAN and WDSS
Graphical and text products from the data
after being edited by
forecasters
Every volume
scan of radar
Post-processing software.
Interactively producing severe weather warnings and other
forecasts from thunderstorm
tracks, automatically diagnosed from radar data
THESPA8
(Thunderstorm Environment
Strike Probability
Algorithm)
BAMS
(Australia)
Dance et al.,
2010
Automated
thunderstorm cell detections and
tracks from
TITAN
Probabilistic thunderstorm
location nowcasts
Every volume
scan of radar
Post-processing software.
Calculates the probability of a TITAN cell passing over a
point in the next 60 minutes
based on the current velocity
and cell size and a
climatological TITAN
tracking error
COSMO 9
COSMO
member
countries
Doms &
Schattler,
2002
NWP Model
output for
boundary conditions. Radar
reflectivity and
satellite data
Numerical model outputs
- Hourly
between 0.0 to
12.0. - Half hourly
between 12.0
to 24.0 - Two Hourly
between 24.0
to 48.0
Non-hydrostatic limited area
atmospheric prediction model for
short range weather forecasts
ALADIN 9 (Aire
Limitée Adaptation Dynamique
développement
International)
Czech Republic,
Algeria
ALADIN,
2004
Numerical model for short range
weather forecasts
Numerical model
outputs
Forecasts are
generated with 1 h time
step up to
54 h
Mesoscale hydrostatic limited area model for short range
weather forecasts
ARPS9 (Advanced Regional Prediction
System)
USA,
India
Xue et al.,
2000
Radar data, NWP
model for
boundary conditions
Numerical
model outputs
20 minute intervals for
upto 21 hours
Non-hydrostatic forecast model for short range weather
forecasts
University of
Wisconsin Convective
Initiation (UWCI)
nowcasting algorithm5
USA
Sieglaff,
et al., 2011
Geostationary
Satellite Imager data
Convective initiation 1 hour Extrapolation
1: Extrapolation forecast based on Cell Tracking; 2: Extrapolation forecast based on Area Tracking; 3: Spectral decomposition or image
segmentation followed by extrapolation at different scales; 4: Extrapolation algorithm for short term, Blended with NWP model output for longer term forecast; 5: Forecasts based on satellite data; 6: Prediction based on an advective-statistical approach; 7. Explicit Storm Model;
8. Post Processing Software; 9. Short range NWP model
moment in time using the WDSS-II tool “w2merger” and
mapped into a 3D Cartesian field (Lakshmanan
et al., 2007). A neural network based fuzzy algorithm then
forecasts the future locations and intensity of the area of
convection, with usable forecast lead times upto three
hours for the Indian region. Fig. 5 displays sample
60 minute nowcast reflectivity output from WDSS-II
software for the Indian region using the data from the
Indian Doppler radars.
SWIRLS (Short-range Warning of Intense
Rainstorms in Localized Systems) software (Li and Lai,
2004), is an area-tracking software, developed by the Hong
Kong Meteorological Office that is currently operational
for the Indian region. It forecasts the future position of
radar echoes through linear extrapolation of the radar
reflectivity CAPPI field. It uses MOVA (Multi-scale
Optical flow by Variational Analysis) which is a gridded
echo-motion field that is derived from consecutive radar
reflectivity fields by solving an optical-flow equation with
a smoothness constraint. To capture multi-scale echo
motions, the optical-flow equation is solved iteratively for
a cascade of grids from coarse to fine resolutions (about
512 to 3 km). Fig. 6 displays sample 60 minute nowcast
reflectivity output from SWIRLS software for the Indian
region using the data from the Indian Doppler radars.

SEN ROY et al. : NOWCASTING OF CONVECTIVE WEATHER OVER THE INDIAN REGION 475
Fig. 5. Sample 60 minute nowcast reflectivity output from WDSS-II software and the corresponding reflectivity observation for the Indian
region using the data from the Indian Doppler radars
Fig. 6. Sample 60 minute nowcast reflectivity output from SWIRLS software and the corresponding reflectivity observation for the Indian
region using the data from the Indian Doppler radars
To increase the accuracy, many nowcasting
softwares use spectral and spatial filters to decompose
precipitation patterns according to scales. WDSS-II
utilizes a K-Means approach described by Lakshmanan
et al. (2003). This allows identification of storms at
different scales, estimate the motion vectors at these
various scales and produce a forecast using this
information. S-PROG is another spectral decomposition
model which uses scale dependent temporal evolution to
formulate forecasts (Seed, 2003). The usefulness of such a
decomposition model is that it allows for a degree of
implicit uncertainty in the final rainfall nowcast. To
extend the forecast period and longer term accuracy, many
softwares blend in NWP model output to nowcast model

476 MAUSAM, 70, 3 (July 2019)
output. For example, SWIRLS blends in the precipitation
output from the nowcast algorithm, with the precipitation
forecast from the NWP model (Joe et al., 2012).
In addition to Doppler radar based nowcast
techniques, satellite based techniques are increasingly
being developed as the resolution and quality of the data
in geostationary satellite radiometers is improving. A
satellite based nowcasting technique implemented in IMD
is a customized version of Forecast and Tracking the
Evolution of Cloud Clusters (ForTraCC), which uses
extrapolation technique that allows for the tracking of
Mesoscale convective systems (MCS) radiative and
morphological properties and forecasts the evolution of
these properties (based on cloud-top brightness
temperature and area of the cloud cluster) up to
360 minutes, using infrared satellite channel (10.8 μm)
data (Goyal et al., 2016). In addition to continuous, long
period data from satellites, uniform coverage over a large
area permits generation and availability of nowcast
products simply and quickly to users in the National
Meteorological Services of smaller or developing nations,
where expertise and facilities for processing and utilizing
satellite data may be limited or non-existent. With this
objective, WMO has implemented a Sustained,
Coordinated Processing of Environmental Satellite Data
for Nowcasting (SCOPE-Nowcasting) pilot project to use
the data from different satellites with a variety of
capabilities from different global centres, that can be
combined to give high quality basic products as well as
nowcast aids to operational forecasters (Bates and
Schuller, 2009).
A problem with all the above nowcast systems,
based on reflectivity or brightness fields of the past, is
their inability to predict any storm initiation. Expert
systems is a generic name for nowcasting systems that
combine one of the above mentioned techniques with
other data, conceptual models and/or explicit solutions of
numerical equations. The main goal of these additions on
top of the techniques presented above, is the ability to
predict storm initiation or decay. The AutoNowCaster
software (ANC) (Mueller et al., 2003) for example,
produces nowcasts of convective likelihood (CL), with
higher values delineating areas where storms are likely to
form and be sustained and vice versa.
Explicit numerical forecast models that are
initialized with radar and/or satellite data form a new
category of nowcast systems. Due to the “spin-up”
problems of NWP models (Daley, 1991), till late, these
have been used only has supporting data for more
heuristic techniques. This is because of a lack of suitable
data assimilation scheme to input remote sensing
observations and the lack of full understanding of the
complex nature of convective processes. Of late, with the
improvement and increased availability of computing
resources that permit finer resolution model runs, as well
as methodologies for faster data assimilation such as
Rapid Update Cycle (RUC), newer models are being
developed, for the explicit purpose of short-range weather
forecasting. These models, such as WRF (Schwitalla and
Wulfmeyer, 2018) and ARPS (Xue et al., 2000; Pan and
Wang, 2019), each with a rapid update cycle algorithm for
frequent assimilation of data built into it, have
demonstrated significant improvement in the short range
to nowcast scale of forecasting. Studies with ARPS over
the Indian region demonstrate that the model with DWR
data assimilation captures the convective precipitation in
the right location very well (Srivastava et al., 2010).
5. Verification of automated nowcasting over the
Indian region
Since the nowcast products generated automatically
are a public service utility, validation of the software
output for the target regions is an essential requirement
before putting the products on a public portal for use. In
this connection, two major Forecast Demonstration
Projects (FDP) were held during the Sydney Olympics
(Wilson et al., 2004) and the Beijing Olympics (Wilson
et al., 2010) for summer convective weather nowcast
systems. A major finding of the FDP during Sydney
Olympics was that extrapolation techniques that allowed
for differential motion performed slightly better than other
softwares, since high-impact storms often have motions
different than surrounding storms (Wilson et al., 2004). A
more comprehensive FDP for summer convective weather
during the Beijing Olympics revealed the following:
(a) The skill levels of the numerical techniques were
inconsistent without assimilation of real-time radar
reflectivity and Doppler velocity fields.
(b) Automated blending techniques tended to be no
more skillful than extrapolation since they depended
heavily on the models to provide storm initiation, growth
and dissipation.
(c) Human-machine blended forecasts provided the best
outputs (Wilson et al., 2010).
Over the Indian region too, WDSS-II software area
extrapolation based nowcasts over Delhi have been
rigorously validated (Sen Roy et al., 2014). The nowcasts
have been analyzed for weather systems representing three
typical types of cloud systems over the region. Results
indicate that the low intensity convective line zones,
which are characteristic of winter and early pre-monsoon
weather systems (December to March), show the most
SEN ROY et al. : NOWCASTING OF CONVECTIVE WEATHER OVER THE INDIAN REGION 477
rapid temporal change in the overall area under
convection leading to large area errors. On the other hand,
pre-monsoon systems (March to June), comprise mostly
of isolated cells that reach great heights, move very fast
but do not have much a real growth. The error in the
nowcasting of these systems is mostly in respect of
location error, as well as error in forecast of the intensity
of the cells. The overall error in nowcasting is least for the
monsoon systems (July to September) over the Delhi
region, when the weather systems are longer lived and
slow moving.
Over the Indian region, the ForTraCC software
implemented using INSAT 3D satellite data could
predict the minimum cloud top brightness temperature of
the convective cells reasonably well, with Average
Absolute Error (AAE) of <7 K for different lead
periods (30-180 min). However, there is underestimation
of the intensity for all lead periods of forecasts.
There is over estimation in prediction of size for 30
and 60 min forecasts (17% and 2.6% above the
actual size of the cluster, respectively) and
underestimation in 90 to 180 min forecasts (–2.4%
to –28% below the actual size). The direct position error
(DPE) based on the location of minimum CTBT ranges
from 70 to 144 km for 30-180 min forecast respectively
(Goyal et al., 2017).
The SWIRLS software, as implemented for the
Indian region has also been validated (Srivastava et al.,
2012). Results indicate that QPF and Reflectivity forecast
based on MOVA technique in SWIRLS is capable of
tracking both the large and small scale storm motion
reasonably well.
6. Nowcasting efforts in the Indian context
The human-machine mix to provide nowcasts is
particularly essential for a country such as India, with
diverse characteristics of weather, spatially as well as
seasonally. However, Nowcasting is not a new field of
forecasting within India. Forecasters in the aviation sector,
as represented by the Indian Air Force and the Airport
Meteorological Offices issue hourly METAR bulletins for
the concerned airport and sub-hourly SPECI bulletins, if
there is a requirement for change. These bulletins have a
Trend Type Forecast (TTF) appended to it, which is a
professionally considered forecast for weather over the
following two-hour period and is based on an actual
weather report. Since 2013, the major change that has
come about is that the nowcasts are no longer confined to
only the airports but entire India.
The India Meteorological Department under the then
India Department of Science and Technology started the
nationally coordinated Severe Thunderstorm Observation
and Regional Modeling (STORM) program in 2005,
which was focused for thunderstorm prediction during the
season with the most severe thunderstorms - March to
June of every year (Das et al., 2014). Since 2009, it
became a multi-country endeavor, focused on the
understanding of the mechanism of the summer Nor-
westers over eastern India, Bangladesh and Nepal-
SAARC-STORM project. From 2017, it has evolved into
a project for predicting thunderstorms only over the Indian
region and is known as FDP-STORM. Most
improvements in thunderstorm forecasting, observations,
products and dissemination are sought to be implemented
at the beginning of each FDP-STORM period.
The Commonwealth Games of 2010, first brought
forth the need for nowcasting of weather for location
specific nowcasts over the Indian region. Three hourly
location specific nowcasting of thunderstorms, squall
and hail storm was initially started for 120 cities across
India by Meteorological Centres of IMD in 2013 (Ray
et al., 2015). The initial framework of nowcasting,
as well as verification of results for the period of
March to September of 2013, is discussed in detail
in the above study. Since March 2017, a new system
of nowcasting has been put in place by IMD to
meet the growing requirements of users and various
special interest user groups. In this scheme, two
main changes have been brought about from the
previous methodology.
(a) The number of stations for which nowcasts for
moderate and severe thunderstorms are issued have
increased from 120 to about 433 currently. This includes
district headquarters and important cities all over the
country, under the coverage of the Doppler weather radar
network. This is an ongoing process and increasing in
number with the addition of new Doppler radars over the
country.
(b) Twice daily “Severe Weather Guidance Bulletin” is
being issued from the National Weather Forecast
Centre (NWFC) about potential area for occurrence of
severe weather; and communicated to all Meteorological
Centres all over the country for daily watch and
warning. The parameters for which Guidance are
issued are:
(i) Areas with a high probability of thunderstorm
occurrence and accompanying weather in the form of
gusty or squally wind, lightning or hailstorm.
(ii) Rainfall occurrence in the category of 0 to 25 mm,
25 to 50 mm, 50 to 100 mm, 100 to 200 mm
and >200 mm.

478 MAUSAM, 70, 3 (July 2019)
The methodology for generation of the severe
weather Guidance from NWFC is as follows:
Step 1: Analysis of weather during past 24 hours
(Rainfall, Relative Humidity, Temperature, Wind, Severe
Weather phenomenon like Thunderstorm, Hailstorm,
Squall, Snowfall, Heat wave, Cold Wave etc.).
Step 2: Analysis of current weather observation
(Synop observation, Satellite observation, Radar etc.) to
evaluate:
Location, intensity and direction of movement of
Synoptic Systems through analysis of the dynamic and
thermodynamic characteristics of the Indian region.
Satellite Characteristics over the Indian region.
Step 3: Identification of weather systems in text
and graphics (Area of location, Current intensity, past
evolution in terms of intensification and movement).
Prepare summary of synoptic, dynamic and
thermodynamic characteristics in the form of checklist.
Step 4: Evaluation of model guidance.
Evaluate each model by comparing their initial
condition and performance of their forecast during past
24 hours (by assessing skill and bias) especially with
respect to synoptic scale system and severe weather.
Examine forecast of each model for next 24 hrs for
different severe weather phenomenon.
Step 5: Development of consensus forecast.
Give more weightage to the best model based on
Step 4.
Remove outliers (Models).
Develop consensus on weather system based on
various model guidance on Synoptic, Dynamic and
Thermodynamic Characteristics.
Develop consensus on the predicted severe weather
by different models.
Add Subjective consensus to the Objective
consensus developed above by Step 3 and Step 4.
Subjective consensus will be based on the video
conferencing, experience, knowledge and expertise of the
forecaster in interpretation of Synoptic, Dynamic,
Thermo-Dynamic and model guidance.
Prepare final consensus Severe Weather Guidance
for next 24 hours in both text cum graphic format.
Step 6: Write prognosis and Diagnosis (Text Form)
during Storm season.
Step 7: Disseminate Severe Weather Guidance
bulletin to all MC/RMC/AMO by E-mail.
Step 8: Follow up action.
Real time round the clock monitoring of occurrence
of weather and weather system on hourly basis (both
instant and cumulative effect).
As and when situation arises, trigger the concerned
MC/RMC to update and issue Nowcast warnings.
Since March 2018, a new nowcast service-district
level nowcast warnings for severe weather in the form of
the “Nowcast Warning Bulletin” is being issued as
required, by all Meteorological Offices through
SMS/whatsapp/Phone/E-mail. These warnings are more
nuanced and include information for rainfall,
thunderstorm and associated hazards, associated wind
speed and any other phenomenon that is likely to affect
the public. The message is being disseminated to District
Collectors, National and State Disaster Management
Agency, Power sector, Media including All India Radio
and Doordarshan for wide public disseminaton and
relief action. The format of the message is included as
Appendix 1.
The step-wise procedure for issuing the nowcast
warnings by the meteorological centres, on the basis of the
Severe Weather Guidance from NWFC is given in
Appendix 2. Additionally, in 2017, in addition to the
nowcast warnings page, for the first time, a separate
Nowcast web page (http://srf.tropmet.res.in/srf/ts_
prediction_system/index.php) was created where, in
addition to nowcast warnings, various tools for the aid of
nowcasting created by the Indian Institute of Tropical
Meteorology, National Centre for Medium Range Weather
Forecasting, India Meteorological Department and other
centres of the Ministry of Earth Sciences are made
available to forecasters on a common platform.
7. Verification of operational nowcasts
The new methodology, coupled with the improved
forecast aids have resulted in substantial improvement in
operational forecasting of thunderstorms for the Indian
region. Figs. 7 (a&b) displays the verification statistics
for (a) the daily Severe Weather guidance for
thunderstorm occurrence issued by the nowcast unit of

SEN ROY et al. : NOWCASTING OF CONVECTIVE WEATHER OVER THE INDIAN REGION 479
Fig. 7(a). Verification statistics for the daily 24 hour severe weather
guidance for thunderstorm occurrence issued by the
nowcast unit of NWFC at IMD HQ during the FDP STORM period over three years 2016, 2017 and 2018
Fig. 7(b). Verification statistics for the three hourly nowcast guidance
issued by various Meteorological Centres and its performance during the FDP STORM period over six years
2013 to 2018 respectively
NWFC at IMD HQ during the FDP STORM period over
three years 2016, 2017 and 2018 and (b) the three hourly
nowcast guidance issued by various Meteorological
Centres and its performance during the FDP STORM
period over six years 2013 to 2018 respectively. For the
daily guidance, the occurrence/non-occurrence is
calculated on subdivision scale. The verification of the
three hourly nowcast warnings are calculated at a higher
resolution for each station for the occurrence/non-
occurrence of a thunderstorm event for which nowcast is
generated. Since operational thunderstorm forecastsare
dichotomous - (0 or 1 indicating nonoccurrence-
occurrence), their verification is carried out using a
standard 2 × 2 contingency table for categorical variables
(Gotway et al., 2018). Five scores, namely, (i) Ratio
Score (ii) Probability of detection - POD (iii) Equitable
Threat Score - ETS (iv) Critical Success Index - CSI
(v) False Alarm Ratio - FAR are calculated. For a good
forecast, the first four variables should be close to or equal
to 1, while the FAR should be close to 0. The statistics
that reveal that the accuracy of nowcasting has shown
marked improvement in the last two years 2017 & 2018 on
account of the recent modifications in the nowcast
procedure.
8. Outlook and challenges for the future
IMD is in the process of augmenting its network of
surface and upper air observatories as well as its radar
network. In addition to the current network of 25 Doppler
Weather Radars, there are plans to install 22 new Doppler
Radars by 2024. This will be supplemented by the Air
Force Doppler Weather Radar network. From the present
network of 62 Pilot Balloon stations and 43 GPS sonde
stations, there is a proposal to increase the number to 100
Pilot Balloon stations & 120 GPS sonde stations by 2024.
The format of the warnings must be standardized to
global standards. The communication network and the
mode of dissemination of the warnings play a major role
in increasing the efficiency and effectiveness of the
weather forecasts. Currently, the warning messages are
being disseminated through whatsapp, sms and e-mail.
However, this still has limited coverage. GAGAN (GPS
Aided Geo Augmented Navigation) Message Service
(GAMES) is currently being put in place by the Airport
Authority of India to provide a warning message
broadcast facility for timely delivery of warnings to a
large number of users over a wide spatial coverage. The
Common Alerting Protocal (CAP) is an international
standard format for emergency alerting and public
warning designed for “all-hazards”. The NDMA is
coordinating with IMD, DoT and other stakeholders to
implement CAP in the country through the “Integrated
Disaster Messaging Service”. This will permit deeper
penetration of the nowcast warnings to other sectors such
as Roadways, Railways and Power sector. The farming
community is currently a major risk prone sector for
severe weather associated with thunderstorms. Each year,
many thousand hectares of standing crops are destroyed
due to hail storms and squally or gusty winds. A major
cause of weather related deaths in the rural farming
community of India is in association with lightning due to
thunderstorms (Fig. 1). Currently efforts are being made
to penetrate this sector through the Gramin Krishi
Mausam Seva Kendras (GKMS). The warnings page of
the Nowcast portal is linked to the GKMS site and severe
thunderstorm warnings are disseminated through SMS to
registered farmers. However, awareness of the events and
remedial measures for affected people is still very low.
The huge human cost of lightning related deaths in
recent years, has brought about action from many affected
state governments. For the region of Maharashtra, Indian
Institute of Tropical Meteorology, Pune, using the
Lightning Location Network mentioned earlier, has
developed a Mobile App, DAMINI LIGHTNING. This
App gives exact location of current lightning strikes,
probable locations of impending lightning around an area
of 40 sq. km and direction of movement of thunderstorm.

480 MAUSAM, 70, 3 (July 2019)
DAMINI also lists precautionary steps to be taken during
lightning and some general information on lightning. A
Lightning Early Warning System (LEWS) has also
recently been operationalized in Karnataka. The
Government of Andhra Pradesh has set up a Lightning
Monitoring Mechanism in the State Emergency Operation
Centre (SEOC) in coordination with Earth Networks.
Other state governments such as those of Bihar and
Odisha are also setting up similar networks and also
investing in outreach programs to educate the general
public about the damages and associated preventive
actions to take during the occurrence of thunderstorms. In
this connection, the National Disaster Management
Authority is taking a lead role in informing and educating
the public about preventive action to be taken for severe
weather in association with thunderstorms. A draft
“Guidelines for Thunderstorm & Lightning/ Squall/
Dust/hailstorm and Strong wind” (https://ndma.gov.in/
images/pdf/Draft-Guidelines-thunderstorm.pdf) has been
brought out by the agency in 2018, detailing the respective
roles of different government agencies for action to be
taken on the basis of the nowcasts issued by IMD.
A major lacuna in thunderstorm forecasting, despite
the improvement of the forecast capabilities in the recent
years, is the absence of proper understanding of the spatial
variation of the intensity and type of thunderstorms in an
atmosphere primed for convection and their impact. The
correct thumb rules with regards to dynamic and
thermodynamic conditions for occurrence of severe
thunderstorms, have to be developed for sub-regions of
the Indian subcontinent, to improve the quality of the
nowcasts.
Measuring such events in entirety is also a major
challenge in view of the mesoscale nature of these weather
systems. Under the SAARC STORM program, a multi-
country mesonet comprising of surface and upper air
instruments was set up to study thunderstorm
characteristics over one of the most frequently
thunderstorm prone areas of the world, namely Eastern
India and Bangladesh (Das et al., 2014). A similar meso-
network over Maharashtra is in the process of being set
up, comprising 100 AWS and 3 X-Band radars.
The numerical weather modeling community of
India is also contributing in a big way to develop new
algorithms and customized products for improvement in
thunderstorm forecasting. A new set of products have
been introduced by the Indian Institute of Tropical
Meteorology at Pune and National Centre for Medium
Range Weather Forecasting at NOIDA, for forecast of
lightning, wind gusts, as well as other weather phenomena
associated with severe thunderstorms in the short range
scale. These products have been introduced on
experimental basis during 2019, and have already proven
to be very useful for the forecast of thunderstorms. These
products are also displayed in the Thunderstorm Nowcast
web page.
Nowcasting is a developing field of services and it is
hoped that with accurate forecasts and suitable mitigation
measures will contribute to the well being of the general
public. Hence a lot more research is necessary in the
impact assessment of the thunderstorms to better prepare
the public about the effect of the thunderstorms.
Acknowledgements
The authors are grateful to the Director General of
Meteorology, India Meteorological Department, for
constant encouragement during the course of this study.
We are grateful to a large number of IMD officers, namely
Dr. D. Pradhan, Shri S. B. Thampi, Shri Y. K. Reddy,
Shri Sai Krishnan and the Radar Division for radar data,
Satellite Meteorology Division, ISSD Division and DWR
Station In-charges, Meteorological Centre Incharges for
ensuring non-stop data and product flow in real time from
the radar stations and IMD observatories to the data server
at the headquarters as well as and Meteorological Centre
In-charges for operationally issuing nowcasts round the
clock. We are also thankful to Dr. S. D. Pawar, IITM for
providing details of the IITM Lightning network and
scientists at NCMRWF and IITM for access to their new
products. We thankfully acknowledge the National Severe
Storm Laboratory, USA for the use of Nowcasting
application software WDSS-II, the University of
Oklahoma for using the ARPS model and the Hong Kong
Observatory (HKO) for the use of SWIRLS.
The contents and views expressed in this research
paper are the views of the authors and do not necessarily
reflect the views of their organizations.
References
ALADIN, 2004, “13th ALADIN Workshop on ALADIN Applications in
Very High Resolution”, CHMI, Prague80-86690-13-X.
Bally, J., 2004, “The Thunderstorm Interactive Forecast System: Turning automated thunderstorm tracks into severe weather warnings”,
Wea. Forecasting, 19, 64-72.
Barclay, P. A. and Wilk, K. E., 1970, “Severe thunderstorm radar echo motion and related weather events hazardous to aviation
operations”, ESSA Tech. Memo., ERLTM-NSSL46, 63.
[Available from National Information Service, Operations Division, Springfield, VA 22161].
Bates, J. J. and Schuller, L., 2009, “Sustained, Coordinated Processing of
Environmental Satellite Data for Climate Monitoring (SCOPE-CM)”, Dec 2009, In AGU Fall Meeting Abstracts.
Bowler, N., Pierce, C. and Seed, A., 2006, “STEPS: A probabilistic
precipitation forecasting scheme which merges an extrapolation nowcast with downscaled NWP”, Quart. J. Roy. Meteor. Soc.,
132, 2127-2155.

SEN ROY et al. : NOWCASTING OF CONVECTIVE WEATHER OVER THE INDIAN REGION 481
Brovelli, P., Sénési, S., Arbogast, E., Cau, Ph., Cazabat, S., Bouzom, M. and J. Reynaud, 2005, “Nowcasting thunderstorms with
SIGOONS, a significant weather object oriented nowcasting system.” Proceedings of the International Symposium on
Nowcasting and Very Short Range Forecasting (WSN05),
Toulouse, France, 2005.
Browning, K., 1982, “Nowcasting (No. 551.6362 NOW)”, Academic
Press, 256.
Carey, L. D., Petersen, W. A. and Rutledge, S. A., 2003, “Evolution of
Cloud-to-Ground Lightning and Storm Structure in the Spencer, South Dakota, Tornadic Supercell of 30 May, 1998”, Mon. Wea.
Rev., 131, 8, 1811-1131.
Chaudhuri, S., 2008, “Preferred type of cloud in the genesis of severe
thunderstorms - A soft computing approach”, Atmos. Res., 88,
2, 149-156.
Daley, R., 1991, “Atmospheric Data Analysis”, Cambridge University
Press, p457.
Dance, S., Ebert, E. and Scurrah, D., 2010, “Thunderstorm Strike Probability Nowcasting”, Journal of Atmospheric and Oceanic
Technology, 27, 1, p79
Das, S., Mohanty, U. C., Tyagi, A., Sikka, D. R., Joseph, P. V., Rathore, L. S., Habib, A., Baidya, S. K., Sonam, K. and Sarkar, A., 2014,
“The SAARC STORM: A coordinated field experiment on
severe thunderstorm observations and regional modeling over the South Asian Region”, Bulletin of the American
Meteorological Society, 95, 4, 603-617.
Deb, S. K., Kishtawal, C. M., Kumar, P., Kumar, A. K., Pal, P. K.,
Kaushik, N. and Sangar, G., 2016, “Atmospheric Motion
Vectors from INSAT-3D: Initial quality assessment and its impact on track forecast of cyclonic storm
NANAUK”, Atmospheric Research, 169, 1-16.
Dixon, M. and Wiener, G., 1993, “TITAN: Thunderstorm identification, tracking, analysis and nowcasting-A radar-based methodology”,
J. Atmos. Oceanic Technol., 10, 785-797.
Doms, G. and Schattler, U., 2002, “A Description of the Nonhydrostatic Regional Model LM”, DeutscherWetterdienst (DWD).
DuFran, Z., Carpenter Jr., R. and Shaw, B., 2009, “Improved
precipitation nowcasting algorithm using a high-resolution NWP model and national radar mosaic”, In 34th Conference on
Radar Meteorology.
Elvander, R. C., 1976, “An evaluation of the relative performances of three weather radar echo forecasting techniques”, Preprints
17th Radar Meterology Conf., Seattle, Am. Meterol. Soc.,
526-532.
Feng, Y., 2012, “SWAN: A Severe Weather Nowcasting System”, The
92nd American Meteorological Society Annual Meeting, 22-26.
Germann, U. and Zawadzki, I., 2002, “Scale dependence of the predictability of precipitation from continental radar images,
Part I: Description of the methodology”, Mon. Wea. Rev., 130,
2859-2873.
Germann, U. and Zawadzki, I., 2004, “Scale-dependence of the
predictability of precipitation from continental radar images,
Part II: Probability forecasts”, J. Appl. Meteor., 43, 74-89.
Gettelman, A., Salby, M. L. and Sassi, F., 2002, “Distribution
and influence of convection in the tropical tropopause region”,
Journal of Geophysical Research: atmospheres, 107, D10, ACL 6-1-ACL 6-12. doi:10.1029/2001JD001048.
Golding, B., 1998, “Nimrod: A system for generating automated very short range forecasts”, Meteor. Appl., 5, 1-16.
Gotway, J. H., Newman, K., Jensen, T., Brown, B., Bullock, R. and
Fowler, T., 2018, “Model Evaluation Tools Version 8.0
(METv8. 0) User's Guide”.
Goyal, S., Kumar, A., Mohapatra, M., Rathore, L. S., Dube, S. K.,
Saxena, R. and Giri, R. K., 2017, “Satellite-based technique for
nowcasting of thunderstorms over Indian region”, Journal of Earth System Science, 126, 6, 1-13
Goyal, S., Kumar, A., Sangar, G. and Mohapatra, M., 2016, “Severe
thunderstorm activity over Bihar on 21st April, 2015 “A
simulation study by satellite based Nowcasting technique”, In Remote Sensing of the Atmosphere, Clouds and Precipitation
VI, 9876, 987612, International Society for Optics and
Photonics.
Haque, U., Hashizume, M., Kolivras, K. N., Overgaard, H. J., Das, B.
and Yamamoto, T., 2012, “Reduced death rates from cyclones
in Bangladesh: what more needs to be done?”, Bulletin of the World Health Organization, 90, 150-156.
Houze, R. A., Wilton, D. C. and Smull, B. F., 2007, “Monsoon
convection in the Himalayan region as seen by the TRMM
precipitation radar”, Quart. J. Royal Met. Soc., 133, 1389-1411
Joe, P., Dance, S., Lakshmanan, V., Heizenreder, D., James, P., Lang, P.,
Hengstebeck, T., Feng, Y., Li, P. W., Yeung, H. Y. and Suzuki,
O., 2012, “Automated processing of Doppler radar data for severe weather warnings”, In Doppler Radar Observations-
Weather Radar, Wind Profiler, Ionospheric Radar and Other
Advanced Applications. InTech Open Publishers.
Joe, P., Falla, M., Rijn, P. V., Stamadianos, L., Falla, T., Magosse, D.,
Ing, L. and Dobson, J., 2003, “Radar data processing for severe
weather in the national radar project of Canada”, Preprints, 21st Conf. on Severe Local Storms, San Antonio, TX, Amer. Meteor.
Soc., P4.13. [Available online at http://ams.confex.com/
ams/pdfpapers/47421.pdf].
Johnson, J. T., MacKeen, P. L., Witt, A., Mitchell, E. D., Stumpf, G. J.,
Eilts, M. D. and Thomas, K. W., 1998, “The storm cell
identification and tracking algorithm: an enhanced WSR-88D
algorithm”, Wea. Forecasting, 13, 263-276.
Katti, V. R., Pratap, V. R., Dave, R. K. and Mankad, K. N., 2006,
“INSAT-3D: An advanced meteorological mission over Indian
Ocean”, GEOSS and Next-Generation Sensors and Missions, Vol. 6407, p640709. International Society for Optics and
Photonics.
Kessler, E., 1966, “Computer program for calculating average lengths of
weather radar echoes and pattern bandedness”, J. Atmos. Sci., 23, 569-574.
Kigawa, S., 2014, “Techniques of precipitation analysis and prediction
for high-resolution precipitation nowcasts”, Weather Serv. Bull, 81, p22.
Kitzmiller, D. H., Lilly, M. A. R. and Vibert, S. D., 1999,”Probabilistic
0-3 hour rainfall forecasts from an extrapolative-statistical
technique utilizing radar, satellite and lightning observations”,
Preprints 29th Conference on Radar Meteorology, Amer. Meteor.
Soc., Boston, 876-879.

482 MAUSAM, 70, 3 (July 2019)
Kotal, S. D., Bhattacharya, S. K. and Roy Bhowmik, S. K., 2014, “Development of NWP based objective Cyclone Prediction
System (CPS) for North Indian Ocean Tropical Cyclones – Evaluation of performance”, Tropical Cyclone Research and
Review, 3, 3, 162-177.
Krishnamoorthy, C., Kumar, D. and Balaji, C., 2016, “Retrieval of humidity and temperature profiles over the oceans from INSAT 3D satellite radiances”, Journal of Earth System Science, 125, 2,
217-230.
Lakshmanan, V., Rabin, R. and DeBrunner, V., 2003, “Multiscale storm identification and forecast”, Atmos. Research, 67, 8, 367-380.
Lakshmanan, V., Smith, T., Stumpf, G. and Hondl, K. D., 2007, “The
Warning Decision Support System Integrated Information”, Wea. Forecasting, 22, 596-612.
Li, P. W. and Lai, E. S. T., 2004, “Short-range Quantitative Precipitation Forecasting in Hong Kong”, Journal of Hydrology, 288,
189-209.
Liang, Q., Feng, Y., Deng, W., Hu, S., Huang, Y., Zeng, Q. and Chen, Z., 2010, “A composite approach of radar echo extrapolation based on TREC vectors in combination with model predicted
winds”, Adv. Atmos. Sci., 27, 1119-1130.
Liu, C. and Heckman, S., 2012, “Total lightning data and real-time severe storm prediction”, TECO-2012,WMO Tech. Conf. on
Meteorological and Environmental Instruments and Methods of Observation.
Mohanty, U. C., Osuri, K. K., Tallapragada, V., Marks, F. D., Pattanayak, S., Mohapatra, M., Rathore, L. S., Gopalakrishnan,
S. G. and Niyogi, D., 2015, “A great escape from the Bay of Bengal “Super Sapphire - Phailin” Tropical Cyclone: A case of
improved weather forecast and societal response for disaster
mitigation”, Earth Interactions, 19, 17, 1-11.
Mohapatra, M., Mandal, G. S., Bandyopadhyay, B. K., Tyagi, A. and Mohanty, U. C., 2012, “Classification of cyclone hazard prone
districts of India”, Natural hazards, 63, 3, 1601-1620.
Mohapatra, M., Bandyopadhyay, B. K. and Nayak, D. P., 2013a, “Evaluation of operational tropical cyclone intensity forecasts
over north Indian Ocean issued by India Meteorological Department”, Natural Hazards, 68, 2, 433-451.
Mohapatra, M., Nayak, D. P., Sharma, R. P., Bandyopadhyay, B. K.,
2013b, “Evaluation of Official Tropical Cyclone Track
Forecast over north Indian Ocean Issued by India Meteorological Department”, Journal of Earth System Sciences,
122, 589-601.
Mueller, C., Saxen, T., Roberts, R., Wilson, J., Betancourt, T., Dettling, S., Oien, N. and Yee, J., 2003, “NCAR Auto-Nowcast System”,
Weather Forecasting, 18, 4, 545-561.
Novak, P., 2007, “The Czech Hydrometeorological Institute's Severe Storm Nowcasting System”, Atmos. Res., 83, 450-457.
Pan, Y. and Wang, M., 2019, “Impact of the Assimilation Frequency of Radar Data with the ARPS 3DVar and Cloud Analysis System
on Forecasts of a Squall Line in Southern China”, Advances in
Atmospheric Sciences, 36, 2, 160-172.
Peduzzi, P., Chatenoux, B., Dao, H., De Bono, A., Herold, C., Kossin, J., Mouton, F. and Nordbeck, O., 2012, “Global trends in tropical
cyclone risk”, Nature Climate Change, 2, 4, 289-294.
Price, C., 2008, “Lightning Sensors for Observing, Tracking and
Nowcasting Severe Weather”, Sensors, 8, 157-170.
Ranalkar, M. R. and Chaudhari, H. S., 2009, “Seasonal variation of lightning activity over the Indian subcontinent”, Meteorology and atmospheric physics, 104, 1-2, 125-134.
Rao, Y. P and Srinivasan, V., 1969, “Discussion of typical synoptic weather situations, 1.1 Winter-western disturbances and their
associated features”, IMD Forecasting Manual Part III.
Rao, Y. P. and Ramamurti, K. S., 1968, “Climatology of India and Neighbourhood”, F.M.U. Rep., No. 1-2, India Meteorological Department.
Ray, K., Bandopadhyay, B. K. and Bhan, S. C., 2015, “Operational
nowcasting of thunderstorms in India and its verification”,
Mausam, 66, 3, 595-602.
Romatschke, U., Medina, S. and Houze, R. A. Jr., 2010, “Regional, Seasonal and diurnal Variation of Extreme Convection in the South Asia Region”, Journal of Climate, 15, 419-439.
Roy Bhowmik, S. K., Sen Roy, S., Srivastava, K., Mukhopadhay, B., Thampi, S. B., Reddy, Y. K., Singh, H., Venkateswarlu, S. and
Adhikary, S., 2011, “Processing of Indian Doppler Weather
Radar data for mesoscale applications”, Meteor. Atmos. Phys., 111, 3-4, 133-147.
Scheiber, J., 1998, “Operational Nowcasting Based on Satellite Cloud Motion Winds”, Fourth International Winds Workshop,
Saanenmöser, Switzerland, 20-23 October 1998.
Schmid, W., Mecklenburg, S. and Joss, J., 2000, “Short-term risk forecasts of severe weather”, Phys. Chem. Earth, 25, 10-12,
1335-1338.
Schwitalla, T. and Wulfmeyer, V., 2018, “Radar data assimilation experiments using the IPM WRF Rapid Update Cycle”,
Meteorologische Zeitschrift, 23, 1, 79-102.
Seed, A. W., 2003, “A dynamic and spatial approach to advection forecasting”, Journal of Applied Meteorology, 42, 3, 381-388.
Sen Roy, S., Ray, Kamaljit, Sen, Bikram, Sharma, Pradeep, Gauba, Sunanda, Yadav, B. P., Goyal, S., Saikrishnan, K. C., Madan,
Ranju, Pattanaik, D. R., Kottal, S. D., Durai, V. R., Das, A. K.,
Stella, S., Das, Sunit, Debnath, G. C., Rajeev, V. K., Prasad, J. R., Vishen, , R., Ashrit, R., Mohapatra, M., Rathore L. S. and K.
J. Ramesh, 2017, “Pre-Monsoon Thunderstorms-2016: A
Report”, IMD Met. Monograph, No. ESSO/IMD/STORM PROJECT - 2016/ 01(2017)/5.
Sen Roy, S., Saha, S. B., Bhowmik, S. R. and Kundu, P. K., 2014, “Optimization of Nowcast Software WDSS-II for operational
application over the Indian region”, Meteorology and Atmospheric Physics, 124, 3-4, 143-166.
Sieglaff, J. M., Bedka, K. M., Cronce, L. M., Feltz, W. F., Pavolonis, M. J. and Heidinger, A., 2011, “Nowcasting convective storm
initiation using satellite-based box-averaged cloud-top cooling
and cloud-type trends”, Journal of Appllied Meteorology and Climatology, 50, 110-126.
Singh, C., Mohapatra, M., Bandyopadhyay, B. K. and Tyagi, A., 2011, “Thunderstorm climatology over northeast and adjoining east
India”, Mausam, 62, 163-170.
Smith, T. M., Lakshmanan, V., Stumpf, G. J., Ortega, K. L., Hondl, K., Cooper, K., Calhoun, K. M., Kingfield, D. M., Manross, K. L.,
Toomey, R. and Brogden, J., 2016, “Multi-Radar Multi-Sensor
(MRMS) severe weather and aviation products: Initial operating capabilities”, Bulletin of the American Meteorological
Society, 97, 9, 1617-1630.
SEN ROY et al. : NOWCASTING OF CONVECTIVE WEATHER OVER THE INDIAN REGION 483
Sokol, Z. and Pesice, P., 2009, “Comparing nowcastings of three severe
convective events by statistical and NWP models”, Atmos.
Research, 93, 397-407
Srinivasan, J., 2013, “Predicting and managing extreme rainfall”,
Current Science, 105, 1, 7-8.
Srivastava, K., Lau, S. Y., Yeung, H. Y., Cheng, T. L., Hardwaj, R., Kannan, A. M., Roy Bhowmik, S. K. and Singh, H., 2012, “Use
of SWIRLS nowcasting system for quantitative precipitation
forecast using Indian DWR data”, Mausam, 63, 1, 1-16.
Srivastava, K., Roy Bhowmik, S. K., Sen Roy, S., Thampi, S. B. and
Reddy, Y. K., 2010, “Simulation of high impact convective
events over Indian region by ARPS model with assimilation of Doppler weather radar radial velocity and reflectivity”,
Atmosfera, 23, 1, 53-73.
Sugiura, I., 2013, “Very-short-range forecast of precipitation in Japan”, 14th annual WRF users’s workshop, 24-28.
Tao, Wei, 2011, “Mobile X-band dual-polarization radar in short-term,
comprehensive application in nowcasting”, Proceedings of the 8th Yangtze River Delta Meteorological Science and Technology
Development Forum, 497-506.
Thompson, K. B., Bateman, M. G. and Carey, L. D., 2014, “A comparison of two ground-based lightning detection
networks against the satellite-based Lightning Imaging Sensor
(LIS)”, Journal of Atmospheric and Oceanic Technology, 31, 10, 2191-2205.
Thunis, P. and Bornstein, R., 1996, “Hierarchy of mesoscale flow assumptions and equations”, Journal of the Atmospheric
Sciences, 53, 3, 380-397.
Tyagi, A., 2000, “Mesoscale weather prediction”, Current Science, 79, 6,
698-710.
Varma, A. K., Gairola, R. M. and Goyal, S., 2015, “Hydro-estimator: Modification and validation”, SAC/ISRO Internal Report,
SAC/EPSA/AOSG/SR, p27.
Wang, Haibin, Yang, Yinming, Fan, Xuliang and Hai, Chu, 2016,
“Progress and Thinking of Shanghai Fine Grid Forecasting
Business”, Progress in Meteorological Science and Technology, 4, p8.
Wilson, J. W., Ebert, E. E., Saxen, T. R., Roberts, R. D., Mueller, C. K., Sleigh, M., Pierce, C. E. and Seed, A., 2004, “Sydney 2000
forecast demonstration project: convective storm nowcasting”,
Weather and forecasting, 19, 1, 131-150.
Wilson, J. W., Feng, Y., Chen, M. and Roberts, R. D., 2010,
“Nowcasting challenges during the Beijing Olympics:
Successes, failures and implications for future nowcasting systems”, Weather and Forecasting, 25, 6, 1691-1714.
WMO, 2017, “Guidelines for Nowcasting Techniques”, https://library.wmo.int/doc_num.php?explnum_id=3795
(accessed on 30.11.2018)
Xue, M., Droegemeier, K. K. and Wong, V., 2000, “The Advanced Regional Prediction System (ARPS) - A multiscale
nonhydrostatic atmospheric simulation and prediction tool. Part
I: Model dynamics and verification”, Meteorology and Atmospheric Physics, 75, 161-193.
ANNEXURE 1
Format for issue of Severe weather Nowcast in TEXT format
Time of issue…..
………………… (e.g. Thunderstorm/Dust storm etc.) …..………likely to affect ………….… District/ ………..within next ……... hours. It may be
accompanied with …..………………..and strong winds reaching ………………..kmph or more.
………………… (light/ moderate/ heavy) rainfall. likely to affect ……………… District/ ………..……..within next …….. hours.
Visibility may reduce to below ……………metres during the period.
………………….…….district/region is likely to be affected by fog for the next ….hours, reducing visibility to below ……………metres.
Signature
To:
User1
User2

484 MAUSAM, 70, 3 (July 2019)
ANNEXURE 2
DECISION TREE OF NOWCAST CENTRE