a review of the fatigue strength of structur al materials
TRANSCRIPT

* Corresponding author. E-mail addresses: [email protected] (F. Berto) © 2017 Growing Science Ltd. All rights reserved. doi: 10.5267/j.esm.2017.9.002
Engineering Solid Mechanics (2017) 245-270
Contents lists available at GrowingScience
Engineering Solid Mechanics
homepage: www.GrowingScience.com/esm
A review of the fatigue strength of structural materials under multiaxial loading in terms of the local energy density
F. Bertoa,b*, J. Torgersena,b and A. Campagnoloc
aDepartment of Mechanical Engineering, Stanford University, USA bDepartment of Mechanical and Industrial Engineering, Norwegian University of Science and Technology, Norway cDepartment of Mechanical Engineering, University of Padua, Italy
A R T I C L EI N F O A B S T R A C T
Article history: Received 6 June, 2017 Accepted 7 September 2017 Available online 7 September 2017
A review of some recent data from multiaxial fatigue data from different notched materials is carried out in the paper. The approach based on the strain energy density (SED) averaged over a control volume is first used to summarise uniaxial and multiaxial fatigue strength data of welded joints made of structural steel and aluminium alloys. In all welded joints, the weld toe and weld root regions are modelled like sharp, zero radius, V-notches with different opening angles. The control volume radius is 0.28 mm for structural steels, 0.12 mm for aluminium alloys. Afterwards the SED approach is applied to multi-axial fatigue data from plain and V-notched specimens made of AISI 416 stainless steel (hardened and tempered state), subjected to tension, torsion and combined tension and torsion, both in-phase and out-of-phase. Notched specimens are characterised by a very small root radius, =0.1 mm, which results in high nonlinear effects ahead of the notch tips. All results are summarised in terms of WN (SED range versus cycles to failure) scatterbands. Together with the new results, a number of multi-axial fatigue data recently obtained from sharply notched specimens made of C40 steel (normalised state) and 39NiCrMo3 steel (hardened and tempered state) are represented with the aim to provide a global synthesis in terms of local SED. Finally a synthesis from Ti6Al4V alloy is carried out showing the capability of the SED approach to be applied also to light alloys.
© 2017 Growing Science Ltd. All rights reserved.
Keywords: V-notch Fatigue strength Strain energy density AISI 416 Ti6Al4V
1. Introduction
The approaches for the fatigue assessment of welded joints can be divided into categories depending on the type of the stress analysis performed for the final fatigue prediction (Radaj et al., 2006). One can distinguish criteria based on nominal stress, structural stress, local stress or local strain as well as other approaches based on Linear Elastic Fracture Mechanics. These approaches are separately summarised in some recent Recommendations (Hobbacher, 2008).
246
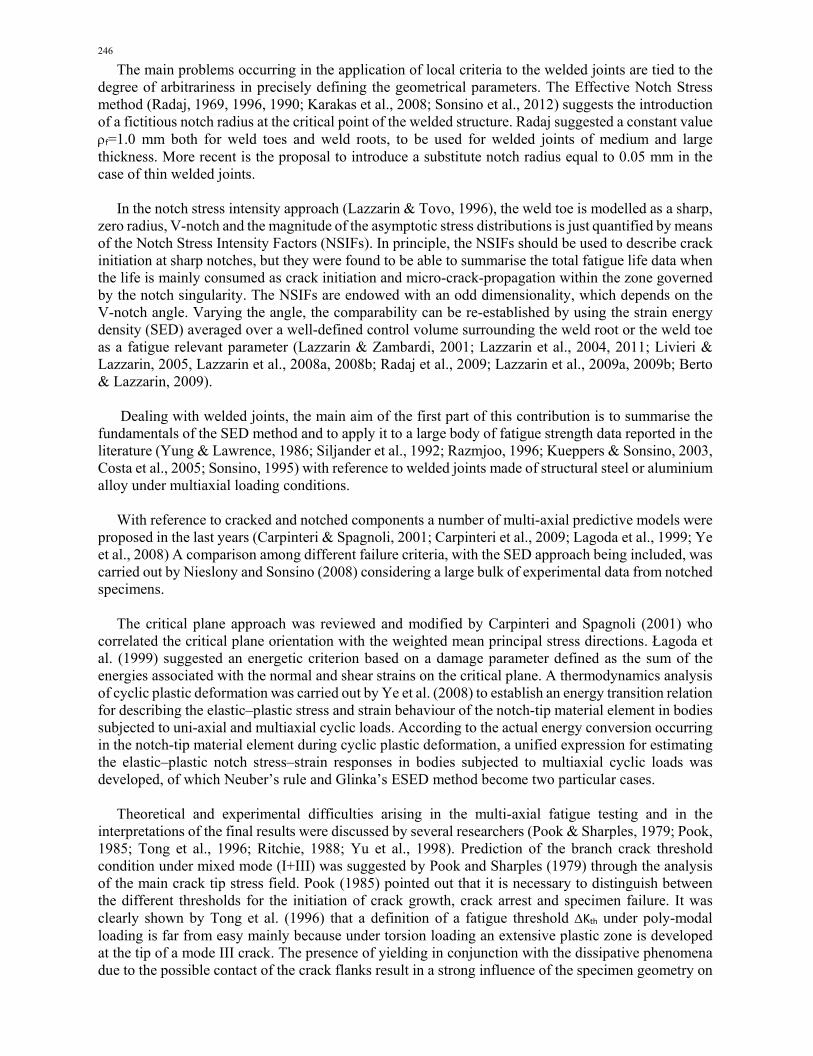
The main problems occurring in the application of local criteria to the welded joints are tied to the degree of arbitrariness in precisely defining the geometrical parameters. The Effective Notch Stress method (Radaj, 1969, 1996, 1990; Karakas et al., 2008; Sonsino et al., 2012) suggests the introduction of a fictitious notch radius at the critical point of the welded structure. Radaj suggested a constant value f=1.0 mm both for weld toes and weld roots, to be used for welded joints of medium and large thickness. More recent is the proposal to introduce a substitute notch radius equal to 0.05 mm in the case of thin welded joints. In the notch stress intensity approach (Lazzarin & Tovo, 1996), the weld toe is modelled as a sharp, zero radius, V-notch and the magnitude of the asymptotic stress distributions is just quantified by means of the Notch Stress Intensity Factors (NSIFs). In principle, the NSIFs should be used to describe crack initiation at sharp notches, but they were found to be able to summarise the total fatigue life data when the life is mainly consumed as crack initiation and micro-crack-propagation within the zone governed by the notch singularity. The NSIFs are endowed with an odd dimensionality, which depends on the V-notch angle. Varying the angle, the comparability can be re-established by using the strain energy density (SED) averaged over a well-defined control volume surrounding the weld root or the weld toe as a fatigue relevant parameter (Lazzarin & Zambardi, 2001; Lazzarin et al., 2004, 2011; Livieri & Lazzarin, 2005, Lazzarin et al., 2008a, 2008b; Radaj et al., 2009; Lazzarin et al., 2009a, 2009b; Berto & Lazzarin, 2009). Dealing with welded joints, the main aim of the first part of this contribution is to summarise the fundamentals of the SED method and to apply it to a large body of fatigue strength data reported in the literature (Yung & Lawrence, 1986; Siljander et al., 1992; Razmjoo, 1996; Kueppers & Sonsino, 2003, Costa et al., 2005; Sonsino, 1995) with reference to welded joints made of structural steel or aluminium alloy under multiaxial loading conditions. With reference to cracked and notched components a number of multi-axial predictive models were proposed in the last years (Carpinteri & Spagnoli, 2001; Carpinteri et al., 2009; Lagoda et al., 1999; Ye et al., 2008) A comparison among different failure criteria, with the SED approach being included, was carried out by Nieslony and Sonsino (2008) considering a large bulk of experimental data from notched specimens. The critical plane approach was reviewed and modified by Carpinteri and Spagnoli (2001) who correlated the critical plane orientation with the weighted mean principal stress directions. Łagoda et al. (1999) suggested an energetic criterion based on a damage parameter defined as the sum of the energies associated with the normal and shear strains on the critical plane. A thermodynamics analysis of cyclic plastic deformation was carried out by Ye et al. (2008) to establish an energy transition relation for describing the elastic–plastic stress and strain behaviour of the notch-tip material element in bodies subjected to uni-axial and multiaxial cyclic loads. According to the actual energy conversion occurring in the notch-tip material element during cyclic plastic deformation, a unified expression for estimating the elastic–plastic notch stress–strain responses in bodies subjected to multiaxial cyclic loads was developed, of which Neuber’s rule and Glinka’s ESED method become two particular cases. Theoretical and experimental difficulties arising in the multi-axial fatigue testing and in the interpretations of the final results were discussed by several researchers (Pook & Sharples, 1979; Pook, 1985; Tong et al., 1996; Ritchie, 1988; Yu et al., 1998). Prediction of the branch crack threshold condition under mixed mode (I+III) was suggested by Pook and Sharples (1979) through the analysis of the main crack tip stress field. Pook (1985) pointed out that it is necessary to distinguish between the different thresholds for the initiation of crack growth, crack arrest and specimen failure. It was clearly shown by Tong et al. (1996) that a definition of a fatigue threshold Kth under poly-modal loading is far from easy mainly because under torsion loading an extensive plastic zone is developed at the tip of a mode III crack. The presence of yielding in conjunction with the dissipative phenomena due to the possible contact of the crack flanks result in a strong influence of the specimen geometry on
F. Berto et al. / Engineering Solid Mechanics 5 (2017)
247
the test data. The intrinsic and extrinsic mechanisms producing shielding effects during fatigue crack propagation were classified by Ritchie (1988) whereas near threshold fatigue crack propagation was examined by Yu et al. (1998). The crack propagation rate decreased with crack extension because of the shear contact of the crack faces causing an increase in friction, abrasion and interlocking.
A novel mathematical model of the stresses around the tip of a fatigue crack, which considers the effects of plasticity through an analysis of their shielding effects on the applied elastic field was developed by Christopher et al. (2007). The ability of the model to characterize plasticity-induced effects of cyclic loading on the elastic stress fields was demonstrated using full field photoelasticity. The complex initiation of crack growth under a combination of opening and anti-plane shearing mode loading was recently considered also by Ravi-Chandar and co-workers (2007) showing that the cracks do not grow through a continuous evolution of the crack surface but rather by means of an abrupt fragmentation or segmentation of the crack front.
In the last years, the approach based on the SED over a control volume has been extended from the welded joints to the quasi-sharp notches where the absence of residual stresses and alterations of microstructure like those provoked by the welding process make much more difficult the interpretation of the results that are strongly dependent on the considered material. In particular, the SED approach was used to summarize about 300 fatigue data from axis-symmetric specimens made of 39NiCrMo3 steel weakened by circumferential quasi-sharp V-notches and subjected to uniaxial and multiaxial loading (Berto et al., 2011a). The dissipative phenomena occurring during the experimental activity were widely investigated there in combination with fracture surfaces and non-propagating cracks in the run-out specimens. A final synthesis of the main body of the data, with the only exclusion of the out-of-phase data, were presented in terms of a single SED-based scatterband adapting the control volume as a function of the loading mode. Under mode III loading conditions the control volume radius was found to be strongly influenced by extrinsic shielding mechanisms. The data from the out-of-phase loads were not included into the proposed scatterband, being located well below its lower limit.
Atzori Dealing with sharply notched components, the main objective of the second part of this paper is to
briefly summarise the multi-axial fatigue strength data reported in Refs (Atzori et al., 2006; Berto et al., 2017) and document new data from plain and notched specimens made of AISI 416 stainless steel (at hardened and tempered state), subjected to combined tension and torsion loading, both in-phase and out-of-phase (=0° and =90°). In particular, 13 fatigue series dealing with tension loading, torsion loading and combined tension-torsion loading are presented here. All results are re-analysed in terms of local SED showing that the same value of the local energy can be re-establish at high cycle fatigue by using two different control volumes under mode I and mode III loading, as already documented for 39NiCrMo3 steel. Moreover, some recent data from Ti6Al4V subjected to different combinations of multiaxial loadings have been summarised (Berto et al., 2015a). 2. SED applied to welded joints under prevalent mode I loading
Local strain energy density W averaged in a finite size volume surrounding weld toes and roots is a scalar quantity that can be given as a function of mode I-II NSIFs in plane problems and mode I-II-III NSIFs in three-dimensional problems. The evaluation of the local strain energy density needs precise information about the control volume size. From a theoretical point of view, the material properties in the vicinity of the weld toes and the weld roots depend on a number of parameters such as residual stresses and distortions, heterogeneous metallurgical micro-structures, weld thermal cycles, heat source characteristics, load histories and so on. To device a model capable of predicting R0 and fatigue life of welded components on the basis of all these parameters is really a task too complex. Thus, the spirit of the approach is to give a simplified method able to summarise the fatigue life of components only on the basis of geometrical information, treating all the other effects only in statistical terms, with reference to a well-defined group of welded materials and, for the time being, to arc welding processes.
248
In a plane problem all stress and strain components in the highly stressed region are correlated to mode I and mode II NSIFs. Under plane strain hypotheses, the strain energy included in the semicircular sector shown in Fig. 1 is (Lazzarin & Zambardi, 2001)
R0R0
2 2
R0 x0
R0 +x 0
(a) (b) (c)
Fig. 1. Control volumes for a V-sharp notch (a), a crack (b) and a blunt V-notch (c).
2
10
N22
2
10
N11
ww21 R
K
E
e
R
K
E
ecWc ,
(1)
where R0 is the radius of the control volume, 1 and 2 are Williams’ eigenvalues, e1, and e2 are parameters which depend on the opening angle 2 and the Poisson’s ratio . In Eq. (1) the coefficient cW allows us to take into account the influence of the nominal load ratio R, but only in the case of post-welding treatments (stress-relieved joints). In particular, according to the expressions for cW (Lazzarin et al., 2004), we shall use here cW=1 for R=0 and cW = 0.5 for R = 1. For all welded joints under as-welded conditions one should assume cW=1, independently of R. As opposed to the direct evaluation of the NSIFs, which needs very refined meshes, the mean value of the elastic SED on the control volume can be determined with the necessary accuracy also by using coarse meshes (Lazzarin et al., 2008b). This is because it directly linked to the nodal displacements and does not need any point-wise stress or strain calculation (Lazzarin et al., 2010). In the case of thin welded joints the simple expression (1) based on the leading order terms is no longer valid because the influence of the non-singular terms of the stress fields becomes important (Lazzarin et al., 2009). This is particularly true also in the case of blunt notches where all stresses are bounded: the averaged SED as determined from FE models with coarse meshes can be easily linked not to the NSIFs but rather than to the theoretical stress concentration factors (Lazzarin et al., 2010). The material parameter R0 in Eq. (1) was estimated by using the fatigue strength A of the butt ground welded joints (in order to quantify the influence of the welding process, in the absence of any stress concentration effect) and the NSIF-based fatigue strength of welded joints. The welded joints have a V-notch angle at the weld toe that is constant and large enough to ensure the non-singularity of mode II stress distributions. For welded joints made of structural steels and aluminium alloys R0 was found to be 0.28 mm and 0.12 mm, respectively (Livieri & Lazzarin, 2005). By modelling the weld toe regions as sharp V-notches and using the local strain energy, more than 600 fatigue strength data from welded joints with weld root and toe failures were summarised by using a single SED-based scatterband. The welded joint geometries exhibited a strong variability of the main plate thickness (ranging from 6 to 100 mm), the transverse plate and the bead flank. A final synthesis based now on more than 900 experimental data are shown in Fig. 2 where recent results from butt-welded joints, three-dimensional models and hollow section joints are included (Berto & Lazzarin, 2009). In principle, extension of Eq. (1) to multi-axial loading is possible including the Mode III NSIF. The use of the same control radius R0 for welded joints under in-phase and out-of-phase loads represents, however, an engineering simplification. Within this assumption, SED-based data from welded joints made of structural steels subjected to non-proportional loads are expected to be lower than those from proportional loads.

F. Berto et al. / Engineering Solid Mechanics 5 (2017)
249
Fig. 2. Fatigue strength of welded joints as a function of the strain energy density (SED) averaged over the control volume; R is the nominal load ratio
3. Multiaxial fatigue loading of welded joints Multiaxial fatigue strength data of welded joints made of structural steels have been re-analysed in terms of local strain energy density (SED) over a control volume, as shown in Fig. 3. Original papers reported different series of experimental data for each geometry. In the present formulation, the SED-based method does not take into account the role played by the different phase angles. This effect can be not negligible in the case of steel welded joints, as shown by Sonsino (1995), who documented a decrease of the fatigue strength when out-of-phase loads are applied. An easy solution might involve either a new definition of the control volume radius (which should be updated, slightly decreased, for non-proportional loadings with respect to the value used in the presence of the in-phase loads) or separating the energies associated with the normal and shear strains. Since the critical plane approach cannot be directly combined with asymptotic stress fields derived according to Williams’ solution, the SED values are reconverted from the control volume to the critical plane by introducing a ‘fictitious’ notch radius and taking advantage of the Neuber rule.
Fig. 3 summarises all the data in terms of the mean value of the strain energy density and presents a comparison with a multiaxial scatterband. The scatterband has been drawn imposing at 2106 cycles the same value of the local strain energy previously obtained from welded joints under traction or bending, but changing the slope (from 3/2 to 5/2). It is confirmed the hypothesis that in high-cycle fatigue, where the welded joint behaviour is generally thought of as linear elastic, the critical value of strain energy density does not depend on the type of loading, being the same both under uniaxial and multiaxial fatigue. The inverse slope of the mean curve has been imposed equal to 2.5. When reconverted in terms of local stress, instead of local energy, it coincides with the value k=5 suggested by Eurocode 3 for a generic “shear load”, in the absence of a clear distinction between stress components due to shear or torsion loads. The comparison between experimental data, in terms of local energy, and the scatterband proposed is satisfactory and shows how all data are well distributed around the mean curve with the exception of few data due to Razmjoo (1996), which seem to be affected by a larger scatter. In particular 3 data obtained under pure torsion and R=0 are slightly higher than expected whilst, on the contrary, some values are a little lower under pure traction and the same load ratio, R=0. All results have been obtained from linear elastic FE analyses.
0.01
0.1
1.0
10
510410 610 710
=0.28 mm0R
900 fatigue testInverse slope k=1.5
97.7 %=SP
2D, failure from weld toes, R= 0
2D, failure from weld roots, R = 0
Butt welded joints ‐1 < R < 0.2
3D welded joints, ‐1 < R < 0.67
Hollow section joints, R = 0
]3
W [MJ/m
Averaged strain energy den
sity
= 3.3WT
3MJ/m 0.192
0.105
0.058
0R
2
Cycles to failure, N

250
Fig. 3. Synthesis of data from welded joints under multiaxial loading
in terms of SED (Lazzarin et al. 2008c) The mean value W=0.1 Nmm/mm3 at NA=2106 cycles is found to be conservative for the full-penetration welded joints made of high-strength FeE460 steel tested by Sonsino (1995) under pure torsion, pure bending and combined torsion and bending (in-phase and out-of-phase), see Fig. 4. All specimens were stress-relieved and tested under a nominal load ratio R= 1. The mean values of the nominal stress ranges for pure bending and pure torsion were found to be very high at two million cycles, A=218 MPa and A= 172 MPa, respectively.
Fig. 4. Synthesis of data from welded joints under multiaxial loading in terms of SED
0.01
0.1
1
10
10000 100000 1000000 10000000Cycles to failure, N
Yung and Lawrence (1986), R= 1, as‐welded
Razmjoo (1996), R=0, as‐welded
Siljander et al. (1992) R= 1 and R=0, stress‐relievedk=2.5
=3.3WT
R 0 = 0.28 mm
At N=2106 cycles : W 50% ]3= 0.105 [MJ/m
104 105 106 107
]3[M
J/m
W
Wc

F. Berto et al. / Engineering Solid Mechanics 5 (2017)
251
Furthermore, some series included welded joints which were not only stress-relieved but also machined post-welding, with a further increase of fatigue strength properties (A=228 MPa for pure bending and A= 178 MPa for pure torsion, Ps=50%). For the non-machined welded joints the data from non-proportional loads are lower than those from in-phase loads. This effect tends to disappear for the machined specimens particularly in the high cycle regime.
Fatigue strength data of welded joints made of aluminium alloys have also been re-analysed by using different series of experimental data taken from the literature (Kueppers & Sonsino, 2003, Costa et al., 2005). Fig. 5 summarises all fatigue strength data in terms of the mean value of the strain energy density also comparing them with a multiaxial scatterband for aluminium alloys. The proposed curve has been drawn imposing at 2x10⁶ cycles the same value of the local energy and the control radius (R0=0.12 mm) already reported by Livieri and Lazzarin (2005) for welded joints made of aluminium alloys under traction or bending. The inverse slope of the mean curve has been imposed equal to 3.25 where the slope of the stress-based band was 6.5. The comparison between the experimental data reconverted in terms of local energy and the scatterband proposed is satisfactory. Note that no penalising effect due to non-proportional loading is found here for welded joints made of aluminium alloys. The different role played by local and large scale yielding under tension and torsion loading was used by Lazzarin and Berto (2008) to provide a possible explanation for the different slopes, 3.0 and 5.0, reported by Eurocode 3 and other Standards in force for welded details subjected to tensile or shear stresses, respectively. A very satisfactory agreement was found between the scatterband obtained by considering as main failure parameter the averaged SED and Ellyn’s fatigue master life curve (Ellyin , 1997) based on the use of the plastic strain energy per cycle as evaluated from the closed cyclic hysteresis loop and the positive part of the elastic strain energy density.
Fig. 5. Synthesis of data from welded joints under multiaxial loading (in-phase and out-of phase loads) in terms of SED over the control volume and comparison with data from uniaxial tests 4. Multiaxial fatigue data from V-notched specimens. A synthesis of previous results Before presenting a set of new experimental results related to AISI 416 under multiaxial fatigue, it is convenient to briefly summarise some recent results as determined from sharply notched specimens made of two different steels.
0.01
0.1
1
10
1.E+04 1.E+05 1.E+06 1.E+07
]3
W [MJ/m
w
c
k=2.0
0.103
]30.184 [MJ/m
R 0= 0.12 mm
k=3.25
multiaxial tests (81 data)
uniaxial tests
=3.3WT
104 10 5 10 6 10 7
Cycles to failure, N
0.058

252
4.1 Data from notched specimens made of C40 steel (normalized state).
Fatigue strength properties of notched specimens made of C40 carbon steel (normalised state), subjected to combined tension and torsion loading have been shown in Fig. 6 and Fig. 7 obtained for both in-phase and out-of-phase. In Atzori et al. (2006) V-notched specimens were tested under two nominal load ratios, R=1 and R=0, while keeping constant and equal to the unity the biaxiality ratio, aa All specimens were characterised by a notch tip radius equal to 0.5 mm while the V-notch angle was equal to 90 degrees. The notch depth p was equal to 4 mm.
Being the notch radius =0.5 mm, it could be too large for the application of the NSIFs calculated without accounting for the presence of the radius itself. As a preliminary step toward the application of the SED criterion based on a control volume, all data were first re-analysed together by using a “Point criterion” where the total strain energy density was determined simply on the basis of the maximum elastic stress at the notch tip, according to the expression:
2el,p
2el,p
wtw 12
E2
cWc ,
(2)
where E and are the Young’s modulus and the Poisson’s ratio, and p,el and p,el are the elastic peak stress ranges at the notch tip. The fatigue curve and the 10-90% scatter band related to the notched specimens are shown in Fig. 6, where the total strain energy density is plotted as function of the cycles to failure. The same data have been re-analysed by means of the local SED applied to the blunt notches by using the volume shown in Fig. 1c. The control radius R0 was determined a posteriori as the radius providing, for the notched specimens, a mean value of the strain energy density on the control volume equal to the arithmetic mean obtained at 2x10⁶ cycles from the plain specimens under pure tension and pure torsion loads. The results are shown in Fig. 7. For this specific material and for this specific notch radius, a single scatter band was found to be able to summarise all multiaxial fatigue data from notched specimens.
Fig. 6. Fatigue strength data of the notched specimens given in terms of strain energy density at the
notch tip
0.1
1
10
410 510610 710
R=‐1; =0
R= 0; =0
R= 0; =90°
R=‐1; =90°
Tension R=‐1
R=‐1, p = 4 mm
Shaft, R=‐1
R=‐1, p = 2 mm
R=‐1, p = 0.5 mm
Slope k=2.73
3= 0.934 MJ/mt W
]3
[MJ/m
t
W Wc
Cycles to failure, N
p
Steel C40 (normalized state)
Notched specimens
2.75= WT
p
Torsion
Multiaxial

F. Berto et al. / Engineering Solid Mechanics 5 (2017)
253
104 105 106 107 Cycles to failure, N
c W
W
[MJ/
m3 ]
2.0
4.0
0.4
7.0
1.0
0.1
W =0.80
Slope k=3.0
TW = 2.32
Steel C40 (normalized state) Notched specimens Control radius: R0=0.165 mm
= 90°
p = 4 mm= 0.5 mm = 0.5 mm
p = 4 mm
Fig. 7. Fatigue data plotted in terms of mean values of the SED
4.2 Data from notched specimens made of 39NiCrMo3 steel (hardened and tempered state)
The specimens were made of hardened and tempered 39NiCrMo3 steel with a very fine microstructure. The V-notch depth p was equal to 4 mm whereas the notch tip radius, , created by electric discharge machining, was 0.1 mm (Berto et al., 2011a). The specimens were tested under pure tension, pure torsion and mixed tension-torsion loading. Two nominal stress ratios, R=0 and R=-1, were considered and two phase angles, =0, in-phase loading, and =90°, out-of-phase loading. Two series of tests on V-notched specimens were carried out considering a biaxiality ratio =1.6 and =0.6, and R= 1.
Fatigue crack initiation occurred very rapidly, both under tensile and torsion loading. Fatigue cracks of detectable size were observed on the notch surfaces after a period ranging from 5 to 10 percent of the total fatigue life of the specimen. During the tests dissipative phenomena occurred due to the crack surface interference with debris emanating from the mating surfaces (see Fig. 8). The formation of debris was most evident for full reversed out of phase tests, R=1 combined with =90°, but it was also present under in-phase full reversed loading, R= 1 and =0. Under a nominal load ratio R=0, the phenomenon was evident only for =90° and high levels of the applied load. No powder debris exuded from the crack face surfaces under R=0 and =0 loading.
(a) after N=20000 cycles (b) after N=180000 Fig. 8. Debris emanated during a test at N=2x10³ cycles and N=1.85x10⁵ cycles (b)
(a=a=160 MPa, R=‐1, =90°, =1, final failure at N=186600)
254
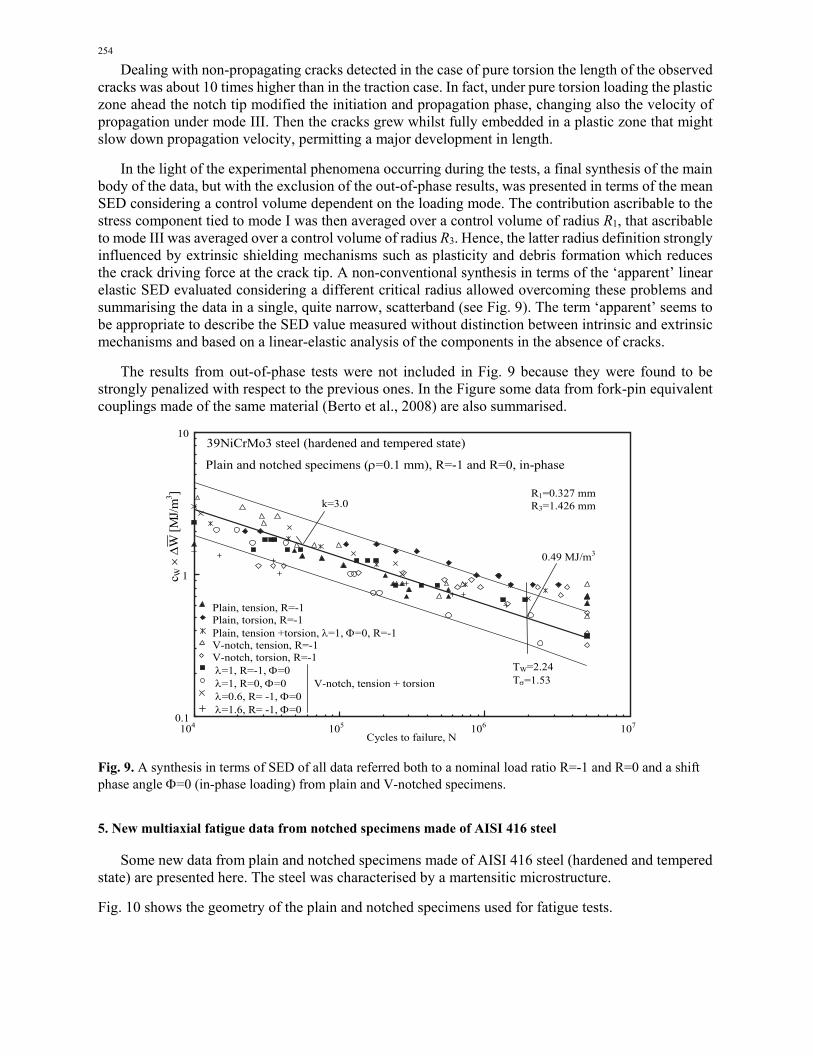
Dealing with non-propagating cracks detected in the case of pure torsion the length of the observed cracks was about 10 times higher than in the traction case. In fact, under pure torsion loading the plastic zone ahead the notch tip modified the initiation and propagation phase, changing also the velocity of propagation under mode III. Then the cracks grew whilst fully embedded in a plastic zone that might slow down propagation velocity, permitting a major development in length.
In the light of the experimental phenomena occurring during the tests, a final synthesis of the main body of the data, but with the exclusion of the out-of-phase results, was presented in terms of the mean SED considering a control volume dependent on the loading mode. The contribution ascribable to the stress component tied to mode I was then averaged over a control volume of radius R1, that ascribable to mode III was averaged over a control volume of radius R3. Hence, the latter radius definition strongly influenced by extrinsic shielding mechanisms such as plasticity and debris formation which reduces the crack driving force at the crack tip. A non-conventional synthesis in terms of the ‘apparent’ linear elastic SED evaluated considering a different critical radius allowed overcoming these problems and summarising the data in a single, quite narrow, scatterband (see Fig. 9). The term ‘apparent’ seems to be appropriate to describe the SED value measured without distinction between intrinsic and extrinsic mechanisms and based on a linear-elastic analysis of the components in the absence of cracks.
The results from out-of-phase tests were not included in Fig. 9 because they were found to be strongly penalized with respect to the previous ones. In the Figure some data from fork-pin equivalent couplings made of the same material (Berto et al., 2008) are also summarised.
0.1
1
10
104 105 106 107
k=3.0
TW=2.24 T=1.53
0.49 MJ/m3
Cycles to failure, N
c W
W [
MJ/
m3 ]
Plain and notched specimens (=0.1 mm), R=-1 and R=0, in-phase
Plain, tension, R=-1 Plain, torsion, R=-1 Plain, tension +torsion, =1, =0, R=-1 V-notch, tension, R=-1 V-notch, torsion, R=-1 =1, R=-1, =0 =1, R=0, =0 V-notch, tension + torsion =0.6, R= -1, =0
=1.6, R= -1, =0
R1=0.327 mm R3=1.426 mm
39NiCrMo3 steel (hardened and tempered state)
Fig. 9. A synthesis in terms of SED of all data referred both to a nominal load ratio R=-1 and R=0 and a shift phase angle =0 (in-phase loading) from plain and V-notched specimens.
5. New multiaxial fatigue data from notched specimens made of AISI 416 steel
Some new data from plain and notched specimens made of AISI 416 steel (hardened and tempered state) are presented here. The steel was characterised by a martensitic microstructure.
Fig. 10 shows the geometry of the plain and notched specimens used for fatigue tests.

F. Berto et al. / Engineering Solid Mechanics 5 (2017)
255
60 6080
p = 4, 2, 0.5 0.1
90°
40
a)
b)
Fig. 10. Geometry of the axi-symmetric specimens made of AISI 416 and tested under uniaxial and multiaxial loadings
The V- notch depth is 4, 2 and 0.5 mm whereas the notch tip radius is constant and equal to 0.1 mm. Some static tests have been carried out to evaluate the strength properties of the material, the yield stress (570 MPa) and the ultimate tensile strength (700 MPa).
Before being fatigue tested, all specimens have been polished in order to both eliminate any surface scratch or mark due to machine tools and make the analysis of fatigue crack evolution easier. Fatigue tests have been carried out on a MTS 809 servo-hydraulic axial-torsional testing system with an axial cell 100 kN and a torsion cell of 1100 Nm. All tests have been performed under load control, with a frequency ranging from 5 to 15 Hz, as a function of geometry and applied load. The specimens were tested under pure tension, pure torsion and mixed tension-torsion loading. In particular, 13 fatigue test series were conducted, according to the following subdivision:
Two series of tests on plain specimens under pure tension and pure torsion, both under a nominal load ratio R = -1;
Two series of tests on V-notched specimens (p=4 mm) under pure tension and pure torsion fatigue loading under a nominal load ratio R=-1;
Two series of tests on V-notched specimens (p=2 mm) under pure tension and pure torsion fatigue loading (with R=-1);
Two series of tests on V-notched specimens (p=0.5 mm) under pure tension and pure torsion fatigue loading (with R=-1);
Four series of tests on V-notched specimens (p=4 mm) under combined tension and torsion loading,
all tested with a biaxiality ratio = a/a=1.2 but under two nominal stress ratios, R=0 and R=-1, and
two phase angles, =0 (in-phase loading), and =90°, (out-of-phase loading);
A series of tests on V-notched specimens (p=4 mm) with a biaxiality ratio =a/a=0.6, and R=1.
Fig. 11 depicts fatigue data from plain and V-notched specimens tested under tension while Fig. 12 summarizes, for the sake of representation, the data from specimens tested under pure torsion loading in combination with a series obtained under multiaxial loading (R=‐1, =90°, =1.2). Finally, Fig. 13 shows the results from the other multiaxial tests. In these Figures the nominal tensile stress and the nominal torsion stress are both referred to the gross transverse area of the specimens.

256
Fig. 11. Data from plain and V-notched specimens made of AISI 416 under pure tension loading (stress
amplitudes referred to the gross sectional area)
Fig. 12. Data from V-notched specimens made of AISI 416 under pure torsion (stress amplitude referred to the
gross section). The data related to multiaxial loading with R= 1, =90°, =1.2 has been reported here for sake of representation
10
100
1000
410 510610
Plain specimens
V‐notch, p = 0.5 mm
V‐notch, p = 2 mm
V‐notch, p = 4 mm
Cycles to failure, N
[MPa]
a,gros
710
AISI 416 steel (hardened and tempered state)
100
1000
410 510 610 710
Plain specimensV‐notch, p = 0.5 mm
V‐notch, p = 2 mmV‐notch, p = 4 mm
V‐notch, p = 4 mm, R=‐1, =90°, =1.2
Cycles to failure, N
[MPa]
ssa,gro
AISI 416 steel (hardened and tempered state)

F. Berto et al. / Engineering Solid Mechanics 5 (2017)
257
Fig. 13. Data from plain and V-notched specimens made of AISI 416 under multiaxial loading (stress
amplitude referred to the gross section).
The results of statistical analyses carried out by assuming a log-normal distribution are summarised in Table 1 and Table 2. In the table the mean values of the nominal stress amplitudes at 2x10⁶ cycles (referred to the net area), the inverse slope k of the Wöhler curves and the scatter index T, which quantifies the width of the scatterband included between the 10 and 90% probabilities of survival curves. All failures from 104 to 2x10⁶ have been processed in the statistical analysis whereas the run-outs were excluded. From the table it is worth noting that plain specimens present a very flat curve with a high value of the inverse slope k. The same happens for the V-notched specimens under torsion loading which are characterized by an inverse slope greater than 13.0 and by a reference stress amplitude at 2x10⁶ cycles not much influenced by the presence of the notch and very close to that obtained from plain specimens. The same behaviour was observed under torsion loading also for 39NiCrMo3 and it is due to plasticity effects at the notch tip.
Table 1. Results from fatigue tests carried out on plain and V-notched specimens made of AISI 416. Mean values (Ps=50%) of the nominal stresses referred to the net transverse section of the specimens (at N=2x10⁶ cycles)
Loading Specimen geometry No
spec. R
A50% [MPa] (A50% [MPa])
k T
T
Tension plain 10 1 348.4 27.5 1.07 Torsion plain 15 1 (236.9) 21.2 1.13 Tension V-notch (p=4 mm) 17 1 115.7 3.4 1.32 Tension V-notch (p=2 mm) 11 1 123.6 4.0 1.43 Tension V-notch (p=0.5 mm) 11 1 236.5 7.2 1.15 Torsion V-notch (p=4 mm) 18 1 (215.0) 13.0 1.14 Torsion V-notch (p=2 mm) 7 1 (221.4) 14.5 1.14 Torsion V-notch (p=0.5 mm) 9 1 (201.1) 13.0 1.09
A50% [MPa] Multi-axial V-notch (p=4 mm) 16 1 1.2 0 103.2 5.7 1.66
V-notch (p=4 mm) 11 1 1.2 90° 93.2 10.4 1.65 V-notch (p=4 mm) 10 0 1.2 0 67.3 4.6 1.64 V-notch (p=4 mm) 8 0 1.2 90° 68.06 7.0 1.43 V-notch (p=4 mm) 5 1 0.6 0 95.3 4.1 1.36
10
100
410 510 610 710
p=4, R= 1, =0, =1.2p=4, R= , =0, =1.2
p=4, R= , =90, =1.2
p=4, R= 1, =0, =0.6
Cycles to failure, N
[MPa]
ssa,gro
AISI 416 steel (hardened and tempered state)

258
Table 2. Stress concentration factors (referred to net area of the specimen) and notch stress intensity factors (NSIFs) for different specimens. (*) Mode I and mode III NSIFs determined by using simplified geometries, all characterised by a notch tip radius equal to zero (nominal stresses equal to 100 MPa).
Material V-notched specimens
(shoulder) Kta
(Axial) Ktt
(Torsion) K1 (*)
(MPa.mm0.455) K3 (*)
(MPa.mm0.333) C40 (SAE 1040) p=4 mm, =0.5 mm 3.68 1.95 (p=4 mm, =0.5 mm) 1.82 39NiCrMo3 p=4 mm, =0.1 mm 7.46 3.17 223 209 AISI416 p=4 mm, =0.1 mm 7.46 3.17 223 209
p=2 mm, =0.1 mm 7.62 3.36 226 219 p=0.5 mm, =0.1 mm 5.35 2.83 154 183
5.1 Fracture surfaces and non-propagating cracks under multiaxial loading
The fracture surface morphology of specimens tested was strongly influenced by the phase angle. Signs of rubbing and abrasion may be observed on all fracture surfaces and the extent to which the rubbing occurred appears to depend on phase angle and on the nominal load ratio. Most severe abrasion appears to occur in predominantly mode III loading and at R= 1 and =90° resulting in a smooth featureless fracture topography. Spherical oxide debris, evidence of wear, can be observed in the scanning electron micrographs. These observations suggest that the cyclic shear displacement at R= 1 must be considerably larger than those at R=0 to overcome the crack surface interferences and higher nominal stress intensity factor values are required to extend the crack. Fatigue crack initiation occurred very rapidly under torsion loading and fatigue cracks of detectable size were observed on the notch surfaces after a period ranging from 5 to 10 percent of the total fatigue life of the specimen. Fracture surfaces of some specimens tested under multiaxial conditions are shown in Fig. 14. The specimens were tested at different load ratio (R= 1 and R=0) and different phase angles (=0 and =90°). By considering in-phase loading cases shown in Fig. 14a-b, some observations can be drawn: Under high-cycle fatigue, few cracks nucleate, and the crack propagation phase takes a significant
fraction of the fatigue life of the specimen. Under low-cycle fatigue, the number of initiated cracks increases, and the propagation phase is much reduced;
The inclination of the planes of crack propagation is less than the 45 that occurs under pure torsional loading. This is due to the change in the angle of the opening displacements from 45 to 0 as the level of axial load increases.
Cracks nucleate at the notch tip and propagate in a radial direction around an axis which is not coincident with the specimen axis;
The irregular surface corresponding to the final static failure is not perpendicular with the specimen axis, indicating a non-uniform crack propagation front from the outside toward the centre of the specimen;
Under out-of-phase loading, the fracture surface is smoother and more polished than that obtained from the in-phase tests, as shown in Figure 14c-d. The fracture surface is generally flatter than for the in-phase tests. This may be due to the increased abrasion and creating of debris that was observed in these tests. The main features were as follows:
In the zone of crack initiation micro-fusion zones due to the interference between the cracks surfaces are well visible. During the tests, in fact, the two surfaces of the cracks scrape each other emanating powder from the notch tip.
The phenomenon of powder formation during the tests is relevant for R=-1 both at high cycle and low cycle regime
This phenomenon was also present at R=0 and it was more pronounced at low cycle fatigue for high stress levels. This could be the possible explanation of the observed change in slope of the out-of-phase fatigue curve with respect to the in-phase one, with a slight reduction of the fatigue strength under high cycle regime.

F. Berto et al. / Engineering Solid Mechanics 5 (2017)
259
In that case R=0 and =90° the friction zones are smaller than those visible in the case of R=-1 both at low and high cycle fatigue
N = 1033659, a, net = 110 MPa N = 780741, a, net = 80 MPa.
R= 1, l=1.2, =0 R=0, =1.2, =0
N = 1766482, a, net = 70 MPa. N = 489441, a, net = 130 MPa
R=0, =1.2, =90° R=-1, =1.2, =90°
Fig. 14. Fracture surfaces from AISI 416 specimens for different phase angles and nominal load ratios Some run-out specimens were sectioned and polished in the longitudinal direction, as shown in Fig. 15, and examined to investigate the presence of cracks and their paths. On samples survived after 5x10⁶ cycles, cracks of significant length have been observed. In Figure 15a the length of the crack reaches approximately 0.8 mm under out-of-phase loading and 0.15 mm under in-phase loading (Fig. 15b). As observed also in Berto et al. (2017), under prevalent torsion loading or when the interference between the fracture surface is elevate, the plastic zone ahead the notch tip and the interference mechanisms due to the reciprocal scraping of the fracture surfaces might modify the initiation and propagation phase. This can result in changing the velocity of propagation and permitting a major development in length of the cracks.
(a) N = 5000000, a,net = 100 MPa R= 1, = 1.2 e = 90°
(a) (b)
(c) (d)

260
(b) N = 5000000, a,net = 100 MPa R= 1, = 1.2 e = 0°
Fig. 15. Non-propagating cracks in AISI 416 specimens for out-of-phase loading (a) and in-phase loading (b)
5.2 A synthesis in terms of linear elastic Strain Energy Density averaged over a control volume
Due to the reduced radius, the results from V-notched specimens will be presented here in terms of Mode 1 and Mode 3 elastic notch stress intensity factors K1 and K3. These stress field parameters have been determined by FE analyses by assuming a simplified model with a sharp V-notch (=0, see Lazzarin et al., 2004). In particular by considering a local (r, ,z) coordinate system, with z coincident with the longitudinal axis of the specimens, the following definitions are used for Mode 1 and Mode 3 Notch Stress Intensity Factors:
)0,r(rlim2K 11
0r1
, (3)
)0,r(rlim2K z1
0r3
3
. (4)
Lazzarin et al. (2004) widely used the expressions above to assess the multiaxial fatigue strength of welded tube-to flange joints subjected to mixed, I+III, loading. For a V-notch opening angle equal to 90 degrees, the exponents are (11)= 0.455 and (13)= 0.333. Obviously, it is always possible, under linear elastic hypothesis, to link the NSIF to the nominal stress components by means of the following expressions:
nom1
111pkK , (5a)
nom1
333pkK , (5b)
where p is the notch depth (p=4.0 mm) and k1=1.183 and k3 =1.306 are non dimensional factors that can be obtained from the FE analyses and play the role of shape functions as happens in linear elastic fracture mechanics. For a notch depth p=2.0 mm k1=1.648 and k3 = 1.737 while for p=0.5 k1=2.112 and k3 = 2.306. Finally, useful expressions for the specimens used in this study can be obtained by using Eq. (6a) and Eq. (6b) with the known geometrical constants. For example, when p=4 the expressions are:
nom1 223.2K , (in MPamm0.455) (6a)
nom3 072.2K . (in MPamm0.333 ) (6b)
In the presence of an axis-symmetric geometry weakened by a circumferential V-notch the averaged SED over a control volume can be expressed under linear elastic hypothesis according to the following equation:

F. Berto et al. / Engineering Solid Mechanics 5 (2017)
261
)()( 31 12
3
2
3312
1
2
11 R
Ke
R
Ke
E
1W ,
(7)
where K1 and K3 are the mode I and Mode III Notch Stress Intensity Factors (NSIFs), R1 and R3 are the radiuses of the control volume under Mode I and Mode III loadings, e1 and e3 are two parameters that quantifies the influence of all stresses and strains over the control volume. The control radiuses R1 and R3 can be estimated considering separately the mode I and mode III loadings, by means of the following equations:
11
1
A1
A111
Ke2R
,
(8a)
31
1
3
333
K
1
eR
A
A .
(8b)
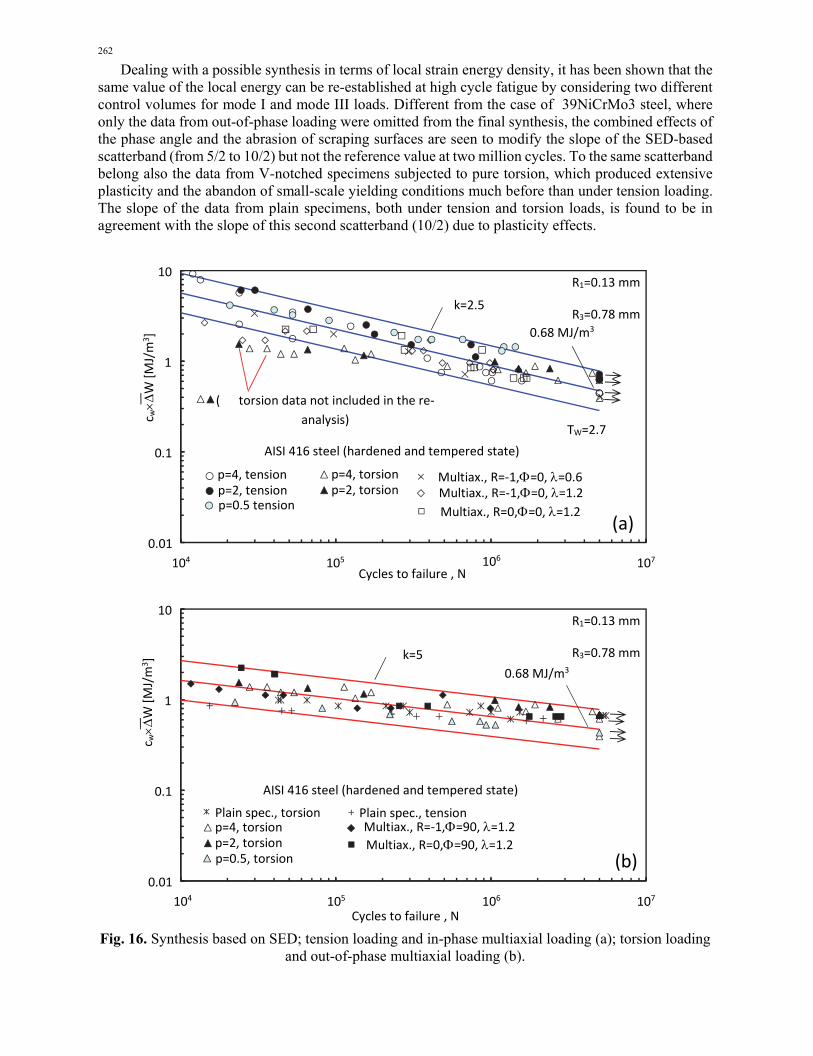
In the following, for the sake of simplicity, the stress ranges and the NSIF ranges have been referred at the same number of cycles, NA=2x10⁶. Then, we have: For mode I loading: K1A=512 MPamm0.455 and 1A=697 MPa. For mode III loading: K3A=891 MPamm0.333 and 3A= 474 MPa. When the opening angle is 290°, exponents and the parameters assume the following values: 1=0.5445, 3=0.6667, e1=0.1462 and e3=0.3103 (with the Poisson’s ratio =0.3). As a result, Eqs 8a and 8b give: R1=0.13 mm and R3=0.78 mm. Under linear elastic hypothesis, the contribution ascribable to the stress component will be average over a control volume of radius R1, that ascribable to the stress component will be averaged over a control volume of radius R3. The later radius definition is strongly influenced from crack interference and contact between mating surfaces as widely discussed for 39NiCrMo3 steel by Berto et al. (2011a). The strong difference detected between the two radii might be thought of as a consequence of the crack surface contact which, provoked a strong difference between the KIII,th and the threshold value of the shielding stress intensity factor range able to assure a non-propagating crack of about 0.5-0.6 mm(see Yu et al. (1998)). The fatigue results are summarised in terms of SED in Figure 16. In order to unify in the same diagram the fatigue results from both R=1 and R=0, the weighting parameter cW has to be applied to the theoretical NSIFs, according to a simple rule reported by Lazzarin et al. (2004). This rule states, in particular, cW=1.0 for R=0 and cW=0.5 for R=1. As a result the fatigue strength range for
R=1, increases according to a factor 2 with respect to the R=0 case, in agreement with Eurocode and IIW Recommendations for stress relieved welded components. In Fig. 16 two separate scatterbands are defined. The former is characterized by an inverse slope equal to 5/2 and a scatter index TW=2.7 (Fig. 16a); it includes the data from V-notched specimens under tension loading characterized by different notch depths (3 series) and all the data from V-notched specimens under in-phase multiaxial loading, independent of the load ratio and the biaxiality ratio (3 series). The data from V-notched specimens with a notch depth p=2 mm and p=4 mm fall inside that scatterband at high cycle fatigue whereas some data show a lower value of strain energy density at low cycle fatigue. The second scatterband (Fig. 16b) presents a flatter inverse slope equal to 10/2, a scatter index TW=2.7 and a value of the strain energy density at 2x10⁶ cycles equal to that of the previous scatterband. The second scatterband includes the data from plain specimens under tension loading, V-notched specimens under out-of-phase multiaxial loading and finally the V-notched specimens with p=0.5 mm under torsion loading. Also the torsion data from V-notched specimens with p=2 and 4 mm, which fall outside the first band at low cycle fatigue, should be included in this second scatterband.
262
Dealing with a possible synthesis in terms of local strain energy density, it has been shown that the same value of the local energy can be re-established at high cycle fatigue by considering two different control volumes for mode I and mode III loads. Different from the case of 39NiCrMo3 steel, where only the data from out-of-phase loading were omitted from the final synthesis, the combined effects of the phase angle and the abrasion of scraping surfaces are seen to modify the slope of the SED-based scatterband (from 5/2 to 10/2) but not the reference value at two million cycles. To the same scatterband belong also the data from V-notched specimens subjected to pure torsion, which produced extensive plasticity and the abandon of small-scale yielding conditions much before than under tension loading. The slope of the data from plain specimens, both under tension and torsion loads, is found to be in agreement with the slope of this second scatterband (10/2) due to plasticity effects.
Fig. 16. Synthesis based on SED; tension loading and in-phase multiaxial loading (a); torsion loading
and out-of-phase multiaxial loading (b).
0.01
0.1
1
10
410 510 610 710
p=2, tensionp=0.5 tension
p=4, tensionp=2, torsion
Multiax., R=0,=0, =1.2
Multiax., R=‐1,=0, =1.2Multiax., R=‐1,=0, =0.6
k=2.5
30.68 MJ/m
=0.13 mm1R
=0.78 mm3R
Cycles to failure , N
]3
W [MJ/m
wc
=2.7WT
AISI 416 steel (hardened and tempered state)
(a)
p=4, torsion
( torsion data not included in the re‐
analysis)
0.01
0.1
1
10
410 510 610 710Cycles to failure , N
]3
W [MJ/m
wc
Plain spec., torsion
p=2, torsionp=0.5, torsion
p=4, torsion
Multiax., R=0,=90, =1.2Multiax., R=‐1,=90, =1.2Plain spec., tension
k=5 30.68 MJ/m
=0.13 mm1R
=0.78 mm3R
AISI 416 steel (hardened and tempered state)
(b)
F. Berto et al. / Engineering Solid Mechanics 5 (2017)
263
6. Synthesis of data from Ti6Al4V notched specimens
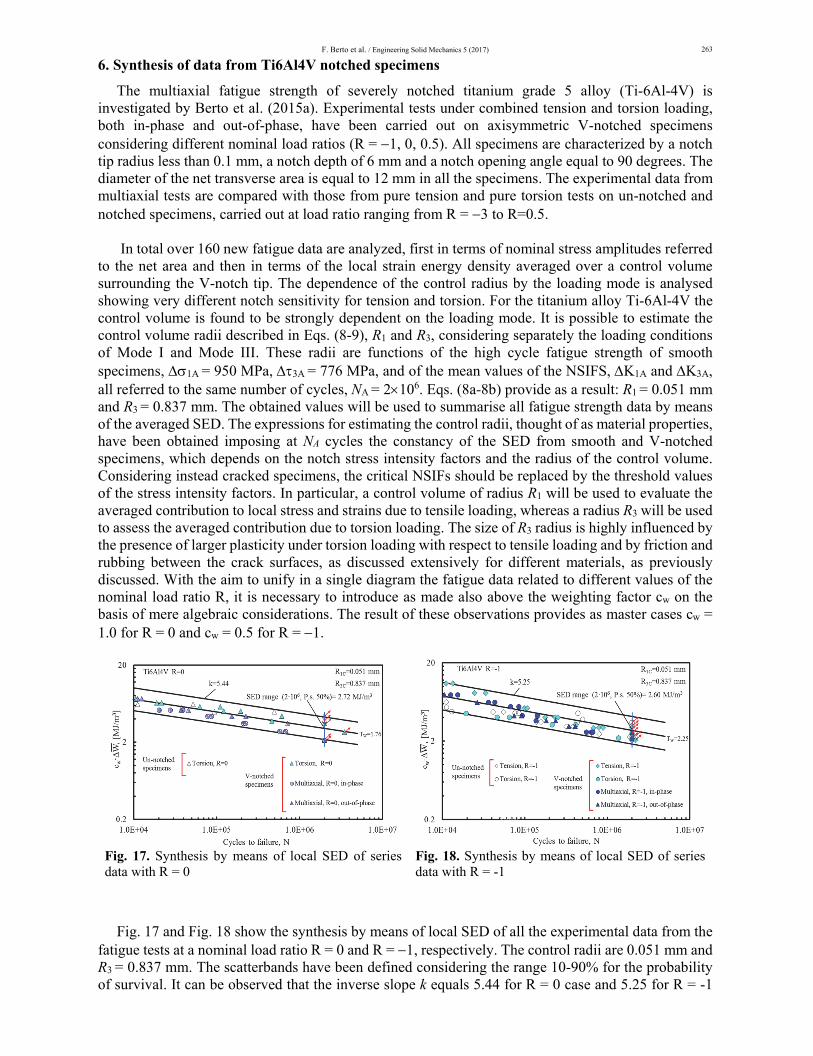
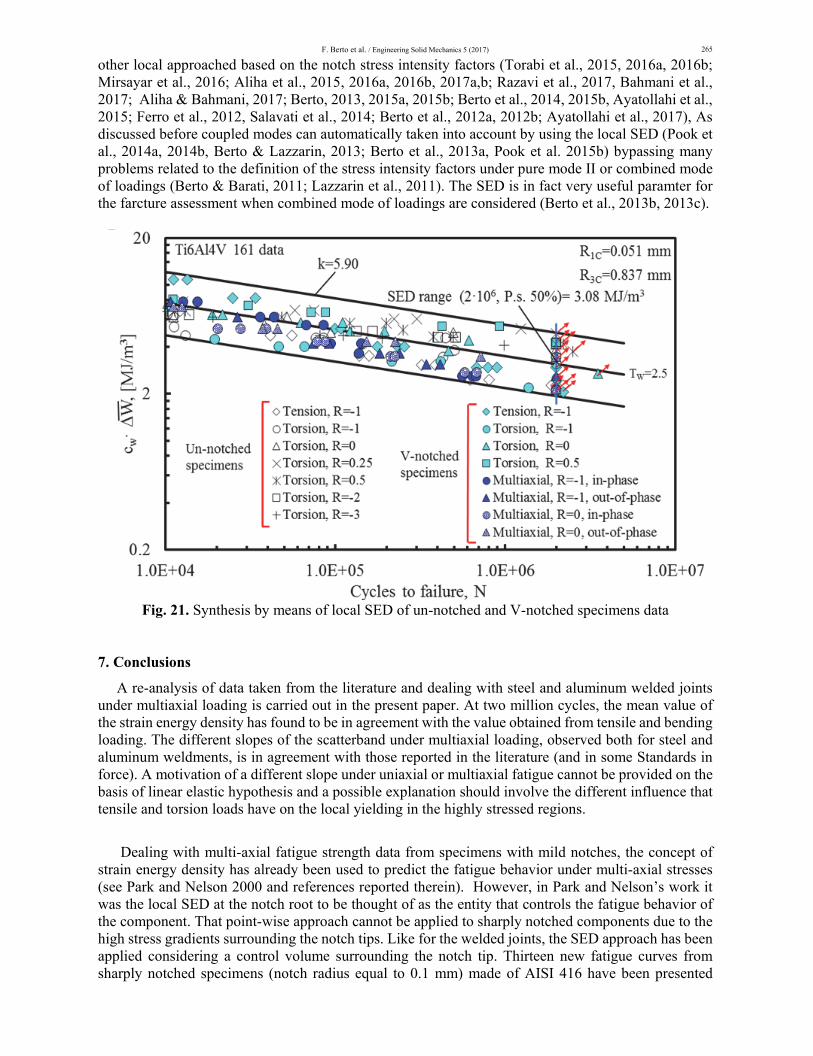
The multiaxial fatigue strength of severely notched titanium grade 5 alloy (Ti-6Al-4V) is investigated by Berto et al. (2015a). Experimental tests under combined tension and torsion loading, both in-phase and out-of-phase, have been carried out on axisymmetric V-notched specimens considering different nominal load ratios (R = 1, 0, 0.5). All specimens are characterized by a notch tip radius less than 0.1 mm, a notch depth of 6 mm and a notch opening angle equal to 90 degrees. The diameter of the net transverse area is equal to 12 mm in all the specimens. The experimental data from multiaxial tests are compared with those from pure tension and pure torsion tests on un-notched and notched specimens, carried out at load ratio ranging from R = 3 to R=0.5. In total over 160 new fatigue data are analyzed, first in terms of nominal stress amplitudes referred to the net area and then in terms of the local strain energy density averaged over a control volume surrounding the V-notch tip. The dependence of the control radius by the loading mode is analysed showing very different notch sensitivity for tension and torsion. For the titanium alloy Ti-6Al-4V the control volume is found to be strongly dependent on the loading mode. It is possible to estimate the control volume radii described in Eqs. (8-9), R1 and R3, considering separately the loading conditions of Mode I and Mode III. These radii are functions of the high cycle fatigue strength of smooth specimens, 1A = 950 MPa,3A = 776 MPa, and of the mean values of the NSIFS, K1A and K3A, all referred to the same number of cycles, NA = 2106. Eqs. (8a-8b) provide as a result: R1 = 0.051 mm and R3 = 0.837 mm. The obtained values will be used to summarise all fatigue strength data by means of the averaged SED. The expressions for estimating the control radii, thought of as material properties, have been obtained imposing at NA cycles the constancy of the SED from smooth and V-notched specimens, which depends on the notch stress intensity factors and the radius of the control volume. Considering instead cracked specimens, the critical NSIFs should be replaced by the threshold values of the stress intensity factors. In particular, a control volume of radius R1 will be used to evaluate the averaged contribution to local stress and strains due to tensile loading, whereas a radius R3 will be used to assess the averaged contribution due to torsion loading. The size of R3 radius is highly influenced by the presence of larger plasticity under torsion loading with respect to tensile loading and by friction and rubbing between the crack surfaces, as discussed extensively for different materials, as previously discussed. With the aim to unify in a single diagram the fatigue data related to different values of the nominal load ratio R, it is necessary to introduce as made also above the weighting factor cw on the basis of mere algebraic considerations. The result of these observations provides as master cases cw = 1.0 for R = 0 and cw = 0.5 for R = 1.
Fig. 17. Synthesis by means of local SED of series data with R = 0
Fig. 18. Synthesis by means of local SED of series data with R = -1
Fig. 17 and Fig. 18 show the synthesis by means of local SED of all the experimental data from the fatigue tests at a nominal load ratio R = 0 and R = 1, respectively. The control radii are 0.051 mm and R3 = 0.837 mm. The scatterbands have been defined considering the range 10-90% for the probability of survival. It can be observed that the inverse slope k equals 5.44 for R = 0 case and 5.25 for R = -1

264
case, while the corresponding values of the strain energy density at 2×10⁶ cycles are 2.72 MJ/m3 and 2.60 MJ/m3. The SED-based scatter index TW is 1.76 for R = 0 and 2.25 for R = -1 case, which would become equal to 1.33 and 1.50 respectively once reconverted a posteriori into equivalent stress-based scatter indexes T, by simply making the square root of the SED values. The values of the equivalent scatter index are satisfactory for engineering strength assessment, considering that each synthesis is performed on fatigue data from un-notched and V-notched specimens under pure tension, pure torsion or combined tension-torsion loading, both in phase and out-of-phase.
Fig. 19. Synthesis by means of local SED of un-notched specimens data under pure torsion
Fig. 20. Synthesis by means of local SED of V-notched specimens data
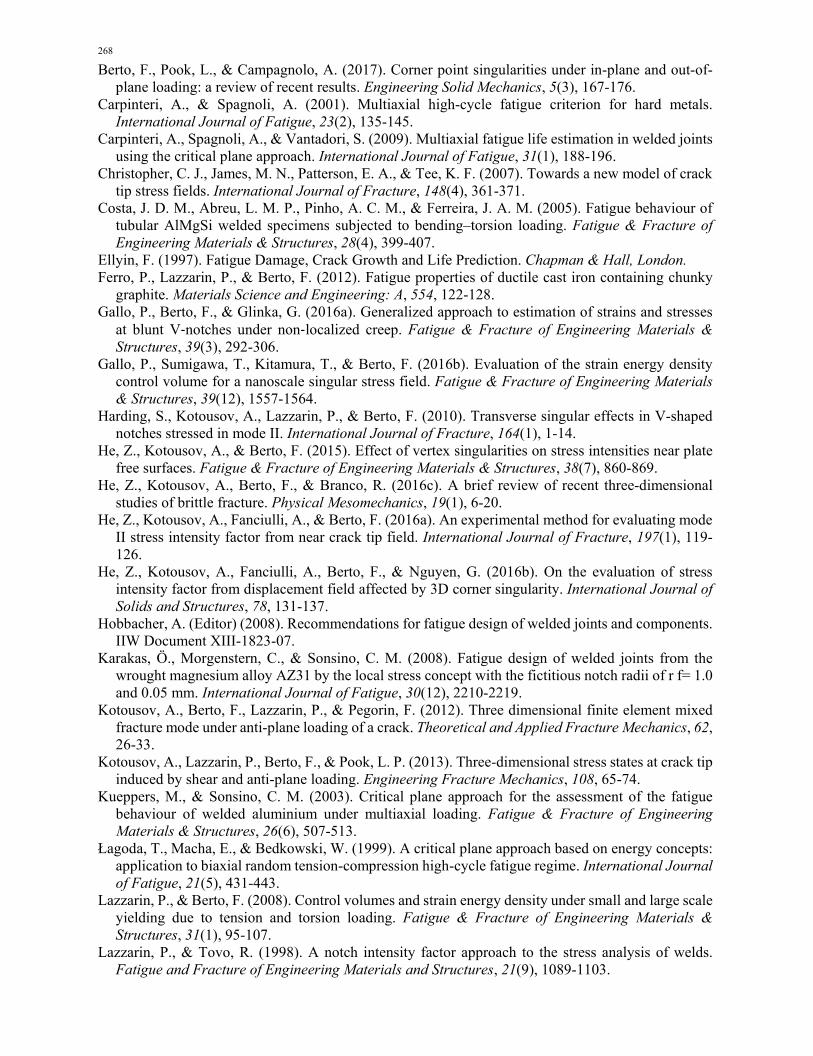
Fig. 19 and Fig. 20 show instead the synthesis by means of average SED of all the experimental data from the fatigue tests of un-notched and V-notched specimens, respectively. Also in this case two control radii equal to R1 = 0.051 mm and R3 = 0.837 mm respectively have been used. It can be observed that the inverse slope k of the scatterbands equals 6.54 for un-notched specimens and 5.86 for V-notched ones, while the values of the strain energy density at 2×10⁶ cycles are equal to 3.34 MJ/m3 and 3.09 MJ/m3, respectively. In this case TW equals 2.50 for un-notched specimens and 2.20 for V-notched ones, which would give 1.58 and 1.48 respectively once reconverted a posteriori into equivalent stress-based scatter indexes T. Also in this case the values of the scatter index are very satisfactory, given that the synthesis are based on fatigue data respectively from un-notched specimens under pure tension and torsion with different values of the load ratio and from V-notched specimens under pure tension, pure torsion or combined tension-torsion loading, with different values both of the load ratio and the phase angle. Finally in Fig. 21 the synthesis in terms of SED of all the fatigue strength data presented in this contribution is shown. Again two different control radii equal to R1 = 0.051 mm and R3 = 0.837 mm respectively have been adopted. The scatterband includes all the data from un-notched and V-notched specimens under pure tension, pure torsion and multiaxial loading, regardless of the load ratio and the phase angle. It is also characterized by an inverse slope k equal to 5.90, a scatter index TW = 2.5 and a value of the strain energy density at the reference number of cycles, NA = 2106, that equals 3.08 MJ/m3. The equivalent stress-based scatter index T results to be 1.58, that is comparable with that observed in the Haibach scatterband (T= 1.50). From Fig. 21 the unifying capacity of the SED approach can be easily observed, in fact it is capable of synthesize all the fatigue strength data in a single quite-narrow scatterband regardless of the loading mode and the specimens geometry.
It is worth mentioning that some recent interesting applications have been considered by using the SED approach including multiscale approaches and high temperature (He et al., 2015; Berto et al., 2014; Berto et al., 2015b, 2015c; Gallo et al., 2016a, 2016b). The SED is also able to automatically take into account three-dimensional effects and induced modes generally occurring in real structures (Berto et al., 2004; Berto & Lazzarin, 2010; Berto et al., 2011b; 2011c, 2011d, 2012a, 2013a, 2017; Harding et al., 2010; Pook et al. 2015a, 2016, 2017; He et al., 2016a, 2016b, 2016c; Kotousov et al., 2012, 2013; Afshar et al. 2013) Different materials and loading conditions have been considered showing the sound applicability of the method to many loading configurations and the connections to
F. Berto et al. / Engineering Solid Mechanics 5 (2017)
265
other local approached based on the notch stress intensity factors (Torabi et al., 2015, 2016a, 2016b; Mirsayar et al., 2016; Aliha et al., 2015, 2016a, 2016b, 2017a,b; Razavi et al., 2017, Bahmani et al., 2017; Aliha & Bahmani, 2017; Berto, 2013, 2015a, 2015b; Berto et al., 2014, 2015b, Ayatollahi et al., 2015; Ferro et al., 2012, Salavati et al., 2014; Berto et al., 2012a, 2012b; Ayatollahi et al., 2017), As discussed before coupled modes can automatically taken into account by using the local SED (Pook et al., 2014a, 2014b, Berto & Lazzarin, 2013; Berto et al., 2013a, Pook et al. 2015b) bypassing many problems related to the definition of the stress intensity factors under pure mode II or combined mode of loadings (Berto & Barati, 2011; Lazzarin et al., 2011). The SED is in fact very useful paramter for the farcture assessment when combined mode of loadings are considered (Berto et al., 2013b, 2013c).
Fig. 21. Synthesis by means of local SED of un-notched and V-notched specimens data
7. Conclusions
A re-analysis of data taken from the literature and dealing with steel and aluminum welded joints under multiaxial loading is carried out in the present paper. At two million cycles, the mean value of the strain energy density has found to be in agreement with the value obtained from tensile and bending loading. The different slopes of the scatterband under multiaxial loading, observed both for steel and aluminum weldments, is in agreement with those reported in the literature (and in some Standards in force). A motivation of a different slope under uniaxial or multiaxial fatigue cannot be provided on the basis of linear elastic hypothesis and a possible explanation should involve the different influence that tensile and torsion loads have on the local yielding in the highly stressed regions.
Dealing with multi-axial fatigue strength data from specimens with mild notches, the concept of strain energy density has already been used to predict the fatigue behavior under multi-axial stresses (see Park and Nelson 2000 and references reported therein). However, in Park and Nelson’s work it was the local SED at the notch root to be thought of as the entity that controls the fatigue behavior of the component. That point-wise approach cannot be applied to sharply notched components due to the high stress gradients surrounding the notch tips. Like for the welded joints, the SED approach has been applied considering a control volume surrounding the notch tip. Thirteen new fatigue curves from sharply notched specimens (notch radius equal to 0.1 mm) made of AISI 416 have been presented

266
together with a synthesis of previous data from analogous specimens made of C40 and 39NiCrMo3 steels. The mean value of the SED has been used to summarize the fatigue strength data of the different steels showing that some difficulties arise in the control volume definition mainly due to extensive plasticity provoked by torsion loading and by interference phenomena between the crack surfaces. The constancy of the ‘apparent’ linear elastic SED at high cycle fatigue has been re-established by adopting different volumes under tension and torsion loading. With reference to the new data from specimens made of AISI 416, it has been shown that a linear elastic analysis allows us to summarize all high cycle fatigue strength data by using a single SED value. On the other hand, a flatter inverse slope characterizes the series tested under pure torsion, where the plastic effects were strong, and the series from out-of-phase multiaxial tests, where dissipative phenomena occurred during the tests shortly after the beginning of the fatigue test until the final failure. In the light of the above considerations, two scatterbands have been proposed for fatigue strength assessments of sharply notched components made of AISI 416, from low to high cycle fatigue regime. The different slopes of the curves cannot be justified in the ambit of linear elastic hypotheses but are rather tied to very different nonlinear effects. However, a synthesis can always been carried out by means of the ‘apparent’ linear elastic SED by using different control volumes, which depends on the loading mode and implicitly account for different nonlinear effects. References Afshar, R., Berto, F., Lazzarin, P., & Pook, L. P. (2013). Analytical expressions for the notch stress
intensity factors of periodic V-notches under tension by using the strain energy density approach. The Journal of Strain Analysis for Engineering Design, 48(5), 291-305.
Aliha, M. R. M., Bahmani, A., & Akhondi, S. (2015). Determination of mode III fracture toughness for different materials using a new designed test configuration. Materials & Design, 86, 863-871.
Aliha, M. R. M., Berto, F., Bahmani, A., Akhondi, S., & Barnoush, A. (2016a). Fracture assessment of polymethyl methacrylate using sharp notched disc bend specimens under mixed mode I+ III loading. Physical Mesomechanics, 19(4), 355-364.
Aliha, M. R. M., Bahmani, A., & Akhondi, S. (2016b). A novel test specimen for investigating the mixed mode I+ III fracture toughness of hot mix asphalt composites–Experimental and theoretical study. International Journal of Solids and Structures, 90, 167-177.
Aliha, M. R. M., Berto, F., Bahmani, A., & Gallo, P. (2017a). Mixed mode I/II fracture investigation of Perspex based on the averaged strain energy density criterion. Physical Mesomechanics, 20(2), 149-156.
Aliha, M. R. M., Berto, F., Mousavi, A., & Razavi, S. M. J. (2017b). On the applicability of ASED criterion for predicting mixed mode I+ II fracture toughness results of a rock material. Theoretical and Applied Fracture Mechanics.
Aliha, M. R. M., & Bahmani, A. (2017). Rock Fracture Toughness Study Under Mixed Mode I/III Loading. Rock Mechanics and Rock Engineering, 50(7), 1739-1751.
Atzori, B., Berto, F., Lazzarin, P., & Quaresimin, M. (2006). Multi-axial fatigue behaviour of a severely notched carbon steel. International Journal of Fatigue, 28(5), 485-493.
Ayatollahi, M. R., Razavi, S. M. J., Moghaddam, M. R., & Berto, F. (2015). Mode I fracture analysis of polymethylmetacrylate using modified energy-based models. Physical Mesomechanics, 18(4), 326-336.
Ayatollahi, M., Berto, F., Campagnolo, A., Gallo, P., & Tang, K. (2017). Review of local strain energy density theory for the fracture assessment of V-notches under mixed mode loading. Engineering Solid Mechanics, 5(2), 113-132.
Bahmani, A., Aliha, M. R. M., & Berto, F. (2017). Investigation of fracture toughness for a polycrystalline graphite under combined tensile-tear deformation. Theoretical and Applied Fracture Mechanics.
Berto, F. (2013). A review on coupled modes in V-notched plates of finite thickness: A generalized approach to the problem. Physical Mesomechanics, 16 (4), 378-390.

F. Berto et al. / Engineering Solid Mechanics 5 (2017)
267
Berto, F. (2015a). Crack initiation at V-notch tip under in-plane mixed mode loading: a review of the fictitious notch rounding concept. Physical Mesomechanics, 18(4), 273-282.
Berto, F. (2015b). Some recent results on the fatigue strength of notched specimens made of 40CrMoV13. 9 steel at room and high temperature. Physical Mesomechanics, 18(2), 105-126.
Berto, F., & Barati, E. (2011). Fracture assessment of U-notches under three point bending by means of local energy density. Materials & Design, 32(2), 822-830.
Berto, F., & Lazzarin, P. (2009). A review of the volume-based strain energy density approach applied to V-notches and welded structures. Theoretical and Applied Fracture Mechanics, 52(3), 183-194.
Berto, F., & Lazzarin, P. (2010). On higher order terms in the crack tip stress field. International Journal of Fracture, 161(2), 221-226.
Berto, F., & Lazzarin, P. (2013). Multiparametric full-field representations of the in-plane stress fields ahead of cracked components under mixed mode loading. International Journal of Fatigue, 46, 16-26.
Berto, F., Campagnolo, A., & Ayatollahi, M. R. (2015c). Brittle fracture of rounded V-notches in isostatic graphite under static multiaxial loading. Physical Mesomechanics, 18 (4), pp. 283-297.
Berto, F., Campagnolo, A., & Gallo, P. (2015b). Brittle failure of graphite weakened by V-notches: a review of some recent results under different loading modes. Strength of Materials, 47(3), 488-506.
Berto, F., Campagnolo, A., & Lazzarin, P. (2015a). Fatigue strength of severely notched specimens made of Ti–6Al–4V under multiaxial loading. Fatigue & Fracture of Engineering Materials & Structures, 38(5), 503-517.
Berto, F., Cendon, D. A., Lazzarin, P., & Elices, M. (2013b). Fracture behaviour of notched round bars made of PMMA subjected to torsion at− 60° C. Engineering Fracture Mechanics, 102, 271-287.
Berto, F., Croccolo, D., & Cuppini, R. (2008). Fatigue strength of a fork-pin equivalent coupling in terms of the local strain energy density. Materials & Design, 29(9), 1780-1792.
Berto, F., Kotousov, A., Lazzarin, P., & Pegorin, F. (2013a). On a coupled mode at sharp notches subjected to anti-plane loading. European Journal of Mechanics-A/Solids, 38, 70-78.
Berto, F., Lazzarin, P., & Ayatollahi, M. R. (2013c). Brittle fracture of sharp and blunt V-notches in isostatic graphite under pure compression loading. Carbon, 63, 101-116.
Berto, F., Lazzarin, P., & Kotousov, A. (2011b). On the Presence of the Out–of–Plane Singular Mode Induced by Plane Loading With K II= K I= 0. International Journal of Fracture, 167(1), 119-126.
Berto, F., Lazzarin, P., & Kotousov, A. (2011c). On higher order terms and out-of-plane singular mode. Mechanics of Materials, 43(6), 332-341.
Berto, F., Lazzarin, P., & Marangon, C. (2012b). The effect of the boundary conditions on in-plane and out-of-plane stress field in three dimensional plates weakened by free-clamped V-notches. Physical Mesomechanics, 15 (1-2), pp. 26-36.
Berto, F., Lazzarin, P., & Marangon, C. (2014). Fatigue strength of notched specimens made of 40CrMoV13. 9 under multiaxial loading. Materials & Design, 54, 57-66.
Berto, F., Lazzarin, P., & Wang, C. H. (2004). Three-dimensional linear elastic distributions of stress and strain energy density ahead of V-shaped notches in plates of arbitrary thickness. International Journal of Fracture, 127(3), 265-282.
Berto, F., Lazzarin, P., & Yates, J. (2011). Multiaxial fatigue behaviour of quasi-sharp V-notched specimens made of 39NiCrMo3 steel: a non-conventional application of the local energy. Fatigue and Fracture of Engineering Materials and Structures, 34(11), 921-943.
Berto, F., Lazzarin, P., & Yates, J. (2011a). Multiaxial fatigue behaviour of quasi-sharp V-notched specimens made of 39NiCrMo3 steel: a non-conventional application of the local energy. Fatigue and Fracture of Engineering Materials and Structures, 34(11), 921-943.
Berto, F., Lazzarin, P., Kotousov, A., & Harding, S. (2011d). Out‐of‐plane singular stress fields in V‐notched plates and welded lap joints induced by in‐plane shear load conditions. Fatigue and Fracture of Engineering Materials and Structures, 34(4), 291-304.
Berto, F., Lazzarin, P., Kotousov, A., & Pook, L. P. (2012a). Induced out‐of‐plane mode at the tip of blunt lateral notches and holes under in‐plane shear loading. Fatigue & Fracture of Engineering Materials & Structures, 35(6), 538-555.
268
Berto, F., Pook, L., & Campagnolo, A. (2017). Corner point singularities under in-plane and out-of-plane loading: a review of recent results. Engineering Solid Mechanics, 5(3), 167-176.
Carpinteri, A., & Spagnoli, A. (2001). Multiaxial high-cycle fatigue criterion for hard metals. International Journal of Fatigue, 23(2), 135-145.
Carpinteri, A., Spagnoli, A., & Vantadori, S. (2009). Multiaxial fatigue life estimation in welded joints using the critical plane approach. International Journal of Fatigue, 31(1), 188-196.
Christopher, C. J., James, M. N., Patterson, E. A., & Tee, K. F. (2007). Towards a new model of crack tip stress fields. International Journal of Fracture, 148(4), 361-371.
Costa, J. D. M., Abreu, L. M. P., Pinho, A. C. M., & Ferreira, J. A. M. (2005). Fatigue behaviour of tubular AlMgSi welded specimens subjected to bending–torsion loading. Fatigue & Fracture of Engineering Materials & Structures, 28(4), 399-407.
Ellyin, F. (1997). Fatigue Damage, Crack Growth and Life Prediction. Chapman & Hall, London. Ferro, P., Lazzarin, P., & Berto, F. (2012). Fatigue properties of ductile cast iron containing chunky
graphite. Materials Science and Engineering: A, 554, 122-128. Gallo, P., Berto, F., & Glinka, G. (2016a). Generalized approach to estimation of strains and stresses
at blunt V‐notches under non‐localized creep. Fatigue & Fracture of Engineering Materials & Structures, 39(3), 292-306.
Gallo, P., Sumigawa, T., Kitamura, T., & Berto, F. (2016b). Evaluation of the strain energy density control volume for a nanoscale singular stress field. Fatigue & Fracture of Engineering Materials & Structures, 39(12), 1557-1564.
Harding, S., Kotousov, A., Lazzarin, P., & Berto, F. (2010). Transverse singular effects in V-shaped notches stressed in mode II. International Journal of Fracture, 164(1), 1-14.
He, Z., Kotousov, A., & Berto, F. (2015). Effect of vertex singularities on stress intensities near plate free surfaces. Fatigue & Fracture of Engineering Materials & Structures, 38(7), 860-869.
He, Z., Kotousov, A., Berto, F., & Branco, R. (2016c). A brief review of recent three-dimensional studies of brittle fracture. Physical Mesomechanics, 19(1), 6-20.
He, Z., Kotousov, A., Fanciulli, A., & Berto, F. (2016a). An experimental method for evaluating mode II stress intensity factor from near crack tip field. International Journal of Fracture, 197(1), 119-126.
He, Z., Kotousov, A., Fanciulli, A., Berto, F., & Nguyen, G. (2016b). On the evaluation of stress intensity factor from displacement field affected by 3D corner singularity. International Journal of Solids and Structures, 78, 131-137.
Hobbacher, A. (Editor) (2008). Recommendations for fatigue design of welded joints and components. IIW Document XIII-1823-07.
Karakas, Ö., Morgenstern, C., & Sonsino, C. M. (2008). Fatigue design of welded joints from the wrought magnesium alloy AZ31 by the local stress concept with the fictitious notch radii of r f= 1.0 and 0.05 mm. International Journal of Fatigue, 30(12), 2210-2219.
Kotousov, A., Berto, F., Lazzarin, P., & Pegorin, F. (2012). Three dimensional finite element mixed fracture mode under anti-plane loading of a crack. Theoretical and Applied Fracture Mechanics, 62, 26-33.
Kotousov, A., Lazzarin, P., Berto, F., & Pook, L. P. (2013). Three-dimensional stress states at crack tip induced by shear and anti-plane loading. Engineering Fracture Mechanics, 108, 65-74.
Kueppers, M., & Sonsino, C. M. (2003). Critical plane approach for the assessment of the fatigue behaviour of welded aluminium under multiaxial loading. Fatigue & Fracture of Engineering Materials & Structures, 26(6), 507-513.
Łagoda, T., Macha, E., & Bedkowski, W. (1999). A critical plane approach based on energy concepts: application to biaxial random tension-compression high-cycle fatigue regime. International Journal of Fatigue, 21(5), 431-443.
Lazzarin, P., & Berto, F. (2008). Control volumes and strain energy density under small and large scale yielding due to tension and torsion loading. Fatigue & Fracture of Engineering Materials & Structures, 31(1), 95-107.
Lazzarin, P., & Tovo, R. (1998). A notch intensity factor approach to the stress analysis of welds. Fatigue and Fracture of Engineering Materials and Structures, 21(9), 1089-1103.

F. Berto et al. / Engineering Solid Mechanics 5 (2017)
269
Lazzarin, P., & Zambardi, R. (2001). A finite-volume-energy based approach to predict the static and fatigue behavior of components with sharp V-shaped notches. International Journal of Fracture, 112(3), 275-298.
Lazzarin, P., Berto, F., & Radaj, D. (2009a). Stress intensity factors of welded lap joints: a comparison between pointed slit based and keyhole notch based models, with extensions to strain energy density and J-integral. Fatigue and Fracture of Engineering Materials and Structures, 32, 713-735.
Lazzarin, P., Berto, F., & Radaj, D. (2009b). Fatigue‐relevant stress field parameters of welded lap joints: pointed slit tip compared with keyhole notch. Fatigue & Fracture of Engineering Materials & Structures, 32(9), 713-735.
Lazzarin, P., Berto, F., & Zappalorto, M. (2010). Rapid calculations of notch stress intensity factors based on averaged strain energy density from coarse meshes: Theoretical bases and applications. International Journal of Fatigue, 32(10), 1559-1567.
Lazzarin, P., Berto, F., Gomez, F. J., & Zappalorto, M. (2008b). Some advantages derived from the use of the strain energy density over a control volume in fatigue strength assessments of welded joints. International Journal of Fatigue, 30(8), 1345-1357.
Lazzarin, P., Livieri, P., Berto, F., & Zappalorto, M. (2008a). Local strain energy density and fatigue strength of welded joints under uniaxial and multiaxial loading. Engineering Fracture Mechanics, 75(7), 1875-1889.
Lazzarin, P., Livieri, P., Berto, F., & Zappalorto, M. (2008c). Local strain energy density and fatigue strength of welded joints under uniaxial and multiaxial loading. Engineering Fracture Mechanics, 75(7), 1875-1889.
Lazzarin, P., Sonsino, C. M., & Zambardi, R. (2004). A Notch Stress Intensity approach to predict the fatigue behaviour of T butt welds between tube and flange when subjected to in–phase bending and torsion loading. Fatigue and Fracture of Engineering Materials and Structures, 27(2), 127-141.
Lazzarin, P., Zappalorto, M., & Berto, F. (2011). Generalised stress intensity factors for rounded notches in plates under in-plane shear loading. International Journal of Fracture, 170(2), 123-144.
Lin, B., Mear, M. E., & Ravi-Chandar, K. (2010). Criterion for initiation of cracks under mixed-mode I+ III loading. International Journal of Fracture, 165(2), 175-188.
Livieri, P., & Lazzarin, P. (2005). Fatigue strength of steel and aluminium welded joints based on generalised stress intensity factors and local strain energy values. International Journal of Fracture, 133(3), 247-276.
Niesłony, A., & Sonsino, C. M. (2008). Comparison of some selected multiaxial fatigue assessment criteria. LBF Report No. FB-234.
Mirsayar, M. M., Berto, F., Aliha, M. R. M., & Park, P. (2016). Strain-based criteria for mixed-mode fracture of polycrystalline graphite. Engineering Fracture Mechanics, 156, 114-123.
Park, J., & Nelson, D. (2000). Evaluation of an energy-based approach and a critical plane approach for predicting constant amplitude multiaxial fatigue life. International Journal of Fatigue, 22(1), 23-39.
Pook, L. P., & Sharples, J. K. (1979). The mode III fatigue crack growth threshold for mild steel. International Journal of Fracture, 15(6), R223-R226.
Pook, L. P. (1985). The fatigue crack direction and threshold behaviour of mild steel under mixed mode I and III loading. International Journal of Fatigue, 7(1), 21-30.
Pook, L. P., Berto, F., Campagnolo, A., & Lazzarin, P. (2014). Coupled fracture mode of a cracked disc under anti-plane loading. Engineering Fracture Mechanics, 128, 22-36.
Pook, L. P., Campagnolo, A., Berto, F., & Lazzarin, P. (2015a). Coupled fracture mode of a cracked plate under anti-plane loading. Engineering Fracture Mechanics, 134, 391-403.
Pook, L. P., Campagnolo, A., & Berto, F. (2016). Coupled fracture modes of discs and plates under anti‐plane loading and a disc under in‐plane shear loading. Fatigue & Fracture of Engineering Materials & Structures, 39(8), 924-938.
Radaj, D. (1969). Approximate calculation of the stress concentration factor of welded joints. Schweissen Schneiden, 21(3), 97-103.
Pook, L. P., Berto, F., & Campagnolo, A. (2017). State of the art of corner point singularities under in-plane and out-of-plane loading. Engineering Fracture Mechanics, 174, 2-9.
Radaj, D. (1990). Design and analysis of fatigue resistant welded structures. Elsevier.

270
Radaj, D., Sonsino, C. M., & Fricke, W. (2006). Fatigue assessment of welded joints by local approaches. Woodhead publishing.
Radaj, D., Lazzarin, P., & Berto, F. (2009). Fatigue assessment of welded joints under slit-parallel loading based on strain energy density or notch rounding. International Journal of Fatigue, 31(10), 1490-1504.
Razavi, S. M. J., Aliha, M. R. M., & Berto, F. (2017). Application of an average strain energy density criterion to obtain the mixed mode fracture load of granite rock tested with the cracked asymmetric four-point bend specimens. Theoretical and Applied Fracture Mechanics.
Razmjoo, G.R. (1996) Fatigue of Load-Carrying Fillet Welded Joints Under Multiaxial Loadings. TWI, Cambridge, UK: Abington (TWI REF. 7309.02/96/909).
Ritchie, R. O. (1988). Mechanisms of fatigue crack propagation in metals, ceramics and composites: role of crack tip shielding. Materials Science and Engineering: A, 103(1), 15-28.
Salavati, H., Alizadeh, Y., & Berto, F. (2014). Effect of notch depth and radius on the critical fracture load of bainitic functionally graded steels under mixed mode I+ II loading. Physical Mesomechanics, 17(3), 178-189.
Siljander, A., Kurath, P., & Lawrence, F. V. (1992). Nonproportional fatigue of welded structures. In Advances in fatigue lifetime predictive techniques. ASTM STP 1122 (Edited by M. R. Mitchell and R. Landgraf). Philadelphia ASTM, PA, 319–338.
Sonsino, C. M. (1995). Multiaxial fatigue of welded joints under in-phase and out-of-phase local strains and stresses. International Journal of Fatigue, 17(1), 55-70.
Sonsino, C. M., Fricke, W., De Bruyne, F., Hoppe, A., Ahmadi, A., & Zhang, G. (2012). Notch stress concepts for the fatigue assessment of welded joints–Background and applications. International Journal of Fatigue, 34(1), 2-16.
Tong, J., Yates, J. R., & Brown, M. W. (1996). Some aspects of fatigue thresholds under mode III and mixed mode III and I loadings. International Journal of Fatigue, 18(5), 279-285.
Torabi, A. R., Campagnolo, A., & Berto, F. (2015). Tensile fracture analysis of V-notches with end holes by means of the local energy. Physical Mesomechanics, 18(3), 194-202.
Torabi, A. R., Berto, F., & Campagnolo, A. (2016a). Elastic-plastic fracture analysis of notched Al 7075-T6 plates by means of the local energy combined with the equivalent material concept. Physical Mesomechanics, 19(2), 204-214.
Torabi, A. R., Campagnolo, A., & Berto, F. (2016b). A successful combination of the equivalent material concept and the averaged strain energy density criterion for predicting crack initiation from blunt V-notches in ductile aluminum plates under mixed mode loading. Physical Mesomechanics, 19(4), 382-391.
Ye, D., Hertel, O., & Vormwald, M. (2008). A unified expression of elastic–plastic notch stress–strain calculation in bodies subjected to multiaxial cyclic loading. International Journal of Solids and Structures, 45(24), 6177-6189.
Yu, H. C., Tanaka, K., & Akiniwa, Y. (1998). Estimation of torsional fatigue of medium carbon steel bars with a circumferential crack by the cyclic resistance-curve method. Fatigue & Fracture of Engineering Materials & Structures, 21(9), 1067-1076.
Yung, J.Y., & Lawrence, F.V. (1986) Predicting the Fatigue Life of Welds Under Combined Bending and Torsion. Report No. 125, UIL-ENG 86-3602, University of Illinois at Urbana-Champaign.
© 2017 by the authors; licensee Growing Science, Canada. This is an open access article distributed under the terms and conditions of the Creative Commons Attribution (CC-BY) license (http://creativecommons.org/licenses/by/4.0/).