a risk-consequence hazard rating system for missouri...
TRANSCRIPT
Youssef, A., Maerz, N. H., and, Fritz, M. A., 2003. A risk-consequence hazard rating system for Missouri highways. 54th Highway Geology Symposium, Burlington, Vermont, Sep. 24-26, 2003, pp 175-195.
A Risk-Consequence Hazard Rating System for Missouri Highway Rock Cuts
Ahmed Youssef, University of Missouri-Rolla, 1006 Kingshighway, Rolla, MO, 65409-0660, Tel: (573) 341-6714, Fax: 573 341-4368,
Fax: 573 341-4729, Email: [email protected]
Norbert H. Maerz, University of Missouri-Rolla, 1006 Kingshighway, Rolla, MO, 65409-0660, Tel: (573) 341-6714, Fax:
573 341-4368, Email: [email protected]
Mike A. Fritz, Missouri Department of Transportation, 1617 Missouri Boulevard, Jefferson City, Missouri 65109, Tel: 573-526-4346, Fax: 573-526-4345, Email: [email protected]
Abstract A new method for the analysis of rockfall hazards along roads of the Missouri State Highway System is described here. Existing rockfall hazard rating systems focus on the risk of failure and ignore the consequence of failure, or they lump the ratings for risk and consequence together. In this new method, risk and consequence factors are given equal weight and isolated from each other. The ratings for the categories that related to risk or consequence are easy to determine and are more objective. The risk – consequence rating system can be used by DOT’s to cost effectively determine the need, priority, and design of maintenance on rock cuts, in order to provide the safety and convenience of the motoring public demands and also to reduce the consequence that will affect the falling rocks on the road by decreasing the risk of vehicle damage and traffic delays. The risk–consequence system named the Missouri Rockfall Hazard Rating System (MORH RS) utilizes two phases; 1) Identification of the most potentially problematic rock cuts, by using mobile digital video logging, and 2) Using the system to characterize and prioritize remediation for the potentially problematic rock cuts identified in phase 1. In phase 2 three types of parameters are evaluated; 1) parameters such as slope height, slope angle, ditch width, ditch depth, shoulder width, block size, number of lanes, ditch capacity, and expected rockfall quantity can be measured on computer scaled video images, parameters such as weathering, face irregularities, face looseness, strength of intact rocks, water on the face, and design sight distance are descriptive, and 3) parameters such as average daily traffic and average vehicle risk are obtained from the Department of Transportation for each section of road. The system has been tested on sections of Missouri Highways 63 and 65, and Interstate Highway 44.
Introduction Construction and maintenance of highways and railways in rocky and mountainous regions presents a special challenge to geologists and geotechnical engineers. Because there are thousands of highways, and hundreds of thousands of highway miles it is difficult do sufficient stability assessments for each of the rock cut along the routes.
For that reason most highway cuts tend to be designed, constructed, and maintained on the basis of rather rudimentary geotechnical analyses concerning the stability of the slopes against major sliding or toppling failures. Only the populated areas in highly developed countries receive even this type of care and analysis (1).
Rockfalls take place every year during the rainy seasons in both natural and man made slopes, especially along the road cuts of the hilly areas. These rockfalls block roads, damage infrastructure, and cause injuries and fatalities to occur. According to the Department of Highway in Washington State a significant number of accidents and nearly a half dozen fatalities have occurred because of rockfalls in the last 30 years … and…. 45 % of all unstable slope problems are rockfall related (2). In Canada almost 13 people died because of rockfall in the last 87 years, most of them on British Columbia highways (3).
Because of the difficulty of carrying out detailed investigations and analyses on the miles of highway in the United States and Canada, most of the Department of Transportation’s try to design a good rating system to save them time and money. These systems are designed to be simple, relying primarily on visual inspection and simple calculations. The importance of these rating systems is to identify slopes which may be particularly hazardous and which require further more detailed study.
Analyses that are used for slope stability Planar and wedge sliding and toppling mechanisms In this type of failure mechanism the discontinuities are oriented in such a way that they contribute to create wedges, planar sliding blocks, or toppling blocks. Franklin and Senior report that of 415 analyzed cases of failure in Northern Ontario, Canada, only 33% of failures involved these mechanisms (23% toppling, 8% planar sliding, 2% wedge sliding) (4). These types of failures are however easy to analyze, and can range from limiting equilibrium analysis to numerical modeling (5). Raveling type failure mechanism Previous studies in Northern Ontario, reported that 65% of the failures were of the raveling type (4). These included raveling, overhang/undercutting failure, ice jacking, and rolling blocks. In other terrains, most notably flat lying sedimentary rock with vertical jointing, where planar and wedge slides are unusually not found, the predominant failure mechanism being of the raveling type is even greater. These raveling failures whether slow, time-dependent or fast and catastrophic are much more difficult to analyze. Analytical techniques for prediction are non-effective, and remediation judgments are typically made with on-site engineering judgment of an experienced specialist, who must then balance the risk in terms of probability of failure and consequence of failure, against
the cost of effective remediation. The use of empirical design and rock mass classification become important (6).
Empirical Design and Rock Mass Characterization Empirical design is a design methodology that does not use formal design methods, and calculations or analytical equations or modeling or such. Instead it relies on experience and judgment of the engineer. The realization of empirical design that uses not only individual experience, but also the cumulative experiences of many comes from the following principles:
1. Description of ground quality, 2. Description of ground performance, 3. Correlation of the above two based on a study of case histories.
Design schemes like this are common in the mining and tunneling industries, and are described by Singh and Goel (7). Examples of such classification systems that include elements of design include several different classes of systems. Systems that consider geological factors only Deere’s RQD (rock quality designation) system (8), Franklin’s Size-Strength system (9), Franklin’s Shale Rating System (10), Bieniawski’s RMR (rock mass rating) system (11), and Barton Q system (12) consider only geological factors. In addition there are several schemes for slopes. Romana’s SMR system is for rock slopes, based on Bieniawski’s RMR system (13). Systems that consider rainfall as well as geological factors There are two systems that consider the geological factors and the rainfall effect as Rock Engineering system (RES) (14) and rock mass instability index RMIIj developed by Ali, M. K and Hassan, (15). Rock hazard rating systems Rock hazard systems consider not only geological factors but also highway factors such as ditch capacity. The Oregon RHR (rock hazard rating) system is designed specifically for highways cuts (16). The Ontario RHRON (Rock Hazard Rating ONtario) system is a modification of the Oregon system (4). Limitation of existing systems
1. The systems that apply easily to analyses of planar, wedge and toppling failure types are not useful for other types of failures.
2. Some of them consider geological factors only and essentially classifying risk only without considering the consequence of failure.
3. It is hard to distinguish between stable slopes from unstable slopes by using a field inspection as the rock engineering system.
4. The rock hazard rating system developed in Oregon is not very sensitive to low rock cuts. It is not a universal system.
5. The Ontario RHRON is somewhat arbitrary. There is no actual separation between risk factors and consequence factors. It is time consuming to measure such a large number of factors. Some factors need laboratory analysis and this adds time and cost.
6. The New York Rock Slope Rating System does not adequately distinguish between risk and consequence. The system is insensitive for small slopes. The connection between the rated GF, and more analytical SF and HEF is ambiguous and may be tenuous.
A New Method for Rockfall Hazard Rating A risk-consequence rating system is currently under development for the Missouri Department of Transportation (MODOT). The system named Missouri Rockfall Hazard Rating system (MORH RS) has several unique and progressive attributes
Concept The rock cut (rockfall) hazard rating system being designed for Missouri highways is designed to cost effectively determine the need and priority of maintenance on rock cuts. This is in order to safeguard the motoring public and also to reduce the risk of vehicle damage and traffic delays as a result of rock falls, especially in light of the potential of rock fall disruption of transportation if major activity on the New Madrid fault should occur.
A three phase approach to mitigating rock fall hazards is proposed, to utilize resources efficiently:
1. Identification (over the entire road network) of potentially problematic rock cuts, using mobile digital video logging.
2. Characterization and prioritization of remediation (for the potentially problematic rock cuts identified in phase 1) using a purpose designed rock mass rating system.
3. Detailed analysis and design methodologies for final remediation (for the prioritized rock cuts identified in phase 2).
The efficiency will come from rapid, low cost screening of problematic areas, an effective relatively efficient characterization scheme to prioritize remediation, leaving most of the resources for the task of detailed characterization, design, and implementation of final remedial measures on slopes deemed to be high priority.
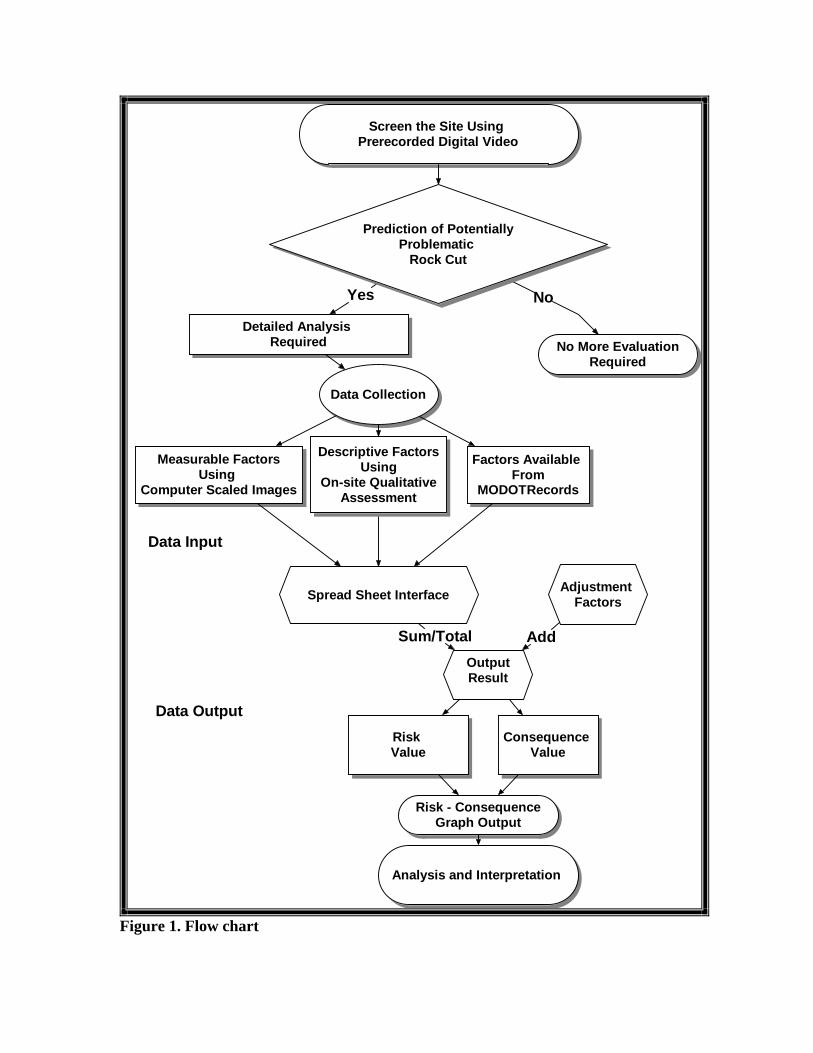
This research specifically addresses the first 2 phases. It is here that new methods can be developed to introduce efficiencies and comprehensiveness into the process. Phase 3 methodologies have been developed and are widely implemented. A flow chart for the MORH RS has been prepared (Figure 1).
No More EvaluationRequired
Detailed Analysis Required
Data Collection
Measurable FactorsUsing
Computer Scaled Images
Factors Available From
MODOTRecords
Screen the Site Using Prerecorded Digital Video
Data Input
Spread Sheet Interface Adjustment Factors
OutputResult
Sum/Total Add
Risk Value
Consequence Value
Risk - ConsequenceGraph Output
Analysis and Interpretation
Descriptive FactorsUsing
On-site QualitativeAssessment
Data Output
NoYes
Prediction of Potentially Problematic
Rock Cut
Figure 1. Flow chart
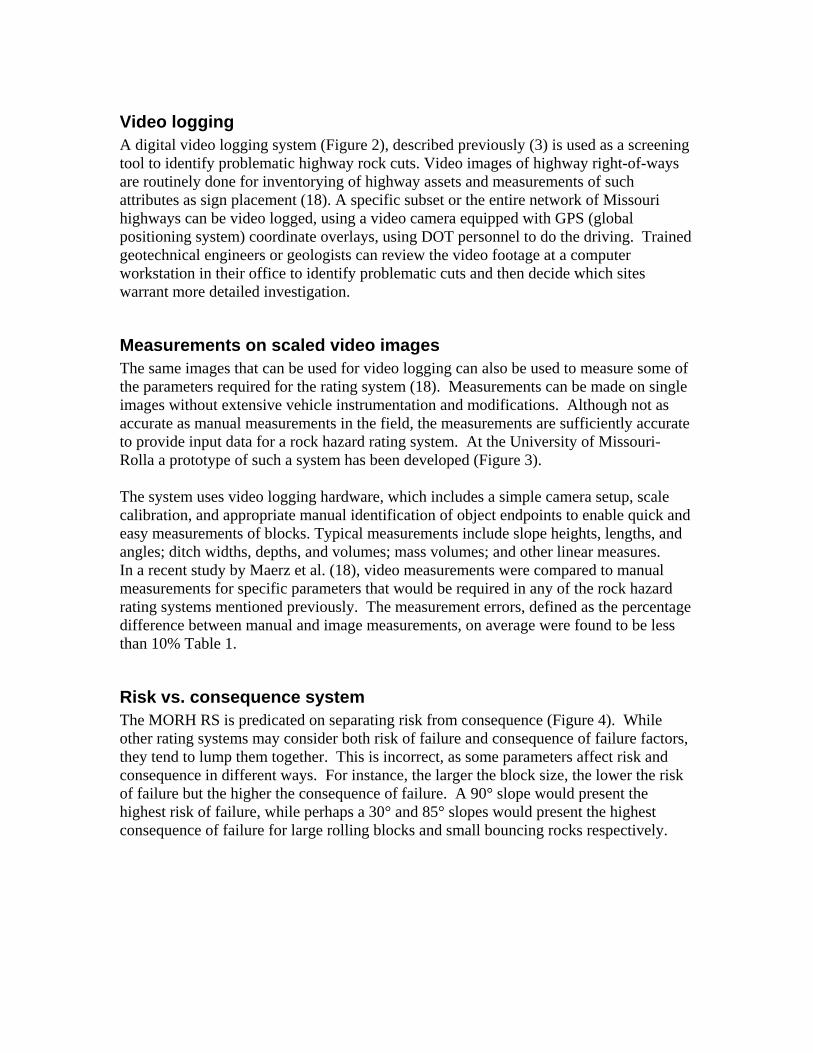
Video logging A digital video logging system (Figure 2), described previously (3) is used as a screening tool to identify problematic highway rock cuts. Video images of highway right-of-ways are routinely done for inventorying of highway assets and measurements of such attributes as sign placement (18). A specific subset or the entire network of Missouri highways can be video logged, using a video camera equipped with GPS (global positioning system) coordinate overlays, using DOT personnel to do the driving. Trained geotechnical engineers or geologists can review the video footage at a computer workstation in their office to identify problematic cuts and then decide which sites warrant more detailed investigation.
Measurements on scaled video images The same images that can be used for video logging can also be used to measure some of the parameters required for the rating system (18). Measurements can be made on single images without extensive vehicle instrumentation and modifications. Although not as accurate as manual measurements in the field, the measurements are sufficiently accurate to provide input data for a rock hazard rating system. At the University of Missouri-Rolla a prototype of such a system has been developed (Figure 3). The system uses video logging hardware, which includes a simple camera setup, scale calibration, and appropriate manual identification of object endpoints to enable quick and easy measurements of blocks. Typical measurements include slope heights, lengths, and angles; ditch widths, depths, and volumes; mass volumes; and other linear measures. In a recent study by Maerz et al. (18), video measurements were compared to manual measurements for specific parameters that would be required in any of the rock hazard rating systems mentioned previously. The measurement errors, defined as the percentage difference between manual and image measurements, on average were found to be less than 10% Table 1.
Risk vs. consequence system The MORH RS is predicated on separating risk from consequence (Figure 4). While other rating systems may consider both risk of failure and consequence of failure factors, they tend to lump them together. This is incorrect, as some parameters affect risk and consequence in different ways. For instance, the larger the block size, the lower the risk of failure but the higher the consequence of failure. A 90° slope would present the highest risk of failure, while perhaps a 30° and 85° slopes would present the highest consequence of failure for large rolling blocks and small bouncing rocks respectively.
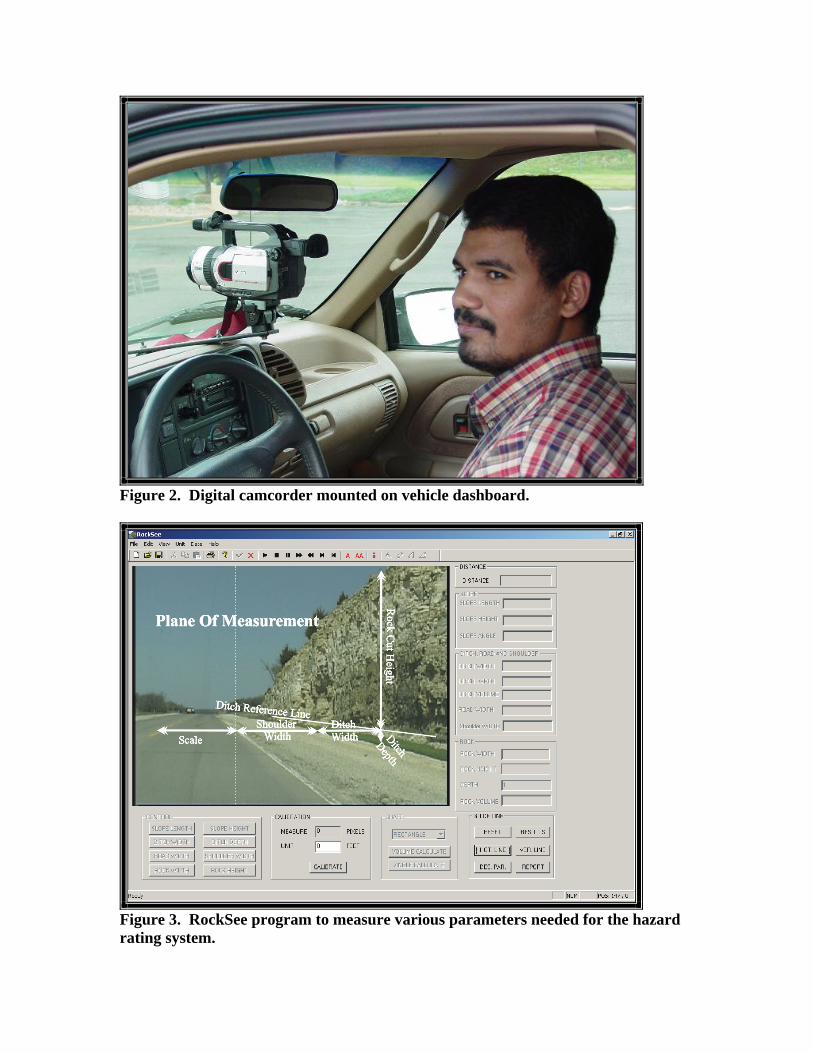
Figure 2. Digital camcorder mounted on vehicle dashboard.
Figure 3. RockSee program to measure various parameters needed for the hazard rating system.
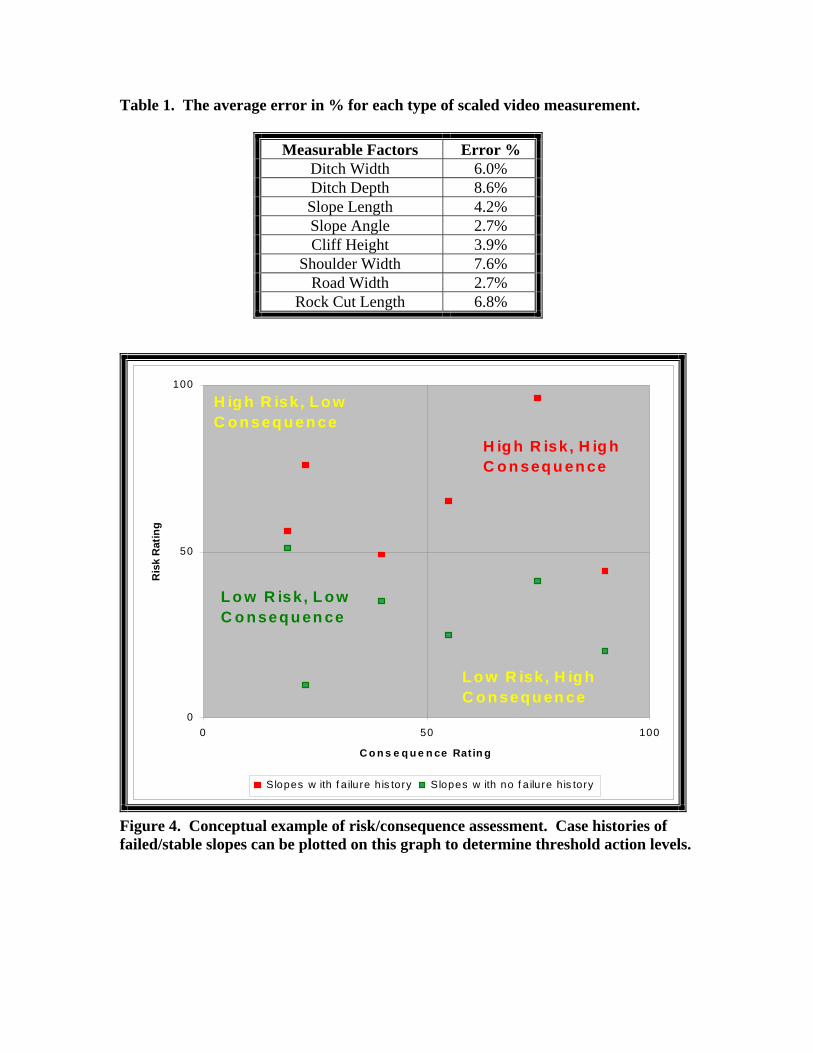
Table 1. The average error in % for each type of scaled video measurement.
Measurable Factors Error % Ditch Width 6.0% Ditch Depth 8.6% Slope Length 4.2% Slope Angle 2.7% Cliff Height 3.9%
Shoulder Width 7.6% Road Width 2.7%
Rock Cut Length 6.8%
0
50
100
0 50 100
C o n s e q u e n ce Rat in g
Ris
k R
atin
g
Slopes w ith f a ilure his tory Slopes w ith no f a ilure his tory
H ig h R isk , L o w C o n seq u en ce
H ig h R isk , H ig h C o n seq u en ce
L o w R isk , H ig h C o n seq u en ce
L o w R isk , L o w C o n seq u en ce
Figure 4. Conceptual example of risk/consequence assessment. Case histories of failed/stable slopes can be plotted on this graph to determine threshold action levels.
In any case, separating risk and consequence seems useful, because it may be possible to concern ourselves only with high risk, high consequence rock cuts. Low risk rock cuts need not worry us because there is small chance of failure, and low consequence cuts need not worry us because the fallen rock is not likely to reach and affect the highway traffic.
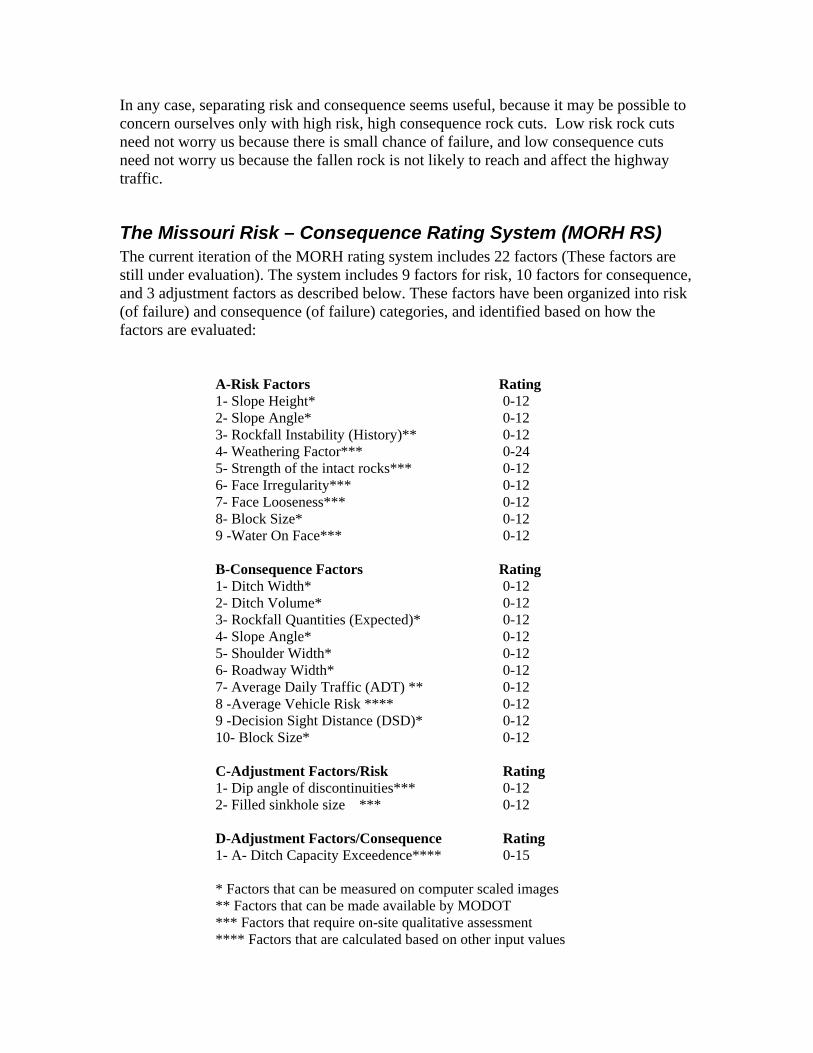
The Missouri Risk – Consequence Rating System (MORH RS) The current iteration of the MORH rating system includes 22 factors (These factors are still under evaluation). The system includes 9 factors for risk, 10 factors for consequence, and 3 adjustment factors as described below. These factors have been organized into risk (of failure) and consequence (of failure) categories, and identified based on how the factors are evaluated:
A-Risk Factors Rating 1- Slope Height* 0-12 2- Slope Angle* 0-12 3- Rockfall Instability (History)** 0-12 4- Weathering Factor*** 0-24 5- Strength of the intact rocks*** 0-12 6- Face Irregularity*** 0-12 7- Face Looseness*** 0-12 8- Block Size* 0-12 9 -Water On Face*** 0-12 B-Consequence Factors Rating 1- Ditch Width* 0-12 2- Ditch Volume* 0-12 3- Rockfall Quantities (Expected)* 0-12 4- Slope Angle* 0-12 5- Shoulder Width* 0-12 6- Roadway Width* 0-12 7- Average Daily Traffic (ADT) ** 0-12 8 -Average Vehicle Risk **** 0-12 9 -Decision Sight Distance (DSD)* 0-12 10- Block Size* 0-12 C-Adjustment Factors/Risk Rating 1- Dip angle of discontinuities*** 0-12 2- Filled sinkhole size *** 0-12 D-Adjustment Factors/Consequence Rating 1- A- Ditch Capacity Exceedence**** 0-15 * Factors that can be measured on computer scaled images ** Factors that can be made available by MODOT *** Factors that require on-site qualitative assessment **** Factors that are calculated based on other input values
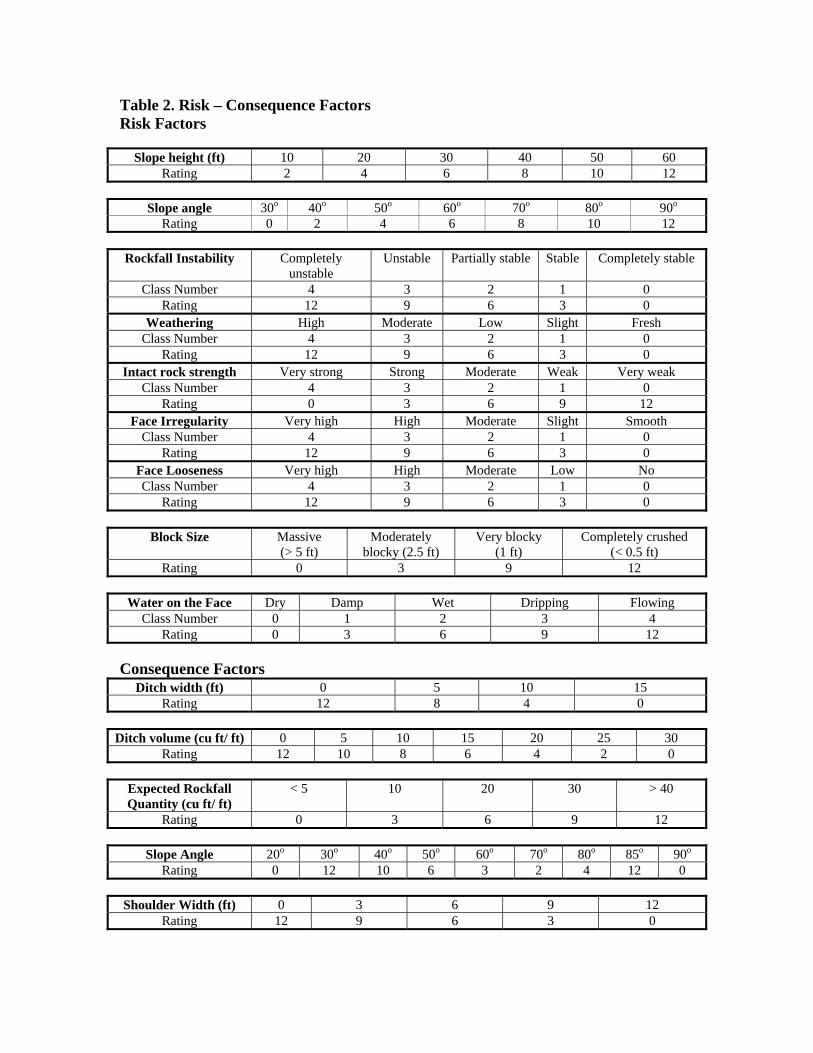
Table 2. Risk – Consequence Factors Risk Factors
Slope height (ft) 10 20 30 40 50 60
Rating 2 4 6 8 10 12
Slope angle 30o 40o 50o 60o 70o 80o 90o Rating 0 2 4 6 8 10 12
Rockfall Instability Completely
unstable Unstable Partially stable Stable Completely stable
Class Number 4 3 2 1 0 Rating 12 9 6 3 0
Weathering High Moderate Low Slight Fresh Class Number 4 3 2 1 0
Rating 12 9 6 3 0 Intact rock strength Very strong Strong Moderate Weak Very weak
Class Number 4 3 2 1 0 Rating 0 3 6 9 12
Face Irregularity Very high High Moderate Slight Smooth Class Number 4 3 2 1 0
Rating 12 9 6 3 0 Face Looseness Very high High Moderate Low No Class Number 4 3 2 1 0
Rating 12 9 6 3 0
Block Size Massive (> 5 ft)
Moderately blocky (2.5 ft)
Very blocky (1 ft)
Completely crushed (< 0.5 ft)
Rating 0 3 9 12
Water on the Face Dry Damp Wet Dripping Flowing Class Number 0 1 2 3 4
Rating 0 3 6 9 12
Consequence Factors Ditch width (ft) 0 5 10 15
Rating 12 8 4 0
Ditch volume (cu ft/ ft) 0 5 10 15 20 25 30 Rating 12 10 8 6 4 2 0
Expected Rockfall Quantity (cu ft/ ft)
< 5 10 20 30 > 40
Rating 0 3 6 9 12
Slope Angle 20o 30o 40o 50o 60o 70o 80o 85o 90o Rating 0 12 10 6 3 2 4 12 0
Shoulder Width (ft) 0 3 6 9 12
Rating 12 9 6 3 0
Number of Lanes One lane Two lanes Three lanes Four lanes Rating 12 6 3 0
Average Daily Traffic 5000 Cars / day
10000 Cars / day
15000 Cars / day
20000 Cars / day
Rating 3 6 9 12 Average Vehicle Risk Low Risk
25% of the timeMedium Risk
50% of the time High Risk
75% of the time Very high Risk
100% of the time Rating 3 6 9 12
Design Sight Distance Very Limited Limited Moderately Limited Adequate Class Number 3 2 1 0
Rating 12 8 4 0 Block Size Massive
(> 5 ft) Moderately blocky
(2.5 ft) Very blocky
(1 ft) Completely
crushed (< 0.5 ft)
Rating 12 8 4 0 Table 3. Risk – Consequence Adjustment Factors. Risk factors
Adversely Oriented Discontinuities
Favorable
Fair Unfavorable Very Unfavorable
Dip angle of discontinuities, Daylighting into cut
< 20 20 – 45 45 - 65 65 – 90
Rating 0 4 8 12 B- Sinkhole effect
Filled sinkhole size Small 50 ft wide
Medium 100 ft wide
Large 150 ft wide
Rating Value 4 8 12 Consequence factors A- Ditch Capacity Exceedence (ERFQ/DV)
Ditch Capacity Exceedence (RFQ/DV)
1 2 3 4
Rating Value 0 5 10 15 Ditch Capacity Exceedence (Expected Rockfall Quantity/Ditch volume) (ERFQ/DV) If ERFQ/DV = 1 that means the ditch will contain all the fallen rocks. If ERFQ/DV = 2 that means the ditch will completely fill and a large amount spill over. If ERFQ/DV = 3 that means the fallen rock will spill over to the shoulder of the road. If ERFQ/DV = 4 that means the fallen rocks will spill over to the road.
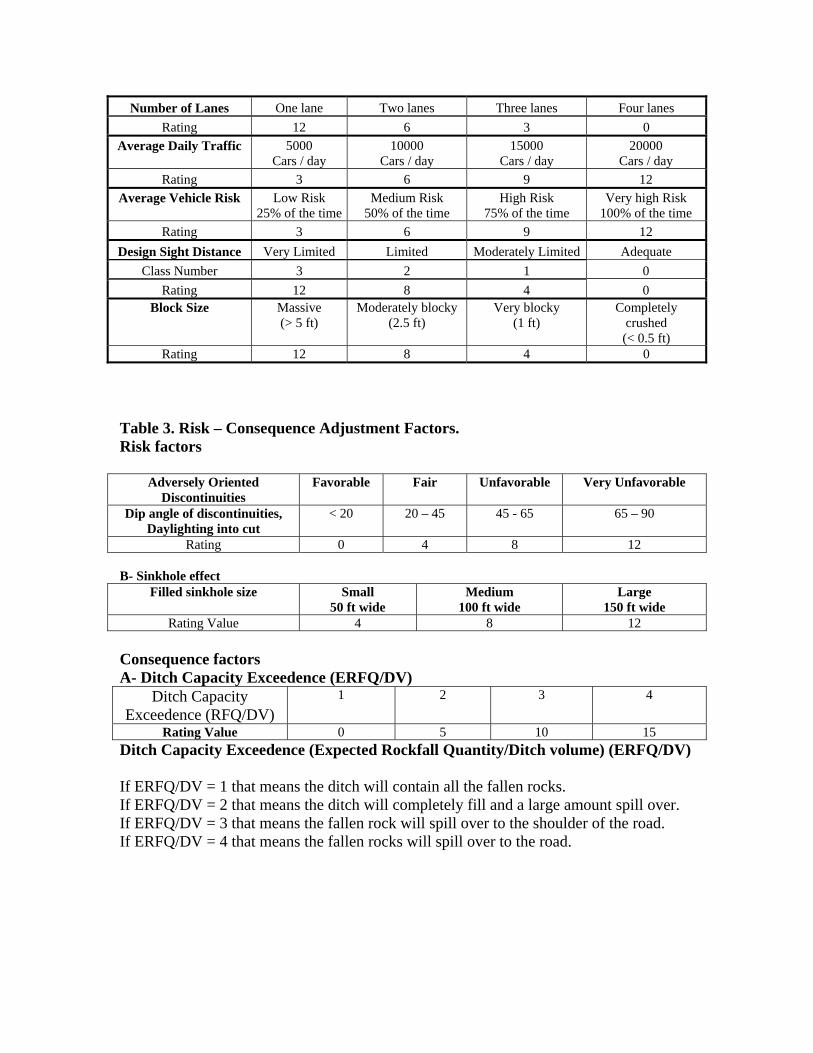
Details of the rating system factors can be seen in Table 2, with the adjustment factors given in Table 3. In this system there are many different methods used to determine the rating values for each parameter by using tables, graphs, and equations.
For each of the risk and consequence factors, the ratings are summed, and divided by the maximum total ratings to give a value in percent. Adjustment factors must be added afterward. These range from 0-12 (0-15), and are added directly to the rating system (i.e. not averaged in with the rest of the parameters).
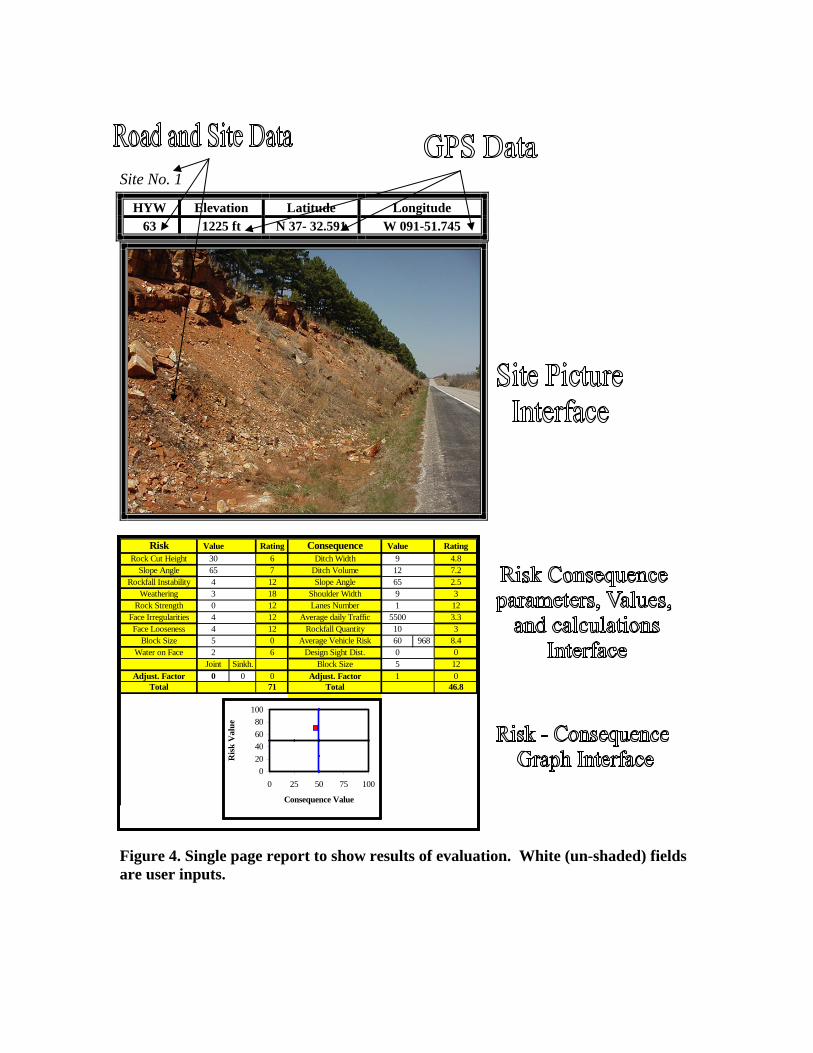
MORH RS (User input vs. Internal Calculations) MORH RS is designed to be as complex as required, but have as simple as possible a user interface. The current version uses a Microsoft Word® user interface, with and embedded Microsoft Excel® OLE® object. Figure 4 shows the one page report, which consists of:
1. Site location information (Road name, site number, and GPS coordinates), 2. Picture, 3. Rating chart, and 4. Rating graph.
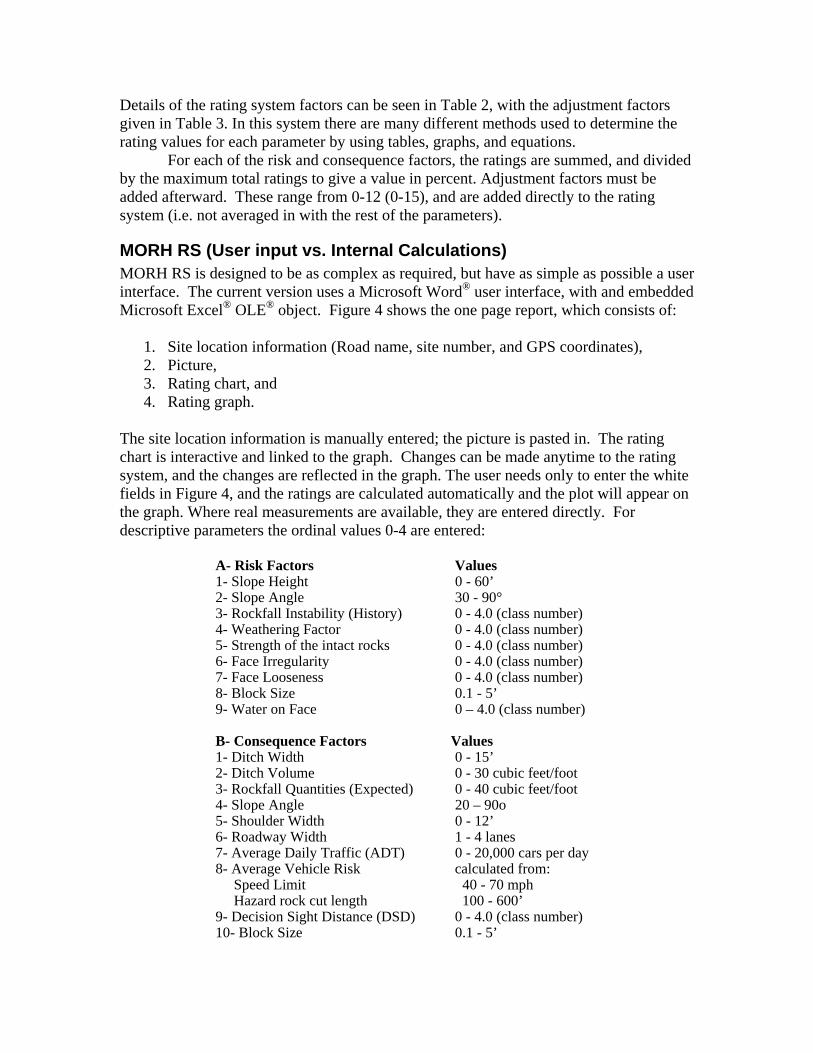
The site location information is manually entered; the picture is pasted in. The rating chart is interactive and linked to the graph. Changes can be made anytime to the rating system, and the changes are reflected in the graph. The user needs only to enter the white fields in Figure 4, and the ratings are calculated automatically and the plot will appear on the graph. Where real measurements are available, they are entered directly. For descriptive parameters the ordinal values 0-4 are entered:
A- Risk Factors Values 1- Slope Height 0 - 60’ 2- Slope Angle 30 - 90° 3- Rockfall Instability (History) 0 - 4.0 (class number) 4- Weathering Factor 0 - 4.0 (class number) 5- Strength of the intact rocks 0 - 4.0 (class number) 6- Face Irregularity 0 - 4.0 (class number) 7- Face Looseness 0 - 4.0 (class number) 8- Block Size 0.1 - 5’ 9- Water on Face 0 – 4.0 (class number) B- Consequence Factors Values 1- Ditch Width 0 - 15’ 2- Ditch Volume 0 - 30 cubic feet/foot 3- Rockfall Quantities (Expected) 0 - 40 cubic feet/foot 4- Slope Angle 20 – 90o 5- Shoulder Width 0 - 12’ 6- Roadway Width 1 - 4 lanes 7- Average Daily Traffic (ADT) 0 - 20,000 cars per day 8- Average Vehicle Risk calculated from: Speed Limit 40 - 70 mph Hazard rock cut length 100 - 600’ 9- Decision Sight Distance (DSD) 0 - 4.0 (class number) 10- Block Size 0.1 - 5’
Site No. 1 HYW Elevation Latitude Longitude
63 1225 ft N 37- 32.591 W 091-51.745
Figure 4. Single page report to show results of evaluation. White (un-shaded) fields are user inputs.
Risk Value Rating Consequence Value RatingRock Cut Height 30 6 Ditch Width 9 4.8
Slope Angle 65 7 Ditch Volume 12 7.2Rockfall Instability 4 12 Slope Angle 65 2.5
Weathering 3 18 Shoulder Width 9 3Rock Strength 0 12 Lanes Number 1 12
Face Irregularities 4 12 Average daily Traffic 5500 3.3Face Looseness 4 12 Rockfall Quantity 10 3
Block Size 5 0 Average Vehicle Risk 60 968 8.4Water on Face 2 6 Design Sight Dist. 0 0
Joint Sinkh. Block Size 5 12Adjust. Factor 0 0 0 Adjust. Factor 1 0
Total 71 Total 46.8
020406080
100
0 25 50 75 100
Consequence Value
Ris
k V
alue
C-Adjustment Factors/Risk Values 1- Dip angle of discontinuities 0 – 3.0 2- Filled sinkhole size 0 – 3.0 D-Adjustment Factors/Consequence Values 1- A- Ditch Capacity Exceedence 1 – 4.0
Application and Results of MORH RS to Missouri Rock Cuts
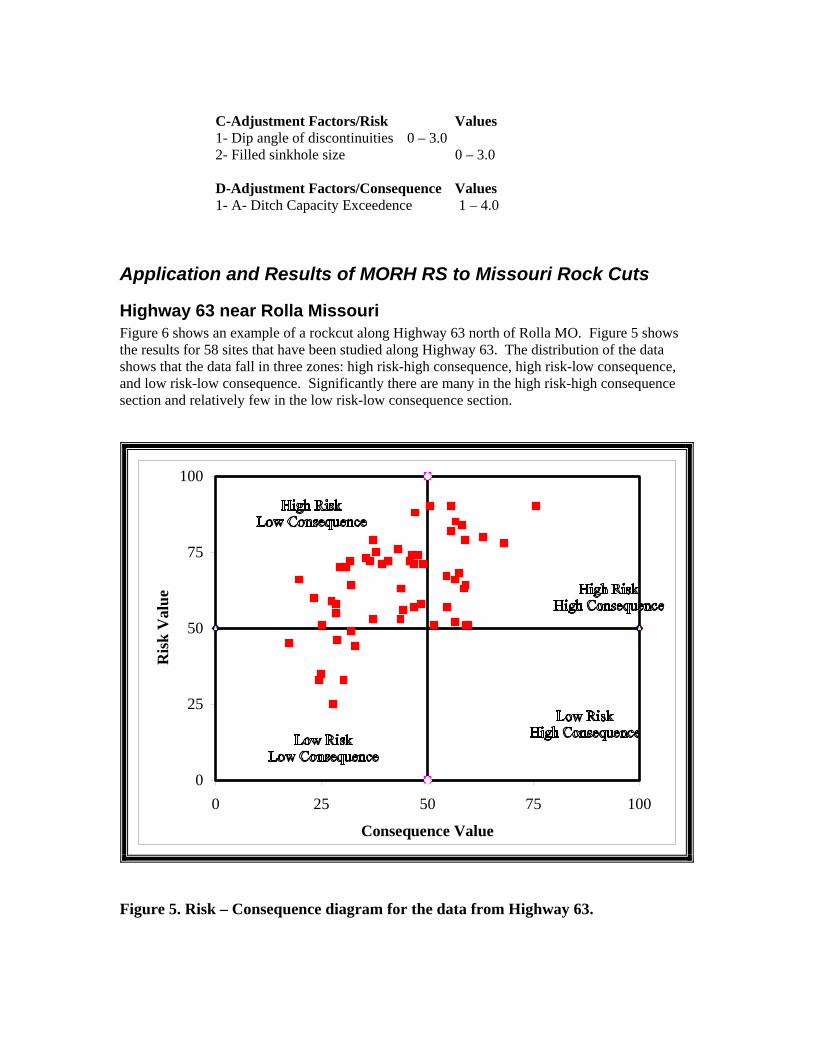
Highway 63 near Rolla Missouri Figure 6 shows an example of a rockcut along Highway 63 north of Rolla MO. Figure 5 shows the results for 58 sites that have been studied along Highway 63. The distribution of the data shows that the data fall in three zones: high risk-high consequence, high risk-low consequence, and low risk-low consequence. Significantly there are many in the high risk-high consequence section and relatively few in the low risk-low consequence section.
0
25
50
75
100
0 25 50 75 100
Consequence Value
Ris
k V
alue
Figure 5. Risk – Consequence diagram for the data from Highway 63.
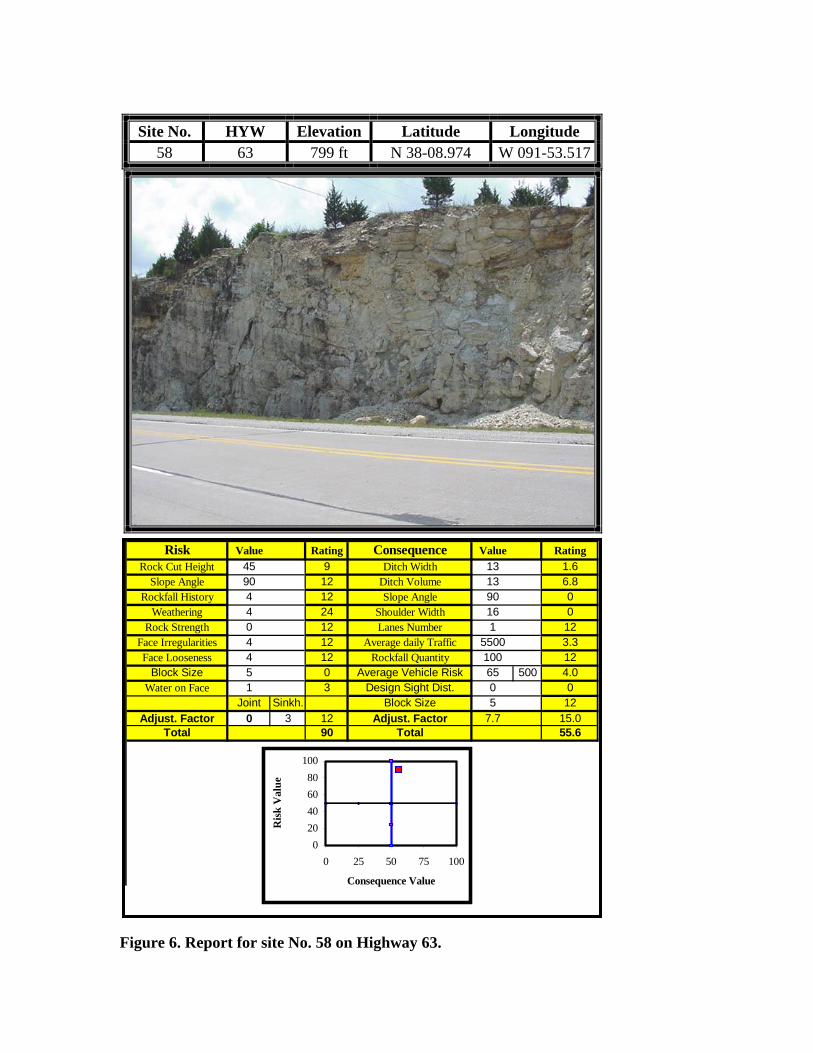
Site No. HYW Elevation Latitude Longitude 58 63 799 ft N 38-08.974 W 091-53.517
Figure 6. Report for site No. 58 on Highway 63.
Risk Value Rating Consequence Value RatingRock Cut Height 45 9 Ditch Width 13 1.6
Slope Angle 90 12 Ditch Volume 13 6.8Rockfall History 4 12 Slope Angle 90 0
Weathering 4 24 Shoulder Width 16 0Rock Strength 0 12 Lanes Number 1 12
Face Irregularities 4 12 Average daily Traffic 5500 3.3Face Looseness 4 12 Rockfall Quantity 100 12
Block Size 5 0 Average Vehicle Risk 65 500 4.0Water on Face 1 3 Design Sight Dist. 0 0
Joint Sinkh. Block Size 5 12Adjust. Factor 0 3 12 Adjust. Factor 7.7 15.0
Total 90 Total 55.6
020406080
100
0 25 50 75 100
Consequence Value
Ris
k V
alue
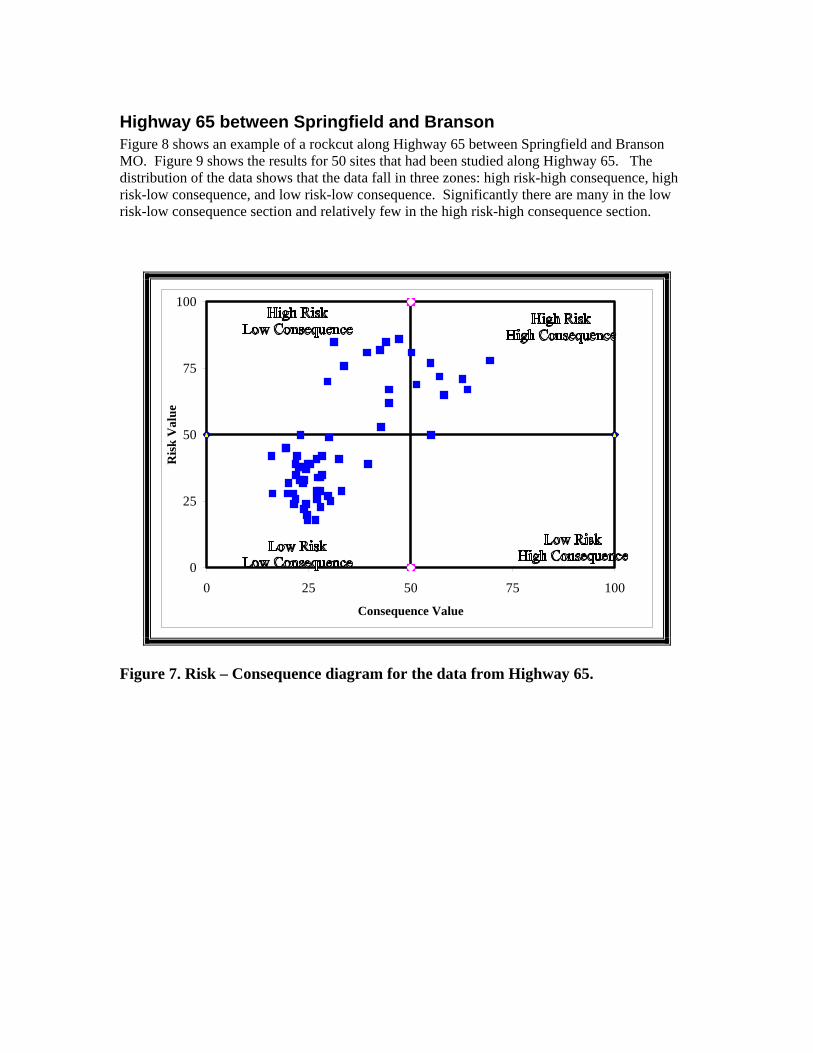
Highway 65 between Springfield and Branson Figure 8 shows an example of a rockcut along Highway 65 between Springfield and Branson MO. Figure 9 shows the results for 50 sites that had been studied along Highway 65. The distribution of the data shows that the data fall in three zones: high risk-high consequence, high risk-low consequence, and low risk-low consequence. Significantly there are many in the low risk-low consequence section and relatively few in the high risk-high consequence section.
0
25
50
75
100
0 25 50 75 100
Consequence Value
Ris
k V
alue
Figure 7. Risk – Consequence diagram for the data from Highway 65.
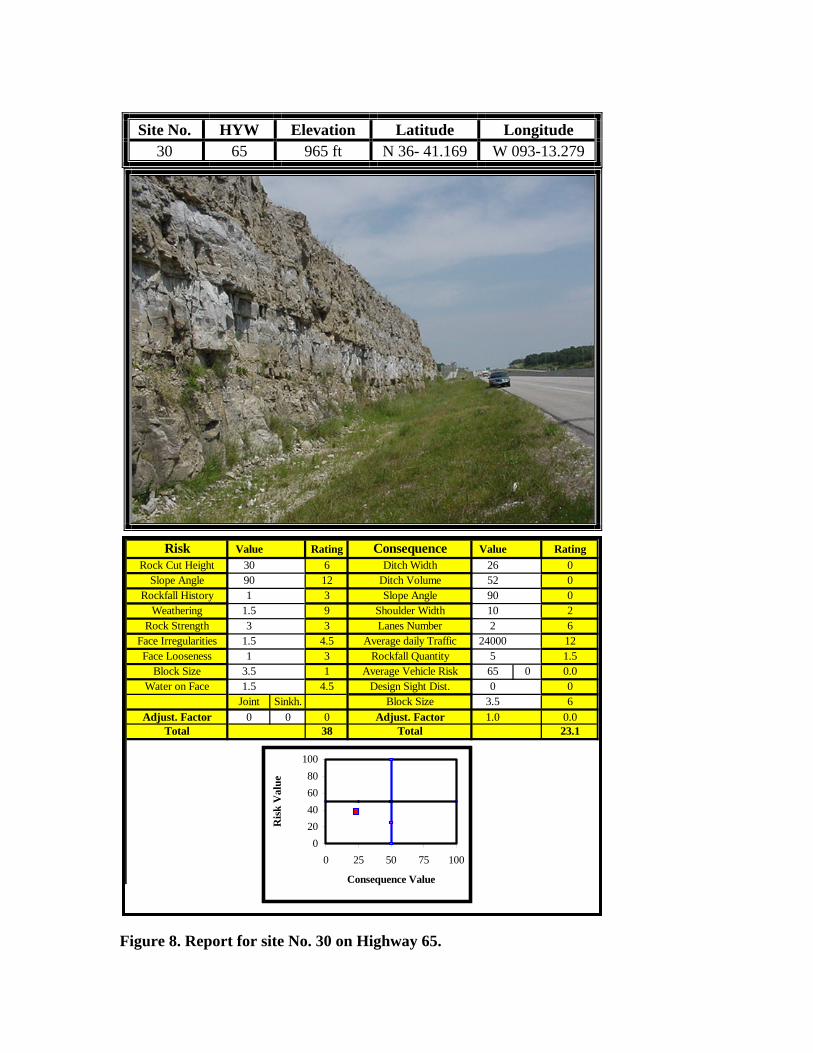
Site No. HYW Elevation Latitude Longitude 30 65 965 ft N 36- 41.169 W 093-13.279
Figure 8. Report for site No. 30 on Highway 65.
Risk Value Rating Consequence Value RatingRock Cut Height 30 6 Ditch Width 26 0
Slope Angle 90 12 Ditch Volume 52 0Rockfall History 1 3 Slope Angle 90 0
Weathering 1.5 9 Shoulder Width 10 2Rock Strength 3 3 Lanes Number 2 6
Face Irregularities 1.5 4.5 Average daily Traffic 24000 12Face Looseness 1 3 Rockfall Quantity 5 1.5
Block Size 3.5 1 Average Vehicle Risk 65 0 0.0Water on Face 1.5 4.5 Design Sight Dist. 0 0
Joint Sinkh. Block Size 3.5 6Adjust. Factor 0 0 0 Adjust. Factor 1.0 0.0
Total 38 Total 23.1
020406080
100
0 25 50 75 100
Consequence Value
Ris
k V
alue
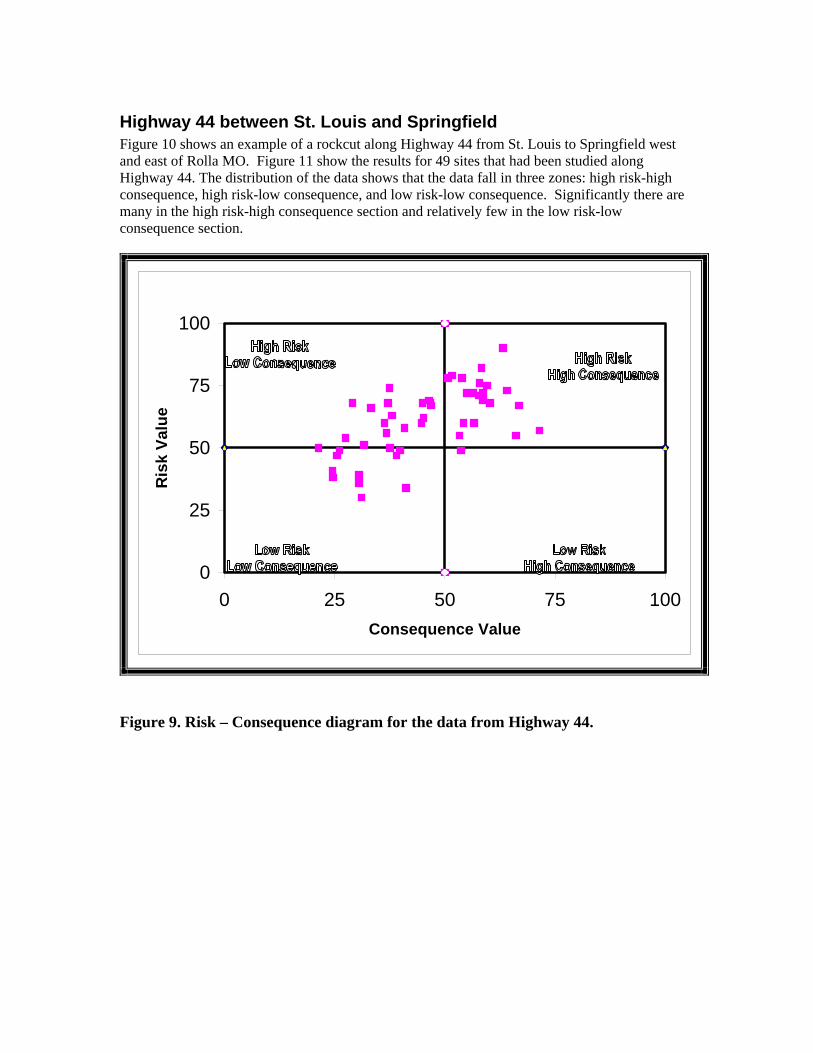
Highway 44 between St. Louis and Springfield Figure 10 shows an example of a rockcut along Highway 44 from St. Louis to Springfield west and east of Rolla MO. Figure 11 show the results for 49 sites that had been studied along Highway 44. The distribution of the data shows that the data fall in three zones: high risk-high consequence, high risk-low consequence, and low risk-low consequence. Significantly there are many in the high risk-high consequence section and relatively few in the low risk-low consequence section.
0
25
50
75
100
0 25 50 75 100Consequence Value
Ris
k Va
lue
Figure 9. Risk – Consequence diagram for the data from Highway 44.
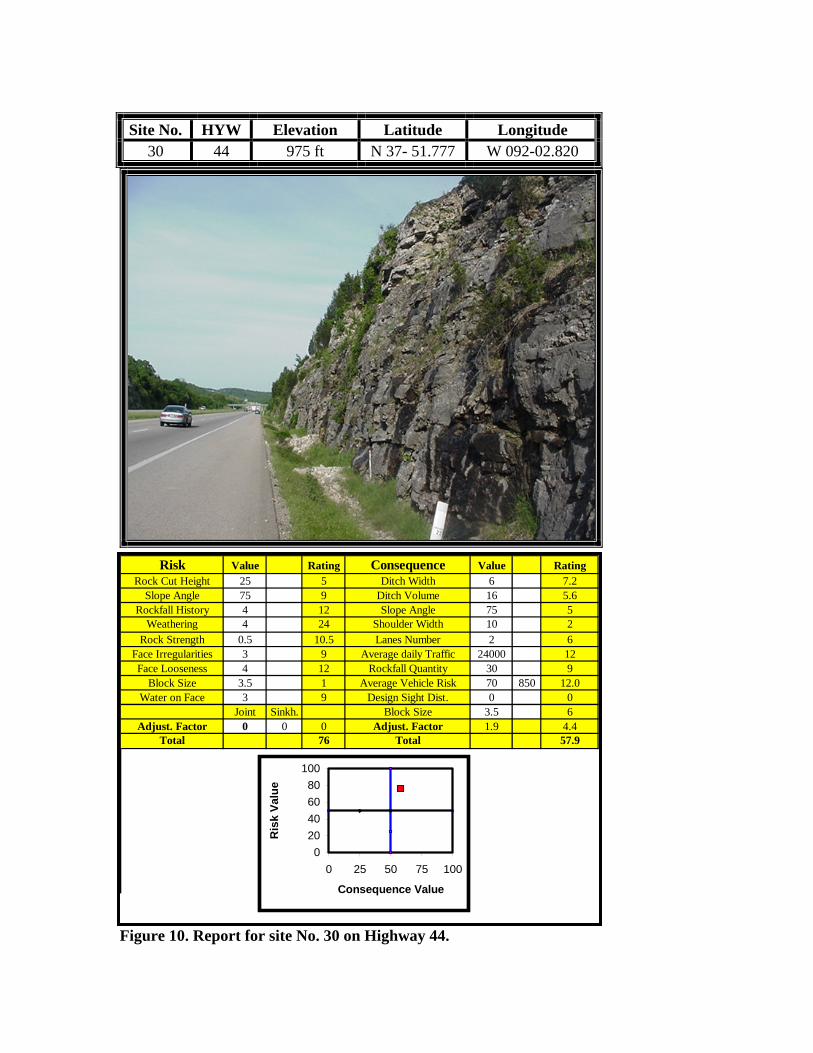
Site No. HYW Elevation Latitude Longitude 30 44 975 ft N 37- 51.777 W 092-02.820
Figure 10. Report for site No. 30 on Highway 44.
Risk Value Rating Consequence Value RatingRock Cut Height 25 5 Ditch Width 6 7.2
Slope Angle 75 9 Ditch Volume 16 5.6Rockfall History 4 12 Slope Angle 75 5
Weathering 4 24 Shoulder Width 10 2Rock Strength 0.5 10.5 Lanes Number 2 6
Face Irregularities 3 9 Average daily Traffic 24000 12Face Looseness 4 12 Rockfall Quantity 30 9
Block Size 3.5 1 Average Vehicle Risk 70 850 12.0Water on Face 3 9 Design Sight Dist. 0 0
Joint Sinkh. Block Size 3.5 6Adjust. Factor 0 0 0 Adjust. Factor 1.9 4.4
Total 76 Total 57.9
020406080
100
0 25 50 75 100
Consequence Value
Ris
k Va
lue
Comparison of Highway 63/44 and Highway 65 sites A comparison of the sites shows that the rating for the Highway 65 rock cuts are considerably lower for both risk and consequence than those of Highway 63 and 44. This is most likely because the Highway 65 cuts are new and have superior design and better blasting. The Highway 63 and 44 rock cuts are older cuts, and have had additional weathering over time.
Conclusions This new rockfall hazard system (MORH RS) is designed to very efficiently and effectively determine the risk and consequence values for any site and to identify, which sites need further attention by plotting the risk consequence values on a risk-consequence diagram. The data are prepared for the system from three different sources, factors that can be measured on computer scaled images, factors that can be made available by MODOT and factors that require on-site qualitative assessment.
Currently this system works with an excel spread sheet file embedded in a word document. The spreadsheet is interactive, the risk-consequence plot changes in response to changes in the values of the parameters.
Preliminary work on Missouri highways has demonstrated that the system can effectively be used to prioritize the severity of potential rockfalls.
Acknowledgements The authors would like to acknowledge the Missouri Department of Transportation (MODOT) for funding this research. We would especially like thank Tom Fennessey, Ray Purvis and Rob Lauer of MODOT for their help in providing guidance for this project. We would like to thank the University of Missouri System Research Board for the original seed funding of this research, especially the development of the RockSee program.
References 1- Hoek, E. 2000. Practical Rock engineering. 299 pages 2- Badger, T.C. and Lowell, S. 1992. Rockfall Control Washington State. In
Rockfall Prediction and Control and Landslide Case Histories, Transportation Research Record, National Research Council, Washington, No 1342, pp 14-19.
3- Hungr, O. and Evans, S.G. 1989. Engineering aspects of rockfall hazard in Canada. Geological Survey of Canada, Open File 2061, 102 pages.
4- Franklin, J. A., And Senior, S. A., 1987. Outline of RHRON, the Ontario Rockfall Hazard Rating System. Proceedings International Symposium on Engineering Geology and the Environment, Athens, Greece, 1987, pp. 647-656.
5- Hoek, E. and Bray, J.W. 1981. Rock Slope Engineering . 3rd edn. London: Institution of Mining and Metallurgy 402 pages
6- Franklin, J. A., and Maerz, N. H., 1996. Empirical design and rock mass characterization. Proceedings of the FRAGBLAST 5 Workshop on Measurement of Blast Fragmentation, pp. 193-201.
7- SINGH, Singh, B. and Goel, R. K., 1999. Rock Mass Classification. A Practical Approach in Civil Engineering: Elsevier, 267 pp.
8- Deere, D. U., Merritt, A. H., And Coon, R. F., 1969. Engineering Classification of In Situ Rock. Air Force Systems Command, Kirtland Air Force Base, Report AFWL-64-144.
9- Franklin, J. A., 1986. Size-Strength System for Rock Characterization. Proceedings of the Symposium of Rock Characterization to Mine Design, American Society of Mining Engineers Annual Meeting , pp. 11-16.
10- Franklin, J. A., 1983. Evaluation of Shale’s For Construction Projects – An Ontario Shale Rating System. Research Report RR229, Ontario Ministry of Transport and Communication, 99 pp.
11- Bieniawski, Z. T., 1984. Rock Mechanics Design in Mining and Tunneling. A. A. Balkema.
12- Barton, N. M., Lien, R., and Lunde, J., 1974. Engineering Classification of Rock Masses for the Design of Tunnel Support. Rock Mechanics 6, 1974, pp. 189-236.
13- Romana, M., 1985. New Adjustment Ratings for Application of Bieniawski Classification to Slopes. International Symposium on the Role of Rock Mechanics, Zacatecas, pp. 49-53.
14- Hudson, J. A., 1992. Rock engineering systems: theory and practice. Ellis Horwood, Chichester.
15- Ali, K. M, and Hasan, K., 2002. Rock Mass Characterization to Indicate Slope Instability at Bandarban, Balgladesh. A Rock Engineering Systems Approach. Environmental & engineering Geoscience, vol. VIII, No. 2, pp. 105-119.
16- Pierson, L. A., and Van Vickle, R., 1993. Rockfall Hazard Rating System – Participants’ Manual. FHWA Report – FHWA-SA-93-057, 102 pp.
17- Maerz, N. H., 2000. Highway Rock Cut Stability Assessment In Rock Masses Not Conducive to Stability Calculations. Proceedings of the 51st Annual Highway Geology Symposium, Aug. 29-Sept. 1, Seattle, Washington, pp. 249-259.
18- Maerz, N. H., and McKenna, S., 1999. Mobile Highway Inventory and Measurement System. Transportation Research Record No. 1690, pp. 135-142.
19- Maerz, N. H., Youssef, A., and Xiang, Q., 2003. Digital imaging for screening and making measurements of features on highway rock cuts. Transportation Research Board, 82nd Annual Meeting, Washington, D.C., Jan. 12-16, 2003, 20 pp.
®Microsoft Word, Microsoft Excel, and OLE are registered trademarks of Microsoft Corp.