a smart tool for a sustainable future. chicago skyline pm 2.5 < 10 μg/m 3
TRANSCRIPT
A Smart Tool for a Sustainable Future

Chicago skyline PM2.5 < 10 μg/m3

Chicago skyline PM2.5 20 μg/m3

Chicago skyline PM2.5 35 μg/m3
Canada Wide Standard: 35μg/m3

Mortality
An increase in fine particulate pollution (PM2.5) of 10 μg/m3 is associated with an increase of:
1.8% in total mortality (death)
1.4% in cardiovascular (CV) mortality
• After 1990 a ban on coal for residential heating in the UK resulted in a reduction of 35.6 μg/m3 in black smoke (fine PM). The result was a 10.3% decrease in annual CV mortality
• In Hong Kong, a 50% reduction in SO2 was followed by a 2.4% reduction in CV death.
Each increase of 10 μg/m3 was associated with a 6% increase in risk of cardiopulmonary mortality in the ACS study (U.S.)
Living near a major road (PM and NO2) was associated with a relative risk for cardiopulmonary mortality of 1.95 (Hamilton and Amsterdam)

Morbidity
A transient increase in the concentration of PM2.5 of 25 μg/m3 has been associated with an increased risk for myocardial infarction within 1-2 hours of exposure.
High concentrations of PM2.5 over 24 hours increases cardiovascular risk.
Living near a busy road increases the likelihood of several respiratory health effects.

Growth Issues
Population to grow by four million people by 2031 (11 million total).
Golden Horseshoe to be third-largest urban land area in North America.
Commute times to increase by 45%.
Automobile emissions to increase by 42%.

Complex Planning Issues
Lack of coordinated approach to urban planning. Are health and local environmental impacts measured
properly?
How are sustainability objectives measured?
Lack of full-cost accounting of different approaches.
The regions’ current analytical tools have not integrated transportation, environment, health, economic, and social relationships in a comprehensive manner.

NOX Emissions Over Southern Ontario Using SMOKE (July 13 - 16, 1999)

PM2.5 Concentrations Over Southern Ontario
Using Models-3 / CMAQ (July 11 - 19, 1999)


Inter-Relationships
Public Policy is Linked to Each
Component
Economic & Regional Development
Infrastructure•Municipal Works•Transportation
Road Congestion
Air Quality &GHG Impacts
Social ImpactsImpact on Health &
Environment
Socio-Economic and Environmental Costs
IndustrialInstitutionalResidential
Cost of Decisions
Infrastructure costsBalance?

A Simplified Source-Receptor Model for Estimating Air Quality Impacts of Policy Measures
ReFSoRT
Emission Inventories
Prepared by: Mike Lepage & Bob Caton, RWDI
November 18 & 21, 2003

Estimating Clean Air Benefits
Changes in Fuel/Energy Use by Sector, Region
Changes in Ambient Air Quality (PM2.5, ozone)
Health Impacts (mortality, morbidity)
Changes in Individual Welfare (WTP)
Aggregation of Damages AcrossEffects, Individuals, Time
AQVM
Changes in CAC Emissions (SOX, NOX, etc.)
Energy2020
Energy 2020
ReFSoRT

Non-Linear RollbackSulphate Example
PM = fr x SO4/(SO4-SO4b)
SO4/(SO4-SO4b) = k/k Es/Es + k/k + Es/Es
k is dependent on changes in NOX, SOX and VOC

NAPS and Census Division Coverage in ReFSoRT

Model Domains (MM5 and CMAQ) and ReFSoRT Subregions

Comparison between SRT and CMAQ modelling for Ozone
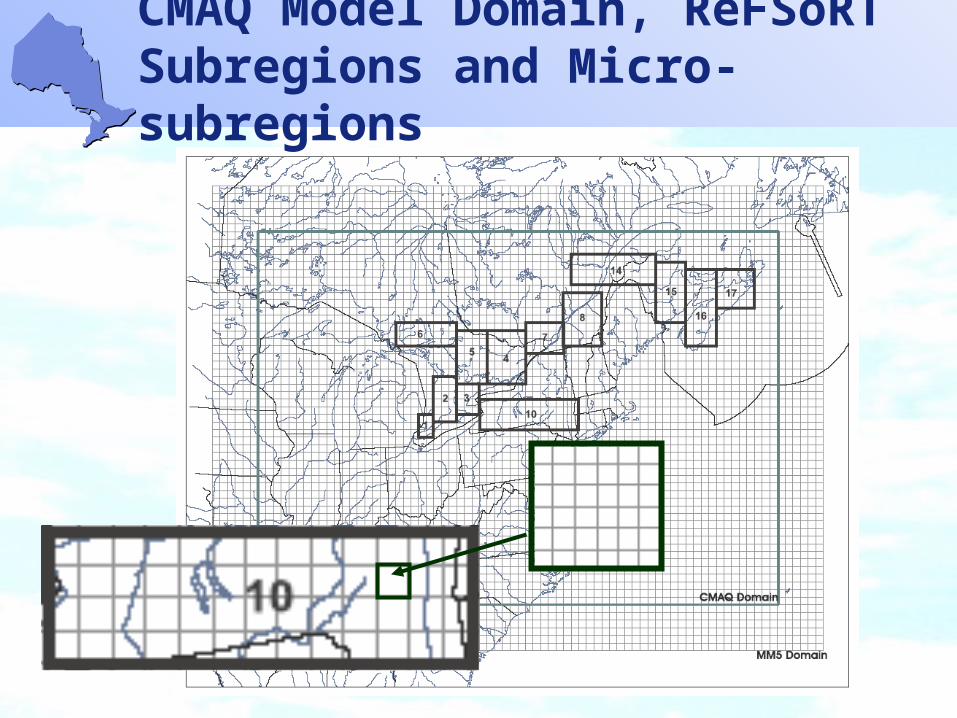
CMAQ Model Domain, ReFSoRT Subregions and Micro-subregions

Thank you