a spectral analysis of laser doppler anemometry turbulent...
TRANSCRIPT

A spectral analysis of laser Doppler anemometry turbulent flow measurements in a ship air wake
R Bardera-Mora , M A Barcala-Montejano , A Rodrfguez-Sevillano2, G Gonzalez de Diego2 and M Ruiz de Sotto 2
Abstract Helicopters are one of the most important tactical elements in maritime operations. The necessity to improve the conditions in which the landing and take-off operations are carried out leads to the study of the flow that separates from the ship's superstructure over the flight deck. To investigate this flow a series of wind tunnel experiments have been performed by testing a sub-scale model of a frigate. Measurements of the flow velocity have been taken by means of laser Doppler anemometry in five points that simulate the last path of the landing trajectory. The data obtained in these experiments is analyzed in the frequency domain where the corresponding spectra are calculated. Onboard measurements from an actual full-scale frigate are analyzed and compared with the wind tunnel results. Conclusions obtained consist of a series of illustrative values of turbulent energy frequency ranges, which are valuable for any study in this field. The comparison shows a similarity between both experiments, reasserting the role of the wind tunnel measurements in these kind of studies.
Keywords Laser Doppler anemometry, spectral analysis, air wake, turbulence, helicopter flight path, wind tunnel ship experiments
Introduction
Helicopters are one of the most important tactical elements on modern warships and they perform a variety of vital functions. The vertical take-off and landing (VTOL) capability make them particularly well suited for maritime operations. Adverse operating conditions at the ship-helicopter dynamic interface make these environments specially complicated situations for the development of these operations. The pilot must deal with the air wake formed by the flow separation caused by the ship's superstructure. This flow features many characteristics typical of bluff body wakes, including very high levels of turbulence that lead to large spatial and temporal velocity gradients due to the shear layers and vorticity. In addition, there may exist a relatively high concentration of energy over the frequency range of 0.2-2 Hz, which can severely impact the pilot workload.1 In Figure 1, a photograph taken in the wind tunnel facility shows a visualization of the air wake above the flight deck (white line indicates the ship contour).
As a result, there is a significant loss of accuracy in the position, and the fact that the flight deck is a moving platform requires the pilots to maintain
hover over the flight deck before attempting the final stage of the landing maneuver. Temporal velocity gradients in the air wake lead to fluctuations in the aerodynamic loads and rotor response during the landing maneuver, causing unsteady disturbances in the attitude. As defined by Crow et al.,2 "the effectiveness of ship-based military helicopters is dependent on the speed of deployment and the ability of the aircraft to take off and land safely in all but the severe weather conditions". Improvements in the operating limits of maritime helicopters are the main reasons that justify the necessity of a careful study of a ship's superstructure air wake.
The study carried out in this investigation consists of the measurement of flow velocity in five points along the final stage of a helicopter landing operation
National Institute for Aerospace Technology, Madrid, Spain 2Technical University of Madrid, School of Aerospace Engineering, Madrid, Spain
Corresponding author: R Bardera-Mora, National Institute for Aerospace Technology, Ctra Ajalvir pk 4, Torrejon de Ardoz, Madrid, 28850, Spain. Email: [email protected]

Figure I. Visualization of the air wake formed by the superstructure of the ship.
on the flight deck of a scaled model of a frigate in a wind tunnel experiment. The comparatively high spatial and temporal resolution obtained in measurements using laser Doppler anemometry (LDA) make this system the perfect choice for turbulent flow measurements. Measurements obtained during the wind tunnel tests involving the scaled frigate model will enable a spectral analysis using an in-house software developed with Matlab. Dimensional analysis permits the calculation of characteristic values of the airflow on an actual full-scale frigate.
On the other hand, onboard measurements have been taken in order to compare the spectra with the wind tunnel results. This paper pretends to follow the lines of other works such as studies carried out in Robertson et al.,3 Polsky et al.,4 Snyder et al.5 7, where onboard, wind tunnel, and computational fluid dynamics results were compared.
Wind tunnel experiment
A 1:50th scale model of a frigate was built in order to reproduce the air wake formed above the flight deck by the ship's superstructure. The relative wind velocity blowing on the ship is a combination of the ship-owned velocity and the atmospheric wind speed. A typical velocity of a frigate can approximately reach lOm/s (20 knots) and a characteristic value of lOm/s of the atmospheric wind speed can be considered. Thus, the wind tunnel air speeds used in the experiment are C/oo=10m/s and 20m/s, with being U^ the freestream velocity.
Dimensional analysis
A typical frigate type ship operates at a maximum beam-based Reynolds number in the range of 107-108 and if the edges are sharp, as almost all are, a Reynolds number above 1.1 x 10⁴ is adequate and allows Strouhal modeling of the roll/heave/pitch of
most ships.8 Moreover, it has been demonstrated that the flow characteristics for several sharp-edge bodies are unchanged with Re varying from 104 to 107. Although Reynolds number based on full-scale ship beam could be of an order of magnitude larger, it can be argued that no significant changes will occur with this increase in Reynolds number.9
The beam of a frigate is denned as the width of the ship, and in the case of the frigate model tested, the beam is B = 0.3 m. Thus, when the wind velocity is lOm/s, the corresponding Reynolds number is 2.1 x 10⁵, a value which clearly exceeds the minimum recommended Reynolds number of 1.1 x 10⁴.
The geometric scale is Lms/Lfs= 1/50 as already mentioned, where subscripts fs and ms refer to full scale and model scale, respectively. For the velocity, there will be no scale conditions, meaning that Vms/Vfs=\. Frequency scaling is necessary to correctly capture the unsteady aerodynamic flow in the superstructure wake.10,11 It is also the most important scaling parameter because the spectrum of the wake kinetic energy is the object of study. Hence, the Strouhal number (St) is introduced as follows
where / , L, and V are respectively the characteristic values of the frequency, the length, and the velocity of a process. Assuming no variation of Strouhal number corresponding to the Reynolds number at full and model scales, frequency scaling following Lee and Zan,10 is given as
V ms/ \J-'ms/ \ ' ms/
And finally, the value of the frequency scaling is
\JZ) = Ws)= 50 (3)
Experiment design
The experiments were performed with two wind tunnel speeds lOm/s and 20m/s and two wind directions p = 0° and 30°, typical cases for these kind of studies.12 Moreover, previous results obtained on testing this specific frigate13 show that the case of p = 30° creates a severe turbulent behavior giving a turbulence intensity peak in the air wake and it holds interesting results for this study. In Figure 2, a photograph of the ship model in the wind tunnel is shown. The LDA probe can be seen above the flight deck.
Coordinates of measurement points are shown in Table 1, according to ship axes depicted in Figure 3.

Figure 2. Ship model in the wind tunnel during the experiment.
Ship model
The ship model is made out of wood and represents a specific frigate in geometrical similarity in 1:50 scale. The main dimensions (in mm) of the model are detailed in Figure 3.
The dimensions that play an important role in the development of the experiment are the beam B, the length overall LOA, the flight deck length LD, the hangar height H, and length of the superstructure Ls. The superstructure consists of the extension of the structure that projects above the main deck of the ship. The superstructure causes the air wake over the flight deck that is studied in this experiment. The hangar is the final module of the superstructure preceding the flight deck, which is dedicated to the helicopter operations.
Table I. Measurements conditions.
Point
2
3
4
5
(x, y, z)
(mm)
(0,0, 100)
(0, 75, 100)
(0, -150, 100)
(0, -225, 100)
(0, -300, 100)
Uoo (m/s)
10
20
10
20
10
20
10
20
10
20
"i
(m/s)
u
V
u
V
u
V
u
V
u
V
p o 0
30
0
30
0
30
0
30
0
30
Wind tunnel facility
The test facility used for these experiments is a continuous-flow, closed-circuit, open test section ( 3 x 2 m2) wind tunnel type, located in the Experimental Aerodynamics Area of the National Institute for Aerospace Technology (INTA) in Madrid. The wind tunnel fan is driven by a DC 450 kW Electric Motor at 420 V, providing a maximum airflow velocity of 60 m/s while the turbulence intensity is 0.5% during the tests.
The ship model is placed on a platform located in the test section. This platform enables a simplified simulation of the sea surface, creating a thin boundary layer. This boundary layer does not represent the corresponding maritime boundary layer, where the wind speed profile corresponds to a certain power law and turbulence spectrum model.14
Figure 3. Main dimensions of the ship model.
Flow measurement equipment
In order to perform the spectral analysis, an LDA was used to achieve the required spatial and temporal resolution. A Dantec Dynamics LDA has been used to measure two components of the velocity. Light source is provided by a continuous 10 mW He-Ne laser (632.8 nm). The laser is connected to an optic fiber for illumination and reception of back-scattered light from the tracer particles.
The use of LDA requires the seeding of the flow with tracer particles that will allow a proper light scattering.15 In this experiment, olive oil particles with an approximate diameter of 1 (im have been used to seed the flow. To fulfill these seeding conditions an atomizer,16 run by pressurized air, expels the oil particles through the two main stacks of the ship model and through a conduct located in the nozzle of the wind tunnel.
The LDA equipment provides an output consisting of the times of arrival of the particles th the transit time tth and the measured component of the velocity of the particle M,-.17 The transit time corresponds to the time spent by a particle crossing the measurement volume formed by the two laser beams. Another important parameter given by the LDA system is the data rate, which corresponds to the number of particles registered per unit of time.
Measurement considerations
To obtain an order of magnitude of the main frequencies expected in the spectral analysis, an estimation based on a simplification of the ship's superstructure is done. Numerous flow topologies have been shown to exist over the flight deck for many wind directions.18 In the case of wind directions on and near the bow, the resulting flow formed in the air wake can be approximated by the flow formed by a backward facing step.19 22
Results obtained by British Standard23 show the Strouhal numbers obtained in the wake of a rectangular section cylinder, as in this case, simulates a rectangular backward facing step of dimensions d x b, where d is the length and b the height of the rectangle. In the case of the ship's superstructure, d/b = 4.2, corresponding to a Strouhal number of 0.13.
Once a Strouhal number is obtained, an initial value of the characteristic frequencies involved in the air wake can be estimated. Given the upstream velocities U^ and the hangar height, using the definition of the Strouhal number, the frequencies, for model scale, attained are 7.22 Hz and 14.44 Hz, for lOm/s and 20m/s of airspeed, respectively.
These frequencies establish a lower limit in the sampling rate,24 and following the Nyquist sampling criteria, fs ^ 2fm3LX, where fs is the sampling frequency and /max is the maximum frequency in the phenomenon studied.
Hence, the quantity of seeding particles detected per unit of time must exceed these frequencies with a considerable margin. After all, these frequencies are rough estimations. In order to achieve an optimum resolution of the spectra, the minimum duration of the measurement recording has been decided to be a quantity greater than the inverse of the minimum sampling rate, as tr x l03/fs, where tr is the duration of the recording measurements.
Owing to the vibrations of the structure used to support the LDA probe and the possible turbulence that could be induced by the wind tunnel, measurements must be taken without the ship model in order to quantify these effects.
Algorithm
The spectral analysis requires some techniques that considerably improve the quality of the spectra. First of all, it is necessary to resample the signal registered since the particles detected by the LDA system follow an arrival pattern that can be adjusted to Poisson statistical distribution. This means that temporal distribution of the measurements will be highly irregular. The use of a fast Fourier transform (FFT) algorithm for computational efficiency requires that the discrete samples be evenly distributed in time. This can be accomplished by resampling by the sample and hold method explained in Benedict et al.25
For the estimation of the spectra, the algorithm program flow chart shown in Figure 4 is developed as an in-house software using Matlab. In this program, the signal x(i) is resampled because it is not evenly distributed in time. The Welch averaging method is used by splitting the signal into a number of portions predefined by the user.26 Then, for each portion, the Hann window function is applied27 as tapering. This window is used mainly because of its widespread use but it can be changed by the user. In order to maximize computational efficiency, zeros are added (zero padding) to different portions so as to acquire a number of samples corresponding to a power of two. FFT is applied to each of the portions to calculate several periodograms,28 which are then averaged to obtain the final estimation of the spectrum S(f).
Results
Amplitude analysis. An initial amplitude analysis is carried out to estimate the mean value of the flow velocity components. These estimations are then subtracted from the velocity component signals ensuring that large constant components in the signal do not drown small fluctuations. The random arrival of particles detected by the LDA system cause biased statistical moments.29 This can be solved with a weighting factor based on the transit time ttt of each particle through the measurement volume.30

Figure 4. Spectral analysis program f low chart.
0.03
0.025
0.02
„ 0.015 03
\l
E, Q w o.oi Q.
0.005
u component
P1
P2
P3 P4 P5
0.03 r
0.025
^component
10 10 10 10
f (Hz)
• P I
•P2
P3
•P4
•P5
10
Figure 5. Spectra fo r U(XI= lOm/s and ji-
PSD: power spectral density.
Spectral analysis. The main goal of the spectral analysis is to search for the frequencies which contain most of the energy of the air wake. The results obtained are shown in Figures 5 to 8, directly with the frequency corresponding to the model scale fms. The spectra are represented in metric system (SI), i.e. in m2/s.
The data rate obtained during the measurements highly exceeds the minimum frequencies calculated in the previous section. The averaged data rate
reached was about 300 particles per second. These values are an order of magnitude higher than the estimation of the characteristic frequencies.
Energy frequencies. The results obtained in the spectra show that for the case of Uoo= 10m/s and /J = 0°, the most energetic frequencies are around 7.5 Hz (see Figure 5). For the case of C/oo = 20m/s and /J = 0°, the most energetic frequencies clearly reach above
0.1
0.09
0.08
0.07
0.06
„ 0.05
CM
-§- 0.04 Q M 0- 0.03
u component
0.02
0.01
o iou 10 10
f (Hz) ms v '
P1
P2
P3
P4
P5
10
f component
P1
P2
P3
P4
P5
10
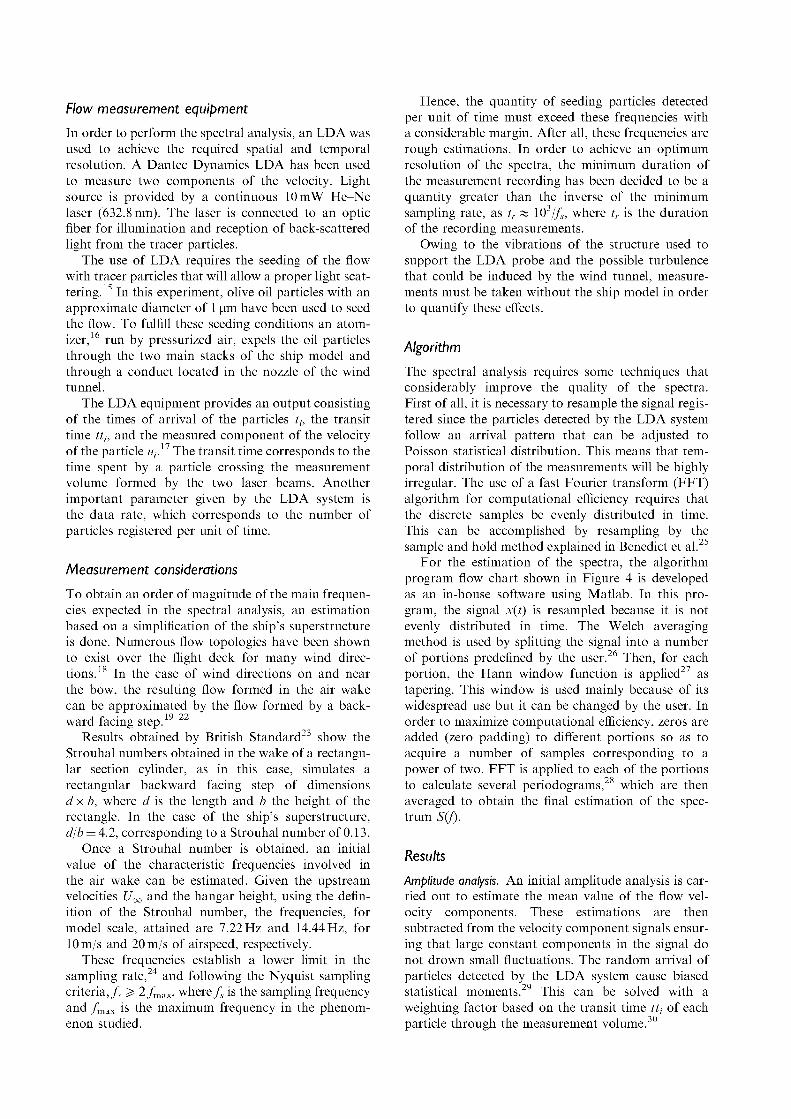
Figure 6. Spectra for Uoa = 20mls and /S = 0° PSD: power spectral density.
Q
0.03
0.025
0.015
0.005
u component
& >
• - . *
P2
P5
0.035
0.03
0.025
0.02
0.015
Q
0.01
0.005
10 10 10 10 10
f (Hz) ms v '
^component
10 10
f (Hz) ms v '
-"\ \ J V \l
{
I I \
\
•P1
• VI
P3
•P4 P5
10
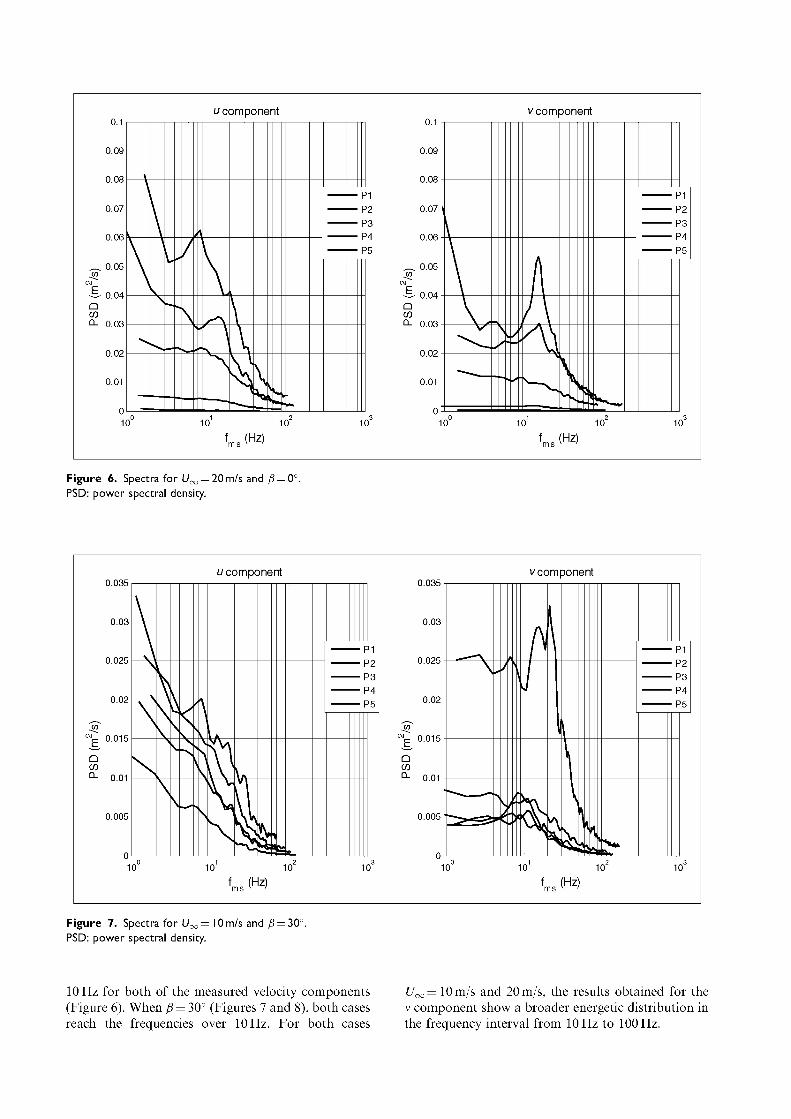
Figure 7. Spectra for Uoo= lOm/s and /S = 30° PSD: power spectral density.
10 Hz for both of the measured velocity components C/oo= 10m/s and 20m/s, the results obtained for the (Figure 6). When p = 30° (Figures 7 and 8), both cases v component show a broader energetic distribution in reach the frequencies over 10 Hz. For both cases the frequency interval from 10 Hz to 100 Hz.

u component v component
, - , 0.1
P1 -
P2 P3
P4 P5
10 10
f (Hz)
, - , 0.1 wo
"E
\ \
^ • * . «./
9*
' • ^
" ^ ^
^ *V ^ -*>
P1 -P2 P3
P4 P5
M+ 10 10
f (Hz)
Figure 8. Spectra for Uoo = 20mls and /S = 30°
PSD: power spectral density.
Effect of wind speed. Comparing Figures 5 to 8, it can be observed than the magnitude of the spectra increases with velocity as the turbulence measured raises due to higher fluctuations in the velocity.
A comparison between the spectra obtained for [7oo=10m/s and the corresponding ones for C/oo = 20m/s shows a leakage in frequencies for the latter, which means a more chaotic behavior of the air wake and peaks less denned. In general, this leakage is more marked for the u component of the velocity than for the v component, where peaks tend to be more denned.
Another conclusion deduced from the spectra figures is the increase in frequency of the energetic region in the spectrum with the increase in wind velocity.
Effect of position. The effects of position show a decrease in the intensity of the spectra as the measurement points are located more far away from the center of the flight deck. In the case of fi = 0c
(Figures 5 and 6), results obtained for the u component of the velocity show a steady decrease. The curve obtained for the point P5 can hardly be appreciated in the scale used in this representation. These results make sense because the fluctuations that appear in the points that are more far away from the air wake are similar to corresponding fluctuations that appear in the flow without perturbations of the frigate. The corresponding results for the v component show high intensities for the curves obtained in points PI and P2.
For the case of p = 30° (Figures 7 and 8), the intensity of the spectra suffers a less appreciated decrease as the measurement points are further from the center of
the flight deck. Results obtained for the u component show small differences between the intensity of the spectra obtained in PI and P2 and the ones obtained for the rest of the points. In the case of the v component, however, the spectra obtained for PI show a much greater intensity than the resulting spectra in the rest of the points. These results show that air wake produced by the flow separation in the superstructure covers all of the measurement points including the ones that are not above the flight deck.
Onboard measurements
Experimental setup
In situ measurements were taken above the flight deck of an actual frigate at sea. The purpose of this experiment is to validate the previous wind tunnel results. Onboard measurements are rarely found among the literature, with studies such as Snyder et al.6,7 and Brownwell et al.31 being some of the few examples. In Figure 9, a photograph taken during the onboard measurement acquisition is displayed.
Two sonic three-component anemometers were used during the tests. The resolution of anemometers was about 0.01 m/s of airspeed and 1° of wind direction. The sampling rate was 1 Hz. The ship course was fixed during 15min and the anemometers' measurements were recorded. The first anemometer was located at the bow of the ship in order to verify measurements of the own ship anemometers. It was placed on a mast 5 m above the ship floor and 14 m upstream of the bridge, giving approximately undisturbed
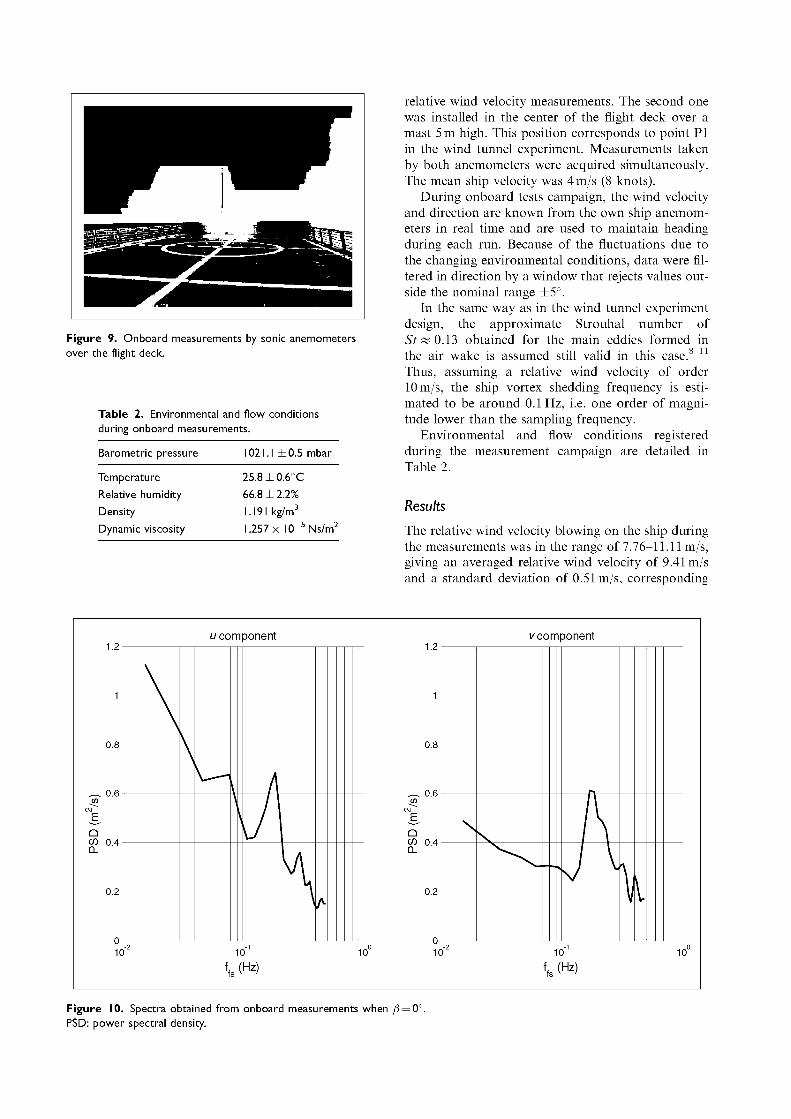
relative wind velocity measurements. The second one was installed in the center of the flight deck over a mast 5 m high. This position corresponds to point PI in the wind tunnel experiment. Measurements taken by both anemometers were acquired simultaneously. The mean ship velocity was 4m/s (8 knots).
During onboard tests campaign, the wind velocity and direction are known from the own ship anemometers in real time and are used to maintain heading during each run. Because of the fluctuations due to the changing environmental conditions, data were filtered in direction by a window that rejects values outside the nominal range ±5°.
In the same way as in the wind tunnel experiment design, the approximate Strouhal number of St x 0.13 obtained for the main eddies formed in the air wake is assumed still valid in this case.8 n
Thus, assuming a relative wind velocity of order lOm/s, the ship vortex shedding frequency is estimated to be around 0.1 Hz, i.e. one order of magnitude lower than the sampling frequency.
Environmental and flow conditions registered during the measurement campaign are detailed in Table 2.
Results
The relative wind velocity blowing on the ship during the measurements was in the range of 7.76-11.11 m/s, giving an averaged relative wind velocity of 9.41 m/s and a standard deviation of 0.51 m/s, corresponding
1.2
1
0.8
—. 0.6
CM
E_ Q W 0.4 Q.
0.2
0 1(
u component y component
\ \ A
CM
E_ Q Q. f J \
\ V
\ V
- 2 -1 0 - 2 -1 0
) 10 10 10 10 10 ffs(Hz) ffe(Hz)
Figure 10. Spectra obtained from onboard measurements when /3 = 0°. PSD: power spectral density.
Figure 9. Onboard measurements by sonic anemometers over the flight deck.
Table 2. Environmental and flow conditions during onboard measurements.
Barometric pressure 1021.1 ± 0.5 mbar
Temperature
Relative humidity
Density
Dynamic viscosity
25.8±0.6°C
66.8 ± 2.2%
1.191 kg/m3

7
6
5
Sf 4 CM
E. Q CO 3 D .
2
1
0
1(
u component ^component
(M
E. Q
Q_
\
\ '
\
\
i
\ \ *••*
/i
J \
\ / »
I \ A
- 2 -1 0 - 2 - 1 0
) 10 10 10 10 10
f,s <HZ) f,s <HZ)
Figure I I. Spectra obtained from onboard measurements when /3 = 30° PSD: power spectral density.
10
Q CO Q.
05 c o £ 10
o
u component
10
k ~h A
Model Full Scale
i i i i i i
10
Q CO Q.
TO
c .2 -1 co 10 c CD
o
10 10 1 0
St 10 10
v component
\ I
Wr i ^
Model Full Scale i I I I
10 St
10
Figure 12. Nondimensional spectra comparison between onboard and wind tunnel data when ji-PSD: power spectral density.
to a Reynolds number of 1.3 x 10⁷. The spectra obtained using onboard anemometer data are shown in Figures 10 and 11. These spectra correspond to the cases of y6 = 0° and y8 = 30°, respectively.
The results obtained show a clear concentration of energy in the range from 0.1 Hz to 0.2 Hz, which is
very close to the frequency interval that is considered to be dangerous helicopter maneuvers.1 In the case of P = 0°, the spectra show accentuated peaks, while as for ^ = 30° the peaks energy in u component are spread over a wider interval in the range of 0.1-0.2 Hz. Spectra intensity are greater when

Non
-dim
ensi
onal
PS
D
o
o
o
o
u component
Model
Full Scale
*(. V\
f 10"1
St
101
Q
r? 10°
o 'en 03 E
^ 1
c 10 2
/«
10"2
i/component
Model
Full Scale
* i
\ \ »*
0 -2 -1
10 10 10 St
*,
10°
Figure 13. Nondimensional spectra comparison between onboard and wind tunnel data when ji-PSD: power spectral density.
:30°
P = 30° owing to a more chaotic flow structure created over the flight deck, which means more fluctuations that lead to a higher variance.
Model and full-scale comparison
Figures 12 and 13 show a comparison between the spectra obtained with onboard measurements and from wind tunnel data. In order to study the resemblance of the spectra, a nondimensionalization is required both for the power spectral density (PSD) and the frequency. The PSD is nondimensionalized
given as following Lee and Zan,10
PSD cr2H/Ua
(4)
where a is the variance of the measurements, H the hangar height, and Uoo the relative wind speed. The values used correspond to the model and to the full-scale ship in each respective case. On the other hand, the frequency is nondimensionalized to give the hangar height-based Strouhal number, defined as St=fH/U00.
The onboard results were acquired for an averaged relative wind speed of 9.41 m/s. Hence, the wind tunnel data used for this comparison corresponds to the one obtained with a relative wind speed of 10 m/s.
The results show a clear similarity between the spectra. The nondimensionalized spectral intensity is of the same order of magnitude. In Figure 12, which shows the results obtained for /J = 0°, the spectra agree in a precise manner for the u component of
the velocity and the energetic frequency ranges match. As for the v component, the spectral curves show the same tendencies which only have a slight displacement in the frequency range. For y8 = 30°, the similarities are less evident.
Possible differences between both the full-scale and model results are owed to the fact that the onboard measurements are taken in a changing environment, thus, the standard deviation of relative wind velocity in both magnitude and direction is much greater than those measured in wind tunnel. Besides, during the wind tunnel experiments, the ship motions as well as the atmospheric boundary layer were not simulated properly, which may induce some variations in the results. In addition, similarity between the model and the full-scale frigate may not be fully attained and wind tunnel influence in the upstream flow can have an effect in the spectra. However, turbulent energy content of the ship air wake flow has been detected adequately by wind tunnel testing with a high fidelity for the u component of the case of /J = 0°, but slight differences or spectra displacements are detected for the v component and for both components in the case of y8 = 30°. In these cases, wind tunnel predicts spectra with a lower PSD than those measured onboard.
Conclusions
The flow frequencies produced by the ship's superstructure air wake are present in the flow above the flight deck during helicopter operations, which can severely impact the pilot workload when they are contained in the range between 0.2 Hz and 2 Hz.1
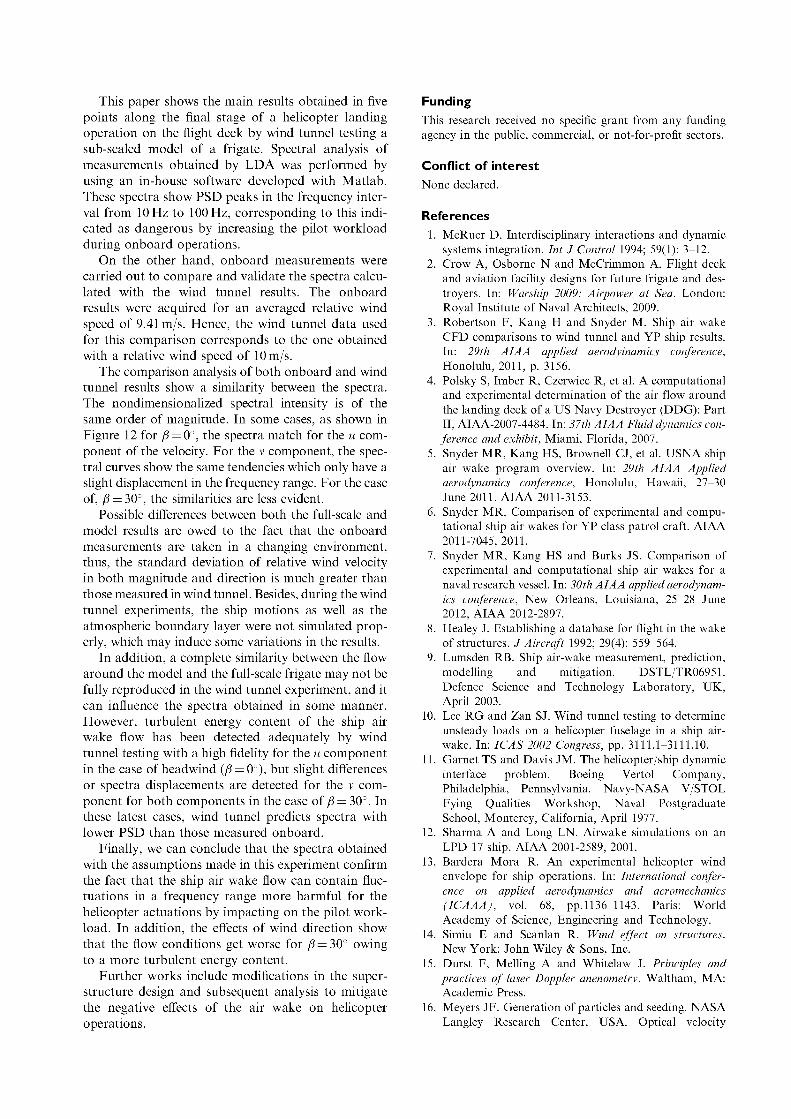
This paper shows the main results obtained in five points along the final stage of a helicopter landing operation on the flight deck by wind tunnel testing a sub-scaled model of a frigate. Spectral analysis of measurements obtained by L D A was performed by using an in-house software developed with Matlab. These spectra show PSD peaks in the frequency interval from 10 Hz to 100 Hz, corresponding to this indicated as dangerous by increasing the pilot workload during onboard operations.
On the other hand, onboard measurements were carried out to compare and validate the spectra calculated with the wind tunnel results. The onboard results were acquired for an averaged relative wind speed of 9.41 m/s. Hence, the wind tunnel data used for this comparison corresponds to the one obtained with a relative wind speed of 10 m/s.
The comparison analysis of both onboard and wind tunnel results show a similarity between the spectra. The nondimensionalized spectral intensity is of the same order of magnitude. In some cases, as shown in Figure 12 for /J = 0°, the spectra match for the u component of the velocity. For the v component, the spectral curves show the same tendencies which only have a slight displacement in the frequency range. For the case of, y6 = 30°, the similarities are less evident.
Possible differences between both the full-scale and model results are owed to the fact that the onboard measurements are taken in a changing environment, thus, the standard deviation of relative wind velocity in both magnitude and direction is much greater than those measured in wind tunnel. Besides, during the wind tunnel experiments, the ship motions as well as the atmospheric boundary layer were not simulated properly, which may induce some variations in the results.
In addition, a complete similarity between the flow around the model and the full-scale frigate may not be fully reproduced in the wind tunnel experiment, and it can influence the spectra obtained in some manner. However, turbulent energy content of the ship air wake flow has been detected adequately by wind tunnel testing with a high fidelity for the u component in the case of headwind (f5 = 0°), but slight differences or spectra displacements are detected for the v component for both components in the case of [3 = 30°. In these latest cases, wind tunnel predicts spectra with lower PSD than those measured onboard.
Finally, we can conclude that the spectra obtained with the assumptions made in this experiment confirm the fact that the ship air wake flow can contain fluctuations in a frequency range more harmful for the helicopter actuations by impacting on the pilot workload. In addition, the effects of wind direction show that the flow conditions get worse for ft = 30° owing to a more turbulent energy content.
Further works include modifications in the superstructure design and subsequent analysis to mitigate the negative effects of the air wake on helicopter operations.
Funding
This research received no specific grant from any funding agency in the public, commercial, or not-for-profit sectors.
Conflict of interest
None declared.
References
1. McRuer D. Interdisciplinary interactions and dynamic systems integration. Int J Control 1994; 59(1): 3-12.
2. Crow A, Osborne N and McCrimmon A. Flight deck and aviation facility designs for future frigate and destroyers. In: Warship 2009: Airpower at Sea. London: Royal Institute of Naval Architects, 2009.
3. Robertson F, Kang H and Snyder M. Ship air wake CFD comparisons to wind tunnel and YP ship results. In: 29th AIAA applied aerodyinamics conference, Honolulu, 2011, p. 3156.
4. Polsky S, Imber R, Czerwiec R, et al. A computational and experimental determination of the air flow around the landing deck of a US Navy Destroyer (DDG): Part II, AIAA-2007-4484. In: 37 th AIAA Fluid dynamics conference and exhibit, Miami, Florida, 2007.
5. Snyder MR, Kang HS, Brownell CI, et al. USNA ship air wake program overview. In: 29th AIAA Applied aerodynamics conference, Honolulu, Hawaii, 27-30 June 2011. AIAA 2011-3153.
6. Snyder MR. Comparison of experimental and computational ship air wakes for YP class patrol craft. AIAA 2011-7045,2011.
7. Snyder MR, Kang HS and Burks JS. Comparison of experimental and computational ship air wakes for a naval research vessel. In: 30th AIAA applied aerodynamics conference, New Orleans, Louisiana, 25-28 June 2012, AIAA 2012-2897.
8. Healey J. Establishing a database for flight in the wake of structures. / Aircraft 1992; 29(4): 559-564.
9. Lumsden RB. Ship air-wake measurement, prediction, modelling and mitigation. DSTL/TR06951. Defence Science and Technology Laboratory, UK, April 2003.
10. Lee RG and Zan SJ. Wind tunnel testing to determine unsteady loads on a helicopter fuselage in a ship air-wake. In: ICAS 2002 Congress, pp. 3111.1-3111.10.
11. Garnet TS and Davis JM. The helicopter/ship dynamic interface problem. Boeing Vertol Company, Philadelphia, Pennsylvania. Navy-NASA V/STOL Fying Qualities Workshop, Naval Postgraduate School, Monterey, California, April 1977.
12. Sharma A and Long LN. Airwake simulations on an LPD 17 ship. AIAA 2001-2589, 2001.
13. Bardera Mora R. An experimental helicopter wind envelope for ship operations. In: International conference on applied aerodynamics and aeromechanics (ICAAA), vol. 68, pp.1136-1143. Paris: World Academy of Science, Engineering and Technology.
14. Simiu E and Scanlan R. Wind effect on structures. New York: John Wiley & Sons, Inc.
15. Durst F, Melling A and Whitelaw J. Principles and practices of laser Doppler anenometry. Waltham, MA: Academic Press.
16. Meyers JF. Generation of particles and seeding. NASA Langley Research Center, USA. Optical velocity

measurements. Selected special topics from previous VKI lecture series. Von Karman Institute for Fluid Dynamics, Belgium, 1994.
17. Dantec Dynamics. BSAflow software version 4.10 user's guide. Denmark: Skovlunde, 2006.
18. Healey J. The aerodynamics of ship superstructures. AGARD-CP-509, Aircraft Ship Operations, Paper 4, 1991.
19. Simpson RL. The stuctructure of the near-wall region of two-dimensional turbulent separated flow. Philos Trans Phys Sci Eng 1991; 336: 5-17.
20. Shafer DM and Ghee TA. Active and passive flow control over the flight deck of small naval vessels. In: 35th AIAA Fluid dynamics conference and exhibit, Toronto, Ontario, Canada, 6-9 June 2005, AIAA 2005-5265.
21. Greenwell DI and Barrett RV. Inclined screens for control of ship air wakes. In: 3rd AIAA Flow control conference, San Francisco, California, 5-8 June 2006, AIAA 2006-3502.
22. Findlay DB and Ghee T. Experimental investigation of ship airwake flow control for US Navy Flight II-A Class destroyer (DDG). In: 3rd AIAA Flow control conference, San Francisco, California, 5-8 June 2006, AIAA 2006-3501.
23. British Standard. (1991). Eurocode 1: Actions on structures. Part 1-4 General Actions-Wind Actions.
24. Shannon C Communication in the presence of noise. Proc Inst Radio Engrs 1949; 37(1): 10-21.
25. Benedict LH, Nobach H and Tropea C. Estimation of turbulent velocity spectra from laser Doppler data. Meas Sci Technol 2000; 11: 1089-1104.
26. Welch PD. The use of fast Fourier transform for the estimation of power spectra: A method based on time averaging over short, modified periodograms. Trans Audio Electroacoust 1967; AU-15: 70-73.
27. Nutall AH. Some windows with very good sidelobe behavior. IEEE Trans Acoust Speech Signal Process 1981; 29: 84-91.
28. Orfanidis S. Introduction to signal processing. London: Pearson Education.
29. McLaughlin D and Tiederman W. Biasing correcting for individual realization of laser anemometer measurements in turbulent flows. Phys Fluids 1973; 16: 2082-2088.
30. George W. Limitations to measuring accuracy inherent in the laser doppler signal. The accuracy of flow measurements by Laser Doppler methods. In: Proceedings LDA symposium, Dantec, pp. 20-63.
31. Brownwell C, Luznik L, Snyder M, et al. In situ velocity measurements in the near-wake of a ship superstructure. J Aircraft 2012; 49(5): 1440-1450.