a study into photocatalytic degradation of methylene blue ...umpir.ump.edu.my/11025/1/fkksa - lum...
TRANSCRIPT

A STUDY INTO PHOTOCATALYTIC
DEGRADATION OF METHYLENE BLUE AND
GLYCEROL AQUEOUS SOLUTION OVER
COPPER FERRITE CATALYST
LUM SIN WAN
Thesis submitted in partial fulfilment of the requirements
for the award of the degree of
Bachelor of Chemical Engineering
Faculty of Chemical & Natural Resources Engineering
UNIVERSITI MALAYSIA PAHANG
Jan 2015
©LUM SIN WAN (2015)

ABSTRACT
There is a growing concern on environmental damage arising from industrial discharge
such as organic dyes from textile, paper, printing and leather sectors as well as glycerol
waste from biodiesel sector. Consequently, this has generated a genuine interest to use
catalytic green pathway to treat these effluents, hence the motivation behind the current
work. In the current work, the photocatalyst employed was copper ferrite (CuFe2O4),
which was prepared via co-precipitation method. Subsequently, the physicochemical
properties of CuFe2O4 were examined using gas pycnometer, N2 physisorption to obtain
Brunauer-Emmett-Teller (BET) specific surface area, Field Emission Scanning Electron
Microscope (FESEM) and X-ray Diffraction (XRD). The effects of photocatalyst on the
photo-degradation of 20 ppm methylene blue solution under visible light were examined
over catalyst loadings of 0.5 and 1.0g/L. From the result, it can be concluded that CuFe2O4
was effective in the photo-degradation of methylene blue solution for both the catalyst
loading of 0.5 and 1.0g/L. In addition, the photo-degradation of 0.5 v/v% glycerol
solution was carried out with a catalyst loading of 2.0 g/L. The 2.0 g/L of CuFe2O4 was
not effective in the glycerol solution. However, when H2O2 was added, a photo-fenton
system was created and it has degraded the glycerol. The amount of hydrogen peroxide
(H2O2) was therefore varied to determine the effectiveness of photo-fenton system of the
catalyst in the photo-degradation of glycerol solution. The best amount of H2O2 for the
glycerol solution-CuFe2O4 was 1.0 ml as it exhibited superior glycerol decomposition.
Keywords: Copper ferrite; Glycerol; Methylene blue; Photocatalysis; Visible light
ABSTRAK
Kerosakan alam sekitar telah berpunca daripada pelepasan perindustrian seperti pewarna
organik dari sektor tekstil, kertas, percetakan dan juga sisa gliserol dari sektor biodiesel.
Oleh yang demikian, hal ini telah menjana minat yang tulus untuk menggunakan laluan
hijau pemangkin untuk merawat efluen ini, iaitu motivasi kerja ini. Pemangkin yang akan
diguna ialah kuprum ferit (CuFe2O4) melalui kaedah “co-precipitation”. Di samping itu,
sifat-sifat fizikokimia CuFe2O4 akan diperiksa menggunakan piknometer gas, kaedah
penyerapan fizikal cecair N2, Brunauer-Emmett-Teller (BET) untuk mendapatkan
kawasan permukaan, Imbasan Elektron Mikroskop (FESEM) dan sinar X-ray (XRD).
Kesan fotomangkin ke atas foto-penguraianlarutan Metilena biru dalam 20 ppm di bawah
cahaya visible telah diperiksa dengan pemangkin 0.5 dan 1.0 g/L. Daripada keputusan
itu, dapat disimpulkan bahawa CuFe2O4 berkesan dalam foto-penguraianlarutan Metilena
biru untuk kedua-dua pemangkin iaitu 0.5 dan 1.0 g/L. Selain itu, foto-penguraianlarutan
dalam 0.5 v/v% gliserol telah dijalankan dengan pemangkin sebanyak 2.0 g/L. CuFe2O4
dalm 2.0 g/L tidak berkesan dalam foto-penguraianlarutan gliserol. Walau bagaimanapun,
apabila H2O2 ditambah, sistem foto-Fenton telah dicipta dan ini telah menguraianlarutan
gliserol. Jumlah hidrogen peroksida (H2O2) telah diubah untuk menentukan keberkesanan
sistem foto-Fenton dalam foto-penguraianlarutan gliserol. Jumlah optimum hidrogen
peroksida ditambah dalam larutan gliserol dengan CuFe2O4 ialah 1.0 ml. Ini telah
menunjukkan prestasi foto-penguraianlarutan terbaik.
Kata Kunci: kuprum ferit; gliserol; fotopemangkinan; Metilena biru; cahaya visible

TABLE OF CONTENTS
SUPERVISOR’S DECLARATION ............................................................................... IV
STUDENT’S DECLARATION ...................................................................................... V
Dedication ....................................................................................................................... VI
ACKNOWLEDGEMENT ............................................................................................. VII
ABSTRACT ................................................................................................................. VIII
ABSTRAK ...................................................................................................................... IX
TABLE OF CONTENTS ................................................................................................. X
LIST OF FIGURES ....................................................................................................... XII
CHAPTER 1 ..................................................................................................................... 1
1 INTRODUCTION .................................................................................................... 1
1.1 Motivation and statement of problem ................................................................ 1
1.2 Objectives ........................................................................................................... 3
1.3 Scopes of study .................................................................................................. 3
1.4 Novelty of work ................................................................................................. 3
1.5 Outline of Thesis ................................................................................................ 4
CHAPTER 2 ..................................................................................................................... 5
2 LITERATURE REVIEW ......................................................................................... 5
2.1 Introduction ........................................................................................................ 5
2.2 Photocatalysis ..................................................................................................... 5
2.3 Mechanism of Photocatalysis ............................................................................. 5
2.4 Fenton system..................................................................................................... 7
2.5 Methylene blue ................................................................................................... 9
2.6 Glycerol .............................................................................................................. 9
2.7 Copper Ferrite as Photocatalyst ....................................................................... 11
2.8 Photocatalysis of Glycerol ............................................................................... 14
2.9 Photo-degradation of Organic Dyes ................................................................. 15
CHAPTER 3 ................................................................................................................... 19
3 METHODOLOGY ................................................................................................. 19
3.1 Introduction ...................................................................................................... 19
3.2 Chemicals ......................................................................................................... 19
3.3 Photocatalyst preparation ................................................................................. 20
3.4 Photocatalyst Characterization ......................................................................... 20
3.4.1 Nitrogen physisorption (BET) .................................................................. 21
3.4.2 Field Emission Scanning Electron Microscopy (FESEM) ....................... 24
3.4.3 X-ray Diffraction (XRD) .......................................................................... 25
3.4.4 Gas pycnometer ........................................................................................ 27
3.5 Photocatalytic-degradation of methylene blue ................................................. 29
3.6 Glycerol Photocatalytic-degradation ................................................................ 31
3.7 Sample analysis ................................................................................................ 31
3.7.1 Ultraviolet-visible Spectroscopy (UV-Vis) .............................................. 31
3.7.2 High Performance Liquid Chromatography (HPLC) ............................... 35
CHAPTER 4 ................................................................................................................... 38
4 RESULTS AND DISCUSSION ............................................................................. 38
4.1 Introduction ...................................................................................................... 38
4.2 Characterization of Photocatalyst .................................................................... 38

4.2.1 Nitrogen Physisorption (BET) .................................................................. 38
4.2.2 XRD Diffraction Pattern ........................................................................... 40
4.2.3 FESEM Analysis ....................................................................................... 41
4.2.4 Density of Photocatalyst ........................................................................... 43
4.3 Photoreaction Study ......................................................................................... 45
4.3.1 Photocatalytic-degradation of Methylene Blue ........................................ 45
4.3.2 Photocatalytic-degradation of Glycerol .................................................... 53
CHAPTER 5 ................................................................................................................... 56
5 CONCLUSIONS AND RECOMMENDATIONS ................................................. 56
5.1 Conclusions ...................................................................................................... 56
5.2 Recommendations ............................................................................................ 57
6 REFERENCES ....................................................................................................... 58
7 APPENDICES ........................................................................................................ 62

LIST OF FIGURES
Figure 2-1: Schematic of reactions occurring via photocatalysis (Casbeer et al., 2012) . 6
Figure 2-2: Structure of Methylene Blue (Wang et al.,2005) ...................................... 9
Figure 2-3: Structure of glycerol (Leoneti et al., 2012) ............................................ 10
Figure 2-4: Industrial applications of glycerol (Tan et al., 2013) .............................. 11
Figure 2-5: Solar energy spectrum (Casbeer et al., 2012) ........................................ 13
Figure 2-6: Degradation of MO and RhB dyes by TiO2/ZnFe2O4 composite
photocatalysts (Casbeer et al., 2012) ..................................................................... 17
Figure 3-1: Schematic diagram of XRD ................................................................ 27
Figure 3-2: Diagram of gas pycnometer ................................................................ 29
Figure 3-3 : Photoreactor with methylene blue solution and CuFe2O4 ....................... 30
Figure 3-4 : Photoreactor with the light-containing compartment ............................. 30
Figure 3-5: Hitachi U-1800 spectrophotometer ...................................................... 32
Figure 3-6 : The Jasco V-550 optical system schematic diagram .............................. 34
Figure 3-7: Example result from UV-VIS analysis ................................................. 35
Figure 3-8: Liquid chromatogram ......................................................................... 36
Figure 3-9: Determination of peak height and area ................................................. 36
Figure 3-10: Agilent 1200 Infinity Series HPLC instrument .................................... 37
Figure 4-1: Adsorption-desorption isotherm of CuFe2O4 using N2 as adsorbate .......... 39
Figure 4-2: Surface area (BET) 2 Parameters Line ................................................. 39
Figure 4-3: XRD pattern of CuFe2O4 .................................................................... 41
Figure 4-4: FESEM micrograph of CuFe2O4 after calcined at 600°C at 5,000X ......... 42
Figure 4-5: FESEM analysis of CuFe2O4 at 15,000X .............................................. 43
Figure 4-6: Graph of density versus cycle number of CuFe2O4 ................................ 44
Figure 4-7: Photo-degradation of 20 ppm methylene blue with 0.5 g/L CuFe2O ........ 46
Figure 4-8: Photo-degradation of 20 ppm methylene blue with 1.0 g/L CuFe2O ........ 47

Figure 4-9 : Photo-degradation of methylene blue solution ...................................... 47
Figure 4-10: Photo-degradation of methylene blue at various amount of H2O2 .......... 50
Figure 4-11: Apparent first order kinetic rate constant of experiment with different
amount of H2O2 .................................................................................................. 52
Figure 4-12: Glycerol photo-degradation with and without CuFe2O4 ........................ 54
Figure 4-13: photo-degradation of glycerol solution with different amount of H2O2 ... 55

LIST OF TABLES
Table 2-1: Some physical and chemical properties of methylene blue (MATERIAL
SAFETY DATA SHEET , 2013) ............................................................................ 9
Table 2-2: Band gap energy for selected photocatalysts ( Casbeer et al.,2012) ........... 13
Table 2-3: Ferrites and mixed ferrites reacted with methylene blue dye (Casbeer et
al.,2012) ............................................................................................................ 16
Table 2-4: Ferrites and mixed ferrites reacted with Rhodamine B dye (Casbeer et
al.,2012) ............................................................................................................ 16
Table 2-5: reaction of various dye with ferrites and H2O2 with no applied irradiation
(Casbeer et al., 2012) .......................................................................................... 17
Table 3-1 : List of chemicals and its applications ................................................... 19
Table 3-2 : List of catalyst characterization techniques and its equipment ................. 20
Table 3-3: List of techniques and equipment for sample analysis ............................. 31
Table 4-1: Information of nitrogen physisorption analysis ....................................... 40
Table 4-2: the value of 2-theta, size and phase name of synthesized CuFe2O4 ............ 41
Table 4-3: Density of copper ferrite ...................................................................... 43
Table 4-4: Conversion of methylene blue photo-degradation ................................... 48
Table 4-5: Summary of apparent first order rate constant and coefficient of
determination ..................................................................................................... 52

1
CHAPTER 1
1 INTRODUCTION
1.1 Motivation and statement of problem
Today, the increase of human population and growing industrialization have culminated
in the discharge of different pollutants to the environment. Indeed, wastewater from the
textile, paper, rubber, plastics, cosmetics, and pharmaceutical and food industries
contains dye stuffs, suspended solids, other soluble organic substances, and heavy metals
which will contaminate the water source (Fan et al., 2014). Most of these contaminants
especially dyes, exist in industrial wastewater and even our drinking water system, which
are extremely dangerous to the environment and human-kind due to their toxicity and
resistance to natural degradation. Furthermore, light penetration in water will be hindered
and photosynthesis in aquatic plants will be disrupted in the presence of dyes. More
importantly, this will kill aquatic life and hence affect the ecosystem (Khosravi &
Eftekhar, 2014). On top of that, dyes are hazardous pollutants which can modify the
physical and chemical properties of any ecosystem.
The current dyeing process is toxic and wasteful. The process can release polluted water
and chemicals. There are more than 100,000 different synthetic dyes available on the
market, produced in over 700,000 tons annually worldwide (Adedayo et al., 2004). In the
textile industry alone, up to 200,000 tons of these dyes are lost to effluents every year
during the dyeing process. This is due to the inefficiency of the dyeing process. Most of
these dyes escape conventional wastewater treatment processes and stay in the
environment as a result of their high stability to light, temperature, water, detergents,
chemicals, soap and other parameters (Ogugbue & Sawidis, 2011). Due to the reasons
mentioned above, wastewater from textile plants is termed as the most polluting by taking
into account of the volume generated and also the effluent composition among all the
other industrial sectors. Subsequently, dyes wastewater has contributed to severe
pollution problems at present (Chequer et al., 2013).

2
For the case of glycerol waste, according to Yusuf et al. (2011), the world biodiesel
capacity in the year 2010 is 15000 million litres, a jump from 9000 million litres recorded
in 2009. Moreover, the report prepared by National Biodiesel Board indicated that there
are 105 biodiesel production facilities operating in the United States in 2007 and 77 other
facilities are in the planning or construction stage. In addition, the annual biodiesel
consumption in the United States has been growing at a rate of 30–50% per year from 15
billion litres in 2006. It is expected to achieve an annual target of 30 billion litres at the
end of year 2012 (Ayoub & Abdullah, 2012). This implies that the production of biodiesel
has increased dramatically; hence generation of glycerol as by-product from
transesterification also increased significantly. Generally, 10 kg of glycerol is produced
for every 100 kg of biodiesel, or in other words, an approximately 10% of glycerol by
volume is generated during the production of biodiesel (Leoneti et al., 2012).
As the demand for biodiesel incrementally increases, the market is expected to be
inundated with crude glycerol. Therefore, there is a need to promote alternative use of the
excess glycerol, either to convert or purify it into some conventional materials that can be
used for food, cosmetics or drugs sectors. Alarmingly, the discharge of untreated glycerol
can cause serious environmental issues. Specifically in Malaysia, glycerol is classified as
waste under Schedule S181 of the Environmental Regulations and stored in drums and
disposed in landfills (Yong et al., 2001). The excess glycerol can be used for the
production of chemical products, fuel additives, production of hydrogen, development of
fuel cells, etc (Leoneti et al., 2012).
Therefore, there is a growing concern on environmental damage arising from industrial
discharge such as organic dyes as well as glycerol waste from biodiesel sector. These two
concerns motivate the current work to explore the potential of employing photocatalysis
to degrade methylene blue and glycerol solution. The chosen catalyst, copper ferrite
(CuFe2O4), is capable of performing photocatalytic conversion of visible solar energy
(wavelength range from 400 to 700 nm) to generate e-/h+ on photocatalytic surface. The
e-/h+ pairs are involved in the pathway towards hydroxyl radical generation which is
critical for the decomposition of the contaminants. To enhance the generation of hydroxyl
radical, Fenton-type system was also created by adding hydrogen peroxide (H2O2). This
system was created in which iron cations react with H2O2, thereby enhancing the
production of reactive oxygen species such as radicals (Casbeer et al., 2012).

3
1.2 Objectives
The current work is aimed at synthesizing, characterizing the physicochemical properties
and evaluating the photocatalytic performance of copper ferrite (CuFe2O4) for photo-
degradation of methylene blue and glycerol solution.
1.3 Scopes of study
In order to achieve the outlined objectives of the current work, the following scopes have
been identified:
I. To synthesize (CuFe2O4) photocatalyst using co-precipitation method employing
metal loading of 30 wt%.
II. To characterize the physicochemical properties of (CuFe2O4) photocatalyst using
spectroscopic analyses such as:
a) FESEM
b) Gas pycnometer
c) Nitrogen physisorption (Brunauer-Emmett-Teller, BET)
d) X-ray diffraction (XRD)
III. To study the photo-degradation of methylene blue and glycerol solution. The
effect of Fenton system in the photo-degradation also being studied.
1.4 Novelty of work
The current work serves to explore the potential of employing photocatalyst to photo-
degrade methylene blue and glycerol solution. The chosen photocatalyst, copper ferrite
(CuFe2O4) is capable in photocatalytic conversion of visible solar energy to generate e-
/h+, which in turn produce reactive oxygen species through redox processes. The
photocatalytic process can be enhanced in a Fenton type system in which iron cations
react with H2O2 thereby enhance the production of reactive oxygen species such as
radicals to further aid in the photo-degradation of methylene blue and glycerol solution.

4
1.5 Outline of Thesis
The structure of the reminder of the thesis is outlined as follow:
Chapter 2 provides a description of the mechanism of the photocatalyst as well as
photocatalysis of methylene blue and glycerol solution. It explains how the photocatalyst
worked in the methylene blue and glycerol solution by harnessing light energy (visible
light). Physical and chemical properties of methylene blue, glycerol and copper ferrite as
photocatalyst are discussed. In addition, photo-fenton system is also discussed. A
summary of previous works regarding photocatalytic activity are also presented.
Chapter 3 provides a review of the preparation method of photocatalyst by using co-
precipitation method. List of chemicals and equipment for characterization in this
research are included in this chapter. Each of the photocatalyst characterization
techniques is discussed as well.
Chapter 4 presents result and discussion in this research work. The result obtained from
the experiment which is photocatalytic activity testing with methylene blue and glycerol
solution is discussed thoroughly.
Conclusion and recommendation are presented in Chapter 5. A summary of this research
work is covered in this chapter.

5
CHAPTER 2
2 LITERATURE REVIEW
2.1 Introduction
This Chapter provides a description of photocatalysis, its mechanism of the photocatalyst
as well as photocatalytic of methylene blue and glycerol solution. It explains how the
photocatalyst works in the methylene blue and glycerol solution by harnessing light
energy. The photo-fenton system will be discussed too, in addition to the physical and
chemical properties of methylene blue, glycerol and copper ferrite as photocatalyst.
Finally, a summary of previous works regarding photocatalytic activity is presented.
2.2 Photocatalysis
Photocatalysis can be defined as the acceleration of a photoreaction in the presence of a
catalyst (Ohama & Gemert, 2011). Photocatalysis has enormous potential to treat organic
contaminants in water and air (Umar & Abdul Aziz, 2013). Consequently, it becomes a
new promising approach to address the environmental problem such as the degradation
of potentially toxic and dangerous contaminants from water including organic dyes and
waste. It is also applied in many other applications including odour control, air
purification, sterilization and cancer therapy, water splitting to produce hydrogen gas,
inactivation of cancer cell and etc. The removal of contaminants such as organic dyes
involve transferring the compounds between phases or from the source to treatment
facilities. Ideally, the contaminants can be degraded photocatalytically into carbon
dioxide and water. Furthermore, this can be done without additional waste or by-products
(Casbeer et al., 2012).
2.3 Mechanism of Photocatalysis
Oxidation and reduction reactions are carried out by photocatalysts activated by light
energy (hv). An electron (e-) is excited from the valence band (VB) to the conduction
band (CB) of the photocatalyst when irradiated with light energy and thus leaving a
6
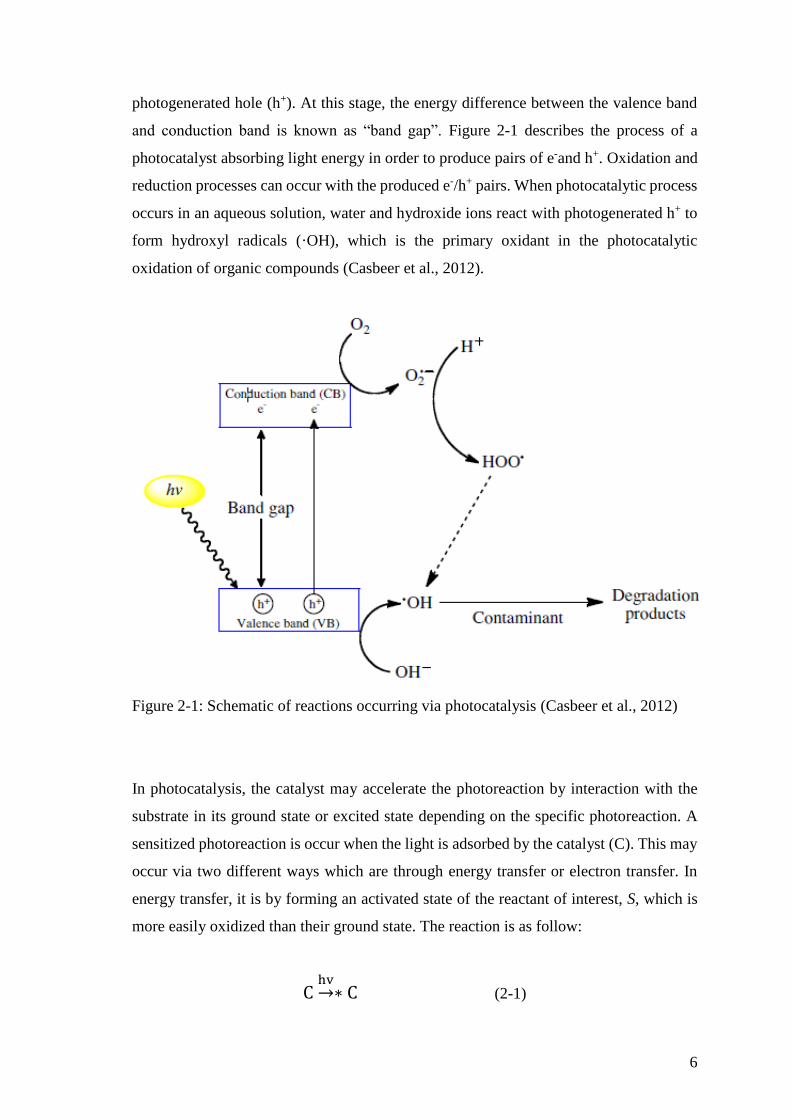
photogenerated hole (h+). At this stage, the energy difference between the valence band
and conduction band is known as “band gap”. Figure 2-1 describes the process of a
photocatalyst absorbing light energy in order to produce pairs of e-and h+. Oxidation and
reduction processes can occur with the produced e-/h+ pairs. When photocatalytic process
occurs in an aqueous solution, water and hydroxide ions react with photogenerated h+ to
form hydroxyl radicals (·OH), which is the primary oxidant in the photocatalytic
oxidation of organic compounds (Casbeer et al., 2012).
Figure 2-1: Schematic of reactions occurring via photocatalysis (Casbeer et al., 2012)
In photocatalysis, the catalyst may accelerate the photoreaction by interaction with the
substrate in its ground state or excited state depending on the specific photoreaction. A
sensitized photoreaction is occur when the light is adsorbed by the catalyst (C). This may
occur via two different ways which are through energy transfer or electron transfer. In
energy transfer, it is by forming an activated state of the reactant of interest, S, which is
more easily oxidized than their ground state. The reaction is as follow:
Chv→ ∗ C (2-1)

7
∗ 𝐶 + 𝑆 →∗ 𝑆 + 𝐶 (2-2)
∗ 𝑆 → 𝑃 (2-3)
The second way is via electron transfer, it is by acting either as an electron acceptor or
donor.
Chv→ ∗ C (2-4)
∗ 𝐶 + 𝑆 → 𝑆¯ + 𝐶+ (2-5)
𝑆¯ → 𝑃¯ (2-6)
𝑃¯ + 𝐶+ → P + C (2-7)
The product, P, is formed from the activated substrate along the potential energy curve
for the case of energy transfer. In the case of electron transfer, a new reaction path is
opened when the photosensinizer transfer an electron to the substrate (Ohama & Gemert,
2011).
2.4 Fenton system
Photo-Fenton system is gaining popularity and is widely used in the advanced oxidation
process (AOP) for the degradation of organic pollutants (Thanh-Thuy et al., 2013).
Fenton system is established when ferrite cations react with hydrogen peroxide, H2O2.
The H2O2, which act as an oxidizing agent, is capable to produce free radicals from water
molecules, namely ˙OH and ˙OOH (reactive oxygen species) when added in a reaction
mixture. This Fenton system (comprised of H2O2/Fe2O3) is capable to enhance the
production of reactive oxygen species and hence further aid in the degradation of
contaminants. The reaction can be illustrated by the equations (Casbeer et al., 2012):
Fe2++ H2O2 → Fe3++ OH-+ ˙OH (2-8)
Fe2++ H2O2 → Fe2++˙OOH + H+ (2-9)
H2O2+ ˙OH → H2O + ˙OOH (2-10)
H2O2+ e- → OH-+ ˙OH (2-11)
OH- + h+ → H+ + ˙OH (2-12)

8
Photo-fenton system was first introduced in 1960s and remain until today. It is the most
applied AOP and is proven for its ability to degrade organic waste by the free hydroxyl
radicals produced and hence is greatly used in the treatment of wastewater. The
production of free hydroxyl radicals can speed up the reaction by providing readily
available binding sites during the photocatalytic degradation of organic dyes and waste
(Ding et al., 2014). It can degrade high loading of organic compounds in highly saline
conditions. H2O2 will form free hydroxyl radicals when it decomposed by Fe2+ ions that
present in the aqueous solution even in the condition of no light irradation. However, in
the presence of light source, the photo-Fenton system is expedited which should result in
the rapid formation of free hydroxyl radicals from H2O2 decomposition by ferrous or
ferric ions. All these soluble iron hydroxy or iron complexes can absorb not only ultra-
violet (UV) radiation but also visible light. Photo-fenton system can react up to a light
wavelength of 600 nm. The rate of a photo-fenton system was proved to be relatively
higher when there is light irradiation compared to the condition in the absence of light
source. This is due to the regeneration of Fe2+ from the photochemical effect of light
source and the concurrent formation of the hydroxyl radicals in the reaction. The system
can be substantial because of the cycle that keep generating hydroxyl radicals by Fe2+
(Chong et al., 2010).
In photo-Fenton system, further increase in the amount of H2O2 concentration above
certain limits (critical concentration) or exceed the optimum level, it will not increase the
rate of photo-degradation. According to Mohabansi et al. (2011), high concentration of
hydroxyl peroxides will act as scavenger itself. This will result in the decreasing of the
concentration of hydroxyl free radicals and thus reducing the efficiency in the photo-
degradation rate. As a result, H2O2 should be added at an optimum concentration to
achieve the best photo-degradation to prevent it acts as a hydroxyl radical scavenger
instead of a free-radical generator (Banat et al., 2005).
Photo-Fenton system has higher photoactivity than the heterogeneous photocatalysis.
However, the performance is largely dependent on water quality parameters. The
generation of highly photoactive iron complexes is highly accounting on water pH and
ions content (De Laat et al., 2004). It was claimed that the optimum pH for photo-fenton
reaction is at 2.8. This is due to the reason that precipitation does not occur which
promotes the formation of dominant iron species of [Fe(OH)] 2+ (Pignatello et al., 1992).
9
2.5 Methylene blue
About 15% of the total world production of dyes is lost during the dyeing process and is
discharged as textile effluents. The release of those coloured dyes in wastewaters has
disrupt the ecosystem (Lachheb et al., 2002). Methylene blue is one of the most well-
known organic dyes and contributes to the dye pollution in water source. Therefore, it
was taken as the photocatalytic reactant model in this work. Methylene blue is a
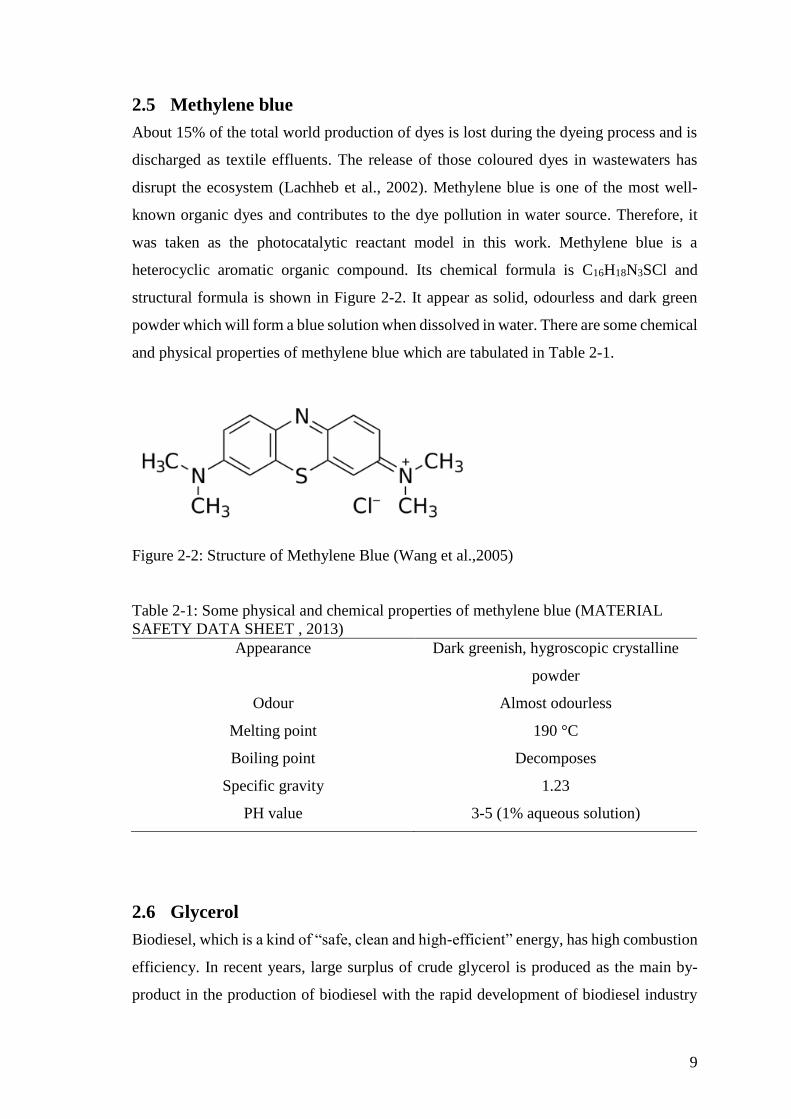
heterocyclic aromatic organic compound. Its chemical formula is C16H18N3SCl and
structural formula is shown in Figure 2-2. It appear as solid, odourless and dark green
powder which will form a blue solution when dissolved in water. There are some chemical
and physical properties of methylene blue which are tabulated in Table 2-1.
Figure 2-2: Structure of Methylene Blue (Wang et al.,2005)
Table 2-1: Some physical and chemical properties of methylene blue (MATERIAL
SAFETY DATA SHEET , 2013)
Appearance Dark greenish, hygroscopic crystalline
powder
Odour Almost odourless
Melting point 190 °C
Boiling point Decomposes
Specific gravity 1.23
PH value 3-5 (1% aqueous solution)
2.6 Glycerol
Biodiesel, which is a kind of “safe, clean and high-efficient” energy, has high combustion
efficiency. In recent years, large surplus of crude glycerol is produced as the main by-
product in the production of biodiesel with the rapid development of biodiesel industry

10
through transesterification process. Figure 3 describes the transesterification reaction of
biodiesel production Therefore, there are more and more attention has been drawn from
researchers over the world on transforming glycerol to high value-added products. The
transesterification reaction of biodiesel production can be represented as (Tan et al.,
2013):
CH2COOR1CHCOOR2CH2COR3
+ 3CH3OH catalyst→
COOCH3R1COOCH3R2COOCH3R3
+ CH2OHCHOHCH2OH
(2-13)
Triglycerides + Methanol catalyst→ Methyl esters + Glycerine
Glycerol which shown in Figure 2-3, also known as glycerine or propane-1,2,3-triol, is a
clear, colourless, odourless, hygroscopic, vicious and sweet taste liquid. The boiling
point, melting point and flash point of glycerol are 290°C, 18°C and 177°C, respectively.
Glycerol has a molecular weight of 92.09 g/mol, a density of 1.261 g/cm3, and a viscosity
of 1.5 Pa.s under normal atmospheric pressure (Tan et al., 2013).
Figure 2-3: Structure of glycerol (Leoneti et al., 2012)
Generally, glycerol can be produced via chemical synthesis or microbial fermentation
from petrochemical feedstocks or can be recovered as a by-product of soap manufacture
from fats. Glycerol is produced as a by-product of the hydrolysis of fats in soap and other
related materials in a traditional way. However, today, this process is of lesser importance
as detergents has already replace soap (Wang et al., 2001). According to Prescott & Dunn

11
(1959), glycerol was produced through the fermentation pathway for the first time on a
large scale using the sulfite-steered yeast process during World War I when the demand
for glycerol in explosive manufacture far more than the supply from the soap industry.
In terms of application, glycerol is refined in an expensive process and can be used in the
chemical, textile, pharmaceutical and food industries. On the other hand, there are
alternatives for the use of unrefined glycerol such as production of chemical products,
production of hydrogen, fuel additives and etc. Figure 2-4 shows the summary percentage
for industrial applications of glycerol (Tan et al., 2013).
Figure 2-4: Industrial applications of glycerol (Tan et al., 2013)
2.7 Copper Ferrite as Photocatalyst
Photocatalyst, is defined as a substance which is activated by adsorbing a photon and is
able to accelerate a reaction without being consumed (Umar & Abdul Aziz, 2013).
Photocatalyst provides pathway for the conversion of solar energy such as UV light,
visible light and infrared etc. for the use in oxidation and reduction processes. In recent
years, ferrites as photocatalyst have attracted a lot of interest and attention. Unlike
Titanium dioxide (TiO2) which has been used for a long time, ferrite is unique owing to
12
its magnetic property. Consequently, it can be easily separated from the reaction mixture
post-photocatalytic reaction. Moreover, band gap is one of the factors that need to be
taken into consideration when employed as photocatalyst. Narrow band gap allows for
the photocatalytic activity under visible light irradiation which has the wavelength of 400-
700nm and accounts for 46% of solar energy. Figure 2-5 shows the solar energy spectrum.
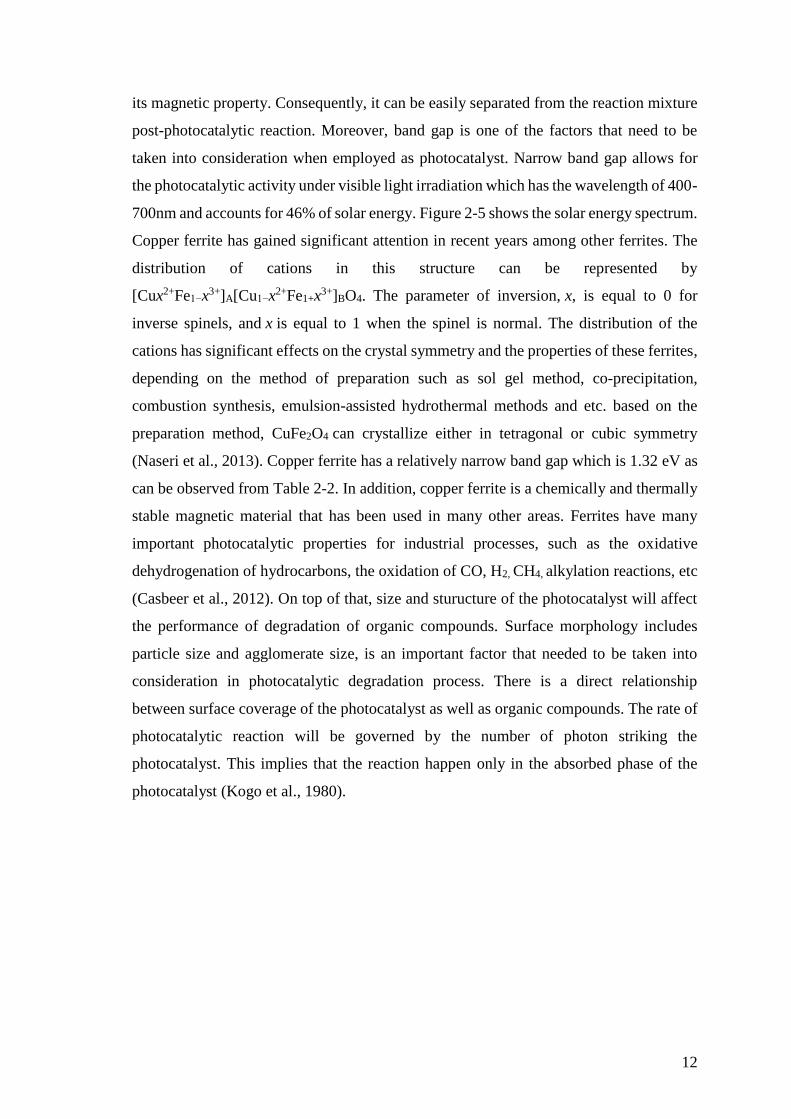
Copper ferrite has gained significant attention in recent years among other ferrites. The
distribution of cations in this structure can be represented by
[Cux2+Fe1−x3+]A[Cu1−x2+Fe1+x3+]BO4. The parameter of inversion, x, is equal to 0 for
inverse spinels, and x is equal to 1 when the spinel is normal. The distribution of the
cations has significant effects on the crystal symmetry and the properties of these ferrites,
depending on the method of preparation such as sol gel method, co-precipitation,
combustion synthesis, emulsion-assisted hydrothermal methods and etc. based on the
preparation method, CuFe2O4 can crystallize either in tetragonal or cubic symmetry
(Naseri et al., 2013). Copper ferrite has a relatively narrow band gap which is 1.32 eV as
can be observed from Table 2-2. In addition, copper ferrite is a chemically and thermally
stable magnetic material that has been used in many other areas. Ferrites have many
important photocatalytic properties for industrial processes, such as the oxidative
dehydrogenation of hydrocarbons, the oxidation of CO, H2, CH4, alkylation reactions, etc
(Casbeer et al., 2012). On top of that, size and sturucture of the photocatalyst will affect
the performance of degradation of organic compounds. Surface morphology includes
particle size and agglomerate size, is an important factor that needed to be taken into
consideration in photocatalytic degradation process. There is a direct relationship
between surface coverage of the photocatalyst as well as organic compounds. The rate of
photocatalytic reaction will be governed by the number of photon striking the
photocatalyst. This implies that the reaction happen only in the absorbed phase of the
photocatalyst (Kogo et al., 1980).

13
Figure 2-5: Solar energy spectrum (Casbeer et al., 2012)
Table 2-2: Band gap energy for selected photocatalysts ( Casbeer et al.,2012)
Ferrite Band gap (eV)
CaFe2O4 1.9
MgFe2O4 2.18
ZnFe2O4 1.92
NiFe2O4 2.19
CuFe2O4
SrTiO3
TiO2
Fe2O3
ZnS
CdS
WO3
Ag3VO4
1.32
3.5
3.2
2.3
3.6
2.4
2.8
2.2
14
2.8 Photocatalysis of Glycerol
In recent years, glycerol has been used to produce hydrogen from different methods such
as steam reforming, gasification, autothermal reforming, aqueous-phase reforming,
electrochemical reforming, photo fermentation and supercritical water reforming
processes. The majority of studies on hydrogen production from glycerol have focused
on thermochemical routes. However, hydrogen can be produced from biomass in ambient
conditions (temperature and pressure) via a photocatalytic route, which is an efficient,
ecologically benign and low-cost process. This technology is based on photo
electrochemical cells operating with two redox systems.
Kondarides et al (2008) have done a lot of experiments on variety of biomass-derived
components, including monosaccharides and hexoses, alcohols and organic acids. From
the experimental results, the amounts of H2 and CO2 produced were found to be in the
following general reforming reaction:
CxHyOz + (2x − z) H2O → xCO2 + (2x − z + y/2) H2 (2-14)
The production of hydrogen and oxygen by water cleavage from glycerol occurs under
non-aerated conditions and is attained by photo-generated electrons and holes,
respectively, in a condition that their energy is sufficient to reduce protons toward
hydrogen molecules and to oxidize water toward oxygen. From another aspects, the
photocatalytic oxidation of glycerol takes place in the presence of oxygen with the
participation of photo-generated holes, which act either directly or indirectly by
generating hydroxyl radicals (·OH), which then lead to the production of CO2 and H2O.
In this case, photo-generated electrons are consumed by chemisorbed oxygen to form
superoxide radicals (·O2¯). In a photo-induced reforming process, the two reactions are
combined, which is the photocatalytic treatment of glycerol solution and derivatives takes
place under non-aerated conditions. This results in the oxidation of the organic substrate
by holes toward CO2, which is accompanied by production of gas-phase hydrogen from
water, while the oxidation of water reaction and the formation of superoxide radicals are
suppressed (Melo & Silva, 2011).

15
For glycerol photo-reforming, the reaction can be shown as:
C3H8O3 + 3H2O → 3CO2 + 7H2 (2-15)
For glycerol photo-oxidation, the reaction can be shown as follows:
C3H8O3 + (7/2) H2O → 3CO2 + 4H2 (2-16)
2.9 Photo-degradation of Organic Dyes
A large amount of effort has been devoted over the years for developing heterogeneous
photocatalysts with high activities for environmental applications including air
purification, water disinfection, hazardous waste remediation, and water purification.
Titania has proven to be the most suitable for widespread environmental applications
among various oxide semiconductor photocatalysts (Yu et al., 2002). However, two main
drawbacks which are low quantum efficiency due to the high recombination rate of photo-
induced electron–hole pairs (e−&h+) and poor absorption ability in the visible-light
region, has limit the efficiency of TiO2 photocatalytic reactions (Yang et al., 2010). Thus,
a great deal of effort has been made to increase the photocatalytic activity of the
photocatalyst. A lot of organic matters can be decomposed into inorganic and low-toxicity
smaller compound through photocatalysis process (Meng & Juan, 2008).
Tables 2-3, 2-4, and 2-5 as well as Figure 2-6 show the previous photocatalytic work of
ferrites in degrading different concentrations of dyes,with different catalyst loading,
irradiation source and irradiation time with the respective degradation in percentage.
Table 2-3 summarizes some works related to the use of ferrites and mixed ferrites for
photocatalyzing methylene blue while Table 2-4 shows works pertaining to ferrites and
mixed ferrites with Rhodamine B dye. Table 2-5 shows some reaction of various dyes
with ferrites and H2O2 in the absence of light irradiation. On the other hand, Figure 2-6
shows the degradation of methylene blue and Rhodamine B dyes by TiO2/ZnFe2O4
composite photocatalysts.

16
Table 2-3: Ferrites and mixed ferrites reacted with methylene blue dye (Casbeer et
al.,2012)
Photocatalyst Dye
(mg/L)
Catalyst
loading
(g/L)
Irradiation
source
Irradiation
time (min)
Degradation
(%)
BaFe2O4 20 5 UV 120 65
TiO2/CoFe2O4/SiO2 6 n/a UV 250 60
TiO2 /CoFe2O4 6 n/a UV 250 0
CoFe2O4/ZnO 50 30 UV 300 93.9
SiO2/NiFe2O4 10 1.0 λ > 400 nm 60 5
Bi12TiO2/NiFe2O4 10 1.1 λ > 400 nm 60 52
SiO2/ NiFe2O4 10 1.1 λ > 400 nm 30 85
Bi12TiO20/ SiO2/
NiFe2O4 10 1.1 λ > 400 nm 240 18
TiO2/ NiFe2O4 8 0.8 UV 420 80
TiO2/ZnFe2O4 10 5 λ > 400 nm 180 5
ZnFe2O4 25 5 λ > 400 nm 240 4
Table 2-4: Ferrites and mixed ferrites reacted with Rhodamine B dye (Casbeer et al.,2012)
Photocatalyst Dye
conc.
(mg/L)
Catalyst
loading (g/L)
Irradiation
time (min)
Irradiation
source
Degradation
(%)
ZnFe2O4 10 2.0 150 200-700 nm 60
ZnFe2O4/Ag (8.1%) 10 2.0 150 200-700 nm 95
ZnFe2O4/Ag (22.7%) 10 2.0 150 200-700 nm 98
TiO2/ZnFe2O4 9.6 1 150 λ =254nm 99.7
Ag/ Fe3O4/ SiO2 25 0.5 150 λ > 420 nm 10
AgI/ Fe3O4/ SiO2 25 0.5 150 λ > 420 nm 20
BaFe2O4/ SiO2/ TiO2 10 0.8 80 UV 59