a study of adaptive thermal comfort in a well-controlled
TRANSCRIPT
A study of adaptive thermal comfort in a well-controlled climate chamber Article
Accepted Version
Yang, Y., Li, B., Liu, H., Tan, M. and Yao, R. (2015) A study of adaptive thermal comfort in a well-controlled climate chamber. Applied Thermal Engineering, 76. pp. 283-291. ISSN 1359-4311 doi: https://doi.org/10.1016/j.applthermaleng.2014.11.004 Available at https://centaur.reading.ac.uk/53608/
It is advisable to refer to the publisher’s version if you intend to cite from the work. See Guidance on citing .
To link to this article DOI: http://dx.doi.org/10.1016/j.applthermaleng.2014.11.004
Publisher: Elsevier
All outputs in CentAUR are protected by Intellectual Property Rights law, including copyright law. Copyright and IPR is retained by the creators or other copyright holders. Terms and conditions for use of this material are defined in the End User Agreement .
www.reading.ac.uk/centaur
CentAUR
Central Archive at the University of Reading

Reading’s research outputs online

1
A study of adaptive thermal comfort in a well-controlled climate
chamber
Yu Yang a, b, Baizhan Lia, b, *, Hong Liu a, b, Meilan Tan a, b , Runming Yao c*
a Key Laboratory of the Three Gorges Reservoir Region’s Eco-Environment,
Ministry of Education, Chongqing University, Chongqing 400045, China;
b National Centre for International Research of Low-carbon and Green Buildings,
Ministry of Science and Technology, Chongqing University, Chongqing 400045, China;
c School of Construction Management and Engineering, University of Reading
Highlights
1. The discrepancy between the PMV and AMV in a well-controlled environment
was observed;
2. People’s long-term living experience in the hot-humid climate accustoms
thermal sensation to warm;
3. Habituations neutralises thermal sensation due to moderated thermal
sensibility of the skin;
4. A revised PMVa are proposed as 20.22 0.45 0.1aPMV PMV PMV
5. PMVa contributes to the thermal engineering solutions in terms of energy
efficiency of an air-conditioning system.

2
Acronyms MST mean skin temperature (℃)
P probability in Hypothesis Testing
AMV actual mean vote PMV predicted mean vote
ANOVA analysis of variance SET* standard effective temperature (℃)
Abbreviations PMVa adaptive predicted mean vote
R heat or lost by radiation (W/m2)
A body surface area (m2) Tback skin temperature of back (℃)
C heat lost by convection (W/m2) Tc core temperature (℃)
cb specific heat of blood [J/(kg•℃)] Tc/dt rate of change in core
temperature (℃/s)
cc specific heat of core [J/(kg•℃)] Tcalf skin temperature of calf (℃)
cs specific heat of skin [J/(kg•℃)] Tchest skin temperature of chest (℃)
Edif heat of vaporized water diffusing
through the skin (W/m2) Tforehead skin temperature of forehead (℃)
Eres heat loss by respiration (W/m2) Thand skin temperature of dorsal hand
(℃)
Ersw heat loss by regulatory sweating
(W/m2) Tlower arm
skin temperature of lower arm
(℃)
K heat conductance of skin tissue
[W/(m2·℃)] Ts skin temperature (℃)
M metabolic rate (W/m2) Ts/dt rate of change in skin temperature
(℃/s)
mc mass of core (kg) Tthigh skin temperature of thigh (℃)
ms mass of skin (kg) Tupper arm skin temperature of upper arm
(℃)
Mshi metabolic heat by shivering (W/m2) Vb rate of skin blood flow[kg/(m2•s)]
Abstract
This paper aims to critically examine the application of Predicted Mean Vote (PMV) in
an air-conditioned environment in the hot-humid climate region. Experimental studies
have been conducted in a climate chamber in Chongqing, China, from 2008 to 2010. A
total of 440 thermal responses from participants were obtained. Data analysis reveals

3
that the PMV overestimates occupants’ mean thermal sensation in the warm
environment ( 0PMV ) with a mean bias of 0.296 in accordance with the ASHRAE
thermal sensation scales. The Bland-Altman method has been applied to assess the
agreement of the PMV and Actual Mean Vote (AMV) and reveals a lack of agreement
between them. It is identified that habituation due to the past thermal experience of a
long-term living in a specific region could stimulate psychological adaptation. The
psychological adaptation can neutralize occupants’ actual thermal sensation by
moderating the thermal sensibility of the skin. A thermal sensation empirical model and
a PMV-revised index are introduced for air-conditioned indoor environments in hot-
humid regions. As a result of habituation, the upper limit effective thermal comfort
temperature SET* can be increased by 1.6℃ based on the existing international
standard. As a result, a great potential for energy saving from the air-conditioning
system in summer could be achieved.
KEYWORDS: Thermal comfort, adaptation, PMV, Skin temperature, Hot-humid
region, Air-conditioned environment.
1. Introduction
The Predicted Mean Vote (PMV) developed by Fanger is a commonly used index to
assess occupants’ thermal comfort which has been referenced in international standards
including ISO 7730 [1], ASHRAE 55 Standard [2], EN 15215 [3] and Chinese Standard
[4]. It is based on the principle of steady-state heat balance and predicts the mean value
of the votes of a large group of persons on the 7-point thermal sensation scale (cold (-
3), cool (-2), slightly cool (-1), neutral (0), slightly warm (1), warm (2), hot (3)) by six
inputs (air temperature, mean radiant temperature, air speed, humidity, metabolic rate
and the insulation of the clothing) [5]. In the HVAC engineering design practice, PMV
is expected within ±0.5 to meet 90% occupant satisfaction criteria for indoor thermal
environment [1-4]. However the PMV has been challenged by the adaptive thermal
comfort principle from field studies and has been criticized as over/under estimating
occupants’ actual thermal sensation, i.e. Actual Mean Vote (AMV) [6, 7]. Research into
adaptive thermal comfort first began following the oil crisis in the mid-70’s [8] and has
increased dramatically in recent years due to the concerns over climate change and
energy efficiency.
4
It has been concluded that behavioral, physiological and psychological adaptation
processes are the three types of presumed causes of the discrepancies between the PMV
and AMV [6, 9]. However, besides giving a statistical approximation of the general
effect of such adaptive processes on the thermal perception vote, little is known about
the individual contributions of the three types of adaptive processes to the effect [10].
Liu et al. [11] conducted a subjective survey research and introduced a method of
quantifying the portions of the adaptation processes by weighting the contribution of
these three adaptation categories to the thermal adaptation using the analytic hierarchy
process (AHP). However, the specific quantitative identification of each category still
remains uncertain.
Principles of adaptive thermal comfort were mainly studied in free-running buildings
through field surveys [12-17]. A review of the previous studies reveals that there is little
research on the topic of adaptive thermal comfort in air-conditioned environments. For
example, de Dear [6] statistically analyzed discrepancies between the PMV and the
AMV in air-conditioned environments from the ASHRAE RP-884, a quality-controlled
global database. He concluded that ‘adaptation is at work in buildings with central
HVAC, but only at the biophysical (behavioral) level of clothing and air speed
adjustments’; ‘PMV appears to have been remarkably successful at predicting comfort
temperatures in the HVAC buildings of RP-884’s database’. In contrast, Humphrey [18]
analyzed the vote bias, PMV minus AMV, using the same database. He argued that the
possible origins of the bias may be caused by physical, psychological or physiological
factors. Humphreys argued that ‘PMV can be seriously misleading when used to predict
the mean comfort votes of groups of people in everyday conditions in buildings,
particularly in warm environments’. The research leaves open two questions: i) can the
PMV predict thermal comfort accurately in air-conditioned buildings and ii), if not,
what factors are involved and how do they impact on actual thermal sensation in
addition to the behavioral adaptation?
The occupant acceptable indoor temperature is considered as one of the design criteria
of an air-conditioning system, which is one of the key factors with impacts on the
operation of air-conditioning and therefore the energy consumption of buildings [19,
20]. Currently the international and national standard for design and operation
5
temperatures of an air-conditioning system is based on the PMV/PPD method [1-4].
The aim of this research is to observe and examine the discrepancies between the PMV
and AMV in an air-conditioned environment through a laboratory study, and identify
the factors contributing to such discrepancies, consequently provide optimal design
basis for the engineering solutions to a creation of thermal environment in hot-humid
region.
2. Research Methods
Quantifying the specific factors contributing to the vote bias between the PMV and
AMV poses considerable challenges because the factors such as physical environmental
parameters, occupant adaptive behavior and their previous thermal experience, and
occupant thermal comfort expectations are all variables in real buildings. However,
these challenges could be solved in a laboratory study by limiting variables and
focusing on one variable in each experimental case. The research methods applied in
this study include experimental measurement, a subject questionnaire survey and
statistical data analysis. Previous field studies in free-running buildings indicated that
occupants demonstrated a strong adaptability, particularly in the hot-humid tropics [6,
21-24]. We carried out laboratory experiments in Chongqing, the region with typical
hot and humid climatic characteristics in summer. The typical summer climate
condition in Chongqing is listed in Table 1 [25]. The average air temperature in summer
is 26.9℃ and the average relative humidity is 78%. The climate chamber can provide
the required indoor physical environmental parameters including air temperature,
relative humidity and air velocity constantly during the experiment. In order to identify
the contribution of the physiological and psychological categories, the behavior
adaptation was eliminated from the three adaptation categories. The ASHRAE seven-
scale thermal sensation surveys were conducted during the experiment period.
Statistical methods and Bland-Altman agreement assessment have been applied in data
analysis.
Table 1. Typical climate condition in the summer in Chongqing [25]
Month Air temperature (℃) Relative Humidity (%)
Monthly Mean Maximum Monthly Mean
June 25.2 34.9 81.2
July 28.0 36.6 77.1
August 27.6 37.7 75.7

6
2.1 Experiment
Four series of human exposure experiments in the climate chamber were carried out
during the summer in the period from 2008 to 2010. In each series, we have recruited
20 subjects from the region. Each series had a number of environmental conditions with
various settings. In total, 22 thermal conditions were created in the climate chamber for
the experiments, which are listed in Table 2. These conditions represent typical, real-
life, warm environments that people usually experience in this region.
Table 2. Experimental setting conditions and measured thermal environment
Experiment
Series No.
Setting
Conditions—ambient
temperature/relative
humidity/velocity
(℃/%/m·s-1)
Measured thermal environmental parameters b
Ambient
Temperature
(℃)
Velocity(m/s) Relative
Humidity (%)
Black-bulb
Temperature (℃)
1
26/70/0.0 a 25.9±0.2 0.04±0.01 71±2 25.9±0.2
27/70/0.05a 27.0±0.2 0.04±0.00 71±2 26.9±0.2
28/70/0.05a 28.0±0.1 0.04±0.01 70±2 27.8±0.1
29/70/0.05a 29.0±0.1 0.04±0.00 70±2 28.7±0.1
2
27/50/0.1a 26.9±0.2 0.11±0.02 54±4 26.6±0.1
29/50/0.1a 28.9±0.2 0.11±0.04 55±7 28.5±0.2
31/50/0.1a 31.0±0.2 0.14±0.04 51±7 30.4±0.1
33/50/0.1a 32.9±0.2 0.12±0.02 54±5 32.3±0.1
3
26/40/0.1a 25.6±0.1 0.08±0.05 41±1 25.6±0.1
26/60/0.1a 25.9±0.1 0.1±0.06 60±1 25.6±0.1
26/80/0.1a 26.0±0.1 0.06±0.05 80±1 25.6±0.1
28/40/0.1a 28.0±0.1 0.07±0.01 40±2 27.6±0.1
28/60/0.1a 27.9±0.1 0.09±0.03 60±1 27.6±0.2
28/80/0.1a 28±0.2 0.09±0.04 80±2 27.6±0.1
30/40/0.1a 29.8±0.1 0.1±0.02 42±2 29.4±0.2
30/60/0.1a 29.9±0.1 0.09±0.03 60±1 29.4±0.1
30/80/0.1a 29.9±0.1 0.09±0.05 81±1 29.4±0.1
4
28/90/0.1a 28.0±0.1 0.06±0.03 90±1 28.0±0.1
28/90/0.8a 28.1±0.2 0.79±0.04 90±1 28.0±0.2
30/80/0.6a 30.0±0.1 0.61±0.02 80±1 30.0±0.1
30/80/0.8a 30.0±0.2 0.81±0.04 80±1 29.8±0.2
32/90/0.8a 32.0±0.2 0.79±0.03 80±1 31.9±0.2
a Numbers of Samples in each dataset are n=20.
b Values are presented as mean value ± standard deviation.

7
2.2 Subject characteristics
The 20 subjects in each series are in an age range of 20 to 30 years old. They were
recruited randomly to participate in each experiment condition with the gender ratio of
1:1. In total 80 subjects were involved in the experiments and form 440 valuable
samples for analysis. All the students were healthy, i.e., not currently taking prescription
medication and having had no history of cardiovascular disease. Subjects were asked
to avoid caffeine, alcohol, and intense physical activity for at least 12 hours prior to
tests. They were briefed on the purpose of the tests, familiarized with experimental
procedures and trained to know the test procedure well. During the experiment period,
subjects were required to wear a uniform clothing made in the same style with same
color and materials in the most fitted size. This uniform clothing had an equivalent
insulation level of 0.26clo (1clo equal to 0.155m2·K/W) [1] including short-sleeve
shirts, shorts and lightweight shoes. All the subjects had been living in Chongqing for
over two years at least, thus it is supposed that they had the hot-humid climate thermal
experience and hence had generated habituation and/or acclimatization to the specific
climate characteristics.
2.3 Experimental procedure
The experiment in each setting condition lasted for 120 minutes. For the first 30 minutes,
subjects were asked to change into the uniform clothes and sit quietly in a rest room,
next to the climate chamber. This was kept at a temperature of 26℃ as a neutral
environment. After this period subjects were moved into the climate chamber for a 90
minutes exposure. During the first 30 minutes, the subjects were relaxed and got used
to the chamber environment. The actual measurement and questionnaire survey were
conducted in the next 60 minutes. During the experiment period the thermal sensation
questionnaire survey; skin temperature measurements with 13 locations of the body
including forehead, chest, back, upper arm (right and left), lower arm (right and left),
dorsal hand (right and left), calf (right and left), and thigh (right and left); and
environment measurements were performed simultaneously every 10 minutes. Subjects
were given sedentary office activities without any behavioral adaptive actions during
the exposure. The ASHRAE thermal sensation scale was used in the questionnaire for
quantifying occupant's thermal sensation. This is as follows: -3(Cold), -2(Cool), -
1(Slightly cool), 0(Neutral), +1(Slightly warm), +2(Warm), +3(Hot). Figure 1 shows
the experiment scene.

8
Figure 1. Climate chamber experiment scene
2.4 Measurements
For the calculation of PMV and standard effective temperature (SET*), the thermal
environmental parameters around the subjects were measured by a Thermal Comfort
Monitoring Station (LSI). The LSI was positioned at a height of 0.6m above the floor.
All sensor probes for measuring ambient temperature, black-bulb temperature, relative
humidity and air velocity were in conformity with the ISO 7726-2001 standard [26].
The specifications of the sensor probes employed in this study are shown in Table 3.
The copper-constantan thermocouples were attached to the different local skin positions
to measure the local skin temperatures. All the thermocouples were calibrated using a
standard mercury thermometer with a precision of 0.1℃. These were linked to a multi-
channel data collector which recorded the skin temperatures automatically.
Table 3. Ranges and precision of the LSI instrument
Environment
parameters Range Precision
Thermal
Comfort
Monitoring
Station
(LSI)
Air temperature -25 ~ 150℃ ± 0.1℃
Relative humidity 0- 100% RH
± 2% (15-40%) RH
± 1% (40-70%) RH
± 0.5% (70-98%) RH
Air velocity 0.01 ~ 20m/s
±0.05 m/s(0~0.5m/s)
±0.1 m/s(0.5~1.5m/s)
4%(>1.5 m/s)
Black-bulb temperature -10~100℃ ± 0.15℃

9
2.5 Calculation and statistical analysis
The PMV and the ASHRAE standard effective temperature (SET∗) were calculated by
the standard procedure provided by ISO 7730 [1] and Gagge’s study [27] respectively.
The average values of the measured thermal parameters in each experiment condition
were used as the inputs for the calculation of both PMV and SET* index. An 8-point
weighted method [28] was adopted to calculate the mean skin temperature (MST), as
represented by Equation 1.
MST=0.07Tforehead +0.175Tchest +0.175Tback +0.07Tupper arm+ 0.07Tlower arm+ 0.05Thand+ 0.19Tthigh+
0.20Tcalf (1)
To examine the statistical significance of the experimental data, the analysis of variance
(ANOVA) and T-test were conducted using SPSS 20.0 [29].
To investigate the subject’s mean responses in experiment conditions, Bin process [6]
was conducted by calculating the mean values of subjects’ thermal sensation vote and
skin temperature in each experiment condition bin (shown in Section 3.2 and 3.3).
The aim of this research, as stated, is to observe the discrepancy between the PMV and
AMV in a well-controlled environment and, if it exists, to identify the causation factors.
Therefore it is necessary to assess the agreement of the PMV calculated based on the
experimental physical parameters and the AMV based on the subjects’ simultaneous
thermal comfort votes. Bland and Altman proposed a method of assessing agreement
between two measurements methods in clinical research. They criticized the
commonly-used approaches including ‘Comparison of means’, ‘Correlation
coefficient’, and ‘Regression’ as inappropriate ways for assessing the agreement of two
different measures [30] and proposed a new approach which was named Bland-Altman
analysis [31, 32]. Bland-Altman analysis is based on graphical techniques and simple
calculations. Zaki [33] endorsed that in medical research the Bland-Altman method was
the most appropriate method for agreement assessment between two methods and over
85% of existing studies applied this method. In our study, in order to assess the
agreement between PMV and AMV methods, we introduce the Bland-Altman method
from medical research to thermal comfort research. The PMV and AMV can be
regarded as two methods of measurement of thermal comfort. To apply the Bland-
Altman method, we calculated the mean difference ( d ) of the level of thermal comfort

10
obtained by AMV and PMV methods and the standard deviation of the differences ( sd).
Consequently, the degree of agreement, or so called ‘limits of agreement’ ( 2 dd s ),
were obtained. The PMV and AMV can be interchangeable only if the provided
differences within this ‘limits of agreement’ are acceptable by professional knowledge.
The principles and details of the Bland-Altman analysis can be found in references [31]
and [32]. The analysis results are shown in Section 4.1.
3. Results and analysis
3.1 Thermal sensation and SET*
The ASHRAE standard effective temperature (SET∗) is defined as the equivalent
temperature of an isothermal environment at the relative humidity level of 50% RH in
which a subject, while wearing standardized clothing for the activity concerned,
would have the same heat stress (skin temperature) and thermoregulatory strain (skin
wettedness) as in the actual test environment [27, 34]. The SET* is a comfort index
that was developed based upon a two-node dynamic model of the human thermal
regulation mechanism.
In this study, the SET* and PMV for each experiment condition were calculated based
on the physical parameters recorded. The subjects’ actual mean thermal sensation
votes, referred to as the Actual Mean Vote (AMV), for each experiment condition
were recorded through the subject questionnaire survey during the experiment period.
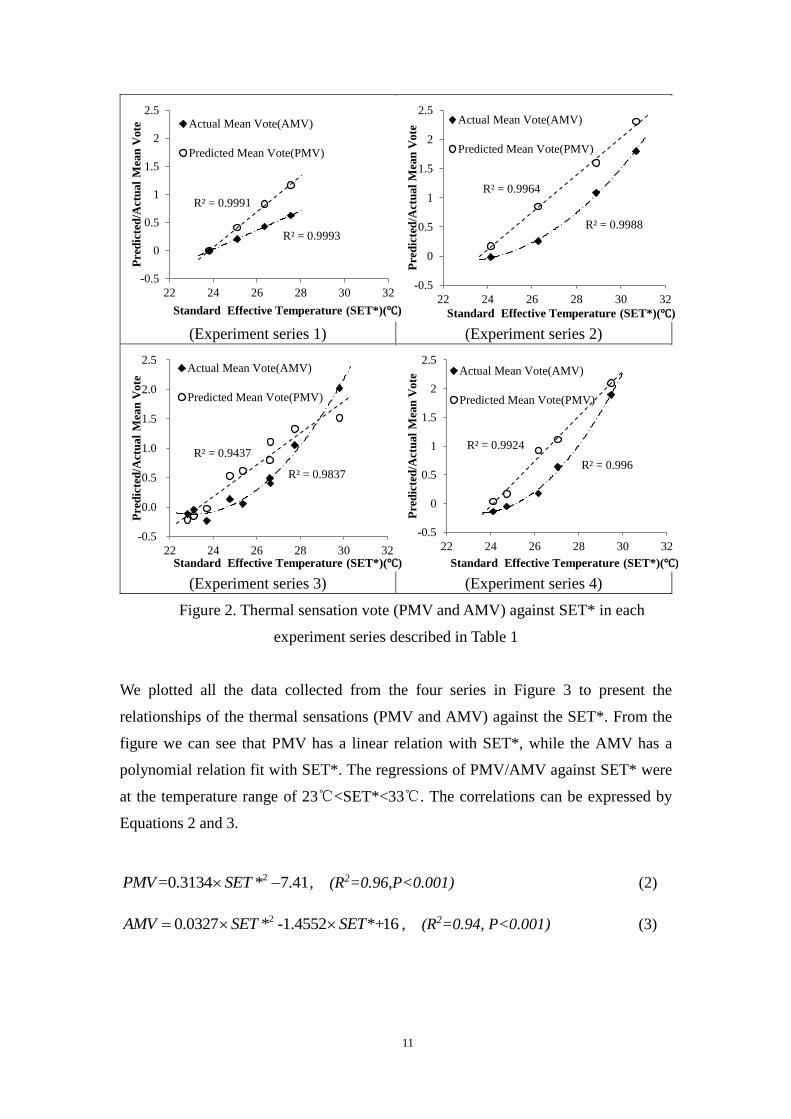
Figure 2 shows the relationship of AMV against SET* in four series of experiments
respectively in comparison with the PMV, and each dot in the figure represents the
mean value in a certain condition with 20 samples. This figure reveals that the mean
thermal sensation vote increases when the SET* increases. In addition, there are
discrepancies between PMV and AMV. PMV generally overestimates the subjects’
actual mean thermal sensation. Moreover, in most series, PMV has a high significant
linear relationship with SET*(P<0.001), but AMV tends to follow a non-linear
relation with SET*, especially in warmer conditions.
11
(Experiment series 1)
(Experiment series 2)
(Experiment series 3)
(Experiment series 4)
Figure 2. Thermal sensation vote (PMV and AMV) against SET* in each
experiment series described in Table 1
We plotted all the data collected from the four series in Figure 3 to present the
relationships of the thermal sensations (PMV and AMV) against the SET*. From the
figure we can see that PMV has a linear relation with SET*, while the AMV has a
polynomial relation fit with SET*. The regressions of PMV/AMV against SET* were
at the temperature range of 23℃<SET*<33℃. The correlations can be expressed by
Equations 2 and 3.
2=0.3134 * 7.41PMV SET , (R2=0.96,P<0.001) (2)
20.0327 * -1.4552 *+16AMV SET SET , (R2=0.94, P<0.001) (3)
R² = 0.9993
R² = 0.9991
-0.5
0
0.5
1
1.5
2
2.5
22 24 26 28 30 32
Pre
dic
ted
/Act
ual
Mea
n V
ote
Standard Effective Temperature (SET*)(℃)
Actual Mean Vote(AMV)
Predicted Mean Vote(PMV)
R² = 0.9988
R² = 0.9964
-0.5
0
0.5
1
1.5
2
2.5
22 24 26 28 30 32
Pre
dic
ted
/Act
ual
Mea
n V
ote
Standard Effective Temperature (SET*)(℃)
Actual Mean Vote(AMV)
Predicted Mean Vote(PMV)
R² = 0.9837
R² = 0.9437
-0.5
0.0
0.5
1.0
1.5
2.0
2.5
22 24 26 28 30 32
Pre
dic
ted
/Act
ual
Mea
n V
ote
Standard Effective Temperature (SET*)(℃)
Actual Mean Vote(AMV)
Predicted Mean Vote(PMV)
R² = 0.996
R² = 0.9924
-0.5
0
0.5
1
1.5
2
2.5
22 24 26 28 30 32
Pre
dic
ted
/Act
ual
Mea
n V
ote
Standard Effective Temperature (SET*)(℃)
Actual Mean Vote(AMV)
Predicted Mean Vote(PMV)

12
Figure 3. Thermal sensation votes (PMV and AMV) against ASHRAE Standard
Effective Temperature (SET*) for all measured data.
From Figure 3 we can see that, at the thermal comfort upper limit point PMV/AMV=0.5,
the related SET* temperatures are 25.24℃and 26.84℃ respectively to the PMV and
AMV estimations. Apparently, the PMV overestimates thermal sensation and leads to
a lower SET* upper limit. The adverse effects will cause an overuse of energy for
cooling in air-conditioning.
3.2 PMV and AMV
PMV predicts the actual thermal sensation well around the neutral thermal sensation
point (when PMV=0) (see Figures 2, and 3). This finding endorses de Dear’s claim
that ‘PMV appears to have been remarkably successful at predicting comfort
temperatures in the HVAC buildings’. However, from the figures, we can see that in the
warm conditions (when 0PMV ), PMV overestimates actual thermal sensations. In
order to rigorously investigate the agreement of the two indices (AMV and PMV), the
Bland-Altman [31, 32] analysis method was applied. The values of the AMV and the
PMV in each condition (marked as AMVi and PMVi) were regarded as a pair. The
average value of each paired sample (AVi), the value of the difference of each paired
sample (AMV-PMV), the mean difference ( d ) and the standard deviation of the
-1.5
-1.0
-0.5
0.0
0.5
1.0
1.5
2.0
2.5
22.0 24.0 26.0 28.0 30.0 32.0
Pre
dic
ted
/Act
ua
l M
ean
Vo
te
ASHRAE's Standard Effective Temperature (SET*)(℃)
Actual Mean Vote(AMV)
Predicted Mean Vote(PMV)
The predicted upper limit
comfort temperature by
PMV (25.24℃)
The actual upper limit
comfort temperature
(26.84℃)

13
differences (ds ) were calculated by Equations 4, 5, 6, 7; as demonstrated in Figure 4.
/ 2i i iAV PMV AMV (4)
i i id AMV PMV (5)
1
1=0.296
n
i
d dn
(6)
2
1
/ 1 =0.296n
d
i
s d d n
(7)
Figure 4. Differences of PMV and AMV against mean for AMV/PMV data
From Figure 4 we can see that the differences of the AMM and PMV are uniformly
distributed around the mean difference ( d ) and lie within the range 2 dd s to 2 dd s .
According to the Bland-Altman method, the ‘limits of agreement’ estimated by the
values of 2 dd s provides an interval within which 95% of the differences between
AMV and PMV are expected to lie, this interval is defined using the Equations 8 and 9:
2 dd s =-0.296-2×(-0.296)=0.296 (8)
2 dd s =-0.296+2×(-0.296)=-0.889 (9)
The value of the ‘limits of agreement’ indicates that the AMV is about 0.296 above the
-2
-1.5
-1
-0.5
0
0.5
1
-0.5 0 0.5 1 1.5 2 2.5
Dif
fere
nce
s in
mea
n t
her
ma
l
sen
sati
on
(A
MV
-PM
V)
Average mean thermal sensation ((PMV+AMV)/2)
𝑑+2Sd
𝑑-2Sd
𝑑
0.296
-0.889

14
PMV or 0.889 below the according to the ASHRAE thermal sensation scale. As
described in Section 2.5, the PMV and AMV can be interchangeable only if the
provided differences within the ‘limits of agreement’ are acceptable to professional
knowledge. In the assessment of PMV performance, Humphreys et al. [18] argued that
it would be necessary for the prediction to be within ±0.1 scale unit. Considering that
the prediction-bias of the group comfort votes were usually greater than this figure, he
suggested that the PMV would need to correspond closely to the actual mean vote of
the occupants at least within ±0.25 scale unit, otherwise the bias of PMV was
unacceptable. The ‘limits of agreement’ obtained by the Bland-Altman method cannot
meet the lowest criteria suggested by Humphreys. Therefore, we can regard the AMV
and PMV in this study as lacking in agreement and that there is a remarkable bias of
PMV when applied in the well-controlled environment in the hot-humid region.
3.3 Skin Temperature
For each experiment condition bin, we calculated the mean value and standard deviation
of subjects’ mean skin temperature (MST). Figure 5 illustrates the relationship between
MST and SET*. In the figure, the predicted values of mean skin temperature were
obtained using the two-node model proposed by Gagge [34]; and the measured mean
skin temperatures were obtained from our experiment measurements. The results show
that when SET* is above 25℃, the differences between the measured and predicted
values are statistically insignificant (P>0.05, one sample T-test), which means the
measured value of the mean skin temperature matches well with the predicted value.
However, for the experiment conditions where SET* lies between 23-25℃ (marked
within the rectangle with dashed lines), the measured values are nearly all significantly
lower than the prediction (P<0.05, one sample T-test), the biggest value of difference is
about 0.5℃.

15
Figure 5. Measured and predicted mean skin temperature related with SET*.
The Boltzmann fit was used for regression analysis to work out the relation between
the AMV and the MST as demonstrated in Figure 6 where each black square represents
the average value of 20 observations in a bin. The fitted curve (the dash line) could be
referred as the ‘thermal sensibility curve for skin’ in the hot-humid region. Equation 10
is the regression equation used.
3.6 3.72 / 1 exp 34.8 / 0.3AMV MST (R2=0.87, P<0.001) (10)
32.5
33
33.5
34
34.5
35
35.5
22 23 24 25 26 27 28 29 30 31 32
Mea
sure
d/P
red
icte
d
Mea
n S
kin
Tem
per
atu
re(℃
)
ASHRAE's Standard Effective Temperature (SET*) (℃)
Measured Mean Skin Temperature
Predicted Mean Skin Temperature

16
Figure 6. Subjects’ thermal sensibility curves to skin temperature
In order to identify the thermal sensibility to skin temperature of subjects from different
regions, the curve in our study was compared with the existing research outcome from
Gagge et al. conducted in the U.S [35]. Gagge’s thermal sensibility curve is presented
in a solid line in Figure 6. From this figure we can see a significant discrepancy between
the results of these two studies. There is no strong relation between actual mean vote
and mean skin temperatures when MST is lower than 34℃ as shown in our study
(actual mean vote is less than 0.15 scale unit). In contrast, Gagge’s results demonstrate
a marked sensations of warmth appearing at the point where MST is lower than 34℃
(actual mean vote is greater than 1 scale unit).
4. Discussion
The open literatures provide overwhelming evidence supporting the identification of
human thermal adaptation from field studies rather than from climate chamber
laboratory experiments [6]. To study the human adaptation in central controlled HVAC
environments, de Dear and Brager [6] and Humphreys and Nicol [18] analyzed data
from the HVAC building field study from the RP-884 database. Although field studies
are best for assessing the potential impact of behavioral and psychological adaptations

17
as they occur in the real environment, it is hard to identify the significance of the
contribution from each adaptation category. Only the joint effect can be assumed in the
field studies. On the contrary, the climate chamber study provides the opportunity to
rule out some variables regarded as the causation of the PMV-bias in real centralized
HVAC buildings. We specifically focused on key variables by fixing the others and
identifying the mechanism of adaptation.
4.1 Experiment conditions
The experiment conditions in our study are almost the same as those used by Fanger in
the 1970s except for two aspects: i) the subject exposure time and ii) regional climatic
experience of the subjects in the experiments.
Subject exposure time
The exposure time in Fanger’s experiments was 3 hours in order to obtain a steady state
for the human body; whilst the exposure time in the our study is 1.5 hours. In our
experiments, the mean skin temperature achieved steady-state when the exposure time
is 30 minutes. Therefore, the 1.5 hour exposure time is adequate for the human body to
achieve a physiological steady state. It is thus reasonable to assume no essential
difference between the two experiments in terms of the exposure time.
Subject climatic experience
Fanger’s PMV model is based on the experiments involving subjects from America and
Europe [5]. The targeted subject groups were not from a single, specific, climate region.
In our case, all the subjects had a long-term acclimatised thermal history of hot-humid
experience before they participated in the experiment.
To summarise, the difference between our experiments and Fanger’s is that our targeted
group of subjects are a unique group in which all subjects have a long-term acclimatised
thermal history of hot-humid experience.
4.2 Identification of the causes of the bias of PMV
In our climate chamber experiments, both physical environments and human activity
were strictly controlled, and each subject was clothed uniformly. There were no
behavioural adaptation opportunities for subjects in the experiment. As the behavioural

18
adaptation factor has been ruled out, we will next analyse another two categories of
adaptation: physiological and psychological.
4.3 Physiological adaptation
By definition, physiological adaptation includes changes in the physiological responses
that result from exposure to thermal environmental factors and which lead to a gradual
diminution of the strain induced by such exposure [36]. Acclimatisation is a
subcategory of physiological adaptation which is closely related to the occupant’s
thermal living environment and thermal experience history [6].
According to the knowledge of thermogulation theory and heat transfer theory, any
thermal physiological response will result in the change of temperature of human body.
By analysing the research in the thermogulation model of human body [34, 37], we
found the skin temperature was the most sensitive indicator to the physiological
response. Taking the simplified model of Gagge as an example [34], showing in the
Equation 11 and 12, the physiological responses of sweating, vasoconstriction,
vasodilation, metabolic rate and shivering will directly or indirectly affect the value of
skin temperature. Moreover, the skin temperature was often used to represent the results
of the physiological responses in the thermogulation model studies [38-40]. Therefore,
the skin temperature is chose as an indicator for the study of physiological adaptation
in this paper. If there’s any physiological adaptation that lead to any changes in the
physiological responses, then the skin temperature should be changed as well.
/ +ss s b b c s dif rsw
Tm c A K c V T T C R E E
dt (11)
/ +cc c shi res b b c s
Tm c A M M E w K c V T T
dt (12)
From Figure 5, we can see that when SET* is between 23 and 25℃ and MST lies in
the range of 33-34℃ the measured mean skin temperature was significantly lower than
the predicted value by almost 0.5℃ using Gagge’s prediction model which was
based on the group of people who are not from this region. The changes in skin
temperature caused by physiological response decrease the stimulus of the thermal
environment to the human body, and consequently lead to thermal sensation reports
becoming more towards neutral. The phenomenon has been regarded as a physiological

19
adaptation of the human body. As illustrated in Section 3.2 and shown in Figure 6, the
variation of mean skin temperature contributes a small (0.15) scale unit to the actual
thermal sensation vote within the MST range of 33-34℃ (around neutral point). This
implies that the significant physiological adaptation does exist but only over a small
range of indoor temperature which could lower the skin temperature, but the
contribution to the thermal comfort vote is not significant.
4.4 Psychological adaptation
The effect of physiological factors on the PMV has been regarded as insignificant based
on the actual thermal sensation, thus psychological adaptation turns into the most
significant explanation. The psychological dimension of thermal adaptation is defined
as “an altered perception of, and reaction to, sensory information due to past experience
and expectations” [6]. The skin temperature can typically represent the major
information of such thermal sensory system this is because plenty of the
thermoreceptors of human body are distributed in the skin [41]. Thus subjects’ thermal
sensibility to skin temperature reasonably reveals this “perception of, and reaction to,
sensory information”. According to the results in Figure 6, the thermal sensibility curve
to the skin of the subjects in the hot-humid region significantly differs from the curve
of Gagge’s data. In principle, when subjects have the same MST, they should have the
same sensory information. However, the intensity of warm sensations of subjects with
a hot-humid climate background in our study is weaker than that of the subjects from
Gagge’s study (as the arrow shown in Figure 6). This moderated thermal sensibility to
skin temperature indicates that subjects’ thermal perception has been altered, i.e.
psychological adaptations have been generated. The differences between the values of
the two sensibility curves generated from two different groups of subjects from different
climates indicate a quantitative value for the magnitude of psychological adaptation. It
is therefore revealed that psychological adaptation creates a drop in the thermal
sensation vote around the boundary of the comfort zone, which effectively accounts for
the overestimation of PMV in a warm environment. It can be concluded that
psychological adaptation does exist in the well-controlled environment and that it is the
primary factor that makes the thermal sensation neutralised and the comfort zone wider.
Psychological adaptation is usually recognized to play a role in terms of habituation
and expectation. Previous studies in psychological adaptation focusing on the role of

20
personal control indicated that psychological adaptation is a key factor influencing
occupant expectations [42] and that it has important implications in naturally-ventilated
vs. centrally-air-conditioned buildings [36]. Such expectations were usually embodied
in the change of preferred temperature in the naturally ventilated buildings [37].
However, in our climate chamber study, personal control was restricted and the
expectation effect was limited. Therefore, the psychological adaptation shown in the
well-controlled environment is distinguished from that in a naturally-ventilated
environment and should result from the effect of habituation, which is quite related to
people’s thermal experience history. It is inferred that the subjects with a thermal
experience history of a hot-humid climate have generated a certain kind of habituation
due to the long time spent living in such a region. Such habituation alters the subjects’
thermal sensibility to skin temperature and results in the neutralization of the intensity
of thermal sensation.
4.5 Application of adaptive principle in thermal engineering
The discussion above demonstrates the disagreement between the PMV and the AMV
in a well-controlled environment in the hot-humid climate region. This indicates the
discrepancies between the PMV and AMV in a well-controlled environment in the hot-
humid region. As illustrated in Section 3.1, the PMV overestimates the actual thermal
sensation thus leading to an unnecessarily lower temperature setting in an air-
conditioned building with a consequent wastage of energy for cooling. Therefore, the
PMV index needs to be adjusted when it is applied for thermal comfort assessment in
the hot-humid region. A polynomial regression of the PMV and AMV has been
produced based on the experimental data collected in this study. The adaptive thermal
sensation vote PMVa is proposed as Equation 13:
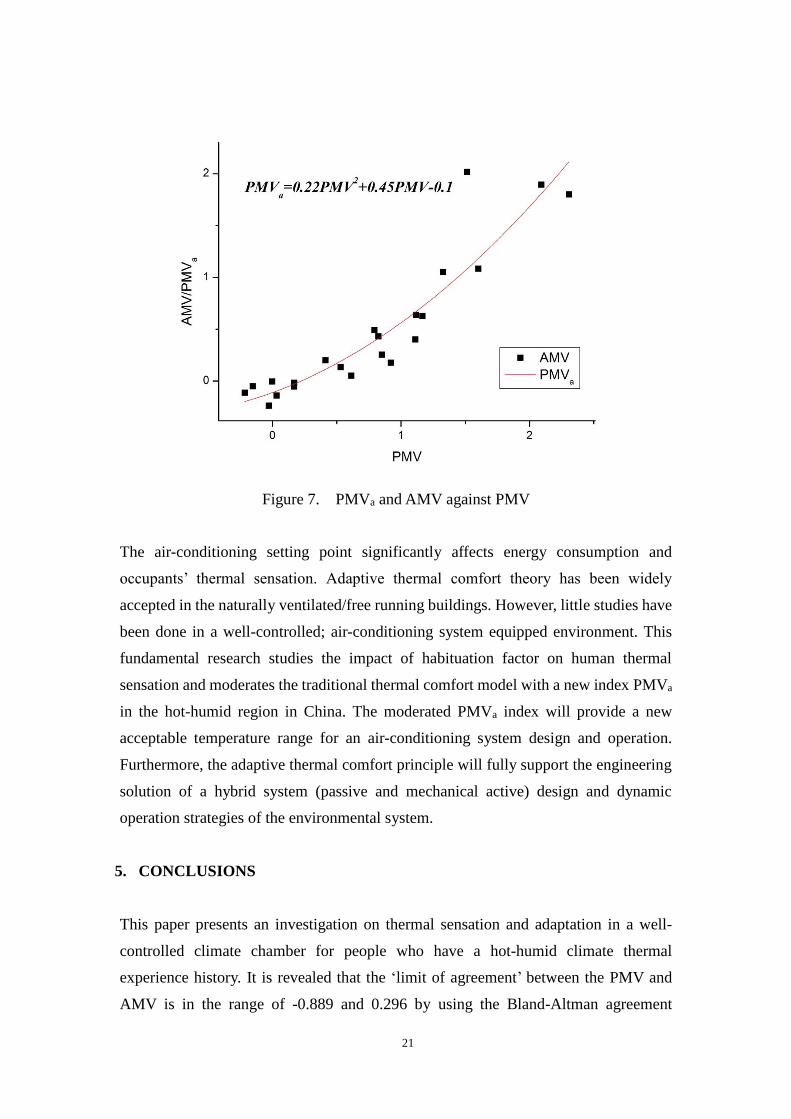
20.22 0.45 0.1aPMV PMV PMV (13)
The correlation is significant (R2=0.85, P<0.001). Figure 7 shows the polynomial
regression of the PMV and PMVa. .
21
Figure 7. PMVa and AMV against PMV
The air-conditioning setting point significantly affects energy consumption and
occupants’ thermal sensation. Adaptive thermal comfort theory has been widely
accepted in the naturally ventilated/free running buildings. However, little studies have
been done in a well-controlled; air-conditioning system equipped environment. This
fundamental research studies the impact of habituation factor on human thermal
sensation and moderates the traditional thermal comfort model with a new index PMVa
in the hot-humid region in China. The moderated PMVa index will provide a new
acceptable temperature range for an air-conditioning system design and operation.
Furthermore, the adaptive thermal comfort principle will fully support the engineering
solution of a hybrid system (passive and mechanical active) design and dynamic
operation strategies of the environmental system.
5. CONCLUSIONS
This paper presents an investigation on thermal sensation and adaptation in a well-
controlled climate chamber for people who have a hot-humid climate thermal
experience history. It is revealed that the ‘limit of agreement’ between the PMV and
AMV is in the range of -0.889 and 0.296 by using the Bland-Altman agreement
22
assessment method. The result indicates that the PMV and AMV are lacking in
agreement; therefore in principle, the PMV could be amended in its application in air-
conditioned environments in this region. The PMV predicts neutral comfort
temperature well (when PMV=0), however, it overestimates thermal sensation in a
well-controlled environment in the warm condition (when 0PMV ).
The bias of the PMV from the AMV can be regarded as the thermal adaptation
generated by the past thermal experience of a long time spent living in a specific region.
This thermal adaptation can be regarded as a joint effect of the non-significant factor of
acclimatisation due to the physiological response and the significant habituation due to
psychological adaptation. However, the psychological adaptation contributes the most
to the thermal sensation vote. The psychological adaptation neutralizes people’s
thermal sensation by means of reducing the thermal sensibility of the skin. The
contribution of habituation to the actual thermal sensation of two groups of people from
different regions can be quantified by calculating the differences between the thermal
sensibility curves to the skin temperature.
A revised PMV index, named as PMVa, has been derived as an empirical equation:
20.22 0.45 0.1aPMV PMV PMV
which is suitable for application in an air-conditioned building in the hot-humid region
in China. Therefore, the ASHRAE Standard thermal comfort temperature SET* upper
limit could be adjusted by a 1.6℃ increase from 25.24℃ to 26.84℃. This adjustment
will be instructive to the creation of indoor thermal environment and significantly
contribute to energy efficiency in buildings.
ACKNOWLEDGEMENT
The authors would like to thank the Major State Basic Research Development Program
of China (Program 973) (Project No. 2012CB720100); the National Natural Science
Foundation of China (Project No. 50838009); the 111 Project (No. B13041) for the
financial support for the research. Yu Yang would like to thank the China Scholarship
Council for the sponsorship for a one-year academic visiting study at the University of
Reading during 2013-2014.
23
REFERENCE
[1] ISO-7730, Ergonomics of the thermal environment, in: Analytical determination and interpretation of thermal comfort using calculation of the PMV and PPD indices and local thermal comfort criteria, International Organization for Standardization, 2005. [2] ASHRAE-55, Thermal environmental conditions for human occupancy, American Society of Heating, Refrigerating and Air-conditioning Engineers, 2004. [3] EN-15251, Thermal Environment, Lighting and Acoustics, AFNOR, Paris, France, in: Indoor environmental input parameters for design and assessment of energy performance of buildings addressing indoor air quality, thermal environment, lighting and acoustics, CEN Standard, 2007. [4] GB/T-50785, Evaluation standard for indoor thermal environment in civil buildings, MOHURD of PRC, 2012. [5] P.O. Fanger, Thermal comfort. Analysis and applications in environmental engineering, Danish Technical Press, Copenhagen, 1970. [6] R.J. de Dear, G.S. Brager, Developing an adaptive model of thermal comfort and preference, ASHRAE Transactions, 104 (1998) 145-167. [7] M. Humphreys, Field studies of thermal comfort compared and applied, Journal of Institution of Heating and Ventilation Engineer 44 (1975) 5-27. [8] M. Humphreys, Outdoor temperatures and comfort indoors, Batiment International, Building Research and Practice, 6 (1978) 92-92. [9] A. Auliciems, Towards a psycho-physiological model of thermal perception, International Journal of Biometeorology, 25 (1981) 109-122. [10] M. Schweiker, S. Brasche, W. Bischof, M. Hawighorst, K. Voss, A. Wagner, Development and validation of a methodology to challenge the adaptive comfort model, Building and Environment, 49 (2012) 336-347. [11] J. Liu, R. Yao, R. McCloy, A method to weight three categories of adaptive thermal comfort, Energy and Buildings, 47 (2012) 312-320. [12] B. Li, M. Tan, H. Liu, X. Ma, W. Zhang, Occupant’s perception and preference of thermal environment in free-running buildings in China, Indoor and Built Environment, 19 (2010) 405-412. [13] R. Yao, J. Liu, B. Li, Occupants’ adaptive responses and perception of thermal environment in naturally conditioned university classrooms, Applied Energy, 87 (2010) 1015-1022. [14] F. Nicol, M. Humphreys, Adaptive thermal comfort and sustainable thermal standards for buildings, Energy and Buildings, 34 (2002) 563-572. [15] F. Nicol, Adaptive thermal comfort standards in the hot–humid tropics, Energy and Buildings, 36 (2004) 628-637. [16] F. Nicol, M. Humphreys, Derivation of the adaptive equations for thermal comfort in free-running buildings in European standard EN15251, Building and Environment, 45 (2010) 11-17. [17] R. Yao, B. Li, J. Liu, A theoretical adaptive model of thermal comfort–Adaptive Predicted Mean Vote (aPMV), Building and Environment, 44 (2009) 2089-2096. [18] M. Humphreys, J.F. Nicol, The validity of ISO-PMV for predicting comfort votes in every-day thermal environments, Energy and Buildings, 34 (2002) 667-684. [19] B. Givoni, Comfort, climate analysis and building design guidelines, Energy and Buildings, 18 (1992) 11-23. [20] M.J. Holmes, J.N. Hacker, Climate change, thermal comfort and energy: Meeting the design challenges of the 21st century, Energy and Buildings, 39 (2007) 802-814. [21] F. Nicol, An analysis of some observations of thermal comfort in Roorkee, India and Baghdad, Iraq, Annals of Human Biology, 1 (1974) 411-426. [22] M. Sharma, S. Ali, Tropical summer index—a study of thermal comfort of Indian subjects, Building and Environment, 21 (1986) 11-24. [23] A. Taki, M. Ealiwa, A. Howarth, M. Seden, Assessing thermal comfort in Ghadames, Libya: Application of the adaptive model, Building Services Engineering Research and Technology, 20 (1999) 205-210.

24
[24] J.F. Nicol, I.A. Raja, A. Allaudin, G.N. Jamy, Climatic variations in comfortable temperatures: the Pakistan projects, Energy and Buildings, 30 (1999) 261-279. [25] Meteorological dataset for indoor thermal environment analysis in China, in: D.o.B.S.i.T.U. Meteorological information center of China (ed.), China building industry press, Beijing, 2005. [26] ISO-7726, Ergonomics of the thermal environment. Instruments for measuring physical quantities in, International Organization for Standardization, 2001. [27] A.P. Gagge, A. Fobelets, L. Berglund, A standard predictive index of human response to the thermal environment, ASHRAE Trans.;(United States), 92 (1986). [28] A.P. Gagge, Y. Nishi, Heat exchange between human skin surface and thermal environment, Comprehensive Physiology, (1977). [29] IBM, SPSS statistics 20, Rel. 20.0.0, Chicago: SPSS Inc., 2012. [30] D.G. Altman, J.M. Bland, Measurement in medicine: the analysis of method comparison studies, Statistician, 32 (1983) 307-317. [31] J.M. Bland, D.G. Altman, Statistical methods for assessing agreement between two methods of clinical measurement, The lancet, 327 (1986) 307-310. [32] J.M. Bland, D.G. Altman, Measuring agreement in method comparison studies, Statistical methods in medical research, 8 (1999) 135-160. [33] R. Zaki, A. Bulgiba, R. Ismail, N.A. Ismail, Statistical methods used to test for agreement of medical instruments measuring continuous variables in method comparison studies: a systematic review, PloS one, 7 (2012) e37908. [34] A.P. Gagge, S. J.A.J., N. Y., An effective temperature scale based on a single model of human physiological temperature response, ASHRAE Transactions, 77 (1971) 247-262. [35] A.P. Gagge, J. Stolwijk, J. Hardy, Comfort and thermal sensations and associated physiological responses at various ambient temperatures, Environmental research, 1 (1967) 1-20. [36] G.S. Brager, R.J. de Dear, Thermal adaptation in the built environment: a literature review, Energy and Buildings, 27 (1998) 83-96. [37] J. Stolwijk, A mathematical model of physiological temperature regulation in man, NASA-Langley, CR-1855 (1971) 1-72. [38] A. Munir, S. Takada, T. Matsushita, Re-evaluation of Stolwijk's 25-node human thermal model under thermal-transient conditions: Prediction of skin temperature in low-activity conditions, Building and Environment, 44 (2009) 1777-1787. [39] A. Zolfaghari, M. Maerefat, A new simplified thermoregulatory bioheat model for evaluating thermal response of the human body to transient environments, Building and Environment, 45 (2010) 2068-2076. [40] L. Yi, L. Fengzhi, L. Yingxi, L. Zhongxuan, An integrated model for simulating interactive thermal processes in human–clothing system, Journal of Thermal Biology, 29 (2004) 567-575. [41] E.A. Arens, H. Zhang, The skin's role in human thermoregulation and comfort, Center for the Built Environment, Thermal and Moisture Transport in Fibrous Materials, eds N. Pan and P. Gibson, Woodhead Publishing Ltd, (2006) 560-620. [42] M. Paciuk, The role of personal control of the environment in thermal comfort and satisfaction at the workplace, Environmental Design Research Association, 21 (1989) 303-311.