a study of exercise, eating habits and obesity rates … · a study of exercise, eating habits and...
TRANSCRIPT

A Study of Exercise, Eating Habits and Obesity Rates Among Upstate New Yorkers
Based on a survey byZogby International
John Zogby, President and CEOJohn Bruce, Vice President and Systems AdministratorRebecca Wittman, Vice President and Managing Editor
September 2004
Analysis by Excellus BlueCross BlueShield
Mary Paris, Director of Health Policy and Health Services Research
Excellus BlueCross BlueShield is a nonprofit independent licensee of the BlueCross BlueShield Association
SUMMARYThis report summarizes a survey of 2,006 adults across Upstate New York. Believed to be the largestregional study of its kind to date, it reveals significant opportunities for health improvement in theareas of physical activity, diet and weight management. While survey methodology in general may besomewhat less reliable than direct physiologic measurement or monitoring, this information isnonetheless valuable in providing information and insight concerning how Upstate New Yorkers viewtheir own behaviors. The survey questions were compiled from several national sources to maximizevalidity and reliability, as well as to allow some comparisons with the recommendations of leading federal health agencies in the Healthy People 2010 initiative. Key findings are summarized below.
Overweight/Obesity� More than 36 percent of Upstate New York adults surveyed reported weight and height values
placing them in the “overweight” category, according to national health guidelines. Another 20 percent were classified as “obese.”
Physical Activity� Approximately one in five Upstate New York residents had not engaged in any physical activity
during the month prior to the survey.
� 44.5 percent met the federal Healthy People 2010 objective for moderate exercise (exercising moderately for 30 or more minutes per day at least five days per week). Moderate activity is defined as exercise that causes a small increase in breathing or heart rate.
� Nearly 30 percent met the Healthy People 2010 objective for vigorous exercise. This objective is participating in exercise that causes large increases in breathing or heart rate for 20 or more minutes at least three days a week.
� A majority – 56.6 percent – reported that they are physically active and have been so for more than six months. Within the Stages of Change model of behavior, this is viewed as “maintenance stage” – an optimal stage of behavior that is well established over time.

I. Significance . . . . . . . . . . . . . . . . . . . . . . . . . . . . . . . . . . . . . . . . . . . . . . . . . . . . . . . . . . . . . . 3
II. Summary of Methods . . . . . . . . . . . . . . . . . . . . . . . . . . . . . . . . . . . . . . . . . . . . . . . . . . . . . .3
III. Results . . . . . . . . . . . . . . . . . . . . . . . . . . . . . . . . . . . . . . . . . . . . . . . . . . . . . . . . . . . . . . . . . 5
IV. Appendix I (Questionnaire) . . . . . . . . . . . . . . . . . . . . . . . . . . . . . . . . . . . . . . . . . . . . . . . . 19
V. Appendix II (Sources and Notes) . . . . . . . . . . . . . . . . . . . . . . . . . . . . . . . . . . . . . . . . . . . . 20
Tables
Table 1. Questionnaire Definitions and CDC Recommendations:Physical Activity and Diet . . . . . . . . . . . . . . . . . . . . . . . . . . . . . . . . . . . . . . . . . . . . . . 4
Table 2. Stages of Change Model Overview . . . . . . . . . . . . . . . . . . . . . . . . . . . . . . . . . . . . . . 5
Table 3. Sample Characteristics by Age Group and Gender . . . . . . . . . . . . . . . . . . . . . . . . . . 5
Table 4. Percentage of Upstate New Yorkers Engaging in Leisure Time Activity . . . . . . . . . 6
Table 5. Days Per Week: Moderate Activity . . . . . . . . . . . . . . . . . . . . . . . . . . . . . . . . . . . . . . . 7
Table 6. Percentage Meeting Healthy People 2010 Moderate Activity Goal . . . . . . . . . . . . . 8
Table 7. Percentage Meeting Healthy People 2010 Moderate Activity Goal by Region . . . . 9
Table 8. Percentage of Upstate New Yorkers Engaging in Vigorous Activity . . . . . . . . . . . 10
Table 9. Percentage of Upstate New Yorkers Engaging in Vigorous Activity by Region . . 11
Table 10. Percentage Meeting Healthy People 2010 Vigorous Activity Goal . . . . . . . . . . . 12
Table 11. Percentage Meeting Healthy People 2010 Vigorous Activity Goal by Region . . 13
Table 12. Physical Activity: Stage of Change . . . . . . . . . . . . . . . . . . . . . . . . . . . . . . . . . . . . . 14
Table 13. Healthy Diet: Stage of Change . . . . . . . . . . . . . . . . . . . . . . . . . . . . . . . . . . . . . . . . 15
Table 14. Dietary Fat: Stage of Change . . . . . . . . . . . . . . . . . . . . . . . . . . . . . . . . . . . . . . . . . 16
Table 15. Produce Intake: Stage of Change . . . . . . . . . . . . . . . . . . . . . . . . . . . . . . . . . . . . . . 17
Figure 1: Overweight and obesity by Gender, Region and Age . . . . . . . . . . . . . . . . . . . . . 18
Table of contents
2
� Slightly more than 25 percent indicated high potential for improving their physical activity level along the behavioral stage continuum by reporting that they are either physically active “once in a while, but not regularly” (“preparation stage”) or are currently physically active but have only begun doing so within the last six months (“action stage”).
Dietary Patterns� A similar majority – 56.2 percent – reported that they have been eating a healthy diet for more
than six months. The survey defined a healthy diet as one that is low in fat, low to moderate in salt, contains whole grains and five or more servings of fruits and vegetables per day.
� There is potential to move Upstate New Yorkers to this “maintenance stage” of healthy eating. Close to 36 percent indicated that they are thinking about starting a healthy diet, have begun to eat a healthy diet sometimes but not regularly, or have started to eat a healthy diet regularly,but just within the past six months.

I. SignificanceDespite increased awareness of physical activity and healthy dietary guidelines across the United States, significant health improvement objectives have not been achieved. In Upstate New York, the prevalence ofadult obesity climbed from 19 percent in 1997 to 23 percent in 2002. Excess weight can lead to high bloodpressure, diabetes, heart disease and other illnesses. As of 2002, more than seven percent of Upstate adultsreported having been diagnosed with diabetes, up from 4.3 percent in 1997.
The rise in obesity rates and related increase in diabetes prevalence – both linked to physical inactivity andpoor dietary patterns – represent serious threats to the health of Upstate New Yorkers, including our futuregenerations of adults. The human and economic costs are substantial: diminished quality-of-life, rising insurance costs that in turn jeopardize access to care, and decreased workplace productivity that threatenbusinesses and their employees. Assessing the health behaviors among Upstate residents is a crucial first stepin the development of effective, appropriately targeted interventions.
II. Summary of MethodsExcellus BlueCross BlueShield commissioned Zogby International to conduct a random telephone survey, using listed numbers, of Upstate New York1 residents of 39 counties to obtain a baseline assessment of physical activity and dietary habits. Zogby International is an independent, non-partisan and internationallyrecognized public research and polling organization.2
All calls were made from Zogby International headquarters in Utica, N.Y., from Monday, July 26, to Friday, July 30, 2004. The margin of error is +/- 5.0 percentage points for each region. Margins of error are higherwithin subgroups.
The five regions covered by the survey are delineated by Upstate New York counties as follows:
Buffalo Central New York Rochester Utica/Rome/North Southern Tier region: region: region: Country region: region:
Allegany Cayuga Livingston Clinton BroomeCattaraugus Cortland Monroe Delaware ChemungChautauqua Jefferson Ontario Essex ChenangoErie Lewis Seneca Franklin SchuylerGenesee Onondaga Wayne Fulton SteubenNiagara Oswego Yates Hamilton TiogaOrleans St. Lawrence HerkimerWyoming Tompkins Madison
MontgomeryOneidaOtsego
3

The survey questions (Appendix 1) were compiled from several national sources to assure validity and reliability (Appendix 2), as well as to allow some comparisons with the recommendations of leading federalhealth agencies as part of the Healthy People 2010 initiative.3 The series of questions on physical activity anddiet allowed respondents to assess their levels of leisure time, moderate and vigorous activity and produceintake compared to recommended levels (Table 1).
Table 1. Questionnaire Definitions and CDC Recommendations: PhysicalActivity and Diet
In addition to these measures, the questionnaire included a more in-depth assessment of these behaviorsbased on the Transtheoretical Model of Behavior Change (Stages of Change). Developed by James Prochaskaand Carlo Diclemente in 1982, this model conceptualizes behavior change as a fluid process across a series of stages rather than a discrete event (Table 2). It has been adapted and applied to many health behaviorsincluding smoking, diet, alcohol and substance abuse and eating disorders. The model’s theoretical underpinning - supported by scientific evidence - is that it is critical to identify an individual’s stage in order to design and target appropriate and effective interventions.
4

Table 2. Stages of Change Model Overview4
III. ResultsA total of 2,006 interviews were completed (Buffalo: 402, Central New York: 401, Rochester: 401,Southern Tier: 401, and Utica: 401). Sample characteristics by age and region are shown in Table 3.
Table 3. Sample Characteristics by Age Group and Gender*
5

1. Leisure time physical activity
Seventy-seven percent of Upstate New Yorkers reported leisure time physical activity within the past month,close to the Heatlhy People 2010 objective of 80 percent (Table 4). Even though reported activity is near thegoal, the fact remains that about one in five reported no physical activity in the past month. These results varied slightly by region with the highest activity level in Rochester. Variations by gender were not significant.As would be expected, leisure time physical activity diminishes substantially in the 65 and older age group.
Table 4. Percentage of Upstate New York adults engaging in leisure timephysical activity during the past month
2. Moderate activity
Ninety-four percent of Upstate New Yorkers reported engaging in some form of moderate activity for a minimum of ten minutes at least one day per week. This percentage did not vary significantly by gender,region or age.
Of Upstate New Yorkers who reported engaging in moderate activity, the average number of days per weekwas 4.9, also generally without significant variation across subgroups (Table 5). More than 30 percent ofUpstate New Yorkers reported exercising moderately every day for at least ten minutes. A significantly higherproportion (42 percent) in the 18-34 age group reported daily participation. The mean number of days perweek by subgroup also was statistically insignificant.
A. Physical Activity
6

Table 5. Moderate activity: reported days per week (percentage by gender,region and age)
Respondents were asked to report the time per session of moderate activity to assess their status in relation tothe Healthy People 2010 objective. Approximately 44.5 percent reported meeting the objective of exercisingmoderately for 30 or more minutes at least five days per week (Table 6). Though regional variations weregenerally minor:
� The Southern Tier region had the lowest percentage of respondents who met this objective (41.7 percent).
� The proportion of Upstate residents meeting the objective decreased significantly with age, from 57.1 percent of 18-34 year-olds to 37.7 percent of those aged 65 and older.
� Upstate men were significantly more likely than women to meet the moderate activity objective (49.5 percent versus 42.0 percent). In the Southern Tier and Utica regions, this gender disparity was most significant. In the Southern Tier, approximately 49 percent of men versus 38 percent of women met the moderate activity objective. In Utica, the respective percentages were 54.1 percent and 42.2 percent.
� Rochester was the only region where the percentage meeting physical activity objectives did notdrop substantially with age or vary by gender (Table 7). In the Rochester region, 41.8 percent of those aged 65 and older met the moderate activity objective compared to 47.5 percent of those aged 18-34. The percentage was approximately 47 percent for both men and women.
7

Table 6. Percentage of Upstate New York adults meeting Healthy People2010 objective for moderate physical activity by gender, region and age
8

Table 7. Percentage of Upstate New York adults meeting Healthy People2010 objective for moderate physical activity: Regional profile byage and gender*
*The Healthy People 2010 objective is five days per week (preferably daily) of moderate physical activity for at least 30 minutes.
9
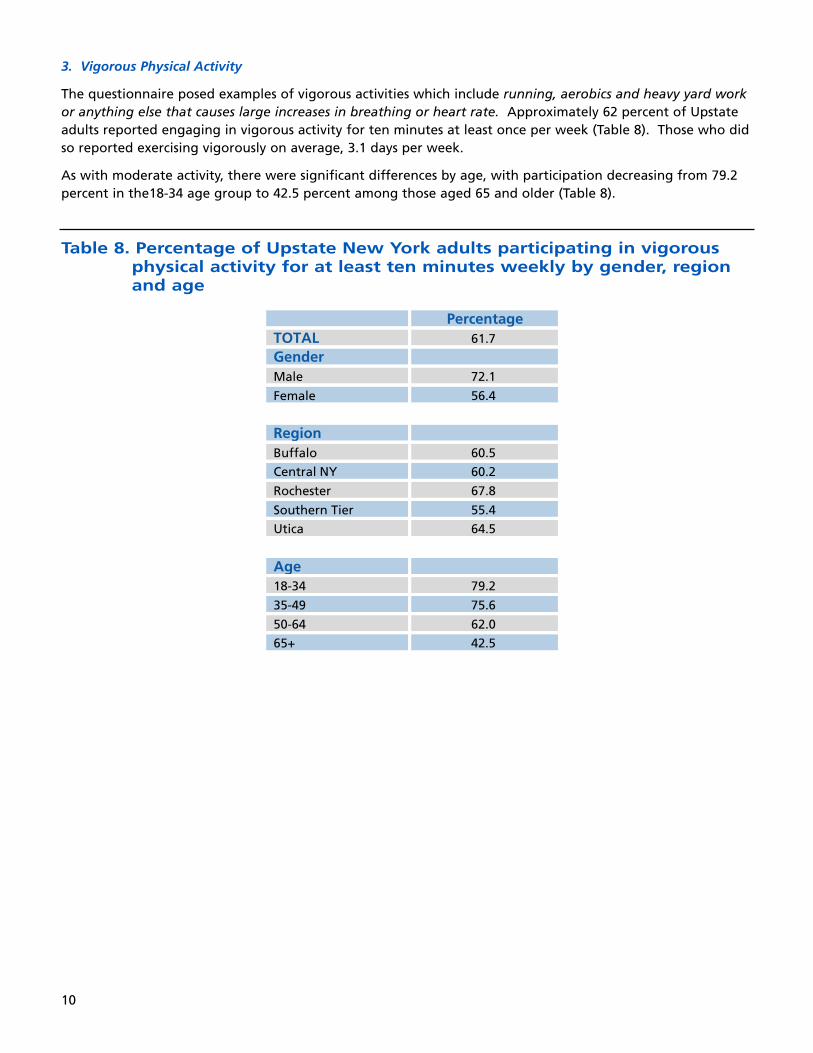
3. Vigorous Physical Activity
The questionnaire posed examples of vigorous activities which include running, aerobics and heavy yard workor anything else that causes large increases in breathing or heart rate. Approximately 62 percent of Upstateadults reported engaging in vigorous activity for ten minutes at least once per week (Table 8). Those who didso reported exercising vigorously on average, 3.1 days per week.
As with moderate activity, there were significant differences by age, with participation decreasing from 79.2percent in the18-34 age group to 42.5 percent among those aged 65 and older (Table 8).
Table 8. Percentage of Upstate New York adults participating in vigorousphysical activity for at least ten minutes weekly by gender, regionand age
10

Table 9. Percentage of Upstate New York adults participating in vigorousphysical activity for at least ten minutes weekly: Regional profile byage and gender
11

Roughly 30 percent of Upstate New York adults met the Healthy People 2010 objective for vigorous physicalactivity (Table 10). Similar to moderate activity, a higher percentage of men reported meeting the objectivecompared to women (39.0 versus 25.4 percent).
There was little overall regional variation, and as with moderate activity, the proportion meeting HealthyPeople 2010 objectives for vigorous activity decreased with age, significantly in Utica and the Southern Tier(Table 11).
Table 10. Percentage of Upstate New York adults meeting Healthy People2010 objective for vigorous physical activity by gender, region and age
12

Table 11. Percentage of Upstate New York adults meeting Healthy People2010 objective for vigorous physical activity: Regional profile byage and gender*
*The Healthy People 2010 objective is three or more days perweek of vigorous physical activity for 20 minutes per occasion.
13

4. Physical Activity Stage of Change
Self-perceptions of physical activity status were assessed by an adaptation of the Stages of Change model(Table 12). The majority (56.6 percent) reported a maintenance level of general physical activity, though, as noted above, a much lower percentage reported meeting Heatlhy People 2010 objectives for moderate and vigorous physical activity. Those in the 65 and older age range appear especially at risk for Relapse. Inaddition, the data suggest there are opportunities to move residents from the Preparation and Action stagestoward Maintenance.
Table 12. Self-perceived Stage of Change with respect to physical activityparticipation among Upstate New York adults by gender, region and age
14
B. Dietary patterns
1. Overall habits
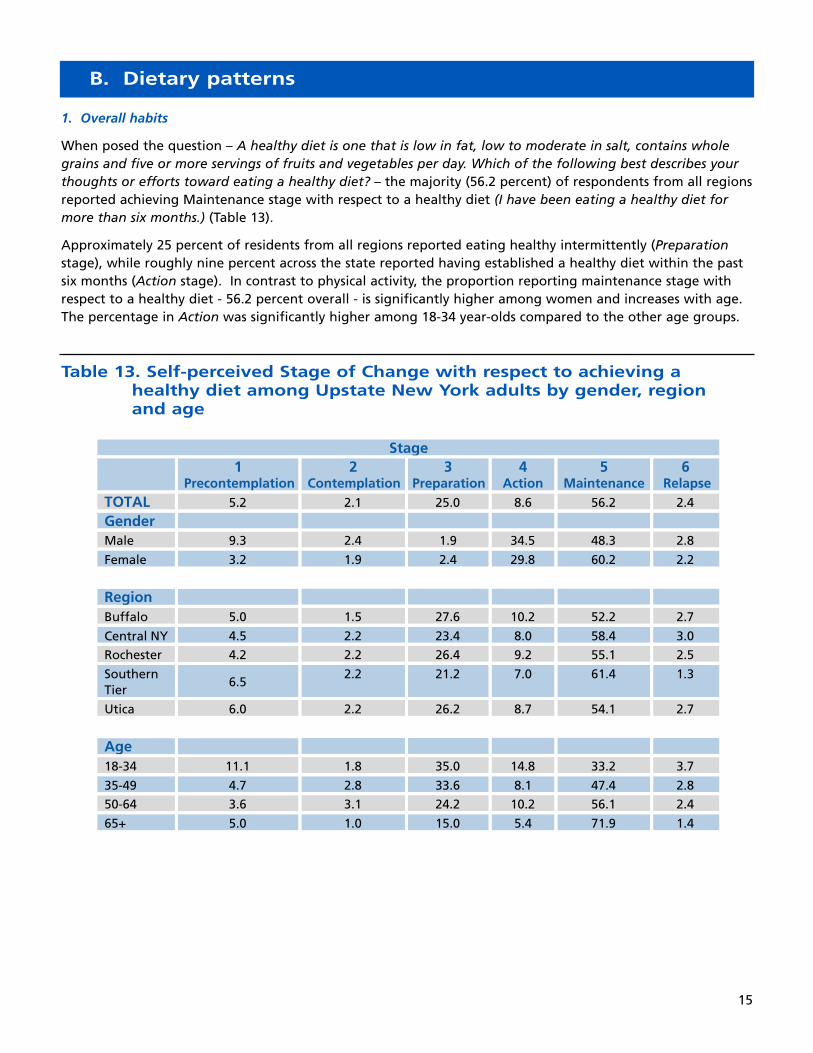
When posed the question – A healthy diet is one that is low in fat, low to moderate in salt, contains wholegrains and five or more servings of fruits and vegetables per day. Which of the following best describes yourthoughts or efforts toward eating a healthy diet? – the majority (56.2 percent) of respondents from all regionsreported achieving Maintenance stage with respect to a healthy diet (I have been eating a healthy diet formore than six months.) (Table 13).
Approximately 25 percent of residents from all regions reported eating healthy intermittently (Preparationstage), while roughly nine percent across the state reported having established a healthy diet within the pastsix months (Action stage). In contrast to physical activity, the proportion reporting maintenance stage withrespect to a healthy diet - 56.2 percent overall - is significantly higher among women and increases with age.The percentage in Action was significantly higher among 18-34 year-olds compared to the other age groups.
Table 13. Self-perceived Stage of Change with respect to achieving ahealthy diet among Upstate New York adults by gender, region and age
15

2. Fat intake
One of the Healthy People 2010 objectives is to decrease the percentage of adults who consume more than 30 percent of their daily calories from fat. While the telephone interview method precludes precisely measuring dietary fat intake, a Stages of Change adaptation for assessing fat consumption developed by theBehavior Change Consortium of the National Cancer Institute was administered (see Appendix 1). Though themajority of Upstate residents had reported being in Action or Maintenance stages with respect to a “healthydiet,” most were precontemplative regarding fat intake. There was little variation across regions, age groupsor gender, except that a higher percentage of those aged 65 and older were in Maintenance compared toyounger residents.
Table 14. Self-perceived Stage of Change with respect to dietary fat intakeamong Upstate New York adults by gender, region and age
16

3. Produce intake
Respondents were asked: A healthy diet includes five or more servings of fruits and vegetables per day.Which of the following best describes your thoughts or efforts toward eating the recommended five or moreservings of fruits and vegetables? In all regions, more than half of residents reported being in Maintenanceregarding produce intake. More than half of Upstate residents (53 percent) reported regularly eating the recommended level of produce for at least six months. Women were considerably more likely than men toreport being in this Maintenance stage (57 percent versus 45 percent). The proportion in Maintenance alsoincreased with age, from 37 percent of 18-34 year-olds to 64 percent of those 65 and older. These findingssuggest opportunities for interventions to move men and younger people from Preparation to Action toMaintenance.
Table 15. Self-perceived Stage of Change with respect to produce intakeamong Upstate New York adults by gender, region and age
17

C. Overweight/Obesity: A 2003 update
Body mass index was calculated by standard method respondent height and weight.5 By this measure roughly 56 percent of Upstate adults are considered overweight (BMI>25) or obese (BMI>29.9) (Figure 1). The Southern Tier region had the lowest obesity rate (14.6 percent). A higher percentage of women versusmen were in the normal weight range (49.3 versus 33.3 percent), due mainly to the higher proportion of menin the “overweight” category (45.1 percent versus 31.5 percent of women). Overweight prevalence increasesprogressively with age, from 27.7 percent in the 18-34 age group to 39.4 in those 65 and older. Obesity rateslikewise increase with age until 65, when the rate drops to 17.4 percent.
Figure 1. Overweight and obesity rates by gender, region and age
18
19
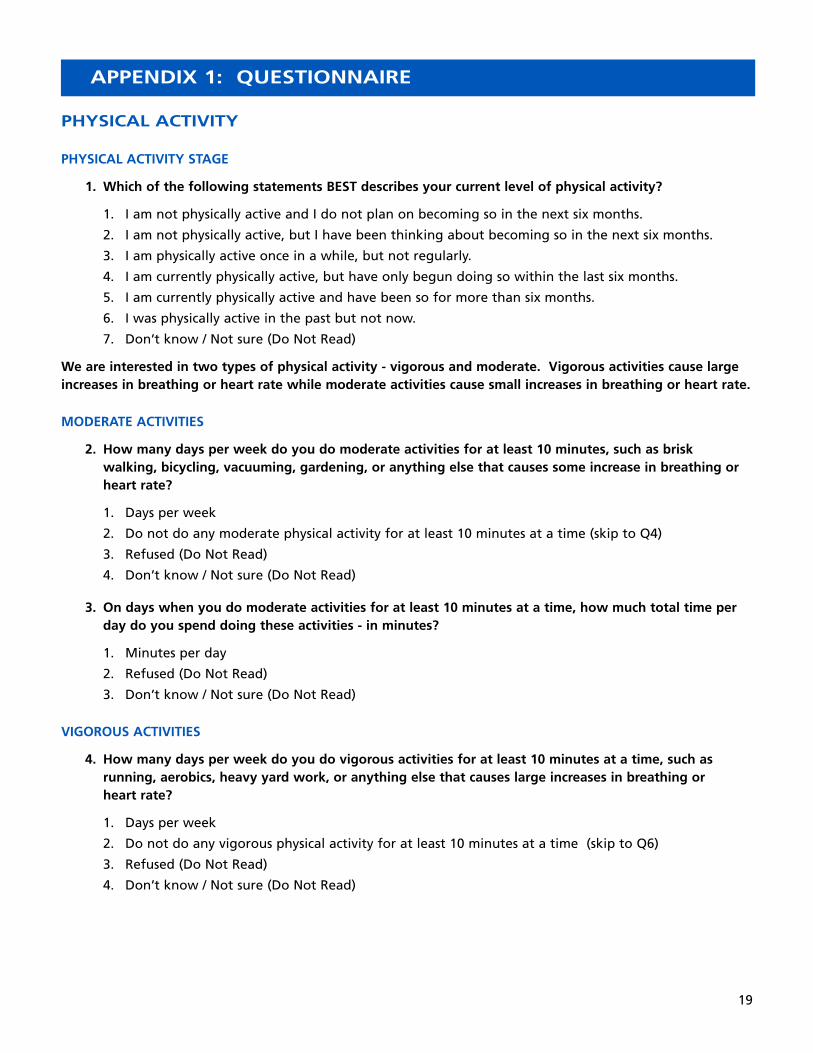
PHYSICAL ACTIVITY
PHYSICAL ACTIVITY STAGE
1. Which of the following statements BEST describes your current level of physical activity?
1. I am not physically active and I do not plan on becoming so in the next six months.
2. I am not physically active, but I have been thinking about becoming so in the next six months.
3. I am physically active once in a while, but not regularly.
4. I am currently physically active, but have only begun doing so within the last six months.
5. I am currently physically active and have been so for more than six months.
6. I was physically active in the past but not now.
7. Don’t know / Not sure (Do Not Read)
We are interested in two types of physical activity - vigorous and moderate. Vigorous activities cause largeincreases in breathing or heart rate while moderate activities cause small increases in breathing or heart rate.
MODERATE ACTIVITIES
2. How many days per week do you do moderate activities for at least 10 minutes, such as brisk walking, bicycling, vacuuming, gardening, or anything else that causes some increase in breathing or heart rate?
1. Days per week
2. Do not do any moderate physical activity for at least 10 minutes at a time (skip to Q4)
3. Refused (Do Not Read)
4. Don’t know / Not sure (Do Not Read)
3. On days when you do moderate activities for at least 10 minutes at a time, how much total time per day do you spend doing these activities - in minutes?
1. Minutes per day
2. Refused (Do Not Read)
3. Don’t know / Not sure (Do Not Read)
VIGOROUS ACTIVITIES
4. How many days per week do you do vigorous activities for at least 10 minutes at a time, such as running, aerobics, heavy yard work, or anything else that causes large increases in breathing or heart rate?
1. Days per week
2. Do not do any vigorous physical activity for at least 10 minutes at a time (skip to Q6)
3. Refused (Do Not Read)
4. Don’t know / Not sure (Do Not Read)
APPENDIX 1: QUESTIONNAIRE

5. On days when you do vigorous activities for at least 10 minutes at a time, how much total time per day do you spend doing these activities - in minutes?
1. Minutes per day
2. Refused (Do Not Read)
3. Don’t know / Not sure (Do Not Read)
LEISURE TIME PHYSICAL ACTIVITY
6. DURING THE PAST MONTH, other than during a regular job, did you participate in ANY physical activities or exercises such as running, calisthenics, golf, gardening, or walking for exercise?
1. Yes
2. No
3. Don’t know / Not sure (Do Not Read)
4. Refused (Do Not Read)
DIET AND NUTRITION
OVERALL DIETARY STATUS
7. A healthy diet is one that is low in fat, low to moderate in salt, contains whole grains and five or more servings of fruits and vegetables per day. Which of the following best describes your thoughts or efforts toward eating a healthy diet?
1. I am not thinking about trying to eat a healthy diet.
2. I am thinking about trying to eat a healthy diet within the next six months, but not within the next 30 days.
3. I am thinking about trying to eat a healthy diet in the next 30 days.
4. I eat a healthy diet once in a while, but not regularly.
5. I have been eating a healthy diet, just within the past six months.
6. I have been eating a healthy diet for more than six months.
7. I was eating a healthy diet in the past, but do not now.
8. Don’t know / Not sure (Do Not Read)
PRODUCE INTAKE
8. A healthy diet includes five or more servings of fruits and vegetables per day. Which of the followingbest describes your thoughts or efforts toward eating the recommended five or more servings of fruits and vegetables:
1. I usually do not and do not intend to within the next six months.
2. I usually do not but am thinking about starting to within the next six months, but not within the next 30 days.
3. I usually do not but am thinking about starting to within the next 30 days.
4. I sometimes eat the recommended amount, but not usually.
5. I usually do but have just started to within the past six months.
6. I usually do and have been for more than six months.
7. I usually did in the past, but do not now.
8. Don’t know / Not sure (Do Not Read)
20

21
DIETARY FAT INTAKE:
9. Do you consistently avoid eating high fat foods?
1. NO, and I do NOT intend to in the next six months.
2. NO, but I intend to in the next six months.
3. NO, but I intend to in the next 30 days.
4. YES, and I have been, but for LESS than six months.
5. YES, and I have been for MORE than six months.
6. Don’t know / Not sure (Do Not Read)
Please answer “Yes” or “No” to each of the following:
10. Do you ALMOST ALWAYS take the skin off your chicken (If you do not eat chicken, but you do eat redmeat, please choose “No.” If you do not eat chicken or red meat, please choose “Yes.”)
1. Yes
2. No
3. Don’t know / Not sure (Do Not Read)
11. Do you OFTEN eat reduced fat or low-fat cheese? (If you rarely eat cheese, please choose “Yes.”)
1. Yes
2. No
3. Don’t know / Not sure (Do Not Read)
12. Do you OFTEN use light, fat free or no salad dressing? (If you do not eat salads, please choose “No.”)
1. Yes
2. No
3. Don’t know / Not sure (Do Not Read)
13. Do you SOMETIMES eat fruit and vegetables as snacks? (If you do not eat high-fat snacks like chips, pastry or donuts, please choose “Yes.”)
1. Yes
2. No
3. Don’t know / Not sure (Do Not Read)
14. Do you OFTEN eat bread, rolls, or muffins without butter or margarine?
1. Yes
2. No
3. Don’t know / Not sure (Do Not Read)
15. Do you intend to change what you are eating so you can answer all five of the previous questions “Yes”?
1. NO, and I do NOT intend to in the next six months.
2. YES, and I intend to within the next six months.
3. YES, and I intend to within the next 30 days.
4. I ANSWERED YES to all of the five previous questions.
5. Don’t know / Not sure (Do Not Read)

DEMOGRAPHICS
16. Sex:
1. Male
2. Female
17. What month were you born in?
1. Enter Month
2. Refused
18. What year were you born in?
1. Enter Year
2. Refused
19. What is your height in feet and inches?
1. Enter height
2. Refused
3. Don’t know / Not sure (Do Not Read)
20. What is your weight in pounds?
1. Enter weight
2. Refused
3. Don’t know / Not sure (Do Not Read)
Questions 1, 7, 8:
See: Zimmerman GL, Olsen CG, Bosworth MF: A Stages of Change approach to helping patients change behavior: American Family Physician; March 1, 2000.
Richard W. Scholl, Professor of Management, University of Rhode Island
Questions 2-6:
The BRFSS (Behavioral Risk Factor Surveillance System), a program of the CDC. (http://www.cdc.gov/brfss)
Questions 9-15:
The Behavior Change Consortium of the National Cancer Institute.(http://www1.od.nih.gov/behaviorchange/measures/nutrition.htm)
Questions 16-20:
Standard demogrpahic questions.
APPENDIX II: QUESTIONNAIRE DEVELOPMENT SOURCES
22

23
Notes1 In this report, Upstate New York refers to all upstate counties, excluding those in the Albany region (see page 3).2 http://www.zogby.com/about/index.cfm3 www.healthypeople.gov4 Zimmerman GL, Olsen CG, Bosworth MF: A Stages of Change approach to helping patients change behavior:
American Family Physician; March 1, 2000. 5 Body mass index is calculated by dividing weight in pounds by height in inches squared and multiplying the result by 703.