a study of firm location to examine disclosures and .../67531/metadc799474/m2/1/high... · a study...
TRANSCRIPT

APPROVED:
Paul D. Hutchison, Major Professor Teresa L. Conover, Committee Member Robert J. Pavur, Committee Member Don W. Finn, Chair of the Department of
Accounting O. Finley Graves, Dean of the College of
Business Costas Tsatsoulis, Interim Dean of the
Toulouse Graduate School
A STUDY OF FIRM LOCATION TO EXAMINE DISCLOSURES AND GOVERNANCE
USING A DUAL APPROACH: QUANTITATIVE ANALYSIS BASED UPON THE
SARBANES-OXLEY ACT OF 2002 AND QUALITATIVE ANALYSIS OF THE
ANNUAL REPORT’S MANAGEMENT DISCUSSION AND ANALYSIS
Steve A. Garner, B.S., M.S. Acct.
Dissertation Prepared for the Degree of
DOCTOR OF PHILOSOPHY
UNIVERSITY OF NORTH TEXAS
May 2015

Garner, Steve A. A Study of Firm Location to Examine Disclosures and Governance
Using a Dual Approach: Quantitative Analysis Based upon the Sarbanes-Oxley Act of 2002 and
Qualitative Analysis of the Annual Report’s Management Discussion and Analysis. Doctor of
Philosophy (Accounting), May 2015, 80 pp., 8 tables, references, 104 titles.
The purpose of this dissertation is to investigate the effect of U.S. firms’ geographic
location, whether urban or rural, on their corporate disclosure and governance practices. An
“urban” firm is one that is headquartered in a large metropolitan area; whereas, a “rural” firm is
one that is headquartered some distance from any metropolitan area. Specifically, the study
examines whether there are different stock market reactions to urban and rural firms around key
event dates relative to the enactment of the Sarbanes-Oxley Act (SOX) on July 30, 2002. Also,
the readability and linguistic style in the Management Discussion and Analysis (MD&A) section
of public company’s annual reports (Form 10-K) to the Securities and Exchange Commission
(SEC) are investigated to determine whether urban and rural firms communicate information
differently to investors.

Copyright 2015
by
Steve A. Garner
ii

ACKNOWLEDGEMENTS
I would like to thank my chairman, Dr. Paul D. Hutchison, and my committee for their
invaluable comments and suggestions for this dissertation. Their expertise contributed greatly
and is embodied throughout the resulting product.
I would also like to thank those who have supported over the years in my pursuit of
education: Steve W. Garner, my grandfather, for his support, encouragement, and prayers;
Darrell and Kay Frazier, my uncle and aunt, and Carolyn Corcoran, my aunt, for their
encouragement, prayers, and constant support in my quest of a dream; Dr. Paul D. Hutchison for
the many important roles he has played in my life: mentor, chairman, advisor, and friend; Dr.
Michael J. Lacina for his invaluable advise and encouragement over the years; Dr. Teresa L.
Conover for her mentorship and encouragement; R. Dalton Nelson for encouraging me and his
prayers; and countless other friends who encouraged and prayed for me on this educational
journey.
Finally, I would like to dedicate this dissertation to my parents, L. Gene and W. Darlene
Garner. They have always believed in me, even in the times when I did not believe in myself.
Without their constant love, encouragement, moral support, and prayers, I would have never
been able to attempt and complete this doctorate in accounting.
iii

TABLE OF CONTENTS
Page
ACKNOWLEDGEMENTS ........................................................................................................... iii
LIST OF TABLES ......................................................................................................................... vi
CHAPTER 1 INTRODUCTION .................................................................................................... 1
1.1 Motivation for the Study ............................................................................................... 1
1.2 Goal and Objective ....................................................................................................... 3
1.3 Organization of Study ................................................................................................... 3
CHAPTER 2 LITERATURE REVIEW, IMPORTANCE OF FIRM GEOGRAPHY, SOX, AND MD&A BACKGROUND ..................................................................................................... 5
2.1 Literature Review.......................................................................................................... 5
2.1.1 Event Studies ..................................................................................................... 7
2.1.2 Quantitative Fundamental Analysis and Valuation Research ........................... 7
2.1.3 Qualitative Valuation Research ......................................................................... 9
2.2 Economic Factors Associated with Firm Location ..................................................... 15
2.2.1 Investor Preference for Locally Headquartered Firms .................................... 15
2.2.2 Geographic Location and Firm Oversight ....................................................... 17
2.3 Sarbanes-Oxley Act of 2002 (SOX) ........................................................................... 18
2.4 Management Discussion and Analysis (MD&A) ....................................................... 19
CHAPTER 3 THEORY, HYPOTHESES DEVELOPMENT, DATA, AND RESEARCH METHODOLOGY ....................................................................................................................... 22
3.1 Theoretical Basis ......................................................................................................... 22
3.1.1 Managerial Opportunism Theory .................................................................... 23
3.1.2 Efficient Contracting Theory .......................................................................... 24
3.2 Market Reaction to SOX Legislative Events .............................................................. 25
iv
3.3 Readability Prediction Based on Firm Location ......................................................... 29
3.4 Linguistic Tone – How Geography Intervenes in Predicting Future Firm Performance ................................................................................................................ 30
3.5 Research Methodology ............................................................................................... 31
3.5.1 Methodology for H1a and H1b – Market Reaction to SOX Legislative Events .............................................................................................................. 31
3.5.2 Methodology for H2 – Readability Based on Firm Location .......................... 34
3.5.3 Methodology for H3 – Using Linguistic Tone to Predict Future Performance .................................................................................................... 35
3.5.4 Data Sources .................................................................................................... 37
3.5.5 Sample Selection ............................................................................................. 39
CHAPTER 4 RESULTS AND INTERPRETATIONS ................................................................ 41
4.1 Chapter Overview ....................................................................................................... 41
4.2 Data Collection ........................................................................................................... 41
4.3 Tests of Hypotheses 1a and 1b – Market Reaction to SOX Legislative Events ......... 42
4.3.1 Analysis of Equation 5 – CAR Regressed on Corporate Governance Variables.......................................................................................................... 44
4.3.2 CAR Differences between Rural and Urban Firm Groups ............................. 46
4.4 Test of Hypothesis 2 – Readability Based on Firm Location ..................................... 51
4.5 Tests of Hypothesis 3 – Using Linguistic Tone to Predict Future Performance ........ 51
CHAPTER 5 SUMMARY, CONTRIBUTIONS, AND LIMITATIONS .................................... 56
5.1 Summary Findings ...................................................................................................... 56
5.2 Contributions............................................................................................................... 59
5.3 Limitations and Future Research ................................................................................ 60
APPENDIX EVENTS LEADING TO THE PASSAGE OF SOX ............................................... 62
REFERENCES ............................................................................................................................. 74
v

LIST OF TABLES
Page
Table A.1 Key Legislative Events Leading to the Passage of Sox .........................................65
Table A.2 Number of Sample Firms by Industry Group ........................................................66
Table A.3 Descriptive Statistics: Hypotheses 1a and 1b ........................................................67
Table A.4 Tests of Market Response to Corporate Governance Factors around Sox Events;Hypothesis 1a .............................................................................................68
Table A.5 Abnormal Returns around Legislative Events Leading to the Passage of Sox;Hypothesis 1b .................................................................................................69
Table A.6 Test of Difference in Fog Readability Score for Rural and Urban Firms;Hypothesis 2 ................................................................................................71
Table A.7 Descriptive Statistics; Hypothesis 3.......................................................................71
Table A.8 Tests of Association among Tone, Geographic Location, and Future Firm Performance; Hypothesis 3 ....................................................................................72
vi

CHAPTER 1
INTRODUCTION
The purpose of this dissertation is to investigate the effect of U.S. firms’ geographic
location, whether urban or rural, on their corporate disclosure and governance practices. An
“urban” firm is one that is headquartered in a large metropolitan area; whereas, a “rural” firm is
one that is headquartered some distance from any metropolitan area.1 Specifically, the study
examines whether there are different stock market reactions to urban and rural firms around key
event dates relative to the enactment of the Sarbanes-Oxley Act (SOX) on July 30, 2002. Also,
the readability and linguistic style in the Management Discussion and Analysis (MD&A) section
of public company’s annual reports (Form 10-K) to the Securities and Exchange Commission
(SEC) are investigated to determine whether urban and rural firms communicate information
differently to investors.
1.1 Motivation for the Study
Geographic location affects a wide range of economic behaviors. Prior research found
that shorter distances between economic agents are generally associated with lower information
asymmetry, higher visibility, and lower monitoring costs (Kedia and Rajgopal 2011) and that
investors tend to prefer stocks of firms whose headquarters are located nearby (Coval and
Moskowitz 1999). In light of these research findings, it would be interesting to investigate how
firms’ geography affects corporate disclosure and governance. Verrecchia (2001) found that
poor visibility, a factor commonly associated with rural firms, may result in higher cost of capital
and lower market value for the firm. Consequently, rural firms could face more expensive
1 A metropolitan area is one that has a population of at least one million people. In the United States, there are 49 metropolitan areas identified.
1

external equity financing and, thus, be less attractive to investors (Loughran and Schultz 2005).
However, recent research supports the notion that rural firms attempt to mitigate these adverse
effects of geographic location by putting corporate policies into practice that reduce agency
conflicts and that make investors more willing to invest in their stock. John, Knyazeva, and
Knyazeva (2011) examined how rural firms use corporate dividends to positively influence
shareholder perceptions. Specifically, their study argued that rural firms, facing the increased
cost of shareholder oversight of managerial investment decisions, would pre-commit to higher
dividends in order to mitigate agency conflicts. Findings from the study suggested that rural,
relative to urban, firms pay higher dividends.
The SEC has expressed concern about the legal terminology used in annual reports and
has encouraged the use of plain English disclosures. In October 1998, the SEC issued guidelines
that urged publically traded firms to use plain English in the drafting and formatting of reports,
and the SEC Investor Education Office offered on its website: “A plain English handbook: how
to create clear SEC disclosure documents” in order to provide guidance to firms on the drafting
of disclosure documents (SEC 1998). The current study examines whether rural firms comply
with these SEC guidelines as a mechanism to instill confidence in their investors.
Finance literature has also provided ample evidence as to the importance of firm location
(Malloy 2005; Pirinsky and Wang 2006). Results from a number of studies consistently suggests
that investors prefer locally headquartered firms over firms that are farther from the investor
(French and Poterba 1991; Coval and Moskowitz 1999; Huberman 2001). However, only a few
studies exist that considered actions that a firm might adopt in order to mitigate perceived agency
conflicts between the firm and investor (John et al. 2011). Further, to date, no research using an
event study or a qualitative approach to investigate these issues has been published.
2

1.2 Goal and Objective
The overall goal of this dissertation is to expand accounting knowledge about disclosures
and corporate governance by examining the impact of firm location on corporate disclosures and
investors. This study extends recent research, which determined that firm geography affects
corporate behavior towards investors (John et al. 2011), by examining whether firms adopt
higher quality governance and disclosure practices to mitigate the negative effects of geographic
location.
Within the overall goal, the specific research purpose of this study is to provide insight
into firm location, SEC regulation, disclosure, and corporate governance by utilizing two
methods: an event study and a qualitative investigation of annual reports. The event study
portion of the dissertation shows whether identifiable security price changes that result from
SOX implementation are impacted by firm geography. Prior literature showed that, overall,
events around regulatory announcements are associated with negative market reactions (Ziebart
and Kim 1987; Salatka 1989; Paletta and Lucchetti 2010). However, research also found that
firms that are not heavily impacted by regulation do not experience the same negative returns to
the regulatory announcements when compared to firms whose operations are significantly
affected by the regulation (Dyckman and Smith 1979). If rural firms had strong corporate
governance prior to SOX, this study posits that these firms will not be as negatively impacted by
its passage relative to urban firms. The study also uses a qualitative approach to examine
whether the narratives in firms’ annual reports differ between urban and rural firms.
1.3 Organization of Study
The remainder of this dissertation is organized into chapters. Chapter 2 discusses
relevant background information by reviewing and synthesizing empirical studies dealing with
3

the information content of financial reports, the impact of firm geography, and SOX regulation.
Chapter 3 presents the theory, hypotheses development, and the research methodology utilized.
Chapter 4 discusses the results and interpretations of the analyses. Chapter 5 concludes the
dissertation and discusses limitations and future research.
4
CHAPTER 2
LITERATURE REVIEW, IMPORTANCE OF FIRM GEOGRAPHY, SOX, AND MD&A
BACKGROUND
2.1 Literature Review
In order to understand the importance of the information content in financial statements, a
review of relevant accounting literature is required. Ball and Brown (1968) and Beaver (1968)
are among the first studies in accounting to examine the information content of earnings and are
considered seminal articles in capital markets accounting research. Popular accounting research
in the 1960s argued that earnings numbers would not communicate new information to the stock
market because they are not measured using a single concept of income. Contrary to this widely
accepted perspective in accounting literature, Ball and Brown built upon finance literature and
assumed that accounting earnings were related to stock prices and that earnings could be useful
measures or indices of firm value. Beaver also investigated whether annual earnings
announcements communicated new information to the market. He found dramatic changes in
price and volume of common stock around the earnings announcement dates.
These studies are supportive of the efficient market hypothesis, which suggests that an
efficient market will take all relevant information into account for pricing securities (Fama 1965)
and security prices will quickly adjust to new information and reflect the flow of information to
the market. Dyckman and Morse (1986) posited that efficient markets research in accounting
represented a significant breakthrough by accounting researchers and argued that publically
available accounting information potentially has greater information content than the efficient
market hypothesis suggests.
5

Two types of studies now common in capital markets research are event studies and
association studies (Kothari 2001). Both Ball and Brown (1968) and Beaver (1968) used an
event study methodology, while Ball and Brown also used an association approach. Event
studies test the arrival of new information through an event and hinge on the hypothesis that the
market is informationally efficient in the sense that stock prices quickly reflect new information
(Kothari 2001).
A key component of capital markets research in accounting is identifying the relationship
between information content and valuation, which constitutes an association study. An
association study tests for correlations between an accounting performance measure (e.g.,
earnings or cash flow from operations) and stock returns. The objective of an association study
is to examine whether and how quickly security returns reflect information related to accounting
measures (Kothari 2001).
Researchers have long used fundamental analysis to determine the association
relationship. Fundamental analysis is defined as “the analysis of information that focuses on
valuation” (Penman 2004). As such, this type of analysis is critical to investors because they
want to know how much to pay for an investment and for how much to sell it, and the main focus
of fundamental analysis is valuation, seeking to identify mispriced securities (Kothari 2001).
Most fundamental analysis research in accounting is focused upon the determination of earnings’
or stock returns’ forecasts to assist with the valuation of assets or identification of mispriced
securities. The main significance of fundamental analysis is that it is of interest to both believers
and non-believers of market efficiency, and research in this area “can help us understand the
determinants of value which assists in informed investment decisions and the valuation of non-
6

publically traded assets, for which market efficiency is not a necessary condition” (Richardson,
Tuna, & Wysocki 2010).
This dissertation now reviews the beginnings of events studies in accounting and finance
literature, followed by a review of both quantitative and qualitative fundamental analysis and
valuation research.
2.1.1 Event Studies
Event studies have their beginnings in accounting and finance literature and have since
been extended to other disciplines, such as history, economics, management, law, political
science, and economics (Carrado 2011). Research in accounting and finance very broadly
interprets what constitutes an event study. While a substantial portion of this research examines
the event as emanating from a firm (e.g., an earnings announcement), announcements outside of
firms (e.g., a new accounting standard) or general “happenings” (e.g., an oil spill) also constitute
events (Bowman 1983). Event studies have been documented as early as 1933 (Dolley 1933),
and research utilizing event studies encompasses a wide range of topics and specific technique
choices. As of the year 2000, over 500 event studies have been published in five leading finance
journals alone, and the number of papers employing an event study methodology continues to
grow (Warner and Kothari 2006).
2.1.2 Quantitative Fundamental Analysis and Valuation Research
Although a key focus of the current study is qualitative and directed at fundamental
analysis and valuation, a review of quantitative studies is necessary because the research
methodology applied to qualitative disclosures had its nexus in the methods used in the
investigation of quantitative disclosures. Companies have been using methods based on
fundamental analysis as early as the 1920s, beginning with the Dupont corporation’s creation of
7

an analysis that broke down financial numbers into more complex equations (Drew 1950). In
accounting literature, one of the seminal fundamental analysis studies at the academic level is
“Financial Statement Analysis and the Prediction of Stock Returns” by Ou and Penman (1989)
(hereafter OP), and their study started a stream of literature where firm value was assessed based
upon the analysis of the financial statements. OP performed quantitative financial statement
analysis in which a large set of financial statement items were combined into one summary
measure that indicated the direction of one-year-ahead earning changes. OP used the summary
measure to predict future stock returns and found that this measure was able to robustly predict
future stock returns. A crucial point to fundamental analysis is that firms’ values are indicated
by information in financial statements.
Other studies have since extended the research stream pioneered by OP on financial
statement analysis. For example, Lev and Thiagaragan (1993) (hereafter LT) performed a
fundamental analysis that used earnings, risk, growth, and competitive position (fundamentals
long considered by analysts to be important) as key value-drivers in determining the value of
securities. LT identified a set of 12 fundamental signals, such as inventory, accounts receivable,
gross margin, selling expenses, capital expenditure, and other signals. (A signal is a specific
configuration of several fundamental variables. For example, the inventory signal in the LT
study consisted of change in inventory and change in sales variables.) The LT study is
distinctive in that the authors relied upon analysts’ descriptions of important fundamentals rather
than a statistical search procedure. Overall, LT found most of the fundamentals to be value-
relevant information for the time period of the study and theorized that investors used
fundamental signals in order to determine the quality of reported earnings.
8

Since 2000, research on quantitative fundamental analysis has focused on context-
specific elements or on a subset of firms whose value might be more predictable, because of
market imperfections, by use of fundamental analysis. Piotrowski (2000) developed an F-score,
based on fundamental signals, and examined only high book to market ratio (B/M) firms. Within
the high B/M sample, results indicate that firms with the highest F-score exhibited returns that
were 20 percent greater than firms with the lowest F-score, suggesting that the fundamentals
were reflecting the return differences. Beneish, Lee, and Nichols (2013) used an accounting-
earnings manipulation model and found that firms with a higher probability of manipulation
earned lower returns among every decile portfolio. These studies suggest that fundamental
analysis was beneficial to use on specific subsamples of firms whose securities were likely to be
mispriced.
All of the studies noted have one common theme: utilization of a quantitative
fundamental analysis approach to identify mispriced securities in firm financial statements.
Kothari (2001) noted that an important goal of capital markets research was to provide evidence
on the “information content” of financial statements for the purpose of determining securities
prices. Although the fundamental analysis research reviewed herein is quantitative, a review is
necessary because it is a precursor to research related to the information content of qualitative
disclosures. Next, this dissertation reviews a number of studies that examined the information
content of qualitative disclosures.
2.1.3 Qualitative Valuation Research
One major limitation to research in quantitative fundamentals and valuation research is
that numbers in financial statements are based upon historical data and tend not to be forward
looking. Statement of Financial Accounting Concepts No. 1 (1978) by the Financial Accounting
9

Standards Board (FASB) outlined the objectives of financial reporting by business entities. In
this statement, the FASB explained that quantitative information is limited by the fact that
financial reporting largely reflects the financial effects of past events and transactions, and the
use of such information about past trends or relationships does not imply that the future can be
predicted (FASB 1978, para. 21). Users of financial statements are becoming more and more
aware of the limitations of quantitative information and are starting to pay closer attention to the
textual or narrative disclosures made by managers.
Similar to the discussion of information content related to the financial statements,
research has extensively examined the information content of quantitative information since the
1960s, starting with Ball and Brown’s (1968) examination of information content related to
accounting income. Research on information content related to non-quantitative information in
accounting did not begin until decades later. In the early 1980s, Katherine Frazier, in her
dissertation, conjectured about the importance of forward looking qualitative information and
maintained that management could use reports to communicate important non-historic
information (Frazier 1981). Her study, although exploratory, was among the first to examine the
use of narrative disclosures made by managers in annual reports and asserted that these
disclosures contained important information in the assessment of prospective firm performance.
She found that narrative disclosures are “observable and quantifiable” and that the firms in her
sample displayed some systematic characteristics that “allowed discrimination between firms
disclosing different financial attributes.”
Several methods of investigating the information content of narrative disclosures have
been used over the years, including the length (quantity) of the disclosure, the textual complexity
(readability) of the communication, and the linguistic tone used in managers’ communication.
10

The current study examines the readability and linguistic tone used in managers’ communication
to investors. The following review pertains to these elements.
2.1.3.1 Readability
Readability is the ease with which readers can read and understand the written text
(Tinker 1963). Dale and Chall (1948) offer the following definition of readability:
In the broadest sense, readability is the sum total (including the interactions) of all those elements within a given piece of printed material that affect the success a group of readers have with it. The success is the extent to which they understand it, read it at an optimal speed, and find it interesting. The concept of readability began in the 1880s when English professor L.A. Sherman
found that sentences in English were becoming increasingly less complex. His work showed that
(1) literature is a subject open to statistical analysis, (2) concrete terms and shorter sentences aid
people in understanding what is written, (3) speech is easier to understand than text, and (4) text
makes more sense if it is more like speech (Sherman 1893). Research in readability continued in
English literature and was extended to psychology and other disciplines in the 1920s (Kitson
1927).
In the 1940s, several studies in readability and newspaper circulation showed that even
small changes in readability can greatly affect readership in large-circulation newspapers.
Murphy (1947) employed a split-run newspaper edition to explore the effects of making text
easier to understand. In an article about nylon, he found a 43 percent rise in readership resulting
from a reduction in reading level of the text (from a 9th grade level to a 6th grade level); he also
found a 60 percent increase in readership for an article on corn. In 1952, Robert Gunning
developed the Fog index to measure the readability of English writing. The Fog Index
corresponds with the reading level of the student. For example, a Fog Index of 12 corresponds
with a reading level of a high school senior (Gunning 1952). Gunning and others worked closely
11

with newspapers to improve readability, and, within a few years, the readability of U.S.
newspapers went from the 16th to the 11th-grade reading level, where it remains today (Klare,
Mabry, and Gustafson 1955).
A few studies in accounting literature examined the readability of a manager’s narrative
disclosures. Schroeder and Gibson (1990) (hereafter SG) studied the readability of the
Management Discussion and Analysis (MD&A). The MD&A provided a narrative of issues and
trends relating to the capital resources, liquidity, and operating results and is required by the U.S.
Securities and Exchange Commission (SEC) for publically held companies as part of its required
annual reporting submission. Although guidelines for the MD&A have been established by the
SEC, the style and format of presentation are at the discretion of the manager. As such, SG
realized that managers have the opportunity to make the MD&A more readable than the
footnotes of financial statements, which are shaped by specific guidelines and tend to be
boilerplate in nature. Although one would expect the MD&A, because of its flexibility in style
and presentation, to be more understandable than the footnotes of the financial statements, SG
found in a sample of Fortune 500 companies for the year 1986 that the readability of the MD&A
closely resembled that of the footnotes.
Other studies have examined the relationship between the readability of narrative
disclosures and corporate profitability. The evidence was largely mixed and inconclusive. For
example, Courtis (1986) examined the readability of 142 Canadian annual reports for 1982 and
1983 and did not find a significant association between report readability and profits and returns
on capital. On the other hand, Subramanian, Insley, and Blackwell (1993) studied the annual
reports of large U.S. firms and found that the annual reports of profitable firms were significantly
easier to read than those of poor performers. More recently, Li (2008) examined the readability
12

of firms’ annual reports and found that the annual reports of firms with lower earnings are harder
to read than those with higher earnings. Results also suggest that annual report readability is
closely correlated with positive persistent earnings.
Lehavy, Li, and Merkley (2011) examined the effect of annual report readability on
analyst following and the properties of analyst earnings forecasts. The authors found that firms
with less readable annual reports exhibited a greater following by analysts. Furthermore, they
found that analyst reports for these firms required more effort to generate and the
informativeness of analyst reports was greater. The results from Lehavy et al. (2011) suggested
that demand for analyst services increased for firms with less readable communications and that
analysts made a greater collective effort for these firms. If investors are required to rely on
analysts’ services in order to obtain information about the company, the cost of information to
the investor is high and is indicative of information asymmetry between the firm and investor.
2.1.3.2 Linguistic Tone
The next approach to the analysis of narrative disclosures by managers relates to the
linguistic or semantic features of the disclosure. These linguistic features pertain to how
disclosures are written. When using this approach, one examines the words and/or linguistic
structure of the narrative statements rather than examining the subject matter.
Accounting research has provided only a few studies that examined a manager’s use of
linguistic tone to reveal information to financial statement users. Yuthas, Rogers, and Dillard
(2002) studied the ethical characteristics (i.e., truthful, sincere, comprehensive, and legitimate) of
management’s narrative disclosure in the annual report. If managers are communicating
ethically, theoretically, their narrative disclosures should be communicating such actions;
13
however, unethical behavior should manifest itself when manager’s narrative disclosures are
found to be less than truthful, sincere, comprehensive, and legitimate.
Employing a rhetorical analysis, the authors examined firms with good or bad earnings
surprises (i.e., unexpected results) for the year 2000. Yuthas et al. argued that unethical firms
disclosed information strategically in order to “influence or alter the perception of users despite
the actual nature of the information being communicated” and expected that managers used the
narrative sections of the annual report strategically. They found, however, that firms expecting
large earnings surprises, both positive and negative, exhibited more communicative action
relative to firms with no earnings surprises. The study by Yuthas et al. was among the first to
examine the semantic content of a firm’s annual reports.
Henry (2008) investigated the rhetorical content of earnings press releases to examine
whether investors were influenced by how the releases were written (i.e., the tone of the report).
Tone is defined as “the effect of communication… [and] is closely linked to the promotional role
of earnings press releases because many promotional techniques employed in a release would
create a positive tone.” Results suggest that the tone of a report affects how investors will react
to them. Specifically, this study found that abnormal market returns are higher when the tone is
positive.
Following Henry’s study of tone in earnings announcements, Cho, Roberts, and Patten
(2010) investigated the tone used in a firm’s environmental disclosures contained in 10-K reports
and argued that corporations use language and verbal tone to misrepresent underlying
environmental conditions. Cho et al. (2010) found that firms with a more optimistic and less
certain tone in the environmental disclosure section exhibited poorer environmental performance
relative to their better-performing counterparts.
14

2.2 Economic Factors Associated with Firm Location
Geographic location affects a wide range of economic behaviors, and recent research
found that closer geographic proximity between economic parties is commonly associated with
lower information asymmetry and lower monitoring costs (Ivkovic and Weisbenner 2005).
Finance literature has long examined the impact of firm location on investment decisions (Eldor,
Pines, and Schwartz 1988; French and Poterba 1991), and accounting research has recently
begun to examine how geography affects such factors as audit quality (Defond, Francis, and Hu
2011), SEC enforcement (Kedia and Rajgopal 2011), and Chief Executive Officer (CEO) pay
(Francis, Hasan, John, and Waismann 2007). The following is a review of pertinent finance and
accounting literature related to the effects of firm geography.
2.2.1 Investor Preference for Locally Headquartered Firms
Prior research showed well-documented gains from international diversification (Eldor et
al. 1988; DeSantis and Gerard 1997). Despite this, investors in international markets strongly
exhibited a preference for domestic equity. Although U.S. firms comprised less than 48 percent
of the global equity market at the time, French and Poterba (1991) documented that U.S. equity
traders allocated approximately 94 percent of their funds to domestic securities. This
phenomenon is called the “home bias puzzle,” and exists where investors appear to invest only in
their home country, while ignoring investment opportunities elsewhere.
Although many obstacles to foreign investment have substantially diminished in recent
years due to technology improvements, the propensity to invest in one’s home country remains
strong (Coval and Moskowitz 1999). Two explanations that have been put forth to explain this
propensity are: (1) the existence of national boundaries (a distinguishing feature in international
capital markets), and (2) a preference for geographic proximity. Under the first explanation,
15

when capital crosses monetary and political boundaries, it faces differences in regulation,
culture, and taxation, exchange rate fluctuation, and sovereign risk (Brennan and Cao 1997).
The second explanation for the home bias puzzle focuses on investors’ preference for
geographic proximity, defined as the distance between the firm and the investor. If only the
studies comparing international to domestic investment preferences are considered, an argument
could be made that the overwhelming propensity to invest domestically is driven primarily by the
national and political landscapes in which firms operate. Thus, before geographic proximity to
the investor can be considered as a factor for investor preference, one should also consider the
effects of proximately apart from international operating environments. If geographic proximity
drives investor preference, it should affect both international and domestic investment decisions,
and few studies examined only domestic investments so that their results are not confounded by
international factors. Coval and Moskowitz (1999) examined the effect of geographic proximity
by analyzing the investment portfolio choice within the U.S. domestic economy, avoiding
confounding factors due to political and monetary boundaries, and found a preference for
investing close to home applies to portfolios of domestic stocks. Specifically, results suggest
that U.S. investment managers strongly prefer locally headquartered firms. Ivkovic and
Weisbenneer (2005), also examining domestic investments in U.S. markets, used data on
investments made by a large number of individual investors though a discount broker. Their
findings suggested that households strongly preferred local investments. These preferences for
nearby investments suggested that investors valued locally available information and the
accompanying ability to observe management decisions, and international boundaries were not a
factor in these studies.
16

2.2.2 Geographic Location and Firm Oversight
In spite of technological advances, distance has been shown to affect information
available to those outside the firm (Barber and Odean 2008; John, Knyazeva, and Knyazeva
2011). It is entirely possible that markets view distance farther from the investor as a negative
signal. If a firm wants to hide information, it could be located in an area more difficult to
observe and thereby communicate, or signal, the concealment of information. Conversely, firms
might be able to provide a positive signal to investors by locating in urban areas and reducing
information asymmetry between the firm and investor. This is consistent with the notion that
firms reduce information asymmetry as a signaling mechanism to investors (Morris 1987).
Recent research has examined the relation between location of U.S. firms and the ability
to monitor and oversee firm activity. Consistent with the geography of SEC enforcement
influencing incentives and behavior, Kedia and Rajgopal (2011) showed that differences in a
firm’s information sets concerning SEC enforcement and constraints (which are partially
affected by geographic proximity) affected their tendencies to adopt aggressive accounting
practices. Specifically, they found that firms located closer to the SEC, and in areas with greater
past SEC enforcement activity, were less likely to restate their financial statements, and that the
SEC is more likely to investigate firms located closer to its offices. DeFond, et al. (2011)
examined how the geography of SEC enforcement affected an auditor’s reporting incentives and
showed that auditors are more likely to issue a going concern report when their engagement
office is located closer to an SEC regional office.
Lerner (1995) examined firm location in the context of venture capital oversight. The
study argued that the cost of oversight increased with distance and found that geographic
proximity is an important determinant of the likelihood of venture capital investor board
17

membership. Location also affected Chief Executive Officer (CEO) power and board
compensation (Francis et al. 2007; Kynazeva, Kynazeva, and Masulis 2009).
However, research has found that rural firms attempted to mitigate these adverse effects
of geographic location by implementing corporate policies so that agency conflicts were reduced
and that investors would be more willing to invest in stocks of rural companies. John et al.
(2011) investigated the impact of geography on corporate dividend behavior. Specifically, their
research found that rural firms, facing increased costs of shareholder oversight of managerial
investment decisions, were pre-committed to higher dividends in order to mitigate agency
conflicts. Results indicated that rural, relative to urban, firms paid higher dividends.
The importance of firm location, in a broad sense, has been well documented in finance
literature (Malloy 2005; Pirinsky and Wang 2006). Results have consistently shown that
investors prefer locally headquartered firms over firms that are farther from the investor.
However, besides John et al. (2011), few research studies related to firm location have
considered actions that a firm might take to mitigate perceived agency conflicts between the firm
and investor.2
2.3 Sarbanes-Oxley Act of 2002 (SOX)
Shortly after 2000, several business failures and fraudulent accounting practices raised
serious questions about the credibility of corporate financial reporting for firms traded in the
United States. Following the revelations of massive accounting fraud at large firms such as
Enron and Tyco in 2001 and Waste Management and WorldCom in 2002, the ensuing public
outrage prompted Congress to pass the Sarbanes-Oxley Act of 2002 (hereafter SOX), which
2 The primary “signal” sent by rural firms to investors that is investigated in this study relates to the quality of information provided in narrative disclosures. Of course, many other signals are possible. In the audit literature, hiring a large audit firm (i.e., a Big-N auditor) to perform audits has long been considered a mechanism that client firms utilize to signal higher quality corporate governance to investors (DeAngelo 1981).
18

combined the accounting reform bills of U.S. Senator Paul Sarbanes and Representative Michael
Oxley, with unanticipated swiftness on July 25, 2002. The purpose of SOX is to “protect
investors by improving the accuracy and reliability of corporate disclosures made pursuant to the
securities laws” (U.S. Congress 2002). President George W. Bush stated that SOX legislation
incorporates the “most far-reaching reforms of American business practices” since the Securities
Act of 1933 and Securities Exchange Act of 1934 (Hitt 2002) (see Appendix A for a more
thorough narrative of events leading to the passage of SOX).
The passage of SOX fostered in new requirements for public corporations required to file
financial reports under the Securities Exchange Act of 1934, including requirements pertaining
to executives, boards of directors, and audit committees. Specifically, the regulations imposed
by SOX were designed to provide investors with greater transparency, hold executives
accountable for financial statements, and enhance the quality and independence of corporate
audits (Williams 2005). A few major provisions of SOX are Sections 302, 404, 407, and 906.
Sections 302 and 906 require that the Chief Executive Officer (CEO) and Chief Financial Officer
(CFO) take personal responsibility for financial statements. Section 404 requires firms, in their
annual reports, to publish information concerning the scope and adequacy of the internal control
structure and procedures for financial reporting. They must also assess the effectiveness of such
internal controls and procedures. Section 407 directs publically traded firms to disclose whether
or not it has a “financial expert” on the audit committee. SOX implementation began shortly
after its passage and further rulemaking activities continued through 2003 (Zhang 2007).
2.4 Management Discussion and Analysis (MD&A)
The Management Discussion and Analysis (MD&A) is a narrative reporting instrument
required by the SEC as part of a firm’s annual report to investors (i.e., 10-K report). In the
19

MD&A, managers are expected to go well beyond mere reporting of financial numbers required
by U.S. Generally Accepted Accounting Principles (U.S. GAAP). Section 13 of the Securities
Exchange Act of 1934 gave the SEC authority to enact regulations related to corporate reporting
by publically traded companies in the United States (Miller and Robertson 1989).
Regulation S-K, item 303, presents the SEC’s specific requirements for the MD&A and
requires that “management’s discussion and analysis of financial condition and results of
operations” be included in firms’ annual reports, which are required by the 1934 Act (SEC
2003). Originally, the MD&A began in 1968 as part of a “summary and analysis of earnings and
their components” (Hufner 2007). The current structure of the MD&A framework was instituted
in 1980 by the SEC and requires a more thorough discussion of the financial reports as a whole.
Under this current framework, companies are required, in the MD&A, to report managers’
perceptions of liquidity, capital resources, and results from operations (Schroeder and Gibson
1990).
The stated purpose of the MD&A is summarized by the SEC in a 1989 release as follows:
“The MD&A requirements are intended to provide, in one section of filing, material historical
and prospective textual disclosures enabling investors and other users to assess the financial
condition and results of operations of the registrant, with particular emphasis on the registrant’s
prospects for the future” (SEC 1989).
Hufner (2007) noted that three principle objectives of the MD&A requirements are: (1)
to present investors with a narrative account from a manager’s perspective of a company’s
financial statements; (2) to generally increase company disclosure and to provide a contextual
basis for investors to analyze financial information; (3) to make available information related to
the quality and potential variability of the earnings and cash flows of a company. Hufner (2007)
20

also suggested that the SEC, in more recent years, has emphasized more clarity in the writing
style and data presentation of the MD&A in an attempt to make corporate disclosures more
readable and understandable to investors. The SEC’s extensive guidance for the MD&A
emphasizes that disclosures by management be clear, readable, and understandable so that the
disclosures provide investors with useful, relevant information.
The MD&A “is arguably the most read and important component” of the non-financial
section and, as such, imparts very significant information to investors and other financial
information users (Tavcar 1998). Furthermore, the MD&A is considered more useful and
credible than the company president’s letter and interim earnings announcements (Schroeder and
Gibson 1990). Because the MD&A is considered by many to be more credible than other forms
of narrative disclosure to investors, it is not unreasonable to surmise that the MD&A contains
information more valuable to the investor relative to other qualitative information that is
publically available (Tavcar 1998).
This dissertation examines whether managers, as reflected in the MD&A, use complexity
(readability) and word choice (linguistic style) as a mechanism to reduce information asymmetry
to investors. An important goal of this study is to increase our understanding about the MD&A,
a valuable communication instrument used by managers.
21

CHAPTER 3
THEORY, HYPOTHESES DEVELOPMENT, DATA, AND RESEARCH METHODOLOGY
3.1 Theoretical Basis
An investor’s ability to amass value-relevant information about urban firms with greater
accuracy and ease than they could about remote firms could possibly explain the previously
discussed investor preference for local stocks (John et al. 2011). If this bias is information-
driven, Coval and Moskowitz (2001) argue that investors should be able to earn better returns on
their local investments. Accordingly, they found evidence to suggest that mutual fund managers
generate returns in excess of 2.67 percent per year more on local stocks than on other
investments. Ivkovic and Weisbenner (2005) provide similar evidence for local investment in
the context for individual investment by finding that individual investors, on average, earn an
additional 3.7 percent per year from their local investments than from their other investments,
and the difference between returns on local and other stocks jumped to six percent when only
stocks from the non-S&P 500 Index are taken into account. The results from these studies
suggest that the preference for investment in local stock is predominantly information-driven.3
Given that investors inexplicably hold and trade local stocks because of information
advantages, this study posits that urban firms have a relative informational advantage over rural
firms. Prior research suggests that people have more information on local firms due to proximity
and convenience. Access to a firm’s employees, managers, local suppliers, and customers
provides investors with additional information about a company. Further, investors are made
3 The studies by Coval and Moskowitz (2001) and Ivkovic and Weisbenner (2005) examine investments only in U.S. domestic markets, and “local” investment, in these studies, refers to investment in firms that are headquartered in the same city as the investor. In the current study, “local” is generalized to “urban” so that the entire capital market can be examined. In other words, urban firms are located in close proximity (e.g., local) to a large number of potential investors and would thus experience the benefits associated with local investment preferences.
22

aware of information about firms through local information sources, such as media outlets and
analysts. Bamber and Odean (2008) examined whether investors bought stocks that came to
their attention though mechanisms like news outlets. Their results suggest that investors tended
to buy stocks heavily covered by the news media, stocks with extreme one-day returns, and
stocks with abnormally high trading volume. Likewise, Grullon, Kanatas, and Weston (2004)
documented that firms with greater advertising expenditures and a corresponding visibility to
investors experienced a larger number of institutional and individual investors in addition to
superior liquidity for their common stock. Malloy (2005) also showed that analysts made more
accurate forecasts when the firms were local to the analysts.
Loughran and Schultz (2005) found that urban firms, because of increased information
made available to the investor, tended to be more liquid. They also found that rural firms benefit
less from the above sources providing information to the investor and subsequently improving
their liquidity. This leads to the question: How does firm location affect corporate governance
and reporting? To address this question, two competing theories are presented: managerial
opportunism and efficient contracting theories.
3.1.1 Managerial Opportunism Theory
The managerial opportunism theory suggests that management will act in a way that
provides private benefits at the expense of the shareholders. Weak corporate governance and
poor disclosures will result if managers are behaving in this context. Recent work by Kedia and
Rajgopal (2011) (hereafter KR) supports the managerial opportunism theory. They determined
that firms located closer to Securities and Exchange Commission (SEC) offices are more likely
23
to face SEC investigations.4 Consequently, firms closer to SEC regional offices are less likely to
misreport, as shown by fewer accounting misstatements. KR concluded from their study: (1) the
increased ability of the SEC to monitor nearby firms reduced information asymmetry between
the SEC and those firms, (2) firms in close proximity to a SEC office, as a result, were less likely
to engage in misreporting behavior, (3) distant companies perceived less risk of SEC
enforcement, which led to more misreporting behavior among rural firms, and (4) SEC
regulation is more effective in urban areas. If opportunistic behavior among managers was
prevailing, rural firms were more likely to have poorer corporate governance and to provide
lower quality disclosures than urban firms.
3.1.2 Efficient Contracting Theory
Rural firms might respond to the adverse effects associated with their geographic location
by providing higher quality corporate governance and disclosures. The efficient contracting
theory holds that better governance and disclosures by a rural firm would mitigate the concerns
of urban investors that they are at a disadvantage compared to investors who are located near the
rural firm. If this is the case, investors in urban areas would be more willing to invest in stocks
of rural companies.
Furthermore, Healy and Palepu (2001) argued that better corporate disclosure would
increase analyst following and thereby increase urban institutional investors’ knowledge about
rural firms. This would reduce the amount of information asymmetry between the investor and
the rural firm, decreasing the firm’s cost of capital and increasing the market value of the firm
(Merton 1987; Verrecchia 2001). Hutton, Miller, and Skinner (2003) investigated corporate
4 This finding is consistent with the idea that the SEC strategically choses to locate its regional offices in urban areas with a larger number of firms.
24

disclosure by examining whether managers issue supplemental “soft talk” disclosures to their
firms’ management earnings forecasts as a mechanism to bolster the disclosure credibility.
Results suggest that good news earnings forecasts are informative to investors only when
supplemented by verifiable forward-looking statements. The value provided by additional
disclosure is supportive of the efficient contracting theory.
According to the efficient contracting theory, rural firms would provide high quality
corporate governance and disclosures in order to alleviate this information disadvantage to
investors. Whether the managerial opportunism theory or the efficient contracting theory, with
respect to firm location, is more dominant in these aspects of firm behavior in a U.S. capital
market setting remains an empirical question that this study addresses.
3.2 Market Reaction to SOX Legislative Events
This event study examines whether and how the stock market reacts to urban and rural
firms around selected legislative events related to SOX. A number of U.S. capital market studies
reported a negative market reaction to accounting regulatory events around the announcement of
policy setting announcements. After SFAS No. 8, which affects the process of foreign currency
translation, was put into effect, Ziebart and Kim (1987) examined the market reaction and found
a negative market price reaction to its issuance. Upon further investigation of the market effects
related to SFAS No. 8, Salatka (1989) provided evidence that both early and late adopters of
SFAS No. 8 experienced significantly negative abnormal returns during the Exposure Draft
release period.
Firms in the oil and gas industries are required to use either the full-cost or successful
efforts method of accounting, and companies may choose which accounting method to use.
However, in the late 1970s, the FASB proposed that all oil and gas firms move to the successful
25

efforts method. Many firms in the industry expressed concern that, if adopted, the move to the
successful efforts method would impose unnecessary costs on full-cost firms and impede the
ability to raise capital. Dyckman and Smith (1979) investigated the returns of both full-cost and
successful efforts firms around the dates of the FASB’s proposal. Evidence from their study
suggested that companies using the full-cost method experienced significantly negative abnormal
returns around the issuance of the proposal; however, companies using the successful efforts
method did not experience such negative returns. These results suggest that accounting
regulation imposes costs on firms which are most impacted by the regulation, and firms which
are not heavily affected from the regulation are not exposed to the same costs.
SOX not only imposes additional disclosure requirements, but also gives substantive
corporate governance mandates to firms publically traded in the U.S. (Romano 2004). The
objective of SOX implementation was to prevent deceptive accounting and management
behavior. Zhang (2007) examined 17 legislation events related to the passage of SOX and found
that U.S. firms experienced significantly negative abnormal returns around these event dates,
suggesting that the market, overall, perceives a net cost imposed on firms.
Presumably, the net cost companies would now incur, because of SOX, partially relates
to firms’ additional costs for improved corporate governance. If firms have strong governance
prior to SOX, the additional cost to such firms would be less than the cost to firms with weak
governance. The results from Dyckman and Smith (1979) suggest that firms that are greatly
impacted by regulation experience negative stock market reactions; whereas, firms that are not
impacted do not systematically have negative market reactions.
The theoretical basis for the first set of hypotheses in this dissertation is rooted in the
corporate governance of firms. As such, this study examines whether the market returns around
26

SOX events are related to factors which are indicative of a firm’s governance. Three factors,
which could be correlated with a firm’s corporate governance, are: (1) choice of auditor, (2)
readability of the MD&A report, and (3) leverage.
One action that a company might utilize to signal higher quality corporate governance to
investors is the selection of a Big 4 auditor. In a seminal paper related to audit quality,
DeAngelo (1981) argued and found that larger auditors provide a higher level of audit quality.
Because of reputational effects, a larger auditor has less incentive to cater to any one client (i.e.,
less economic dependence) and more incentive to provide higher quality audits to all client
firms. Following the DeAngelo study, use of a Big N auditor became a common measure for
audit quality (Craswell, Francis, and Taylor 1995; Reynolds and Francis 2000). Furthermore,
Titman and Trueman (1986) found that firms use a higher quality auditor to signal more
favorable information before an initial public offering.
If a rural firm is seeking additional ways of conveying high quality corporate governance
to the market, a case can be made that it might hire a Big 4 auditor to signal better quality
information. As such, this dissertation also examines whether a rural firm is more likely to use a
Big 4 auditor as a mechanism to reduce perceived agency conflicts.
The current study also examines whether rural firms comply with the SEC’s
recommended use of plain English disclosure guidelines as a mechanism to instill confidence in
their investors (see section 3.3 below for a more thorough discussion on readability). If a firm
seeks to increase its transparency and thereby improve its corporate governance, the firm should
not be as heavily affected by regulation requiring a higher level of governance. As such, this
study predicts that the negative market reactions to SOX regulation are partially mitigated by a
more transparent MD&A report.
27
In finance literature, leverage has been shown to be related to the risk appetite of
management. Graham, Harvey, and Puri (2013) found a negative correlation between CEO risk
aversion and leverage. Leverage also affects the types of employees a firm is able to attract.
Berk, Stanton, and Zechner (2010) found that low leverage firms were attractive to employees
with relatively high risk aversion; however, employees who were less risk averse tended to
migrate towards firms with high leverage. If the market perceives the risk appetite of
management as a factor correlated with corporate governance, leverage could partially explain
the market returns associated with SOX regulation.
The first hypothesis of this dissertation is:
H1a: Rural firms have corporate governance mechanisms that mitigate the negative stock market reactions around key SOX legislative events. A goal of the SOX regulation was to improve corporate governance of firms that are
publically traded in the U.S. Because SOX required a higher standard of corporate governance
after its passage, firms with weak corporate governance prior to SOX would be greatly affected,
and firms with better corporate governance prior to SOX would need less improvement to meet
the standards. This study also predicts that the stock market reaction to the 17 SOX events
identified by Zhang (2007) will be less negative for rural firms than for urban firms, indicating
that the market perceives rural firms as having stronger governance prior to SOX. The next
hypothesis related to SOX is:
H1b: The stock market reacts less negatively around SOX legislative events for rural firms relative to urban firms. However, the opposite prediction could be made as well. If rural firms are perceived as
having weaker governance prior to SOX due to a lack of managerial oversight, the stock market
will react more negatively to rural firms than to urban firms.
28

3.3 Readability Prediction Based on Firm Location
While prior studies have investigated geographic location from a quantitative perspective
(John, Knyazeva, and Knyazeva 2011), this study also qualitatively examines whether managers
of rural firms use reporting style to reduce information asymmetry and mitigate agency conflicts
that result from increased distance to investors. Two important aspects of corporate disclosure –
the readability and linguistic properties – have not been thoroughly investigated by researchers,
even though the SEC and investors pay close attention to these properties. For example, in
October 1998, the SEC issued new plain English guidelines that encouraged companies to use
plain English in the writing and formatting of new prospectuses when public offerings are made
by domestic and foreign issuers, and, more recently, the SEC has attempted to make the
disclosure of mutual funds easier to understand (Glassman 2005).
Within their annual reports to investors and Form 10-K, required by the SEC, companies
provide narrative, or qualitative, information to shareholders through the Management
Discussion and Analysis (MD&A). Users of a firm’s financial information value the qualitative
portion of financial reports as an important source of non-quantifiable information related to the
economic circumstances of the firm. In a study of capital market efficiency, Copeland (1978)
noted that qualitative disclosures were important to users because the most important type of
information was forward looking and that shareholders were thus interested in information which
could be presented in the president’s letter or MD&A.
If documents from companies are difficult to understand, this would potentially deter
investment and require higher costs of information processing for investors. If rural firms wish
to reduce this cost of information processing for investors and thereby mitigate some of the
information asymmetry resulting from geographic proximity to the investor, managers might
29
make a concerted effort to make their reports easier to understand. Accordingly, this study
expects that the MD&A section of the annual report of rural firms is easier to read and
understand than that of urban firms. The current study’s second hypothesis is stated as follows:
H2: The MD&A of rural firms is more readable relative to the MD&A of urban firms.
The second hypothesis is based on the assumption that managers make their documents
more understandable in order to communicate transparently to investors. In light of Section 2.4
regarding the SEC disclosure requirements for the MD&A and its importance to investors, it is
fair to say that managers have incentives to communicate information in a manner that is easy for
investors to understand. If rural firms are indeed seeking ways to mitigate perceived agency
conflicts as John et al. (2011) suggest, these companies will issue more readable qualitative
disclosures to investors relative to urban companies.
3.4 Linguistic Tone – How Geography Intervenes in Predicting Future Firm Performance
The second aspect of qualitative information this study examine in the MD&A is the
linguistic style or tone managers use in narrative disclosures. Both the literal meaning of the
report and the effect from the words and phrases used constitute a tone used in communication
(Henry 2008 and Chung and Pennebaker (2007) determined that both tone and emotion of words
people use in phrases and sentences are as important as the literal meaning of their words. (As
reviewed in Chapter 2, studies by Yuthas, Rogers, and Dillard (2002) and Henry (2008) were
among the first who focused on the tone of managers’ narrative disclosures.)
In the context of disclosures in the MD&A, an optimistic tone would suggest that
managers have a positive outlook as to the firm’s future performance; whereas, a pessimistic
tone would be indicative of a less than enthusiastic outlook as to the firm’s future performance.5
5 The Diction 7.0 software used in this study analyzes and provides scores for both optimistic and pessimistic tones in the text based on “financial positive” and “financial negative” dictionaries developed by Loughran and McDonald
30

As it relates to a firm’s geographic location, this study expects that the tone in a rural firm’s
MD&A will be better predictor of future firm performance than the tone in an urban firm’s
MD&A. Specifically, this study argues: (1) the optimistic tone in a rural firm’s MD&A is more
positively correlated with future firm performance than is the optimistic tone of an urban firm
and (2) a rural firm’s pessimistic tone is more closely related to poor performance than is an
urban firm’s pessimistic tone. Accordingly, the third hypothesis is:
H3: The tone in the MD&A of rural firms is a better predictor of future financial performance
relative to the tone in the MD&A of urban firms.
3.5 Research Methodology
This section describes the research methodology used in this study. First, the
methodologies that are used to examine and test each of the three hypotheses are presented.
Next, the data sources are discussed. Finally, the characteristics and criteria used for sample
selection in the study are described.
3.5.1 Methodology for H1a and H1b – Market Reaction to SOX Legislative Events
The first set of hypotheses examines whether market reactions to SOX legislative events
are associated with corporate governance and geographic firm location. To test these hypotheses
and extend previous research, 17 event dates identified by Zhang (2007) as important legislative
events leading to the passage of SOX (see Table A.1 for the list of the events) are tested. The
most crucial SOX legislative activities occurred in July 2002, and Zhang (2007) found these to
(2011). These word lists are widely accepted and used in accounting and finance literature. The scores are incorporated into equation 8 as part of the “optimistic” and “pessimistic” variables to predict future performance. If a firm’s optimistic score is higher than its pessimistic score, the future performance, according to the theory, is expected to be positive. Conversely, a pessimistic score that is higher than the optimistic score is consistent with expectations of poor future performance.
31

be associated with the most significant market reactions. The abnormal returns of rural and
urban firms for the events of day -1 to day +1 are measured using the events identified.
The market model maintains that stock returns are a linear function of a general market
factor. Sample firms’ expected returns are estimated through the market model using returns to
estimate firm i’s beta (βi) (Strong 1992):
Rit = αi + βiRmt + εit, (1)
where Rit is the firm’s daily return, and Rmt is the daily return of the Center for Research in
Security Prices (CRSP) equally weighted New York Stock Exchange (NYSE)/National
Association of Security Dealers Automated Quotations (NASDAQ)/American Exchange
(AMEX) index. (Estimates of αi and βi for each stock are found from historical data, using
ordinary least squares (OLS) regression.) Cumulative abnormal returns are calculated as
follows:
ˆ ˆ ˆ
Rit = αi + βi *Rmt (2)
ˆ ,R - R AR ititit = (3)
,AR CAR
t2t
t1titt2,t1i, ∑
=
=
= (4)
ˆ ˆ ˆ where αi
and βi are the market model estimates of αi and βi, respectively, Rit is the stock return
estimate for firm i on day t, ARit is the abnormal return for day t, and CARi,t,t2 is the cumulative
abnormal return from date t-1 to date t+1.
Hypothesis H1a tests whether rural firms use factors correlated with corporate
governance as mechanisms to improve market perceptions of the firms’ governance. If firms do
indeed use signals to convey high quality governance to investors, the market returns around
32

SOX legislative events will be less negative for firms with better corporate governance. The
following model is used to examine the cross-sectional differences in the stock price reactions
surrounding SOX legislative events:
ABSCARi,t,t2 = α + β1RURALi + β2AUDi + β3READi + β4LEVi + β5FSIZEi + β6PMi +
Β7AUD*RURALi + β8READ*RURALi + β9LEV*RURALi + εi, (5)
where:
ABSCARi,t,t2 = cumulative abnormal return in absolute values from day t-1 to day t+1.
RURALi = 1 if firm is rural and 0 if urban.
AUDi = 1 if firm uses Big 4 auditor and 0 otherwise.
READi = readability score of firm from Fog index.
LEVi = firm’s leverage for the sample year (total liabilities divided by book value equity).
FSIZEi = natural logarithm of total assets for sample year.
PMi = firm’s profit margin percentage for sample year (net operating income divided by revenue).
The model has a dummy variable indicating whether the firm is rural or urban (RURAL), the
three previously mentioned variables related to corporate governance (AUD, READ, and LEV),
interaction variables (AUD*RURAL, READ*RURAL, LEV*RURAL), and control variables
(FSIZE and PM). Interaction variables capture the incremental effect of corporate governance
mechanisms on rural firms relative to urban firms. Control variables are included because prior
literature suggests that these factors can be associated with the other variables. For example,
Titman and Wessels (1988) and Fama and French (2002) show a positive relation between firm
size and leverage, and Ou and Penman (1989) document that profit margin might could be
correlated with a firm’s returns and auditor selection.
33

Hypothesis H1b suggests that the market returns around key SOX legislative events will
be more negative for urban firms in comparison to rural firms. To test hypothesis H1b, this
research examines abnormal returns of rural firms around significant SOX legislative events
relative to returns of urban firms. A series of difference tests is performed, using t-statistics, to
determine whether cumulative abnormal returns between rural and urban firms are significantly
different around the 17 SOX event dates. Hypothesis H1b predicts that rural firms will
experience less negative market reactions around SOX legislative events. The t-statistic
indicates whether the returns for one location group are either more positive or negative than the
returns for the other location group in comparison; hence, this difference test shows empirically
whether the returns of rural firms are less impacted by SOX regulation relative to the returns of
urban firms.
3.5.2 Methodology for H2 – Readability Based on Firm Location
Hypothesis H2 suggests that the MD&A of rural firms is more readable than the MD&A
of urban firms. To test this hypothesis, the Fog index from the computational linguistics
literature is used. The Fog index, developed by Robert Gunning in 1952, is a widely accepted
and simple procedure for measuring readability and proposes that more syllables per word or
more words per sentence make a document more difficult to understand. The index measures
complexity and shows the numbers of years of formal education an average reader needs in order
to understand the text. The formula can be expressed mathematically as:
Fog = (average number of words per sentence + percent of complex words) * 0.4, (6)
where a complex word is defined as a word with three or more syllables. The Fog Index is
interpreted as follows: a Fog score > 18 indicates the text is unreadable; 14-18 is difficult to
understand; 12-14 is ideal; 10-12 is acceptable; and 8-10 is childish (Lehavy et al. 2011).
34

Evidence from Li (2008) suggests that firms are more likely to issue annual earnings
reports that are more difficult to read when earnings are lower, and the annual earnings reports
are easier to read whenever earnings are higher. This is consistent with the notion that managers
control the readability of narrative reports and strategically use words in their reports to
investors. If rural firms desire more transparent disclosures as a mechanism to instill investor
confidence, the MD&A reports provided by managers should be easier for the investor to
understand.
One important limitation related to the Fog index is that it only predicts the readability of
the MD&A and does not offer information related to information content. Gunning (1969) states
that “nonsense written simply is still nonsense.” Although this limitation exists, the Fog index,
using an objective and simple calculation, allows the study of large groups of companies and is
not limited by third party (e.g., analysts) surveys or opinions (Leheavy et al. 2011).
3.5.3 Methodology for H3 – Using Linguistic Tone to Predict Future Performance
Hypothesis H3 maintains that the tone in the MD&A of rural firms is a better predictor of
future financial performance than the tone in the MD&A of urban firms. As such, hypothesis H3
suggests that the level of optimism in a rural firm’s MD&A is more positively associated with its
future performance relative to the level of optimism in an urban firm’s MD&A. Conversely,
hypothesis H3 also suggests that the level of pessimism in a firm’s MD&A is more negatively
associated with its future firm performance in the rural firm sample than in the urban firm
sample. This study examines the linguistic tone of firms’ MD&A and estimated future
performance by measuring the ROA (return on assets) of the firm for the fiscal year following
35

the sample year as the dependent variable (FUTROA) for this hypothesis.6 The following
baseline model, used in a manner similar to Core, Holthausen, and Larker (1999) and Bowen,
Rajgopal, and Vankatachalam (2008), is estimated to explain future firm performance on the
basis of quantitative information provided by the annual report:
FUTROAi = β0 + β1ROAi + β2PMi + β3ATi + β4DAi + β5BMi + β6∆REVi
+ β7RURALi + εi, (7)
where:
ROAi = firm’s return on assets for sample year.
PMi = firm’s profit margin percentage for sample year (net operating income divided by revenue).
ATi = asset turnover for sample year (revenue dividend by end of year total assets).
DAi = ratio of liabilities to total assets for sample year (total liabilities divided by total assets).
BMi = ratio of book to market value of equity for sample year (book value divided by market value).
∆REVi = percent change in revenue from previous year to sample year.
RURALi = 1 if firm is rural and 0 if urban.
The purpose of the baseline equation is to capture the effect of quantitative information available
to investors in a firm’s annual report. Most of the variables used in this model are rooted from
seminal studies in quantitative fundamental analysis (Ou and Penman 1989; Penman 1992; and
Nissim and Penman 2001). The above independent variables in Equation 7 are included as
control variables in the next model where tonal index and interaction variables are added.
6 This earning based performance metric (FUTROA) measures the one year-ahead income scaled by total assets. Bowen, Rajgopal, and Vankatachalam (2008) suggest that this measurement is appropriate to compare future performance across firms while controlling for size.
36

The next model incorporates positive (OPT) and negative (PESS) tonal measures into
Equation 7 in order to test hypothesis H3. Equation 8 is expressed as:
FUTROAi = β0 + β1ROAi + β2PMi + β3ATi + β4DAi + β5BMi + β6∆REVi + β7RURALi +
β8OPTi + β9PESSi + β10OPTi *RURALi + β11PESSi*RURALi + εi, (8)
The consequence of Equation 8 is to regress future firm performance (FUTROA) on tone
measurements (OPT and PESS) for the sample of urban and rural firms. The interaction terms,
OPT*RURAL and PESS*RURAL, allow testing of the incremental effect of MD&A linguistic
tone on rural firms relative to urban firms. The null hypothesis of Equation 8 is that firm
geography has no effect on the tone’s predictive value for future firm performance or β10 = β11 =
0.
3.5.4 Data Sources
Data for this research is obtained from three different databases: Compustat, the Center
for Research in Security Prices (CRSP), and the Electronic Data-Gathering, Analysis, and
Retrieval system (EDGAR). Each data source is now be discussed separately.
3.5.4.1 Compustat
Standard and Poor’s Compustat is a database consisting of financial information on over
56,000 companies located throughout the world. Compustat provides company financial
information and market data for companies from 112 countries and covers approximately 98
percent of the world’s market capitalization. Annual financial data from Compustat began in
1950, and quarterly data became available through Compustat as early as 1962 (Compustat and
Plus Manual 1980).
The Compustat North American Database provides U.S. and Canadian accounting data
and is standardized according to financial statement presentation and data specific items,
37

allowing comparable data for firms and industries analyzed (Ali, Klasa, and Yeung 2009). The
Compustat North American Database is utilized in this study as a source of firm-specific
information to identify each firm’s geographic location and quantitative financial information.
3.5.4.2 Center for Research in Security Prices (CRSP)
The Center for Research in Security Prices (CRSP) at the University of Chicago provides
historical stock market data from U.S. capital markets. Specifically, CRSP has data for
individual New York Stock Exchange (NYSE), National Association of Security Dealers
Automated Quotations (NASDAQ), and American Exchange (AMEX) securities related to: price
and quote data, returns with and without dividends, market capitalization, number of shares
outstanding, trading volume, and other data. In addition to information related to individual
securities, CRSP also provides equal- and value-weighted market returns for NYSE, NASDAQ,
and AMEX market indices. CRSP has data to the present from the NYSE beginning on
December 31, 1925, from the AMEX beginning on July 2, 1962, and the NASDAQ beginning on
December 14, 1972.
3.5.4.3 Electronic Data-Gathering, Analysis, and Retrieval System (EDGAR)
The Electronic Data-Gathering, Analysis, and Retrieval system provides documents by
companies that are required to file forms with the SEC. Most SEC filings by public companies
are available on EDGAR. The SEC began phasing in the EDGAR filing system over a three-
year period, ending May 6, 1996. As of that date, public companies were required to submit
their filings through EDGAR, which is freely available to the public. Currently, more than 3,000
filings per day are submitted by companies electronically via EDGAR. This study utilizes
EDGAR to access the annual Form 10-K filing for each sample firm and to obtain the MD&A
data located with the 10-K filing. The sample selection is now described.
38

3.5.5 Sample Selection
SOX was enacted on July 30, 2002. To capture the impact relative to the events utilized
in this study, the firms included in the sample for this study include urban and rural firms that are
listed on the NYSE, NASDAQ, and AMEX at the beginning of 2002. Because this study
includes analysis of firms for the year following 2002, any company not in business for any
reason (merger, failure, etc.) at the end of 2003 is excluded from the sample.
To classify firms as urban or rural, this research follows a number of studies, including
Coval and Moskowitz (1999), Loughran and Shultz (2005), and Seasholes and Zhu (2010), and
uses a firm’s headquarters as a proxy for its location. Corporate headquarters serve as an
appropriate proxy because they are the center of business activities and information exchanges
between the company and its suppliers, service providers, and investors (Pirinsky and Wang
2006). The state of incorporation would not be a suitable choice as headquarter location in this
study because firms tend to choose the state of incorporation based on other factors such as
favorable tax and bankruptcy laws (Coval and Moskowitz 1999).
Following Loughran and Shultz (2005), a firm is classified as rural if its headquarters are
100 miles or more from the center of one of the 49 U.S. metropolitan areas of one million or
more people according to the 2000 census. Conversely, a firm is classified as urban if it is
headquartered in one of the ten largest metropolitan areas based on population size reported in
the 2000 U.S. census.7 This procedure leaves many firms unclassified as urban and rural, and
such firms are excluded from this study’s analyses. For example, firms headquartered within
100 miles of Louisville are dropped from the sample.
7 The ten largest consolidated metropolitan statistical areas according to the 2000 census include: New York City, Los Angeles, Chicago, Washington-Baltimore, San Francisco, Philadelphia, Boston, Detroit, Dallas-Fort Worth, and Houston.
39

The MD&A from the form 10-K of each firm in the sample for the fiscal year 2002 is
obtained for the qualitative analyses. The content from the MD&A is then examined to
determine readability and to count the positive and negative words used in the text which is
necessary to capture the tonal variables (OPT and PESS) for each firm. Previous qualitative
research studies (see Chapter 2) utilized sample sizes ranging from a low of forty (40) firms to as
many as 2,000 firms, while the average sample size in these studies is roughly 100 to 150 firms.
Using a random sampling procedure for urban and rural firms meeting the above criteria,
this process yielded a sample of 202 firms for the current study. This study requires firms to
have a share price greater than $1 at the end of fiscal year 2002 and is restricted to those firms
for which data from the following three sources are available: (1) Compustat (source of
accounting data), (2) CRSP (source for security price data), and (3) EDGAR (source of the
qualitative information). Subsequent to the identification of 202 firms used in the initial sample,
any firm missing data from one or more of the three sources is replaced by another firm meeting
the all data requirements.
40
CHAPTER 4
RESULTS AND INTERPRETATIONS
4.1 Chapter Overview
Chapter 4 presents the results and interpretations for the hypotheses tested. As previously
discussed, this study uses both quantitative and qualitative research methods to examine
corporate governance and reporting characteristics of rural and urban sample groups. First, the
data collection procedures are discussed. Second, results are reported from quantitative and
qualitative tests: quantitative examination of market reaction to SOX legislative events and
qualitative examinations, based on firm location, readability, and use of linguistic tone to predict
future performance. Each section of this chapter concludes with a brief discussion of the overall
observations from the tests performed.
4.2 Data Collection
Utilizing the methods discussed in Section 3.5.5, 202 firms (101 rural firms and 101
urban firms) are selected. Because this study examines two distinct geographic groups of
companies, a concern might arise that other factors correlated with the headquarters location
could affect the characteristics of accounting data. As a result, this study incorporates a sample
selection procedure that matches on industry and past sales growth. Following a matching
procedure utilized by Lang, Raedy, and Wilson (2006), rural and urban firms are matched (as
closely as possible) on industry (two-digit SIC code) and sales growth. Because the definition of
a rural firm is very restrictive (at least 100 miles from any metropolitan statistical area of at least
1 million people), the entire population of such firms available on Compustat was limited to 132
firms. Of these, only 101 rural firms had CRSP return data for the year 2002, and any firm
41

without data from both Compustat and CRSP was excluded from the sample. Thus, the rural
sample in the study represents the entire population of those firms that met the selection criteria.
After the sample of rural firms was identified, the above matching procedure (based on
industry and sales growth) was used to select the urban firm sample. Some rural firms, textile
mill products for example, did not have an exact industry match from the urban population, and
the next closest industry available from the urban group was selected. Once a large number of
industry-matched urban firms with Computstat and CRSP data was identified, the urban firms
closest to the rural firms in terms of sales growth over the previous two years were selected for
the urban sample group. Table A.2 shows the number of sample firms in total ranked by
quantity and then industry.
After the selection of the 202 sample firms, an electronic version of the MD&A for each
firm was obtained. To gather the MD&As, EDGAR was utilized. The annual 2002 10-K filing
was retrieved for each sample firm, and the MD&A section of the filing was extracted. In
summary, each sample firm has data available from Compustat (financial accounting data),
CRSP (stock price data), and EDGAR (electronic MD&A reports).
4.3 Tests of Hypotheses 1a and 1b – Market Reaction to SOX Legislative Events
The first set of hypotheses predicts that negative market reactions around SOX legislative
events are mitigated by rural firms use of corporate governance mechanisms (Hypothesis 1a) and
are more negative for urban firms relative to rural firms (Hypothesis 1b). Table A.3 shows that
the mean cumulative abnormal return (CAR) around 17 events is -2.46%, consistent with
Zhang’s (2007) findings that the market overall reacts negatively to SOX legislative events. To
test Hypothesis 1a, the market responses to factors associated with corporate governance
mechanisms are examined. CAR is, overall, negative for both rural and urban firms, and
42

Hypothesis H1a is designed to test whether governance mechanisms of rural firms mitigate the
magnitude of the impact of SOX events. Following Yan and Zhao (2011), absolute values of
CAR are used in Hypothesis H1a to determine whether other factors reduce the impact on
abnormal returns. In the regression model, the cumulative abnormal return in absolute values
(ABSCAR) is the dependent variable used to test the Hypothesis H1a (see equation 5, page 34).
CAR is the difference between the actual return and the expected return over the 17 SOX event
windows, and ABSCAR is the summation of the absolute values of these differences.
Table A.3 also contains descriptive statistics for the independent and control variables
included in Equation 5 for the entire sample (202 firms), the rural sample (101 firms), and the
urban sample (101 firms). Independent variables AUD, READ, and LEV are included to capture
corporate governance mechanisms.
A company might hire a Big 4 auditor to signal higher quality corporate governance to
investors. Prior research has found that larger auditors provide a higher level of audit quality
(DeAngelo 1981), and the use of a Big N auditor has become a common measure for audit
quality (Craswell, Francis, and Taylor 1995; Reynolds and Francis 2000). This study uses the
variable AUD to determine whether the use of a Big 4 auditor partially mitigates the negative
effects of SOX legislation. Interestingly, 91% of rural firms hire a Big 4 auditor in comparison
to 88% of urban firms in the sample. This evidence is consistent with the notion that remotely
located firms use a Big 4 auditor to signal higher audit quality to the market.
Independent variable READ shows whether complying with the SEC’s recommended use
of plain English disclosure guidelines instills investor confidence. If a firm seeks to increase its
transparency and thereby improve its corporate governance, the firm should not be as heavily
affected by regulation requiring a higher level of governance, and this study expects that the
43

negative market reactions to initial SOX legislation are partially mitigated by a more transparent
MD&A report. Finance literature has shown leverage to be related to the risk appetite of
management (Berk, Stanton, and Zechner 2010; Graham, Harvey, and Puri 2013). As such,
leverage (variable LEV) could partially explain the market returns associated with SOX
regulation.
Control variables are also included because prior literature suggests that additional
factors might be associated with the other variables. Firm size has been shown to be positively
related to leverage (Titman and Wessels 1988; Fama and French 2002), and profit margin could
be correlated with a firm’s returns and auditor selection (Ou and Penman 1989). Thus, variables
FSIZE and PM control for firm size and profit margin.
4.3.1 Analysis of Equation 5 – CAR Regressed on Corporate Governance Variables
Table A.4 presents the results of the regression analysis of Equation 5. The location
variable RURAL reports a coefficient of 0.1354 (tested further in Hypothesis H1b). The variable
RURAL is also interacted with the three governance variables in Equation 5 to allow incremental
testing of geography’s importance when incorporating corporate governance mechanisms.
Examination of the independent variables reveals that corporate governance factors are
indeed associated with returns around SOX events. Prior literature argues that firms that use a
Big 4 auditor are perceived as having better governance when compared to firms that use a non-
Big 4 auditor (see discussion in Section 3.2). Regression analysis of Equation 5 shows a
coefficient of 0.1089 for AUD, indicating a relationship between hiring a Big 4 auditor and stock
price performance around the legislative events. The interaction variable AUD*RURAL has a
statistically significant coefficient of 0.3468 and shows that hiring a Big 4 auditor is less
beneficial for a rural firm relative to an urban firm. However, as previously discussed, rural
44

firms are more likely to hire a Big 4 auditor, so it is possible that a lack of Big 4 hiring by urban
firms is what is really being captured. In other words, while both rural and urban groups benefit
by hiring a Big 4 auditor, the relative benefit is more pronounced for the urban group because
fewer urban firms in the sample are audited by Big 4 firms.
This study argues that companies comply with SEC plain English disclosure guidelines as
a mechanism to instill investor confidence in corporate governance. A lower numerical value on
the Fog Readability (READ variable) corresponds with reports that are easier to understand, and
the expectation is a negative relationship between variable READ and stock price performance (a
higher READ value denotes that the report is more difficult to read). The individual variable
READ estimated coefficient, 0.0706, is not statistically significant, indicating that report
readability is not a factor associated with an urban firm’s stock price performance. The
interaction variable READ*RURAL, however, is 0.8675 (significant at the 1% level) and shows
an increase in the magnitude of abnormal returns for rural firms when reports are more difficult
to read.
One explanation for this finding is that rural firms make the MD&A easier to read in
order to instill confidence in their investors, but urban firms do not benefit by this strategy. If
information for rural firms is more difficult for the investor to gather, it stands to reason a more
understandable report reduces the information asymmetry between the firm and investor and
thereby increases investor confidence. On the other hand, information on urban firms is more
easily accessible to the investor, and information asymmetry would not be greatly reduced by an
easily read report. Possibly, the urban firm has negative information in regard to the future that
can be concealed by a confusing report, and hiding this negative information from investors is
beneficial to urban firms in terms of stock price performance.
45

Variable LEV has a coefficient of 0.0008 (not significant), indicating that lower risk
appetite is not a factor for urban firms in investor confidence. The coefficient of interaction
variable LEV*RURAL, 0.0008, is not significant, making the effect of leverage on rural firms
neutral as well. When descriptive statistics from Table A.3 are examined, it is shown that the
mean LEV of rural and urban firms is 1.82 and 1.67, respectively. Although the leverage of rural
firms is higher than that of urban firms, this increased propensity to take on risk is not perceived
negatively by rural investors.
Finally, control variables FSIZE and PM are included because prior research shows that a
firm’s size and profit margin can be correlated with the other variables. The estimated
coefficients for FSIZE and PM are significant at the 1% and 10% levels, respectively, consistent
with evidence documented by Titman and Wessels (1988), Ou and Penman (1989), and Fama
and French (2002).
Overall, Hypothesis H1a was tested to examine the relation between governance
mechanisms and market reactions SOX. Results indicate that some relation exists and are
supportive of H1a.
4.3.2 CAR Differences between Rural and Urban Firm Groups
Hypothesis H1b examines the cumulative abnormal returns of rural firms around
significant SOX legislative events relative to urban firms. To test this hypothesis, 17 SOX
legislative event dates are examined (see section 3.5.1 and Table A.1 for further discussion on
the SOX events).
Table A.5, Panel A shows the CARs for rural and urban firm groups around each of the
17 events that occurred during 2002. The initial proposal of an accounting overhaul plan by SEC
Chairman Harvey Pitt on January 17 yielded a CAR of 0.04% and -0.68% for rural and urban
46
firm groups, respectively, and the call for changes in rules governing corporations by the
Treasury Secretary on February 2 resulted in a CAR of 0.60% and 0.41% for rural and urban
firm groups, respectively. Around both event dates, abnormal returns were greater for the rural
group than for the urban group. These two initial events in SOX legislation are both associated
with positive abnormal returns for rural firms, indicating that the first perception from investors
was that additional securities legislation would not negatively impact rural firms.
On February 13, the CAR for the urban group was positive (0.40%), while the rural group
experienced negative CAR (-0.48%) when Representative Michael G. Oxley (R-OH) introduced
an accounting reform bill. This bill, however, was very loose in its requirements, and it is likely
that urban investors were relieved at the unsubstantial impact of the proposed reform.
When legislation more restrictive than Oxley's original proposal was introduced by
House Democrats on February 28, the CAR was 1.66% greater for rural firms than for urban
firms. Also, the CAR was slightly less negative for rural firms (-0.16%) than for urban firms (-
0.19%) after President George W. Bush publically responded to accounting scandals on March 7.
Findings around these two events are important because they show that urban investors are more
adverse to tighter regulation than are rural firms. However, the CAR was -0.19% for rural firms
and -0.03% for urban firms when Alan Greenspan, Chairman of the Federal Reserve, warned of
too much government regulation on March 26; this suggests that the call for less regulation
would hurt rural firms more than urban firms. Collectively, all SOX events up to this point show
that urban firms are impacted more negatively by tighter regulations and more positively by
looser standards relative to rural firms.
Rural firms exhibited greater a CAR than urban firms on April 11 when Oxley's bill was
initially scheduled to be voted on by House Financial Services Committee, and the rural CAR
47

was more negative than the urban CAR when the Committee finally passed the bill on April 16.
When the House passed Oxley’s bill on April 24, the CAR was 0.74% and 0.31% for rural and
urban firms, respectively. Senator Paul Sarbanes (D-MD) introduced a more stringent
accounting reform to the Senate Banking Committee bill on May 8, resulting in a CAR of -
0.42% and -0.07% for rural and urban firms, respectively, around the event.
The SEC proposal requiring executives to certify financial statements on June 11, 2002
ultimately resulted in the passage of Sections 302 and 906 of SOX and represents one of the
more significant components in the SOX regulation. This proposal resulted in a CAR of 2.14%
greater for rural firms (0.81%) than for urban firms (-1.33%), and this difference is statistically
significant at the 1% level. After the aforementioned accounting scandals in 2001 and early
2002, the firm chief executives claimed ignorance as to any knowledge of fraudulent financial
reporting, and this part of SOX made executives liable for any misrepresentation of financial
information. The fact that urban firms experienced significantly negative market reactions to this
requirement strongly suggests that urban firms were perceived to have weaker governance at the
top of the organization when compared to rural firms.
When the Senate Banking Committee passed Sarbanes’ bill on June 18, 2002 both firm
groups exhibited a positive CAR (0.22% for rural firms and 0.24% for urban firms); however,
both firm groups experienced a negative market reaction around the exposure of the WorldCom
scandal on June 25, 2002 (-0.20% rural CAR and -0.23% urban CAR).
The most critical legislative activities related to the passage of SOX occurred in July
2002 (Zhang 2007). The Senate seriously debated Sarbanes’s bill on July 8, and President
George W. Bush subsequently delivered a speech on corporate reforms on July 9, 2002. Rural
firms experienced less negative CAR than did urban firms around this event window (-0.24%
48

rural vs -1.12% urban). Sarbanes’ bill passed in the Senate on July 15, 2002, resulting in a CAR
of -1.74% and -0.71% for rural and urban firms, respectively.
On July 19, the U.S. House and the U.S. Senate engaged in final negotiations to
consolidate the two bills. With negotiations continuing, President George W. Bush made a radio
address on July 20, urging Congress to pass a final bill before the fall recess (Melloan 2002).
This event is significant because, at this point, the market became reasonably certain that
securities legislation was imminent. Around this important event window, rural firms
experienced a positive CAR of 0.17%, while urban firms experienced a negative CAR of -
3.26%; this 3.42% difference is significant at the 1% level. While rural firms experienced
positive returns with tightened regulation on the horizon, urban firms’ returns were extremely
negative; such a reaction is indicative of weak investor confidence in urban firms’ ability to
handle increased regulation in a cost efficient manner. The final event is the passage of SOX by
Congress on July 25, 2002 around which rural firms experienced a -0.68% CAR compared to a -
1.01% CAR experienced by urban firms. Results around this event further support the idea that
urban firms are more negatively impacted by increased regulation than are rural firms.
The results around the 17 individual SOX event dates are consistent with rural firms
being less negatively impacted by SOX than are urban firms. For 11 out the 17 events related to
the passage of SOX, rural firms’ abnormal returns were greater than those of urban firms. Also,
three out of the four July 2002 events, considered the most important to SOX passage, resulted in
less negative returns for the rural group than for the urban group.
Next, Table A.5, Panel B presents the CARs cumulated over all SOX events and provides
results from a t-test of the difference between rural and urban firm groups. The summation of
abnormal returns over all 17 events results in -0.66% CAR for rural firms and in -4.26% CAR
49

for urban firms, and this 3.60% difference is statistically significant (p-value = 0.0515).
Therefore, Hypothesis H1b is supported.
Overall, both hypotheses (H1a and H1b) were tested around SOX legislative events.
Hypothesis H1a reports the results of the three corporate governance variables (AUD, READ,
and LEV) and their interactions with the RURAL location variable. The interaction variable
AUD*RURAL shows that hiring a Big 4 auditor is less beneficial for a rural firm relative to an
urban firm. Rural firms, however, have an increased propensity to hire a Big 4 auditor, so the
incremental benefit to the urban group is more substantial because fewer urban firms in the
sample are audited by a Big 4.
Rural firms’ returns are better when the reports are easier to read; however, the
readability of the report is not associated with the stock returns of urban firms. This finding is
consistent with the notion that rural firms benefit through efficient contracting by making the
MD&A easier read, but urban firms do not experience the same benefit. Finally, the finding that
investors do not react to leverage shows the increased propensity of rural firms to take on risk
(e.g., higher leverage) is not perceived negatively by investors. Results from Hypothesis H1a
provides evidence that rural firms experience better returns around the SOX legislative events
relative to urban firms due to stronger corporate governance mechanisms.
Results from Hypothesis H1b collectively show that urban, compared to rural, firms are
impacted more negatively by tighter regulations and more positively by weaker standards. Urban
firms consistently experienced more negative abnormal returns around individual SOX events,
and this evidence indicates that investors lack confidence in an urban firm’s capability of
managing increased government regulation. Furthermore, cumulative abnormal returns over all
17 events resulted a statistically significant 3.60% difference between rural and urban firms.
50

Hypothesis H1b is supported and is consistent with the notion that rural firms had stronger
governance prior to SOX and are consequently less affected by the passage of SOX.
4.4 Test of Hypothesis 2 – Readability Based on Firm Location
This study’s test of readability is one of the qualitative tests that provides insight as to
whether managers use reporting style to reduce information asymmetry and mitigate agency
conflicts that result from increased distance to investors. In 1998, the SEC issued plain English
guidelines that encouraged firms to provide reports that are easier to understand (see Section
3.3). The MD&A portion of the annual 10-K report provides a narrative discussion about the
company’s operations and future outlook.
To test readability, or the ease with which a document can be understood, the Fog index
is used. The Fog index takes into account the average number of words in a sentence and
percentage of complex words in the document in order to provide a composite readability score
(see Section 3.5.3 for a more thorough discussion). Table A.6 presents the Fog score for rural
and urban firms. The 101 rural firms in the sample have MD&A with an average Fog score of
15.21, while the 101 urban firms’ MD&A average a Fog score of 15.34.
Rural firms’ MD&A are slightly easier to read than those of urban firms. However, a t-
test for a difference between the two groups shows that the difference is not statistically
significant (p-value = 0.2377), and, thus, this test fails to reject the null hypothesis that reports
from rural and urban firms are equally difficult to read.
4.5 Tests of Hypothesis 3 – Using Linguistic Tone to Predict Future Performance
The third hypothesis predicts that the tone in the MD&A of rural firms is a better
predictor of future financial performance than is the tone in the MD&A of urban firms.
Specifically, Hypothesis 3 suggests that the optimistic tone in a rural firm’s MD&A is more
51

positively correlated with future firm performance than the optimistic tone of an urban firm.
Additionally, it infers that a rural firm’s pessimistic tone is more closely related to poor
performance than is an urban firm’s pessimistic tone.
To test this hypothesis, levels of optimism and pessimism in the MD&A are examined to
ascertain whether they are linked with the firm’s future performance. A numerical measurement
for optimistic and pessimistic tone in the MD&A is provided by Diction 7.0 textual analysis
software. The use of word lists developed by Loughran and McDonald (2011) for the incidence
of “financial optimistic” and “financial pessimistic” words as a tonal measure provides
consistency with other accounting studies (Li 2010; Cheng, Green, and Ko 2015).
Table A.7 provides the descriptive statistics for the variables used in the regression model
to analyze Hypothesis 3. All of the variables in Table A.7 other than OPT and PESS are
included in the baseline equation (Equation 7), which serves the purpose of controlling for the
use of quantitative information to predict future performance (Core et al. 1999; Bowen et al.
2008). FUTROA (future return on assets) is the ROA (return on assets) of the firm for calendar
year 2003 (one year after the sample year 2002) and is the dependent variable for the model. In
an effort to control for quantitative information available to investors in the annual report, ROA,
PM (profit margin), and AT (asset turnover) are included as control variables. The mean ROA
for sample firms is -5.69%, with a minimum of -3.41 and a maximum of 45.21%. PM is sample
firm profit margin percentage for the sample year 2002 and is computed by dividing operating
income by total revenue. The mean profit margin percentage is -22.19%. AT measures the
efficiency with which assets are utilized and is computed by dividing revenue by total firm assets
for the sample year 2002. The mean asset turnover is 0.9619.
52

Variables DA and BM are included to control for fundamental, non-financial information
about the firm. The ratio of assets to liabilities, variable DA, is a measure of firm risk and is
used to control for the risk effect on future firm performance. BM, the ratio of book value to
market value, provides underlying information about valuation. The mean DA ratio is 0.5132,
and the mean BM ratio is 0.7998. Finally, the control variable ΔREV shows the change in
revenue between the sample year 2002 and the previous year. The mean ΔREV is 13.67%.
Through the use of a baseline model, the amount of incremental information provided by the
addition, in Equation 8, of tonal and geographic location variables can be determined (see
Section 3.5.3).
The above control variables represented in Equation 7 are rooted in fundamental analysis
literature. A number of studies have demonstrated the validity of these measures as sources of
information derived from quantitative information found in a firm’s annual report (Ou and
Penman 1991; Penman 1992; Nissam and Penman 2001). Furthermore, Davis et al. (2007),
Henry (2008), and Elrod (2010) have included these same control variables in studies involving
qualitative research of financial statements.
The purpose of Hypothesis 3 is to determine whether an association exists between future
firm performance and the positive/negative tone of rural/urban firms’ MD&A. If regression
analysis of Equation 8 results in coefficients in the expected direction for the tonal and
geographic interaction variables, OPT*RURAL and PESS*RURAL, the prediction of
Hypothesis 3 would be supported.
The results of the regression analyses from Equation 7 (baseline equation) and Equation 8
are shown in Table A.8. Most of the Benchmark variables, with the exception of RURAL,
provide coefficient estimates in the same directions for both equations. The coefficients of ROA
53

are -0.0670 and -0.0196 in Equations 7 and 8, respectively; PM has coefficients of 0.1492 and
0.1450; and the coefficients of AT are -0.1329 and -0.1329. DA coefficients, -1.4274 and -
1.4328, and BM coefficients, 0.3116 and 0.3231, are significant at the 1% level in both
equations. The coefficients of ΔREV are 0.0095 and 0.0067 in Equations 7 and 8, respectively.
These findings in regard to control variables are consistent with prior literature.
Panels B and C of Table A.7 show the descriptive statistics for rural and urban firms,
respectively. The mean OPT and PESS scores of rural firms are 0.0096 and 0.0200, respectively,
and urban firms report mean OPT and PESS scores of 0.0092 and 0.0185, respectively. Because
rural firms have a higher incidence of positive and negative words in the MD&A, it is likely
these firms communicate to the investor through the use of tone in the report. The coefficient of
the RURAL variable changes its sign from negative (-0.0867) in Equation 7 to positive (0.0352)
in Equation 8, showing that rural firms communicate through the use of tone in the MD&A to
some extent.
When the individual tonal variables, OPT and PESS, measure the association between the
tone of an urban firm’s report and future performance, both OPT and PESS are positively
associated with future firm performance. While the coefficient of OPT is only 1.8303, the
coefficient of PESS is 9.4501, indicating that urban firms are not likely to communicate poor
future performance through the use of negative words in the MD&A. In other words, a
pessimistic tone in an urban MD&A is much more associated with good future performance than
is an optimistic tone.
Interaction variables, OPT*RURAL and PESS*RURAL, measure whether the tone of a
rural MD&A is a better predictor future of performance relative to the tone of an urban MD&A.
The positive tone interaction variable OPT*RURAL reports a small negative coefficient of -
54

0.1833 and indicates that rural firms use an optimistic tone slightly less than urban firms to
communicate positive future performance. However, variable PESS*RURAL has a very
negative coefficient of -8.774. This finding is important because it shows that rural firms are
much more likely to communicate poor performance through the use of negative tone in the
MD&A relative to urban firms. Also, it provides an explanation for the change in the coefficient
in variable RURAL from negative (-0.0867) in Equation 7 to positive (0.0352) in Equation 8.
Results from Equation 8 show that a rural location is indicative of negative future performance
only if the tone in the MD&A is pessimistic. That is, a rural firm location is associated with
positive future performance when its reports are not written with an overall pessimistic tone.
Interaction variable PESS*RURAL is statistically significant and shows moderate
support for the idea that managers of rural and urban firms use linguistic tone in the MD&A
differently to communicate information to investors. Findings provide evidence that rural firms
use a pessimistic tone to communicate poor future performance while urban firms do not.
55

CHAPTER 5
SUMMARY, CONTRIBUTIONS, AND LIMITATIONS
Chapter 5 presents the summary, contributions, and limitations of this dissertation. Based
upon the results and interpretations, suggestions for future research are also presented.
5.1 Summary Findings
The purpose of this dissertation was to determine whether a firm’s disclosures practices
and corporate governance are influenced by the location of the firm’s headquarters. SOX was
instituted to improve corporate governance and is arguably the most extensive securities
regulatory policy since the original Securities Act of 1933 and Securities Exchange Act of 1934.
Zhang (2007) found that the stock market perceived SOX legislation as an overall cost to firms
publically traded in the U.S., suggesting a lack of confidence in corporate governance prior to
SOX. SOX required a higher standard of corporate governance and associated compliance costs.
Theoretically, firms with weak corporate governance prior to SOX should be greatly affected,
and firms with better corporate governance prior to SOX should need less improvement to meet
the new standards. To assess whether the market returns are related to factors which are
indicative of a firm’s governance, this study examined the relationship between CARs around
SOX legislative events and three governance variables: choice of auditor, readability of the
MD&A report, and leverage. This dissertation also investigated how investors of urban and rural
companies reacted differentially to SOX legislation and provides insights on corporate
governance for both groups of firms.
The first set of hypotheses (H1a and H1b) examines whether negative investor reactions
to SOX legislation are partially mitigated with strong corporate governance and whether
abnormal returns around SOX events were less negative for rural firms when compared to urban
56

firms. Hypothesis H1a examined the relationship between governance mechanisms and market
reactions to SOX. Because rural firms are more likely to hire a Big 4 auditor than are urban
firms, the relative benefit of hiring a Big 4 auditor is more pronounced for the urban group.
Rural firms experience less negative CAR if the MD&A is more understandable, and this
evidence is supportive of the efficient contracting theory. According to the efficient contracting
theory, a more understandable report reduces the information asymmetry between the rural firm
and investor and thereby increases investor confidence.
Hypothesis H1b examined CARs for both rural and urban firm groups around 17 SOX
legislative events. The results around individual SOX event dates are consistent with rural firms
being less negatively impacted by SOX than are urban firms. For 11 out the 17 events related to
the passage of SOX, rural firms experienced more positive/less negative abnormal returns than
urban firms, and this demonstrates that investors lack confidence in an urban firm’s capability of
managing increased government regulation. Also, three out of the four July 2002 events,
considered the most important to SOX passage, resulted in better returns for the rural group
when compared the urban group. The cumulative total of all 17 events shows that rural firms
experienced a CAR of -0.66% around SOX events compared to a CAR of -4.26% for urban
firms, indicating that urban firms were approximately six times more impacted by initial SOX
legislation than were rural firms.
Overall, both quantitative hypotheses were tested around SOX legislative events.
Hypothesis H1a reports statistically significant associations between corporate governance
mechanisms of rural firms and CAR. Findings from Hypothesis H1b suggest that CARs are
significantly less negative for rural firms than for urban firms, consistent with the idea that rural
firms had stronger governance prior to SOX and were subsequently less affected by initial SOX
57

legislation. Furthermore, CARs of rural firms are significantly less negative at the 1% level
around the SEC proposal requiring executives to certify financial statements on June 11, 2002
and around final negations on July 19, 2002 that indicated imminent SOX passage. Urban firms
experienced significant negative market reactions to these events, strongly suggesting that urban
firms were perceived to have weaker governance at the top of the organization and that urban
firms were not prepared to comply with SOX in a cost efficient manner when compared to rural
firms.
Another unique aspect of this dissertation is its qualitative analyses. Few studies in
accounting literature have examined the narrative content of corporate disclosures (Frazier 1981;
Schroeder and Gibson 1990; Cho et al. 2010), even though the SEC and investors consider them
important (SEC 1998). This study provides evidence that managers use narrative discloses as a
mechanism to reduce information asymmetry associated with distant firm locations. The
readability and linguistics properties of the MD&A are analyzed. The readability is the ease with
which text can be understood, and the Fog index is used to test readability. The Fog index
provides a composite readability score equivalent to the education level needed to understand the
document. The readability of the MD&A section of the 10-K report for rural and urban firms
was examined. Rural firms have an MD&A with an average Fog score of 15.23, while urban
firms have a Fog score of 15.31. The difference in readability between the two groups, however,
is not statistically significant and fails to reject the null hypothesis that reports from rural and
urban firms are equally difficult to read.
To examine linguistic properties of the MD&A, levels of optimism and pessimism in the
report were examined to determine whether they were linked with a firm’s future performance in
Hypothesis H3. Diction 7.0 textual analysis software used word dictionaries developed by
58

Loughran and McDonald (2011) to give a numerical measurement for optimistic and pessimistic
tone in the MD&A. This study investigated whether an association existed between future firm
performance and the positive/negative tone of rural/urban firm’s MD&A. Findings suggest that
the tone of the report is not significant in predicting future performance of urban firms.
However, the tone of a rural firm’s MD&A is a better predictor of future performance
relative to the tone of an urban firm’s MD&A. The interaction variable PESS*RURAL has a
significantly negative coefficient of -8.774, suggesting that rural firms are much more likely to
communicate poor performance through the use of negative tone in the MD&A relative to urban
firms. Results show support for the idea that managers of rural and urban firms use linguistic
tone in the MD&A differently to communicate information to investors.
Overall, the evidence presented in Chapter 4 provides moderate support that rural and
urban firms communicate narrative information in the MD&A differently. Although the overall
readability of the report was not statistically different between rural and urban firms, rural firms
experienced better stock price returns around SOX events when their reports were easier to read,
and urban firms do not experience the same benefit. Also, the linguistic style analysis provided
an expected difference between reporting styles that rural firms use pessimistic tone to
communicate poor future performance while urban firms do not.
5.2 Contributions
This study on firm geographic location offers many contributions to accounting literature.
First, it provides evidence as to the impact of firm location on corporate governance and
disclosure. Also, a distinguishing characteristic of this study is the use of a dual approach to
investigate this accounting issue. Only a few studies have examined how firm location affects
59

corporate reporting and governance, and they only considered quantitative information to
examine firm behavior (John et al. 2011).
By utilizing both quantitative and qualitative research methods, this dissertation provides
additional insights on the subject than a study using a single research methodology. Broadly
speaking, this research supports the idea that the market perceives rural firms as less negatively
impacted by the new corporate governance regulations mandated by SOX relative to urban firms,
and managers of rural firms are more likely to communicate poor future performance through the
use of tone than are urban managers. Implications are that investors in rural firms do not have to
be concerned about being misled by the tone of the report or the obscuration of information in
the MD&A.
5.3 Limitations and Future Research
As with any research study, the results from this dissertation are subject to limitations.
First, not all the negative CARs documented by Zhang (2007) can be directly attributed to SOX
and, thus, might not be indicative of a firm’s corporate governance quality. However, it is likely
that most of the documented negative CARs around the identified legislative events reflect the
impact of SOX. It is also possible that other regulatory events could affect rural and urban firms
differently than SOX did; however, SOX is claimed by many to be the most far-reaching
securities regulatory act in the U.S. since the Securities Act of 1933 and Securities Exchange Act
of 1934 and, thus, it was appropriate to investigate in this study. Future research might examine
other regulatory events and their impact on rural and urban firms.
Additionally, differences in narrative components of the disclosure could be firm specific
and not indicative of overall disclosure quality. This study captured only the readability and not
the overall quality of the report to investors. For example, a firm could, without the intent of
60

obscuring information from investors, produce an MD&A that is difficult to read because of the
complex nature of the firm’s business. This report could be higher quality and more informative
to investors than a report from a firm with more simple business practices (although the latter
report would certainly be easier to read). Further, this study focused only on qualitative
information found in the MD&A. Additional research could examine whether or not other
narrative reports, such as the president’s letter or earnings announcements, from rural and urban
companies are communicated differently than the MD&A.
Finally, the definitions for “urban firm” and “rural firm” may also not be clearly defined
and thus, generalizability to firms is limited based upon the definitions in this study. A very
challenging aspect of the study was compiling a sample that met the stringent geographic
location and data availability requirements. The entire database held only 101 firms that met the
strict definition of “rural,” making data collection a difficult task. Future research could explore
a wider variety of geographic variables and thereby increase generalizability of this area of
research. A change in the definition of metropolitan areas could also increase the rural sample
and thereby produce different results.
61

APPENDIX
EVENTS LEADING TO THE PASSAGE OF SOX
62

Although the collapse of Enron occurred in 2001, the first signal of a securities regulation
overhaul did not occur until January 16, 2002 when then SEC Chairman Harvey Pitt broadcasted
a plan to adopt a reform in regulatory organization (Day and Crenshaw 2002). From February to
May 2002, Congress slowly moved on legislated activities with several proposals toward
accounting reforms, and the George W. Bush Administration made public its response to the
major scandals (Zhang 2007). On February 14, Republican Representative Oxley introduced his
reform bill to the U.S. House of Representatives. His reform bill was, however, considered
business-friendly by the media, and Democratic senators, in the meantime, drafted bills that went
beyond Oxley’s original proposal (Schroeder 2002). Democratic Senator Sarbanes managed to
pass a tough reform bill in the Senate Banking Committee on June 18, 2002, but the media did
not expect the bill to become law until a much later time (Hilzenrath, Weisman, and VandeHei
2002). Shortly thereafter in late June, the WorldCom scandal became exposed, which increased
the speed of securities reform action in the United States. Serious discussion of Senator
Sarbanes’ bill occurred on July 8; President Bush delivered a speech on accounting reform on
July 9 (Cummings 2002); and the bill was passed in the U.S. Senate on July 15, 2002 with a vote
of 97 to 0 (Hilzenrath et al. 2002).
U.S. Republican House leaders, however, purportedly sought to weaken the tough reform
bill after its passage in the U.S. Senate (VandeHei 2002); however, they soon abandoned that
strategy and recommended only minor changes to complete the legislation (Murray 2002). A
series of events from July 19 to 30, 2002 culminated in the passage of SOX. On July 19, the
U.S. House and the Senate engaged in final negotiations to merge the bills. With negotiation
continuing, President George W. Bush made a radio address on July 20, urging Congress to pass
a final bill before the fall recess (Melloan 2002). The final rule was agreed upon by the House
63

and Senate on July 24, passed by Congress on July 25, and signed into law by President George
W. Bush on July 30, 2002 (Hitt 2002).
64

Table A.1 Key Legislative Events Leading to the Passage of Sox
Event Number Date Description of Event
1 January 17, 2002 Initial proposal of accounting overhaul plan by SEC Chairman. 2 February 2, 2002 Call for changes in rules governing corporations by Treasury Secretary. 3 February 13, 2002 Accounting reform bill introduced by Oxley. 4 February 28, 2002 Legislation more restrictive than Oxley's proposal introduced by House Democrats. 5 March 7, 2002 First public response to accounting scandals by President George W. Bush. 6 March 26, 2002 Alan Greenspan warns against too much government regulation.
7 April 11, 2002 Oxley's bill was scheduled to be voted on by House Financial Services Committee; however, the vote was postponed.
8 April 16, 2002 Committee passed Oxley's bill. 9 April 24, 2002 House passed Oxley's bill. 10 May 8, 2002 Accounting reform bill introduced by Sarbanes to Senate Banking Committee. 11 June 11, 2002 SEC proposed regulation requiring executives to certify financial statements. 12 June 18, 2002 Senate banking committee passed Sarbanes' bill. 13 June 25, 2002 WorldCom scandal exposed. 14 July 8, 2002 Senate debates Sarbanes' bill and President George W. Bush delivers speech on corporate reforms. 15 July 15, 2002 Senate passed Sarbanes' bill. 16 July 18, 2002 House negotiation over Sarbanes’ bill begins. 17 July 24, 2002 House and Senate agree on the final rule and pass SOX.
65

Table A.2 Number of Sample Firms by Industry Group
SIC code Industry Group Number of Firms 73 Business Services 31 13 Oil and Gas Extraction 27 49 Electric, Gas & Sanitary Services 18 28 Chemicals and Allied Products 14 35 Industrial Machinery & Equipment 13 42 Trucking and Warehousing 9 48 Communications 9 36 Electronic & Other Electric Equipment 7 56 Apparel And Accessory Stores 8 38 Instruments & Related Products 6 10 Metal Mining 5 24 Lumber and Wood Products 5 37 Transportation Equipment 5 45 Transportation By Air 5 51 Wholesale Trade-Nondurable Goods 5 20 Food and Kindred Products 4 27 Printing and Publishing 4 55 Automotive Dealers & Service Stations 3 70 Hotels And Other Lodging Places 3 79 Amusement And Recreation Services 3 29 Petroleum and Coal Products 2 34 Fabricated Metal Products 2 39 Misc. Manufacturing Industries 2 40 Railroad Transportation 2 44 Water Transportation 2 53 General Merchandise Stores 2 78 Motion Pictures 2 22 Textile Mill Products 1 30 Rubber & Misc. Plastics Products 1 52 Building Materials & Garden Supplies 1 57 Furniture And Homefurnishings Stores 1
Total Sample Firms 202
66
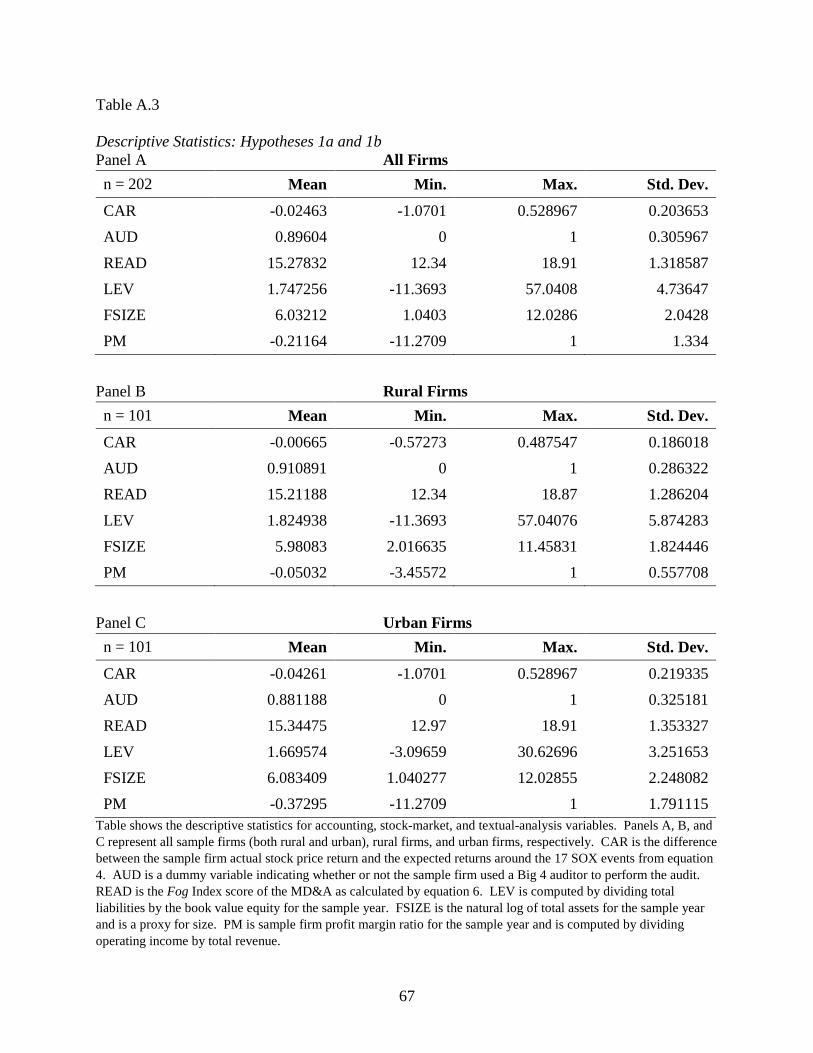
Table A.3 Descriptive Statistics: Hypotheses 1a and 1b Panel A All Firms n = 202 Mean Min. Max. Std. Dev.
CAR -0.02463 -1.0701 0.528967 0.203653 AUD 0.89604 0 1 0.305967 READ 15.27832 12.34 18.91 1.318587 LEV 1.747256 -11.3693 57.0408 4.73647 FSIZE 6.03212 1.0403 12.0286 2.0428 PM -0.21164 -11.2709 1 1.334
Panel B Rural Firms
n = 101 Mean Min. Max. Std. Dev.
CAR -0.00665 -0.57273 0.487547 0.186018 AUD 0.910891 0 1 0.286322 READ 15.21188 12.34 18.87 1.286204 LEV 1.824938 -11.3693 57.04076 5.874283 FSIZE 5.98083 2.016635 11.45831 1.824446 PM -0.05032 -3.45572 1 0.557708
Panel C Urban Firms
n = 101 Mean Min. Max. Std. Dev.
CAR -0.04261 -1.0701 0.528967 0.219335 AUD 0.881188 0 1 0.325181 READ 15.34475 12.97 18.91 1.353327 LEV 1.669574 -3.09659 30.62696 3.251653 FSIZE 6.083409 1.040277 12.02855 2.248082 PM -0.37295 -11.2709 1 1.791115
Table shows the descriptive statistics for accounting, stock-market, and textual-analysis variables. Panels A, B, and C represent all sample firms (both rural and urban), rural firms, and urban firms, respectively. CAR is the difference between the sample firm actual stock price return and the expected returns around the 17 SOX events from equation 4. AUD is a dummy variable indicating whether or not the sample firm used a Big 4 auditor to perform the audit. READ is the Fog Index score of the MD&A as calculated by equation 6. LEV is computed by dividing total liabilities by the book value equity for the sample year. FSIZE is the natural log of total assets for the sample year and is a proxy for size. PM is sample firm profit margin ratio for the sample year and is computed by dividing operating income by total revenue.
67

Table A.4 Tests of Market Response to Corporate Governance Factors around Sox Events;Hypothesis 1a
ABSCARi = α + β1RURALi + β2AUDi + β3READi + β4LEVi + β5FSIZEi + β6PMi +
β7AUD*RURALi + β8READ*RURALi + β9LEV*RURALi
Variable Equation 5 Intercept 0.3258***
(2.70) RURAL 0.1354
(1.12) AUD 0.1089
(0.90) READ 0.0706
(0.58) LEV 0.0008
(0.01) FSIZE 0.9594***
(7.95) PM 0.4420*
(3.66) AUD*RURAL 0.3468*
(2.87) READ*RURAL 0.8675***
(7.19) LEV*RURAL 0.0008
(0.01) R2 0.1133
The above table shows the results of the hypothesis test to determine whether the market responds to corporate governance characteristics around the 17 SOX legislative events. ABSCAR is absolute value of the differences between the sample firm actual stock price return and the expected return around all 17 SOX events. AUD is a dummy variable indicating whether or not the sample firm used a Big 4 auditor to perform the audit. READ is the Fog Index score of the MD&A. LEV is computed by dividing total liabilities by the book value equity for the sample year. FSIZE is the natural log of total assets for the sample year and is a proxy for size. PM is sample firm profit margin ratio for the sample year and is computed by dividing operating income by total revenue. F values are presented in parenthesis. */**/*** represent statistical significance at the 10%, 5%, and 1% levels, respectively.
68

Table A.5 Abnormal Returns around Legislative Events Leading to the Passage of Sox;Hypothesis 1b Panel A: Cumulative Abnormal Returns (CARs) around Individual SOX Events for Rural and Urban Firms
Event Number Date Description of Event Event
Window CAR Rural CAR Urban CAR Rural – CAR Urban
Rural Returns Greater than Urban
1 January 17, 2002 Initial proposal of accounting overhaul plan by SEC Chairman. January 16-18 0.0004 -0.0068 0.0072* Yes
2 February 2, 2002 Call for changes in rules governing corporations by Treasury Secretary. February 1-4 0.006 0.0041 0.0019 Yes
3 February 13, 2002 Accounting reform bill introduced by Oxley. February 12-14 -0.0048 0.004 -0.0088 No
4 February 28, 2002 Legislation more restrictive than Oxley’s proposal introduced by House Democrats. February 27-
March 1 0.0193 0.0027 0.0166 Yes
5 March 7, 2002 First public response to accounting scandals by Bush. March 6-8 -0.0016 -0.0019 0.0003 Yes
6 March 26, 2002 Alan Greenspan warns against too much government regulation. March 25-27 -0.0019 -0.0003 -0.0016 No
7 April 11, 2002 Oxley’s bill was scheduled to be voted on by House Financial Services Committee; however, the vote was postponed. April 10-12 0.0221 -0.0002 0.0222*** Yes
8 April 16, 2002 Committee passed Oxley’s bill. April 15-17 -0.015 0.0107 -0.0264 No 9 April 24, 2002 House passed Oxley’s bill. April 24-26 0.0074 0.0031 0.0043 Yes
10 May 8, 2002 Accounting reform bill introduced by Sarbanes to Senate Banking Committee. May 7-9 -0.0042 -0.0007 -0.0035 No
11 June 11, 2002 SEC proposed regulation requiring executives to certify financial statements. June 10-12 0.0081 -0.0133 0.0214*** Yes
12 June 18, 2002 Senate banking committee passed Sarbanes’ bill.. June 17-19 0.0022 0.0024 -0.0002 No
13 June 25, 2002 WorldCom scandal exposed. June 24-26 -0.002 -0.0023 0.0003 Yes
14 July 8, 2002 Senate debates Sarbanes’ bill and Bush delivers speech on corporate reforms. July 8-10 -0.0024 -0.0112 0.0087 Yes
15 July 15, 2002 Senate passed Sarbanes’ bill. July 15-17 -0.0174 -0.0071 -0.0103 No
16 July 18, 2002 House negotiation over bill begins. July 18-22 0.0017 -0.0326 0.0342*** Yes
17 July 24, 2002 House and Senate agree on the final rule and pass SOX. July 23-25 -0.0068 -0.0101 0.0035 Yes
(table continues)
69
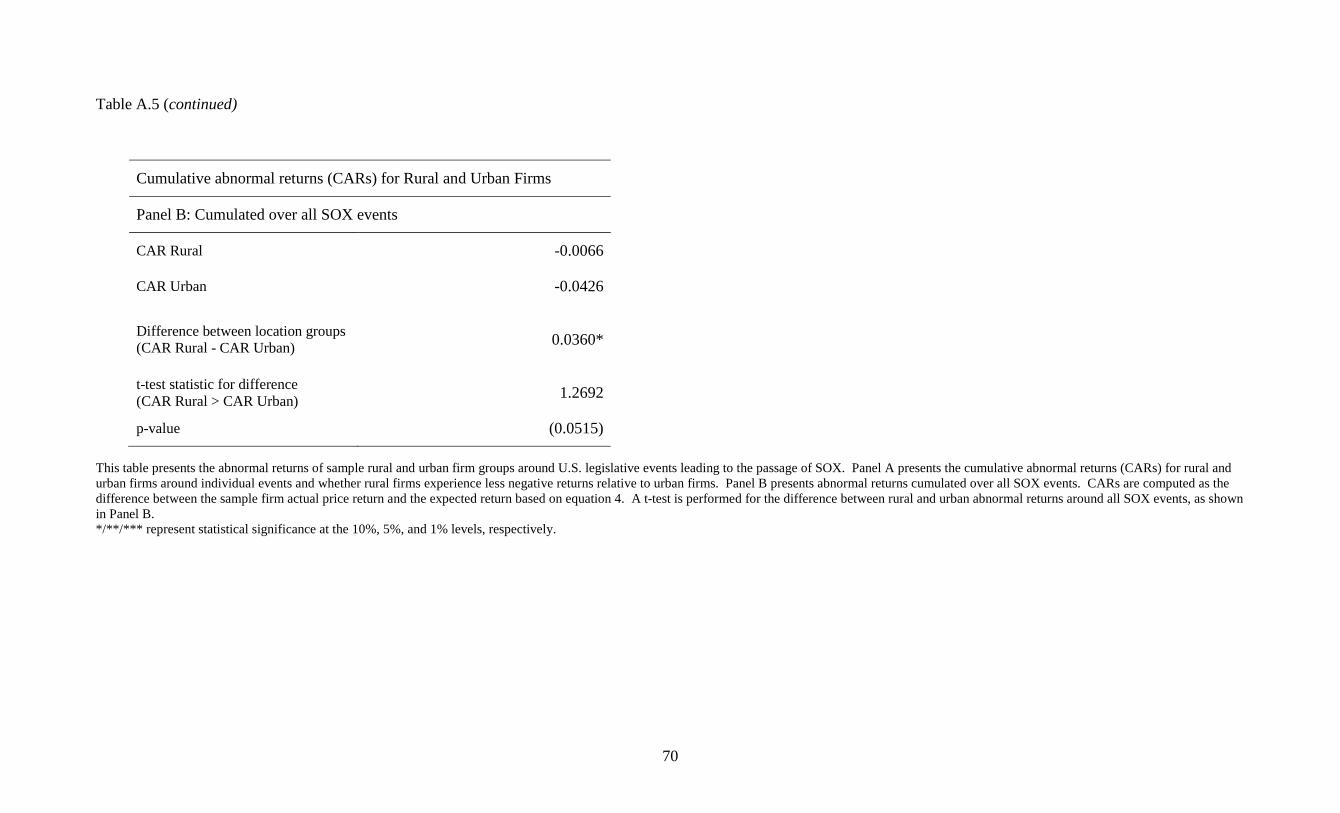
Table A.5 (continued)
This table presents the abnormal returns of sample rural and urban firm groups around U.S. legislative events leading to the passage of SOX. Panel A presents the cumulative abnormal returns (CARs) for rural and urban firms around individual events and whether rural firms experience less negative returns relative to urban firms. Panel B presents abnormal returns cumulated over all SOX events. CARs are computed as the difference between the sample firm actual price return and the expected return based on equation 4. A t-test is performed for the difference between rural and urban abnormal returns around all SOX events, as shown in Panel B. */**/*** represent statistical significance at the 10%, 5%, and 1% levels, respectively.
Cumulative abnormal returns (CARs) for Rural and Urban Firms
Panel B: Cumulated over all SOX events
CAR Rural -0.0066
CAR Urban -0.0426
Difference between location groups (CAR Rural - CAR Urban) 0.0360*
t-test statistic for difference (CAR Rural > CAR Urban) 1.2692
p-value (0.0515)
70

Table A.6 Test of Difference in Fog Readability Score for Rural and Urban Firms;Hypothesis 2
Rural Fog Score 15.2119
Urban Fog Score 15.3448
Difference between location groups (Rural Fog Score - Urban Fog Score) -0.1329
t-test statistic for difference -0.7152
p-value 0.2377 This table presents hypothesis test results for whether or not the MD&A of rural firms is easier to read than the MD&A of urban firms. Readability is measured by the Gunning Fog readability index, which is computed by the average number of words in a sentence and percentage of complex words in the document. A lower Fog score is indicative of text that is easier to read and understand. A t-test is performed for the difference between the readability of rural and urban firm MD&A. */**/*** represent statistical significance at the 10%, 5%, and 1% levels, respectively.
Table A.7 Descriptive Statistics; Hypothesis 3 Panel A All Firms
n = 202 Mean Min. Max. Std. Dev. FUTROA -0.1043 -19.7193 0.2521 1.3984 ROA -0.0569 3.4090 0.4521 0.3730 PM -0.2219 -11.2709 1.5447 1.3276 AT 0.9619 -0.3873 6.6295 0.8291 DA 0.5132 0.0744 1.5567 0.2451 BM 0.7998 -2.4659 7.5941 0.8953 ∆REV 0.1367 -1.9124 29.9706 2.1452 OPT 0.0094 0.0013 0.0463 0.0055 PESS 0.0193 0.0021 0.0540 0.0092
Panel B Rural Firms
n = 101 Mean Min. Max. Std. Dev. FUTROA -0.1852 -19.7193 0.2521 1.9670 ROA -0.0130 -2.3824 0.4521 0.2729 PM -0.0503 -3.4557 1.5447 0.5577 AT 1.1007 0.0510 3.5708 0.7711 DA 0.5379 0.0744 1.5567 0.2557
71

BM 0.7783 -2.4659 3.1053 0.7002 ∆REV -0.0140 -0.8369 1.1735 0.2570 OPT 0.0096 0.0013 0.0463 0.0062 PESS 0.0200 0.0032 0.0540 0.0085
Panel C Urban Firms
n = 101 Mean Min. Max. Std. Dev. FUTROA -0.0234 -1.4480 0.1572 0.2194 ROA -0.1009 -3.4090 0.2994 0.4487 PM -0.3934 -11.2709 0.7919 1.7811 AT 0.8231 -0.3873 6.6295 0.8650 DA 0.4884 0.0759 1.4770 0.2326 BM 0.8212 -0.6067 7.5941 1.0584 ∆REV 0.2874 -1.9124 29.9706 3.0229 OPT 0.0092 0.0020 0.0242 0.0046 PESS 0.0185 0.0021 0.0457 0.0099
The above table shows the descriptive statistics for accounting, stock-market, and textual-analysis variables. Panels A, B, and C represent all sample firms (both rural and urban), rural firms, and urban firms, respectively. FUTROA is the sample firm return on assets for 2003, which is the calendar year following the sample year. ROA is the return on assets for the sample year 2002 and is computed by dividing operating income by total assets. PM is sample firm profit margin ratio for the sample year and is computed by dividing operating income by total revenue. AT measures the efficiency with which assets are utilized and is computed by dividing revenue by total firm assets for the sample year 2002. BM is the ratio of book to market value of equity for sample year and is computed by dividing book value by market value of equity. ∆REV is the percent change in revenue from previous year to sample year. OPT and PESS are tonal measurements that capture the ratios of optimistic and pessimistic words, respectively, to total words in the sample firm MD&A for 2002.
Table A.8 Tests of Association among Tone, Geographic Location, and Future Firm Performance; Hypothesis 3 FUTROAi = β0 + β1ROAi + β2PMi + β3ATi + β4DAi + β5BMi + β6ΔREVi + β7RURALi +
β8OPTi + β9PESSi + β10OPTi *RURALi + β11PESSi*RURALi
Variable Equation 7 Equation 8
Intercept 0.5803** 0.4167 (2.06) (1.13) ROA -0.0670 -0.0196
72

(-0.16) (-0.04) PM 0.1492 0.1450 (1.32) (1.09) AT -0.1329 -0.1304 (-1.15) (-1.12) DA -1.4274*** -1.4328*** (-3.58) (-3.49) BM 0.3116*** 0.3231*** (2.92) (2.94) ΔREV 0.0095 0.0067 (0.22) (0.15) RURAL -0.0867 0.0352 (-0.45) (0.10) OPT 1.8303 (0.07) PESS 9.4501 (0.75) OPT*RURAL -0.1833 (-0.01) PESS*RURAL -8.3774* (-1.54) R2 0.1398 0.1426
This table shows hypothesis test results for whether or not a firm’s geographic location has an effect on the tone’s predictive value for future performance. Dependent variable FUTROA is the sample firm return on assets for 2003, which is the calendar year following the sample year. ROA is the return on assets for the sample year 2002 and is computed by dividing operating income by total assets. PM is sample firm profit margin ratio for the sample year and is computed by dividing operating income by total revenue. AT measures the efficiency with which assets are utilized and is computed by dividing revenue by total firm assets for the sample year 2002. DA is a measure of firm risk and is computed by dividing total liabilities by total assets. BM is the ratio of book to market value of equity for sample year and is computed by dividing book value by market value of equity. ∆REV is the percent change in revenue from previous year to sample year. OPT and PESS are tonal measurements that capture the ratios of optimistic and pessimistic words, respectively, to total words in the sample firm MD&A for 2002. RURAL is a dummy variable that takes the value of one if the firm is located in a rural area and zero if located in an urban area. Interaction variables OPT*RURAL and PESS*RURAL allow testing of the incremental effect of MD&A linguistic tone on rural firms relative to urban firms. T-statistics are presented in parenthesis. */**/*** represent statistical significance at the 10%, 5%, and 1% levels, respectively.
73

REFERENCES
Ali, A., Klasa, S., & Yeung, E. (2009). The limitations of industry concentration measures constructed with Compustat data: Implications for finance research. Review of Financial Studies, 22(10), 3839-3871.
Ball, R., & Brown, P. (1968). An empirical evaluation of accounting income numbers. Journal of Accounting Research, 6(2), 159-178.
Bamber, B. M., & Odean, T. (2008). All that glitters: The effect of attention and news on the buying behavior of individual and institutional investors. Review of Financial Studies, 21(2), 785-818.
Beaver, W. H. (1968). The information content of annual earnings announcements. Journal of Accounting Research, 6(supplement), 67-92.
Beneish, M., Lee, C., & Nichols, D. C. (2013). Earnings manipulation and expected returns. Financial Analysts Journal, 69(2), 57-82.
Berk, J. B., Stanton, R., & Zechner, J. (2010). Human capital, bankruptcy, and capital structure. The Journal of Finance, 65(3), 891-926.
Bowen, R. M., Rajgopal, S., & Venkatachalam, M. (2008). Accounting discretion, corporate governance, and firm performance. Contemporary Accounting Research, 25(2), 351-405.
Bowman, R. G. (1983). Understanding and conducting event studies. Journal of Business Finance & Accounting, 10(4), 561-584.
Brennan, M. J., & Cao, H. H. (1997). International portfolio investment flows. Journal of Finance, 52(5), 1851-1880.
Carrado, C. J. (2011). Event studies: A methodology review. Accounting & Finance, 51(1), 207-234.
Cheng, M., Green, M, & Ko, J. (2015). The impact of strategic relevance and assurance of sustainability indicators on investors’ decision. Auditing: A Journal of Practice and Theory, forthcoming.
Cho, C. H., Roberts, R. W., & Patten, D. M. (2010). The language of US corporate environmental disclosure. Accounting, Organizations and Society, 35(4), 431-443.
Chung, C., & Pennebaker, J. W. (2007). The psychological functions of function words. Social Communication, K. Fielder (ed.), 343-359.
Compustat II and Plus Manual. (1980). Standard and poor's Compustat services. Inc., Englewood, CO.
74
Copeland, T. (1978). Efficient capital markets: Evidence and implications for financial reporting. Journal of Accounting, Auditing, and Finance, (Fall), 33-48.
Core, J. E., Holthausen, R. W., & Larcker, D. F. (1999). Corporate governance, chief executive officer compensation, and firm performance. Journal of Financial Economics, 51(3), 371-406.
Courtis, J. K. (1986). An investigation into annual report readability and corporate risk-return relationships. Accounting and Business Research, 16(64), 285-294.
Coval, J. D., & Moskowitz, T. J. (1999). Home bias at home: Local equity preference in domestic portfolios. Journal of Finance, 54(6), 2045-2073.
Craswell, A., Francis, J., & Taylor, S. (1995). Auditor brand name reputations and industry specializations. Journal of accounting and economics, 20(3), 297-322.
Cummings, J. (2002). Bush to seek tougher penalties in assault on corporate fraud. Wall Street Journal, 240(6), (July 9), A1.
Dale, E., & Chall, J. S. (1948). A formula for predicting readability. Educational Research Bulletin, 27(1), 11-28.
Davis, A. K., Piger, J. M., & Sedor, L. M. (2007). “Beyond the numbers: An analysis of optimistic and pessimistic language in earnings press releases,” AAA 2008 Financial Accounting and Reporting Section (FARS) Paper.
Day, K., & Crenshaw, A. B. (2002) SEC, accounting firms redrafting audit roles: Agency chairman draws fire for role in effort. The Washington Post, 1274(A), (January 16), A01.
De Santis, Giorgio, & Gerard, B. (1997). International asset pricing and portfolio diversification with time-varying risk. Journal of Finance, 52(5), 1881-1912.
DeAngelo, L. E. (1981). Auditor size and audit quality. Journal of Accounting and Economics, 3(3), 183-199.
DeFond, M., Francis, J., & Hu, X. (2011). The geography of SEC enforcement and auditor reporting for financially distressed clients. Working Paper.
Dolley, J. C. (1933). Common stock split-ups—Motives and effects. Harvard Business Review, 12(1), 70-81.
Drew, G. A. (1950). New methods for profit in the stock market: with a critical analysis of established systems. Metcalf Press.
Dyckman, T., & Morse, D. (1986). Efficient Capital Markets: A Critical Analysis. New Jersey: Prince-Hall, Englewood Cliffs.
75

Dyckman, Thomas R., & Smith, Abbie J. (1979). Financial accounting and reporting by oil and gas producing companies: A study of information effects. Journal of Accounting and Economics, 1(1), 45-75.
Eldor, R., Pines, D., & Schwartz, A. (1988). Home asset preference and productivity shocks. Journal of International Economics, 25(1), 165-176.
Elrod, G. B. (2010). Is there predictive value in the words managers use? A key word analysis of the annual report's management discussion and analysis. Dissertation. Arlington, TX: University of Texas at Arlington.
Fama, E. F. (1965). The behavior of stock-market prices. The Journal of Business, 38(1), 34-105.
Fama, E. F., & French, K. R. (2002). Testing trade‐off and pecking order predictions about dividends and debt. Review of Financial Studies, 15(1), 1-33.
Financial Accounting Standards Board, (1978). Statement of financial accounting concepts no. 1: Objectives of financial reporting by business enterprises. Norwich, CT: Financial Accounting Standards Board.
Francis, B., Hasan, I., John, K., & Waismann, M. (2007). Geography and CEO pay. Unpublished Working Paper (Rensselaer Polytechnic Institute, New York University and Fordham University).
Frazier, K. B. (1981). Word-frequency contiguities in narrative accounting disclosures. Dissertation. Charleston, SC: University of South Carolina.
French, K. R., & Poterba, J. M. (1991). Investor diversification and international equity markets. American Economic Review, 81(2), 222.
Glassman, C. A. (2005). Remarks at the Plain Language Association International’s Fifth International Conference. (http://www.sec.gov/news/speech/spch110405cag.htm).
Graham, J. R., Harvey, C. R., & Puri, M. (2013). Managerial attitudes and corporate actions. Journal of Financial Economics, 109(1), 103-121.
Grullon, G., Kanatas, G., & Weston, J. P. (2004). Advertising, breadth of ownership, and liquidity. Review of Financial Studies, 17(2), 439-461.
Gunning, R. (1952). The technique of clear writing. New York, NY: McGraw-Hill.
Gunning, Robert. (1969). The fog index after twenty years. Journal of Business Communication, 6(2), 3-13.
Healy, P. M., & Palepu, K. G. (2001). Information asymmetry, corporate disclosure, and the capital markets: A review of the empirical disclosure literature. Journal of Accounting and Economics, 31(1–3), 405-440.
76

Henry, E. (2008). Are investors influenced by how earnings press releases are written? Journal of Business Communication, 45(4), 363-407.
Hilzenrath, D. S., Weisman, J., & VandeHei, J. (2002). How congress rode a ‘storm’ to corporate reform. The Washington Post, 28, (July 28), A01.
Hitt, G. (2002). Bush signs sweeping legislation aimed at curbing corporate fraud. Wall Street Journal, 240(22), (July 31), A4.
Huberman, G. (2001). Familiarity breeds investment. Review of Financial Studies, 14(3), 659-680.
Hüfner, B. (2007). The SEC’s MD&A: Does it meet the informational demands of investors? Schmalenbach Business Review, 59(1), 58-84.
Hutton, A. P., Miller, G. S., and Skinner, D. J. 2003. The role of supplementary statements with management earnings forecasts. Journal of Accounting Research, 41, 867-890.
Ivkovic, Z., & Weisbenner, S. (2005). Local does as local is: Information content of the geography of individual investors' common stock investments. Journal of Finance, 60(1), 267-306.
John, K., Knyazeva, A., & Knyazeva, D. (2011). Does geography matter? Firm location and corporate payout policy. Journal of Financial Economics, 101(3), 533-551.
Kedia, S., & Rajgopal, S. (2011). Do the SEC's enforcement preferences affect corporate misconduct? Journal of Accounting and Economics, 51(3), 259-278.
Kitson, H. D. (1927). The mind of the buyer. New York, NY: MacMillan Company.
Klare, G. R., Mabry, J. E., & Gustafson, L. M. (1955). The relationship of style difficulty to immediate retention and to acceptability of technical material. Journal of Educational Psychology, 46(5), 287.
Knyazeva, A., Knyazeva, D., & Masulis, R. (2009). Local director talent and board composition. (unpublished working paper).
Kothari, S. (2001). Capital markets research in accounting. Journal of Accounting and Economics, 31(1), 105-231.
Lang, M., Raedy, J. Smith, & Wilson, W. (2006). Earnings management and cross listing: Are reconciled earnings comparable to US earnings? Journal of Accounting and Economics, 42(1), 255-283.
Lehavy, R., Li, F., & Merkley, K. (2011). The effect of annual report readability on analyst following and the properties of their earnings forecasts. Accounting Review, 86(3), 1087-1115.
77

Lerner, J. (1995). Venture capitalists and the oversight of private firms. Journal of Finance, 50(1), 301-318.
Lev, B., & Thiagaragan, S. R. (1993). Fundamental information analysis. Journal of Accounting Research, 31(2), 190-215.
Li, F. (2008). Annual report readability, current earnings, and earnings persistence. Journal of Accounting and Economics, 45(2–3), 221-247.
Loughran, T., & Schultz, P. (2005). Liquidity: Urban versus rural firms. Journal of Financial Economics, 78(2), 341-374.
Loughran, T., & McDonald, B. (2011). When is a liability not a liability? Textual analysis, dictionaries, and 10‐Ks. The Journal of Finance, 66(1), 35-65
Malloy, Christopher J. (2005). The geography of equity analysis. The Journal of Finance, 60(2), 719-755.
Melloan, G. (2002). Workers of the world are shedding their chains. 240(45), Wall Street Journal, (July 23), A21.
Merton, R. C. (1987). A simple model of capital market equilibrium with incomplete information. The Journal of Finance, 42(3), 483-510.
Miller, P. B., & Robertson, J. (1989). A guide to SEC regulations and publications: Mastering the maze. Research in Accounting Regulation, 3, 239-249.
Morris, R. D. (1987). Signalling, agency theory and accounting policy choice. Accounting and Business Research, 18(69), 47-56.
Murphy, D. R. (1947). How plain talk increases readership 45% to 66%. Printer's Ink, 220, 35-37.
Murray, S. (2002). Leading the news: House GOP moves on oversight bill, with few changes. The Wall Street Journal, 240(13), (July 18), A3.
Nissim, D., & Penman, S. H. (2001). Ratio analysis and equity valuation: From research to practice. Review of Accounting Studies, 6(1), 109-154.
Ou, J. A., & Penman, S. H. (1989). Financial statement analysis and the prediction of stock returns. Journal of Accounting and Economics, 11(4), 295-329.
Paletta, Damian, and Aaron Lucchetti. 2010. Law Remakes U.S. Financial Landscape. The Wall Street Journal 16.
Penman, S. (1992). Financial statement information and the pricing of earnings changes. Accounting Review, 67(3), 563-577.
78
Penman, S. (2004). Special Double Issue on Accounting, Disclosure, and the Cost of Capital-Editorial. Review of Accounting Studies, 9(2-3), 147-157.
Piotroski, J. D. (2000). Value investing: The use of historical financial statement information to separate winners from losers. Journal of Accounting Research, 38(2000), 1-52.
Pirinsky, C., & Wang, Q. (2006). Does corporate headquarters location matter for stock returns? The Journal of Finance, 61(4), 1991-2015.
Reynolds, J., & Francis, J. (2000). Does size matter? The influence of large clients on office-level auditor reporting decisions. Journal of Accounting and Economics, 30(3), 375-400.
Richardson, S., Tuna, İ., & Wysocki, P. (2010). Accounting anomalies and fundamental analysis: A review of recent research advances. Journal of Accounting and Economics, 50(2), 410-454.
Romano, R., (2004). The Sarbanes–Oxley Act and the making of quack corporate governance. Unpublished Working Paper (Yale University, NBER and ECGI).
Salatka, William K. (1989). The impact of SFAS no. 8 on equity prices of early and late adopting firms: An events study and cross-sectional analysis. Journal of Accounting and Economics, 11(1), 35-69.
Schroeder, M. (2002). Lawmakers plan more financial oversight–accounting industry faces stepped-up regulation and limits on services. The Wall Street Journal, 239(30), (February 12), A3.
Schroeder, N., & Gibson, C. (1990). Readability of management’s discussion and analysis. Accounting Horizons, 4(4), 78-87.
Seasholes, M. S., & Zhu, N. (2010). Individual investors and local bias. The Journal of Finance, 65(5), 1987-2010.
SEC (1989). Management's discussion and analysis of financial condition and results of operations; certain investment company disclosures. Securities Act Release No. 33-6835 (May 18).
SEC (1998). A Plain English Handbook: How to Create Clear SEC Disclosure Documents. U.S. Securities and Exchange Commission, Washington, D.C.
SEC (2003). Commission guidance regarding management's discussion and analysis of financial condition and results of operations. Securities Act Release No. 33-8350 (December 19).
Sherman, L. A. (1893). Analytics of literature: A manual for the objective study of English prose and poetry. Boston, MA: Ginn.
Strong, N. (1992). Modelling abnormal returns: a review article. Journal of Business Finance & Accounting, 19(4), 533-553.
79

Subramanian, R., Insley, R. G., & Blackwell, R. D. (1993). Performance and readability: A comparison of annual reports of profitable and unprofitable corporations. Journal of Business Communication, 30(1), 49-61.
Tavcar, L. R. (1998). Make the MD&A more readable. CPA Journal Online, 01(98), 7.
Tinker, M. A. (1963). Legibility of print. Ames, IA: Iowa State University Press.
Titman, S., & Trueman, B. (1986). Information quality and the valuation of new issues. Journal of Accounting and Economics, 8(2), 159-172.
Titman, S., & Wessels, R. (1988). The determinants of capital structure choice. The Journal of Finance, 43(1), 1-19.
U.S. Congress, (2002). An act: To protect investors by improving the accuracy and reliability of corporate disclosures made pursuant to the securities laws, and for other purposes; the Sarbanes-Oxley Act. The Sarbanes-Oxley Act, 107th Cong., HR, 3763.
VandeHei, J. (2002, July 17). House GOP's leaders fight audit plan; lawmakers seek to dilute some senate-passed reforms. The Washington Post, 997(A), (July 17), A01.
Verrecchia, R. E. (2001). Essays on disclosure. Journal of Accounting and Economics, 32(1), 97-180.
Warner, J. B., and S. P. Kothari. (2006). Econometrics of event studies. Handbook of corporate finance: empirical corporate finance, vol. A (Handbooks in finance series). North-Holland, Amsterdam, Netherlands: Elsevier.
Williams, S. P. (2005). Meet the experts. Accounting Horizons, 19(4), 255-265.
Yan, Z., & Zhao, Y. (2011). When two anomalies meet: the post-earnings announcement drift and the value-glamour anomaly. Financial Analysts Journal, 67(6), 46-60.
Yuthas, K., Rogers, R., & Dillard, J. F. (2002). Communicative action and corporate annual reports. Journal of Business Ethics, 41(1/2), 141-157.
Ziebart, D. A., & Kim, D. H. (1987). An examination of the market reactions associated with SFAS No. 8 and SFAS No. 52. Accounting Review, 343-357.
Zhang, I. X. (2007). Economic consequences of the Sarbanes–Oxley act of 2002. Journal of Accounting and Economics, 44(1), 74-115.
80