a study of keystroke dynamics as a practical form of
TRANSCRIPT

Pomona CollegeDepartment of Computer Science
A Study of Keystroke Dynamics as a PracticalForm of Authentication
Charles Zhou
May 1, 2008
Submitted as part of the senior exercise for the degree ofBachelor of Arts in Computer Science
Professor Everett Bull, adviser

Copyright c© 2008 Charles Zhou
The author grants Pomona College the nonexclusive right to makethis work available for noncommercial, educational purposes, pro-vided that this copyright statement appears on the reproducedmaterials and notice is given that the copying is by permissionof the author. To disseminate otherwise or to republish requireswritten permission from the author.

Abstract
This project tested four keystroke analysis strategies andtheir effectiveness for a practical implementation of keystrokedynamics. A web based keystroke analysis system was im-plemented and a total of 70 participants were involved withthe experiment. We designed a new method of typing datastorage that is less storage intensive than previous studies.Error rates for each analysis was graphed out across 1000thresholds so we could see how sensitive each strategy was tothreshold adjustments. This method of graphing error ratesis something that we have not seen in any previous studiesand is something we believe future research should considerbecause it is significantly more informative than simply justreporting the best possible False Alarm Rate (FAR) and Im-postor Pass Rate (IPR).
The results of the experiment indicated that the ratio methodis the strategy with the lowest error rates. It could achievea False Alarm Rate (FAR) of 4.29%, an Impostor Pass Rate(IPR) of 3.37%, and a classification error rate of 18.57%. Wealso concluded that the ratio method is the best keystrokeanalysis strategy to use in a practical implementation be-cause it is the least sensitive to threshold adjustments.
Our method of typing data storage was sufficient though itmay have accounted for some of our high error rates. Theslightly higher error rates than previous studies is likely dueto the fact that typing behavior information is lost when weconvert raw timing information into our data structure.
i

ii

Contents
Abstract . . . . . . . . . . . . . . . . . . . . . . . . . . . . . . . . . iList of Figures . . . . . . . . . . . . . . . . . . . . . . . . . . . . . vList of Tables . . . . . . . . . . . . . . . . . . . . . . . . . . . . . . vii
1 Introduction 11.1 Authentication: The Current Situation . . . . . . . . . . . . . 11.2 Keystroke Dynamics . . . . . . . . . . . . . . . . . . . . . . . 21.3 Goals . . . . . . . . . . . . . . . . . . . . . . . . . . . . . . . 2
2 The History of Keystroke Dynamics 52.1 1980-1989: The First Studies . . . . . . . . . . . . . . . . . . 52.2 1990-1999: Practical Keystroke Authentication and Neural
Networks . . . . . . . . . . . . . . . . . . . . . . . . . . . . . 72.3 2000-Present: New Ideas and Commercial Products . . . . . . 9
3 Data Collection 133.1 Collecting Data . . . . . . . . . . . . . . . . . . . . . . . . . . 133.2 Preprocessing Data . . . . . . . . . . . . . . . . . . . . . . . . 14
4 Analysis Methods 174.1 The Standard Deviation Method . . . . . . . . . . . . . . . . 174.2 The Euclidean Distance Method . . . . . . . . . . . . . . . . 184.3 The Ratio Method . . . . . . . . . . . . . . . . . . . . . . . . 184.4 The Vector Disorder Method . . . . . . . . . . . . . . . . . . 194.5 Measure of Success: FAR vs. IPR . . . . . . . . . . . . . . . . 204.6 Thresholds . . . . . . . . . . . . . . . . . . . . . . . . . . . . 20
5 Results 235.1 Authentication . . . . . . . . . . . . . . . . . . . . . . . . . . 235.2 Classification . . . . . . . . . . . . . . . . . . . . . . . . . . . 29
iii

6 Discussion of Results 316.1 Goals . . . . . . . . . . . . . . . . . . . . . . . . . . . . . . . 316.2 Vector Disorder . . . . . . . . . . . . . . . . . . . . . . . . . . 326.3 Classification . . . . . . . . . . . . . . . . . . . . . . . . . . . 326.4 Keystroke Durations . . . . . . . . . . . . . . . . . . . . . . . 326.5 Free Text: Global Patterns . . . . . . . . . . . . . . . . . . . 33
7 Future Work 357.1 Improved Data Collection . . . . . . . . . . . . . . . . . . . . 357.2 User Acceptance . . . . . . . . . . . . . . . . . . . . . . . . . 367.3 Dynamic Authentication . . . . . . . . . . . . . . . . . . . . . 367.4 Conclusion . . . . . . . . . . . . . . . . . . . . . . . . . . . . 36
A Glossary of Key Terms 39
B Data Collection: Supplemental 41
C Scale of Graphs 43
D Database Statistics 45
E Additional Graphs 47
Bibliography 51
iv

List of Figures
3.1 Schema of the Typing Data Structure . . . . . . . . . . . . . 15
4.1 A example of vector disorder between a reference and claimantfor the typing sample “POMONA” . . . . . . . . . . . . . . . 19
4.2 A graph of an analysis method that is sensitive to thresholdadjustments . . . . . . . . . . . . . . . . . . . . . . . . . . . . 21
4.3 A graph of an analysis method that is not sensitive to thresh-old adjustments . . . . . . . . . . . . . . . . . . . . . . . . . . 22
5.1 A graph of the standard deviation method vs. the Euclideandistance method. . . . . . . . . . . . . . . . . . . . . . . . . . 24
5.2 A graph of the vector disorder method with 0 entries and with0 entries removed. . . . . . . . . . . . . . . . . . . . . . . . . 25
5.3 A graph of standard deviation method vs. the vector disordermethod. . . . . . . . . . . . . . . . . . . . . . . . . . . . . . . 26
5.4 A graph of the standard deviation method vs. the ratio method. 275.5 A graph of the ratio method using only key latencies versus
key latencies and key durations . . . . . . . . . . . . . . . . . 285.6 A graph of the ratio method on free text authentication. . . . 29
B.1 A screenshot of the web application we implemented . . . . . 41
E.1 A graph of the standard deviation method scaled from 0% to100% . . . . . . . . . . . . . . . . . . . . . . . . . . . . . . . . 47
E.2 A graph of the Euclidean distance method scaled from 0 to338000 . . . . . . . . . . . . . . . . . . . . . . . . . . . . . . . 48
E.3 A graph of the ratio method scaled from 0% to 100% . . . . . 48E.4 A graph of the vector disorder method scaled from a normal-
ized disorder of 1.0 to 0.0 . . . . . . . . . . . . . . . . . . . . 49
v

vi

List of Tables
5.1 Table of Classification Results . . . . . . . . . . . . . . . . . . 29
C.1 Scales for graphs . . . . . . . . . . . . . . . . . . . . . . . . . 43
D.1 Database Statistics . . . . . . . . . . . . . . . . . . . . . . . . 46
vii

viii

Chapter 1
Introduction
The ubiquitous computer systems in our society today have become theguardians of an exponentially increasing collection of information. A signif-icant portion of this data is often sensitive and should only be accessed byauthorized individuals. Keystroke dynamics has often been suggested as amethod to harden current authentication schemes because it does not needexpensive hardware and has been shown to be a feasible biometric system.The goals of this project was to review previous work done on keystrokedynamics, examine the existence of “global” typing patterns, test a methodof data representation, and to identify the ideas that would be best suitedfor a practical implementation of a keystroke authentication system.
1.1 Authentication: The Current Situation
Current security solutions have been traditionally categorized into the threefactors of something the user has (usb token, mobile phone), something theuser knows (password, social security number), and something the user is(biometrics). The most widely implemented of these three has been pass-word authentication systems. Password systems benefit from low imple-mentation costs and effectiveness in terms of accuracy (a password is eithercorrect or wrong). However, passwords are plagued by several inadequa-cies and numerous effective methods are available for attacking passwords.[Bis03].
None of the three factors are flawless and this has led to the adoption oftwo-factor authentication systems by groups where security is a top priority.In fact, The U.S federal government has already recognized the weakness ofsingle-factor authentication and recommends that banks adopt some form
1

of two-factor authentication[Cou]. Of the three factors, biometrics offers themost promise yet has been slow in it’s adoption. This is due to high costsassociated with biometrics and the lack of standardization [Pol97]. Furtherwork needs to be done to lessen the gap between biometrics in theory andbiometrics in practice. The results from this project will hopefully aid inthis goal.
1.2 Keystroke Dynamics
Within in biometrics, there are the two categories of physiological (fin-gerprints) vs. behavioral (handwriting) [Pol97]. Keystroke dynamics fallswithin the category of behavioral biometrics. The idea behind keystrokedynamics is that people have different typing styles and by analyzing thetimings of keystrokes, a person can be identified. A benefit of this metric isthat measuring keystrokes can be done through a keyboard, thus negatingthe cost of typical physiological biometric systems which require expensivehardware to measure physical attributes.
1.3 Goals
The first goal was to compare the effectiveness of numerous metrics sug-gested in previous research and to determine which one is the most success-ful. Each of these metrics was modified to use our data representation. Areview and comparison needed to be done because numerous studies claimedhigh success rates but the studies varied significantly on how they collectedthe data and how they “preprocessed” the data before analyzing it. Addi-tionally, several of the studies were conducted under conditions that werecontrolled and therefore their results may not be replicated when appliedto a different environment. A more detailed review of past studies can befound in Chapter 2. The experiment in this paper involved collecting typingsamples from 70 users.
The second goal was to examine the existence of “global” typing pat-terns. We tested this by performing tests on free text. The third goal wasto test a method of data representation. Previous studies stored each typingsample individually. While this may be OK in an experimental setting, inthe real world this would mean that the typing data for a user would con-stantly be increasing as time goes by. We used our own original method ofrepresenting typing samples that reduced keystroke timings into a constantsized reference profile. The last goal was to focus on ideas for a practical au-
2

thentication mechanism. Our experiment was designed to be more realisticand practical in it’s data collection and practicality was also our key criteriain analyzing the different authentication methods. A detailed explanationof our experimental and analysis methods can be found in Chapter 3 andChapter 4. We hope that the results from this study will contribute to thedevelopment of practical and effective keystroke dynamics authenticationsystems.
3

4
Chapter 2
The History of KeystrokeDynamics
This chapter uses several keywords that are considered common knowledgefor most researchers involved in computer security and keystroke dynamics.A glossary of these words is included at the end of this paper in Appendix Aif the reader needs clarification on any of the terms used in this chapter.
2.1 1980-1989: The First Studies
The pioneering research done in keystroke dynamics dates back to the Randreport in 1980 [GLPS80]. Inspired by the idea that that individuals haveunique rhythms when they sent telegraphs, the U.S government funded re-search to study if this same behavior was exhibited by people using a com-puter keyboard. It is from this preliminary study that the concept of adigraph was described. A digraph is a pair of two keystrokes and the timeelapsed between the typing of the first and second keystroke. The studyrecorded digraph measurements for the participants and measured: mean,variance, kurtosis, and variance. A simple t-test was used to classify a user.The statistical analysis indicated that keystroke analysis was definitely a fea-sible biometric. While the authors of the Rand report were able to achieve100% success rate in classification, many researchers argue that this is in-significant due to fact that only 7 test subjects were involved in the studyand that a significant amount of fine tuning of their metric had to be done(over-fitting).
After the Rand report, more experimental studies were conducted thatconfirmed the relevance of digraphs in identifying user typing signatures. In
5
1985, Umphress and Williams conducted a more thorough experiment andgave more credence to the idea that keyboard dynamics was viable [UW85].This was followed by a study in 1988 done by Williams and Leggett anda 1989 study done by Umphress, Williams, and Leggett [LW88] [LWU89].These studies used statistics to compare a claimant typing sample against areference profile in order to classify users. For example, one of the methodswas to calculate the standard deviation of all the digraphs. When compar-ing a claimant sample against a reference sample, each claimant digraph waschecked to see if it was within .5 standard deviations of the reference digraph.If this was true, then the digraph was considered “valid”. If the claimantsample had more than 60% valid digraphs, the user would be authenticated.The important conclusions from these studies were that: digraphs were con-firmed to be a good measure of keystrokes, mean digraph time (essentiallytyping speed) was determined to be not useful in classification, removing di-graphs more than 500 milliseconds seemed to be a good method of removingoutliers in typing samples, and using all the digraphs yielded better resultsthan using specific digraphs for classification.
It is around this time that the first patents were granted for keystrokedynamics. Garcia’s 1986 patent described a scheme where users typed theirnames in order to authenticate [Gar86]. The rationale is that this will be easyto remember and users will hopefully exhibit more consistent digraphs whentyping something familiar. An interesting idea proposed in the patent wasthe use of a vector of mean keystroke latencies (digraphs) as a reference. TheMahalanobis distance function was then used to compare a claimant vectoragainst the reference vector. If the distance calculated is greater 100, theclaimant vector is rejected and if the distance was less than 50, the claimantvector was accepted. A distance in between 50 and 100 would prompt theclaimant to type the sample again. Garcia’s patent also described a systemwhere users are asked to type 1000 of the most common words 10 times togenerate a reference profile and users are then given randomly generatedphrases when they want to authenticate. This idea is a clear extensionof Garcia’s claim that keystroke dynamics should involve words that arefamiliar to users. However, it would be impractical to implement.
Three years later, a patent was granted to Young and Hammon for theirdescription of a keystroke authentication method [YH89]. This patent men-tions the use of keystroke latencies and keystroke pressures as importantmeasurements of keystroke behavior. The authentication method incorpo-rated the use of a reference vector of digraphs similar to Garcia’s idea.However, Young and Hammon chose Euclidean distance as the measure ofsimilarity between claimant and reference vectors.
6
Many of the researchers in keystroke dynamics have adopted/adaptedthe methods described in these two patents. Most of the experiments con-ducted since 1990 involved storing digraph measurements into vectors anddetermining a way of measuring “distance” between a claimant and referencevector. The user whose reference vector that had the shortest distance fromthe claimant vector was the user that was identified as being the claimant.
2.2 1990-1999: Practical Keystroke Authentica-tion and Neural Networks
After the first studies concluded that keystroke authentication was feasible,researchers begin designing experiments that would make keystroke dynam-ics a more practical tool. The two goals were to shorten the amount oftyping input needed from the users and to further lower the False AlarmRate (FAR) and Impostor Pass Rate (IPR) [JG]. Previous studies requiredusers to submit typing samples as large as 537 characters [UW85]. The Randreport study had a FAR of 4% and IPR of 0% and was able to reduce bothto 0% with some fine tuning of their metric [GLPS80]. However, when otherresearchers repeated the methods described in the Rand report, they wereonly able to achieve a FAR of 30% and a IPR of 17%[UW85]. It was clearthat some of the previous research suffered from the problem of over-fitting.
In 1990, Joyce and Gupta set out to address some of the issues men-tioned above [JG]. They stated that IPR should ideally be below 1.0% andan FAR of 5% and below was acceptable. Their experiment only used aperson’s username, password, and 2 short sentences for sampling a user’styping style. A FAR of 6.67% and IPR of below 1% was achieved by simplyusing the Euclidean distance measurement between reference vectors andclaimant vectors. This was close to what Joyce and Gupta had hoped toachieve and they believed that while authentication may be hard to imple-ment, keystroke dynamics could easily be implemented as a safety device fordetecting intoxicated or tired users.
Brown and Rogers also decided to take a more practical approach intheir 1994 study on keystroke authentication [BR94]. Their research wasalso the first to examine the use of neural networks as a method of classi-fying claimant vectors. The experiment only used typing samples that were15 characters long and they were able to achieve FAR between 12.0% and40.9%. They purposely chose to tune their metrics to have a 0% IPR becausethey argued that minimizing the number of intruders is far more importantthan annoying the user with false alarms. For comparison, they also tried
7
using Euclidean distance and came to the conclusion that it did not performany better than a neural network. Brown and Rogers favored the develop-ment of a neural network authentication mechanism because they believedthat such an implementation would be trivial.
There are many points that we disagree with Brown and Rogers on.First, having an IPR of 0% is ideal but not practical if it results a FARof 40.9%. The standards set by Joyce and Gupta were far more realistic[JG]. Additionally, there are several aspects of neural networks that makethem less ideal for practical use. In the work described by Brown and Rogers,several different types of neural networks were trained with a set of authenticuser typing samples and a large set of impostor typing samples. One neuralnetwork was then designed to take in a typing input and output a 0 forrejecting and 1 for accepting the input as valid. A second one was designedto output a number between 0.0 and 1.0, representing the likelihood thatthe input was valid. All of these designs are impractical because the cost ofimplementation is substantial. Training the neural network is costly, and sois the creation of a large set of impostor data. The addition of a user wouldalso require additional retraining of the neural net. Finally, these neuralnets were only performing classification and were not addressing the harderproblem of authentication/identification.
Monrose and Rubin recognized the shortcomings of both neural networksand statistical/mathematical strategies [MR97]. They recommended that tomitigate the cost of constant retraining of neural networks, users can be bro-ken up into smaller groups with one neural net for each group. Mathematicalmethods which require the storing of numerous reference profiles may sufferfrom long search times. Monrose and Rubin addressed this issue by cluster-ing user profiles by typing speed. The two key contributions of their studywas a) the idea of using keystroke durations as an additional measurement oftyping behavior and b) the conclusion that certain people exhibited uniquetyping behaviors even when typing “free text”. Their overall results wereaverage and they used implementations described in previous work.
Around the same time Monrose and Rubin were conducting their study,Obaidat and Sadoun were also conducting studies on keystroke dynamics[OS97]. Obaidat and Sadoun conducted numerous experiments comparingthe effectiveness of neural networks versus mathematical methods. Theyalso looked at the effectiveness of keystroke durations as an identifier. Theexperiment confirmed that keystroke durations were an useful measure andcould potentially be better than keystroke latencies. The best results werewhen both keystroke durations and keystroke latencies were used. Obaidatand Sadoun also achieved a 0% error rate on one of their neural networks
8

and a FAR of 1.9% and IPR of 0.7% using vector distance measurements.While these results are impressive, we are skeptical because the experimentonly tested classification and re-testing of these methods may not yield thesame results.
Robinson et al. confirmed the idea that keystroke duration times is asuperior measure than keystroke latency times [RLCM98]. Their researchalso took a practical approach by collecting “real” typing data from severalstudents typing in their login ids. They compared the effectiveness of threedifferent statistical classifiers and the best was able to achieve a FAR of 10%and an IPR of 9%. We find these results to be quite impressive given thesmall amount of typing data they were working with.
2.3 2000-Present: New Ideas and Commercial Prod-ucts
The most recent research in keystroke dynamics has led to the developmentof interesting new strategies and we are now seeing commercial products thatare using keystroke dynamics as a supplemental form of authentication.
In 2000, researchers began looking into ways to make neural networksmore practical. Cho et al. attempted to make neural networks classify userscorrectly without the need for a large set of impostor typing data [CHHK00].The need for impostor data was seen as expensive and also unrealistic; Anyperson attempting to attack the authentication system would most likelynot have submitted a sample of the their typing for the neural net to trainon. When the neural networks receive typing data from a claimant who’sdata they have not trained on, the results are unpredictable. Cho et al.devised a neural network strategy that focused on “novelty detection”. Theneural network is trained on only authentic typing data and when a claimantvector was submitted, it would identify if the data was significantly differ-ent than the data it had trained on. Too many“novelties” would result ina rejection of the claimant. The researchers used short passwords for theirtyping samples and compared the effectiveness of using a statistical classi-fier (nearest-neighbor algorithm) versus their neural network classifier. Theneural network outperformed the statistical classifier with a FAR of 4% andIPR of 0%.
Betchel, Serpen, and Brown in their 2002 research also used a neuralnetwork implementation that only relied on typing data from authentic users[BSB02]. While they did not improve over previous rates, their researchfurthered strengthen the idea that neural nets could be successful with out
9

the need for impostor data. Their paper also recognized that previous neuralnetworks studies which had achieved 100% success rates were flawed becauseof the large amount of typing samples taken from each user and fine captureresolutions of 0.0001 seconds. These attributes most likely allowed the neuralnetworks to become extremely good at classifying but not as successful forauthentication.
Besides new advancements in neural network implementations, new usesfor keystroke dynamics were being tested in 2002. Monrose, Reiter, and Wet-zel proposed a idea for hardening passwords using keystroke data [MRW02].While this study does not directly relate to our study, it is an importantstudy that shows how keystroke dynamics can definitely be used practicallyto aid in authentication.
A third study conducted in 2002 also contributed a new idea for improv-ing keystroke dynamics. Bergadano, Gunetti, and Picardi suggested theidea of using a relative measure instead of an absolute measure [BGP02].Not only did this study have a significant number of participants (154 vol-unteers), it also had impressive results of a FAR of 4% and IPR of 0.01%.Their explanation of the metric and rationale of methods convinced us thatthese results could be replicated. The strategy was to take the referencevector of trigraph timing measurements and then sort them in order ofshortest to longest trigraph timing. A claimant vector is also sorted in thesame method and then the vector disorder distance is calculated from thereference vector. Authentic claimant vectors consistently had significantlysmaller distance measurements than impostor vectors. The rationale behindthis method is that by sorting the vectors and computing vector disorder,absolute keystroke timings become less significant and relative keystroketimings become more important. For example, while users may not alwaystype the trigraph “abc” consistently, they are likely to consistently type“abc” faster than certain trigraphs and slower than other trigraphs. Tri-graphs were used because the researchers tested both digraphs and trigraphsand trigraphs yielded better results.
Gunetti and Picardi then continued to test this idea of relative measuresand it’s effectiveness on free text analysis [GP05]. Free text analysis wasconsidered to be an important area to study because previous research hadalways had participants submit typing samples in very controlled settings.For their study they used both relative and absolute measures to analyze thetyping vectors. Relative measures was determined to be better than absolutemeasures and using both seemed to achieve the best results. With their 205volunteers that submitted free text samples of roughly 800 characters, theyreported FAR of less than 5% and IPR of less than 0.005%. The paper also
10

carefully outlined the differences between classification, authentication, andidentification and described how their metrics could be used to address allthree problems. Based on the success of this study, we are convinced thatusers typing free text also exhibit unique typing styles. This informationmay be useful in implementing dynamic authentication.
The work done by Bergadano, Gunetti, and Picardi in 2002 and 2005 arethe most successful and most well implemented experiments in our opinion.As far as we are aware of, no recent research has improved on their results.However, more recent research has now tried to improve the consistencyof user typing. Hwang, Lee, and Cho argue that the quality of the typingsamples used to create the reference profiles are more important than thequantity of typing samples [HLC06]. In their study, they tried using artifi-cial pauses and cues in order to improve consistency and therefore improvekeystroke authentication overall. We are not convinced that this idea mightnot be practical despite the low error rates.
Examining the current state of keystroke dynamics research as of thewriting of this paper, we see that keystroke dynamics is already viableenough to be used in commercial products as a supplement to traditionalpassword authentication. Biopassword, mentioned by several of the studieswe reviewed, is now marketing such a product [CMD+]. There is still a lotof debate on whether or not “global” typing patterns exist for users or iftyping patterns only exhibit themselves in controlled situations. The mostrecent patent granted for keystroke dynamics was in April 2007 and the theauthors of the patent argue that global patterns do not exist and that anyviable keystroke authentication system must have controlled typing situa-tions [PB07]. Meanwhile, new studies are now examining the feasibility ofusing keystroke dynamics on mobile phone devices [CF07] [KC07]. Initialresults are promising with EER of around 12.8%.
11

12

Chapter 3
Data Collection
The keystroke logging system was implemented using Adobe Flex R© Builder.A flash application was created and hosted on the web to give users a conve-nient and accessible way of submitting typing samples. Appendix B containssupplemental info on the details of this application.
3.1 Collecting Data
Due to the sensitive nature of keystroke logging, participants were first di-rected to an introductory page where they were told exactly what data wasbeing logged. If they consented they clicked the continue button to launchthe flash application. Users were asked to input their name and were thendirected to an instructions page where they were given an overview on howthe experiment was being run.
Part 1 of the data collection involved collecting user typing data whenthe text used is predefined. The writing samples that were used in thispart of the data collection was a collection of 50 Homer Simpson quotes. Alarge amount of typing data needed to be recorded in order to create goodreference profiles. However, this required users to be typing for a significantamount of time. We hoped to make the experience more bearable by havinginteresting/humorous writing samples. The typing samples totaled 4000characters.
The data logged were: key that was pressed, time the key was depressed,and time the key was released. The time recorded was the amount of timepassed since the start of the application and the unit of measurement wasmilliseconds. The data structures used to store this data were two vectorsof tuples. One vector was for all key depressions and the other was for key
13

releases. Tuples were in the form of (time,key-code).Once a user finished typing, all the data that was logged was first inserted
into a MySQL database and then an email was sent to notify us that asuccessful writing sample had just been inserted. If an error had occurredanywhere in this process, the error message would be caught and sent viaemail.
A second part of the data collection involved inviting a subset of the usersback to submit a sample of free text. These users were asked to submita 350 character typing sample about their favorite movie, food, or book.One of our criticisms of the previous studies in keystroke authentication isthat many of the tests were too controlled in the data collection. Ideally areference typing profile can be created from text A and a different text B willstill exhibit the same typing behavior as text A. The point of the free textdata collection was so we can test typing from an less controlled situation.The results from the free text analysis would also allow us to examine thepossibility of “global” typing patterns.
A total of 70 users submitted complete typing samples and 11 of theseusers also submitted a free text sample.
3.2 Preprocessing Data
After all the data collection was done, we began preprocessing the typingdata so it could be used for analysis.
Three separate data structures were created for use. Data structure 1was the reference profiles, Data structure 2 was the claimant samples, andData Structure 3 was the free text samples. Each vector stored user typingentries in the data structure that is illustrated in Figure 3.1.
14

Figure 3.1: Schema of the Typing Data Structure
Looking at Figure 3.1 we see that for every user, we record their user-name and then have a profile vector of their key latency and key depressiontimings. The timing data is stored in the form of (X, timing, numberOfX)where X is the digraph or keystroke and timing is the average timing mea-surement of that keystroke. The third value represents the number of Xtiming measurements were used to calculate the average. By keeping trackof this value, it allows us to easily update the timing measurements whenwe take in new typing samples and there is no need to keep track of separatetyping samples.
For example, if we already have the timing data for the digraph “aa” as(“aa”, 232.5, 4) and we were to take in a new timing measurement for “aa”,we would update by performing the following calculation: newAverageT iming =(232.5 ∗ 4) + newTiming/(4 + 1). The new entry will then be (“aa”, newA-verageTiming, 5).
For each user in our database, we divided up their typing data in half.The first 25 quotes (2126 characters) that they typed were used to populatethe entries for the reference profile vector. The remaining 25 quotes (1874characters) were used to populate entries for the claimant samples vector.Finally, the free text vector was populated with the free text typing samples.In populating the timing data, we did some minimal preprocessing to removepotentially invalid data. Similar to previous studies, we set a maximumdigraph time so long timing measurements due to pauses in typing are notrecorded. The maximum time we set was 500 milliseconds and this was
15
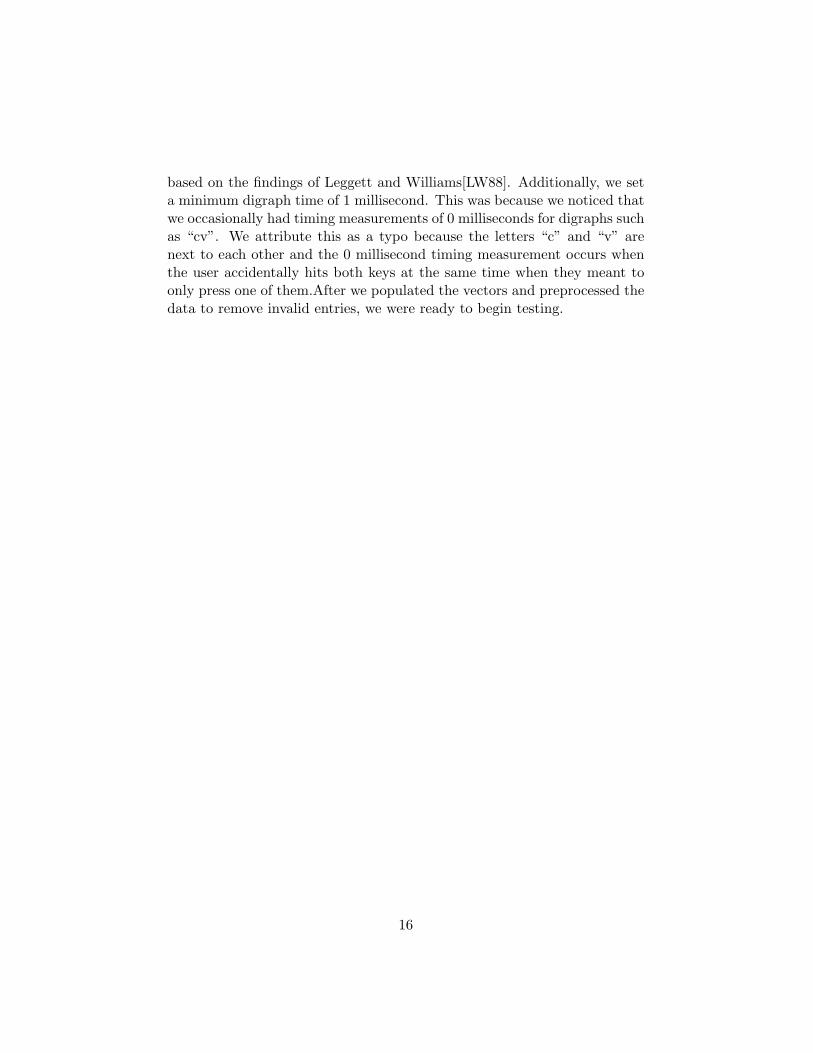
based on the findings of Leggett and Williams[LW88]. Additionally, we seta minimum digraph time of 1 millisecond. This was because we noticed thatwe occasionally had timing measurements of 0 milliseconds for digraphs suchas “cv”. We attribute this as a typo because the letters “c” and “v” arenext to each other and the 0 millisecond timing measurement occurs whenthe user accidentally hits both keys at the same time when they meant toonly press one of them.After we populated the vectors and preprocessed thedata to remove invalid entries, we were ready to begin testing.
16

Chapter 4
Analysis Methods
Previous experiments concerning keystroke dynamics have found a largenumber of statistical strategies to be successful. While experiments differon what statistical tools were used, the essential idea from all of them is thecreation of a reference profile for every user and a method of comparing asubmitted sample with a profile. The creation of the reference profile vectoris described in Chapter 3. In this chapter, we describe the four analysismethods we use to compare claimant samples against the reference profileand the measure of success we used to rate each of the analysis methods.One thing to note is that in our discussion we only mention comparingdigraph timings. Key latency comparisons are done the same way as digraphcomparisons so we do not mention them in order to reduce redundancy.
4.1 The Standard Deviation Method
The standard deviation method we used is adapted from one of the studiesby Umphress and Williams [UW85].
This method involves calculating the standard deviation of a person’sdigraph measurements. On receiving a claimant sample, each digraph fromthe claimant sample is compared to the corresponding digraph in the ref-erence profile. If the timing measurement from the claimant is within 0.5standard deviations of the reference timing, then the digraph is consideredto be valid.
For classification, the claimant sample with the largest percentage ofvalid digraphs is the best match for the reference profile. For authentication,the threshold is the percentage of digraphs needed to authenticate. Somestudies recommend that 60% is a good threshold that will yield good FAR
17

and IPR [UW85]. The benefit of this method is that each user has theirown standard deviation. Consistent typists will have a smaller standarddeviation and therefore have a smaller chance of impostors achieving a highvalid digraph percentage. The drawback is that it does not look at all ofthe typing data as a whole. An impostor could have drastically differentdigraph timings than the reference but still have 60% of the timings closeto the reference.
4.2 The Euclidean Distance Method
The Euclidean distance method we used is adapted from the studies con-ducted by Brown and Rogers [BR94]. This method involves calculating thedistance between the claimant and reference vectors. The Euclidean distanceis the sum of the absolute values of the difference between every claimantdigraph timing and every the corresponding reference digraph timing.∑numberOfDigraphs
n=0 |claimaintDigraphn − referenceDigraphn|
For classification, the claimant sample with the shortest Euclidean dis-tance is the best match for the reference profile. For authentication, thethreshold is the minimal distance a claimant sample is away from the ref-erence in order to authenticate. The benefit of this method is that it takesin to account every digraph measurement. The drawback is that the samethreshold is used for every user, regardless of their typing consistency.
4.3 The Ratio Method
The ratio method we used is adapted from a study by Gunetti and Picardi[GP05]. This method closely resembles the standard deviation method inthat it attempts to determine the “validity” of a claimant digraph. Given aclaimant digraph and a reference digraph, the test for validity is to check:
max(claimantT iming, referenceT iming)min(claimaintT iming, referenceT iming)
<= 1.25
For classification, the claimant sample with the largest percentage ofvalid digraphs is the best match for the reference profile. For authentica-tion, the threshold is the percentage of digraphs needed to authenticate.Similar to using the standard deviation method, the ratio method takesinto account individual typing abilities. However, the drawback is that it
18

does not analyze the typing data as a whole. An interesting note is thatGunetti and Picardi recommend the ratio method over the standard devi-ation method because they claim that calculating one standard deviationfor a person’s typing speed in general is not as significant as calculatingthe individual standard deviations for each digraph. However, in order tocalculate a standard deviation for each digraph, each digraph needs to havemultiple entries. The ratio method can be used on digraphs with only onemeasurement, thus taking advantage of as much data as possible.
4.4 The Vector Disorder Method
The vector disorder method we used is adapted from studies by Bergadano,Gunetti, and Picardi [BGP02][GP05].
This method claims to be the best out of all previous research. It in-troduces the novel idea of a relative measure vs. an absolute measure. Theprevious 3 metrics are absolute measures because they depend on the com-parison of absolute timing measurements. Using the vector disorder method,we sort the claimant and reference profiles by the digraph timings. Oncesorted, we calculate the vector disorder using the the following:∑numberOfDigraphs
n=0 |indexOf(claimaintDigraphn)−indexOf(referenceDigraphn)|
Figure 4.1: A example of vector disorder between a reference and claimantfor the typing sample “POMONA”
19

Figure 4.1 gives an visual example of how vector disorder is calculated.The benefit of this metric is that it is extremely robust against variance intyping. The argument being that while your absolute timings might changefrom time to time and when you switch keyboards, your relative timingsremain consistent. You will ideally consistently type “th” faster than say“vz” or some other sort of pattern. The drawback of this metric is thatby simply relying on relative measurements, you have a situation where animpostor typing twice as slowly as the reference profile still authenticate ifthe impostor mimics the relative timing correctly.
4.5 Measure of Success: FAR vs. IPR
The measure of success of keystroke dynamics has been essentially the samefor every study. Every authentication system is tested by creating the refer-ence profiles and then testing every users samples against every other user’sreference to simulate an impostor attack. Additionally, samples not used inthe creation of an user’s reference profile is tested against the reference tosimulate a valid login.
Each of these tests measure how likely the authentication system willreject a result when the person is actually the person who he/she claims tobe and how likely it is to accept a result when the person is an impostor.Different studies have referred to these two errors as: Type I vs. Type IIerrors, False Acceptance Rate vs. False Reject Rate, and False Alarm Ratevs. Impostor Pass Rate. For this study, we refer to these errors as FalseAlarm Rate (FAR) and Impostor Pass Rate (IPR) since these are the termsused in the most current papers.
4.6 Thresholds
FAR and IPR values can be adjusted easily by changing the threshold foraccepting and rejecting users. Different situations require different emphasison FAR or IPR. For our experiment, we decided to graph out the FAR andIPR for each of the analysis methods across 1000 thresholds. These graphsare informative because they give a sense of how sensitive an analysis methodis to threshold adjustment.
We will use the standard deviation method to illustrate our graphingmethod in more detail. Using the standard deviation method, the thresholdof authentication is the percentage of valid digraphs needed to authenticate.To graph across 1000 thresholds, we would need to determine the min and
20

Figure 4.2: A graph of an analysis method that is sensitive to thresholdadjustments
max threshold which would be 0% and 100% in this case. We then divide upthe range between the min and max threshold into 1000 to get a thresholdincrement (0.1%). Then we calculate the FAR and IPR values for the stan-dard deviation method starting with a threshold of 0% and incrementing thethreshold 0.1% each time until we reach 100%. Next, plotting the FAR andIPR values will give us a graph that will resemble Figure 4.2 or Figure 4.3.
Ideally we want our graphs to look like Figure 4.3. Such a graph wouldindicate that that the error rate drops quickly and that both IPR and FARstay low near the EER regardless of threshold changes. A bad analysismethod would have a graph similar to Figure 4.2. This graph shows thatslight changes in the threshold around the EER drastically affect the er-ror rates. Such an analysis method would not be effective in a practicalimplementation.
The argument for why such a method would not be practical is as follows.If in our experiment, we determine that using 60% as the threshold forstandard deviation gets us FAR and IPR of 0%. However we see that at the59% and 61% thresholds, FAR and IPR jump up to 70%. What this indicatesis that the distinction between an impostor and a valid user is incrediblysmall and given the variance of typing in real life, there is essentially nodistinction between an impostor and a valid user. Our 0% would simplybe due to the fact that we found the “magic number” threshold for the
21

Figure 4.3: A graph of an analysis method that is not sensitive to thresholdadjustments
experimental data but not a threshold that would be useable in a generalsetting. Alternatively, if we see that the error rate stays low from the 40%to 80% thresholds, then we could conclude that the 60% threshold would beacceptable in a practical implementation.
In order to make the graph comparisons fair, each of the metrics weregraphed across 1000 thresholds with the min and max thresholds set to thethreshold where IPR was 100% and FAR was 100% respectively.
22

Chapter 5
Results
In this chapter, we present the most relevant graphs for our experiment.The graphs presented in this chapter are scaled according to the method de-scribed in Chapter 4. The scales that were used can be found in Appendix C.General statistics about the typing samples can be found in Appendix D.Additional graphs using different scales can be found in Appendix E.
5.1 Authentication
The following comparisons were done only with key latencies using prede-fined text samples for authentication tests. Each graph depicted shows theIPR graph (starting from 100% going down to 0%) and the FAR graph(starting from 0% and going up to 100%). The IPR graph is always thesmooth one while the FAR graph seems more like a step function. This isbecause given 70 users, we can simulate 4830 impostor attacks while onlysimulating 70 authentic login attempts.
23
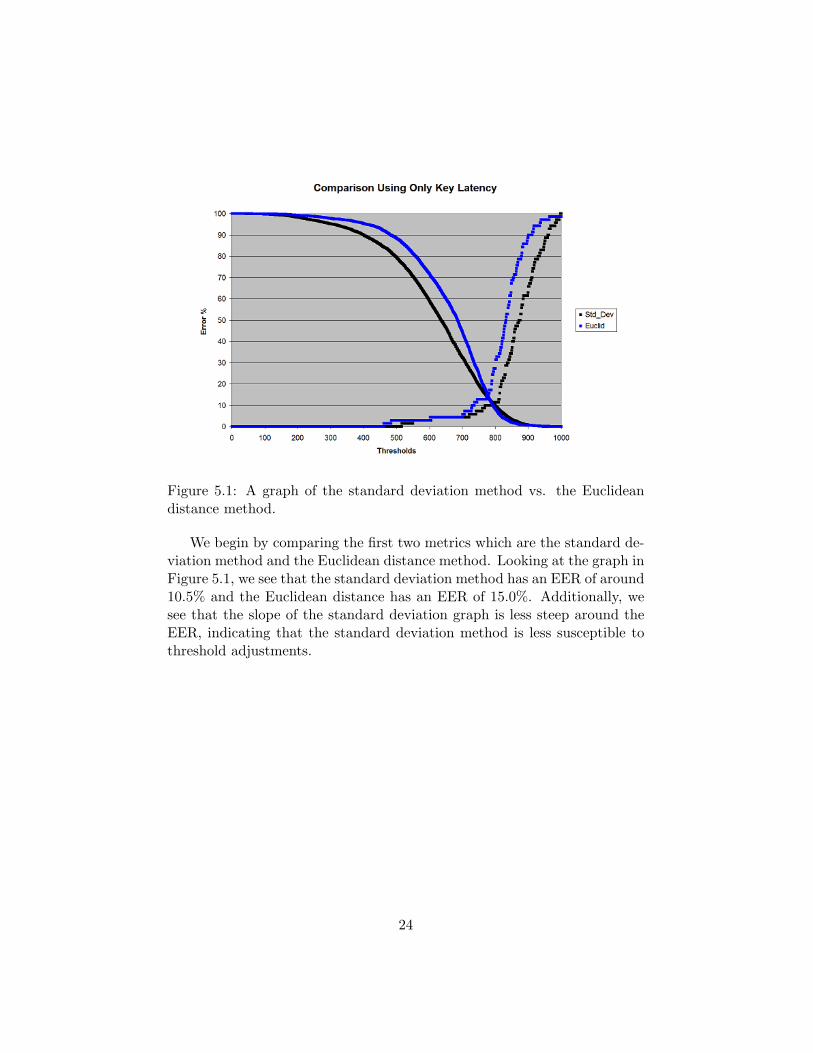
Figure 5.1: A graph of the standard deviation method vs. the Euclideandistance method.
We begin by comparing the first two metrics which are the standard de-viation method and the Euclidean distance method. Looking at the graph inFigure 5.1, we see that the standard deviation method has an EER of around10.5% and the Euclidean distance has an EER of 15.0%. Additionally, wesee that the slope of the standard deviation graph is less steep around theEER, indicating that the standard deviation method is less susceptible tothreshold adjustments.
24

Figure 5.2: A graph of the vector disorder method with 0 entries and with0 entries removed.
Moving on to the vector disorder method, we tested two ideas for theimplementation. The research paper by Bergadano, Gunetti, and Picardiindicate that larger vectors will theoretically yield better results for thevector disorder method [BGP02]. One aspect of our data structure is thateveryone is using large vectors of size 676. However, these vectors tend toend up with numerous zero entries since not every digraph is typed in agiven typing sample. Leaving the zero entries would give us a larger vectorbut might also contaminate some of the vector disorder calculations. Wegraphed both methods to see which implementation was better. Looking atthe graph in Figure 5.2, we see that removing the zero entries reduces theEER from around 31.5% to about 15.5%. Clearly for our data structure,removing the zero entries is the best option.
25
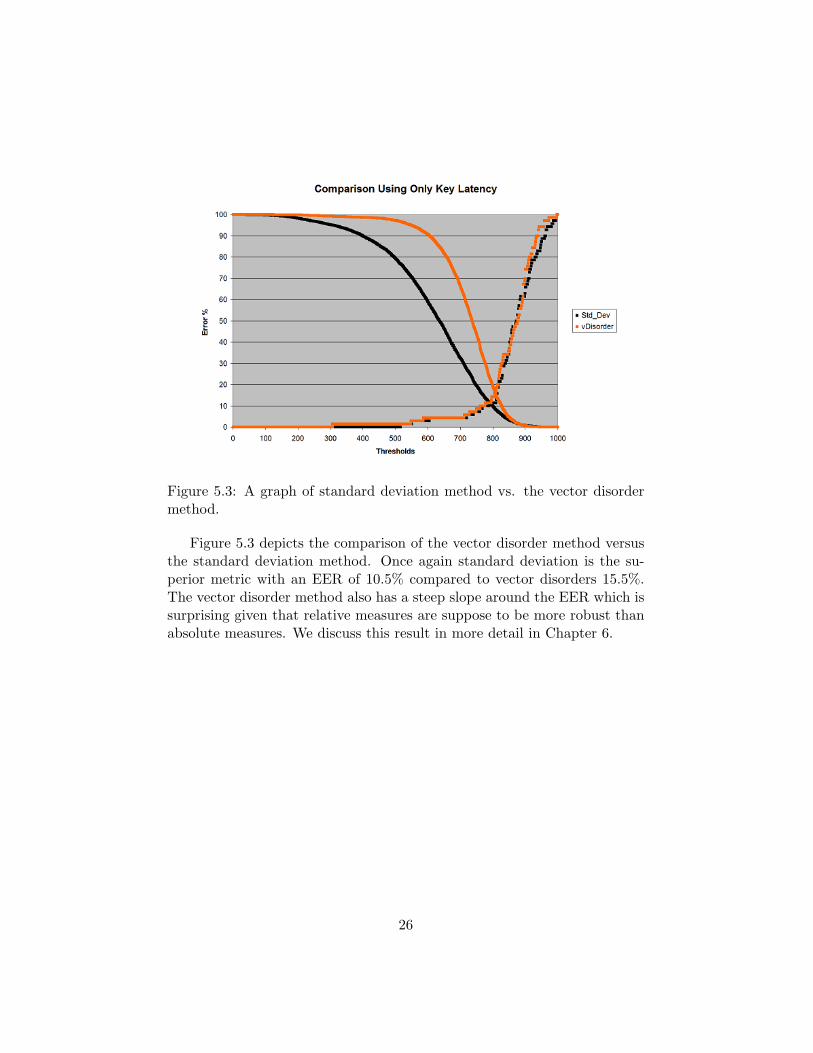
Figure 5.3: A graph of standard deviation method vs. the vector disordermethod.
Figure 5.3 depicts the comparison of the vector disorder method versusthe standard deviation method. Once again standard deviation is the su-perior metric with an EER of 10.5% compared to vector disorders 15.5%.The vector disorder method also has a steep slope around the EER which issurprising given that relative measures are suppose to be more robust thanabsolute measures. We discuss this result in more detail in Chapter 6.
26

Figure 5.4: A graph of the standard deviation method vs. the ratio method.
Finally, we compare the standard deviation strategy against the ratiomethod in Figure 5.4. The ratio method outperforms the standard deviationmethod with an EER around 5.0%. Examining the data more closely, wedetermined that the best possible result we could achieve with the ratiomethod was a FAR of 4.29% and an IPR of 8.55%. The slope near the EER ofthe ratio graph is roughly the same as the standard deviation graph, leadingus to the conclusion that the two metrics are equal in terms of sensitivity tothreshold adjustments. After looking at each metric, we determined that theratio method was the most successful strategy for keystroke authentication.
27

Figure 5.5: A graph of the ratio method using only key latencies versus keylatencies and key durations
Once we determined the best authentication strategy, we looked intouse of keystroke durations and free text analysis. Using keystroke latenciesand keystroke durations we were able to improve the error rates of the ratiomethod slightly. Our best result was a FAR of 4.29% and an IPR of 3.37%.However, the improvement was not overly significant as can be seen in theFigure 5.5. The graphs for the other three metrics had similar results ofonly minor improvements with the addition of keystroke durations.
28

Figure 5.6: A graph of the ratio method on free text authentication.
Free text authentication results were far less successful than predefinedtext authentication. All the error rates were above 50%. The best resultwas once again the ratio method and the graph can be seen in Figure 5.6.We achieved an FAR of 54.55% with an IPR of 42.03% in the best case.
5.2 Classification
Classification ResultsPredefined Text Free Text
Std. Dev. 44.29% 72.72%Euclidean 35.72% 63.64%Ratio 18.57% 54.55%vDisorder 61.43% 100%vDisorder - 0 45.29% 90.91%
Table 5.1: Table of Classification Results
Table 5.1 shows the different error rates achieved for each statistical method.The excessively high error rates of the vector disorder metric without the
29

removal zero entries further strengthens our claim that zero entries need tobe removed in our implementation. The ratio method performed the bestfor classification of both predefined and free text samples. This result firmlyconfirms that the ratio method is the superior of the four metrics. Onesurprising result we saw in classification was that Euclidean distance provedto be a better classifier than the standard deviation metric. We explain ourreasoning for this in Chapter 6
30

Chapter 6
Discussion of Results
The results that we presented in Chapter 5 show that we were able to achieveerror rates on par with the 5% error rates of the studies we reviewed in Chap-ter 2. However, we did have some surprising results and some exceptionallyhigh error rates for some cases. We will proceed to discuss these resultsfurther in this chapter.
6.1 Goals
We want to begin by discussing the four goals we had for this experiment. Wedefinitely achieved our first goal of performing a fair comparison of severalstatistical strategies. Our second goal of examining “global” patterns wasnot as successful. Based on our research, we concluded that such patterns donot exist for the general user. A more detailed discussion of our conclusioncan be found in the later section of this chapter. Our third goal of testing theeffectiveness of our simplified data structure was very successful. In general,we found that our simplified reduction of the typing samples into our datastructure still resulted in the low error rates we presented in Chapter 5.However, the data loss associated with our reduction may have caused thedisappointing performance of the vector disorder method. We discuss thisfurther in the next section. Finally, our fourth goal of emphasizing ideasuseful for practical implementations of keystroke dynamics was fulfilled withthe nature of data collection and our metric of graphing thresholds. Our datacollection did not discriminate between users of varying typing proficiencybecause we believe that any practical authentication system needs to workfor your general user. We also perform minimal pruning of the data andno user samples was completely removed. The method of graphing out
31
thresholds to examine sensitivity to threshold adjustments turned out to bean informative metric that we believe future research should consider.
6.2 Vector Disorder
Our literature review of keystroke dynamics convinced us that the vectordisorder would be the metric with the lowest error rates and the least sen-sitive to threshold adjustments. However, the opposite of this was true.After examining our implementation carefully, we believe that the cause ofthis is that because our data structure is sufficient for maintaining absolutetimings but horrible for maintaining the integrity of relative timing infor-mation. For our experiment, we wanted to make a fair comparison so wemade all the statistical methods to use a standard data structure. Givenmore time, we would want to redesign our data structure to be closer to theimplementation described by Gunetti and Picardi [GP05].
6.3 Classification
In the authentication tests, the rankings of the methods from worst to bestwas: vector disorder, Euclidean distance, standard deviation, and ratio.In the classification tests, the rankings of Euclidean distance and standarddeviation were swapped. We believe that this is because Euclidean distancetakes into account every digraph measurement and therefore examines thetyping sample as a whole. This is mentioned in Chapter 4, and we wantto emphasize again that not looking at a typing sample as a whole cancause problems where 60% of a sample maybe similar but the other 40% isdramatically different. This is mostly likely what happened to the standarddeviation classification method.
6.4 Keystroke Durations
Previous studies that have looked at using keystroke durations have foundthat duration timings are much more accurate for authentication than la-tency timings are. In our experiment we were not able to replicate thissuccess when we used keystroke durations in addition to keystroke latencies.Comparing our study to previous experiments, we think this lack of im-provement is caused by our data structure. When previous studies includedkeystroke duration timings, they effectively doubled the sized of the samplesthey were comparing. With our data structure, adding keystroke durations
32
only adds 26 more entries to a latency vector of size 676. Since keystrokedurations does not give us a significant amount of additional data, it makessense that adding these timings would not significantly improve our resultsthe way it did in previous studies.
6.5 Free Text: Global Patterns
All of the metrics we tested were not able to achieve good results whenwe tested free text authentication. This led us to conclude that “global”typing patterns do not exist for the average user. Careful examination ofthe graphs in Chapter 5 did make us think that “global” patterns may existfor certain individuals. Looking at Figure 5.4, we see that the ratio methodgraph is essentially the standard deviation graph shifted left and down. Thismake sense given the similarity of the two metrics and how they’re trying tomaximize number of valid digraphs. The ratio is simply a better definition of“valid”. The almost identical slopes of the two metrics in this figure howeverhint at the fact that the same users may be the cause of the same errors. Ifthis is the case, this tells us that certain users simply do not have consistentenough typing for keystroke dynamics to work successfully. The inclusion ofthese inconsistent users in our data set can skew our results to have highererror rates. Previous free text studies have achieved results of FAR and IPRof below 5% [GP05]. Our failure to replicate this success could be the sideeffect of us not controlling the quality of the typists that participated.
33

34

Chapter 7
Future Work
We are satisfied with the progress that was made in this experiment but wealso have several ideas for future research. Not only would more research im-prove keystroke dynamics commercial products, any work done in keystrokedynamics can also be used to aid the research of other behavioral biometricresearch. Every behavioral biometric authentication scheme essentially istrying to find a way of representing a reference and comparing a claimantsample against the reference. The latest behavioral biometric that has beensuggested is gait-based authentication[GSB07], where users can be identifiedand authenticated based on how they walk. We wish to emphasize that thefollowing proposed ideas can easily be applied behavioral biometric researchin general.
7.1 Improved Data Collection
One of the many problems is that there has been a lack of “real” typingdata collected. Every experiment so far has always involved asking the userto type in a controlled situation. The closest to “real” data collection sofar are the Robinson et al. study [RLCM98] that recorded login strings andthe Gunetti and Picardi study on free text [GP05]. We believe that futureexperiments should look into having volunteers install keystroke loggers ontheir computers so that their every day use of computers can be logged.This would have two immediate benefits. One, the amount of data gatheredwould be significantly larger than any previous experiment and would alsoallow researchers to make claims about “global” patterns that exist in usersregardless what typing situation they are in. Two, it would eliminate theuser complaint factor. It’s extremely difficult to get users to sit down and
35

submit good typing data for long periods of time. Additionally, in practicalsituations, it is unlikely that users will be willing to spend 20 minutes cre-ating a typing profile so they can authenticate. In our experiment, only 2users told us that they enjoyed the experiment (they liked the typing samplechoice) with the majority of users complaining about the length of the datacollection when they’ve gotten through about half the experiment. Thisleads us to our next research idea of user acceptance.
7.2 User Acceptance
The idea proposed in the previous section about installing keystroke loggersmay raise some privacy concerns from researchers. We should consider thatif we can’t convince volunteers in an experiment to install a keystroke logger,how likely is it that an average user would be willing to install a keystrokelogging authentication system on their computers? To our knowledge, nostudy has been conducted on user attitudes towards a keystroke authenti-cation system. Additionally we need to gauge how much annoyance an usercan tolerate for authentication. What level of false alarms is tolerable by anuser? How long of a typing sample are users willing to submit to authenti-cate? How long are users willing to spend to create the reference profiles?These are all important questions that need to be answered if keystrokedynamics authentication is to gain wide-spread acceptance.
7.3 Dynamic Authentication
The idea of dynamic authentication has been mentioned and discuss in sev-eral papers but in order to truly test and implement such a system, thereneeds to be long term keystroke logging of users. Current commercial prod-ucts such as Biopassword [CMD+] only perform static authentication. Anystudy that looks at dynamic authentication will need to adopt a similar datastructure that we used in our experiment and have volunteers commit to theexperiment for a long period of time.
7.4 Conclusion
In conclusion, this experiment has convinced us that keystroke dynamics is aviable technology that can definitely be improved on. While our results werenot spectacular, the fact that we were able to replicate the results describedin previous studies eliminates a lot of our earlier skepticism. However, we
36

believe that keystroke dynamics is still in the theoretical stages and no wherenear practical success yet.
37

38
Appendix A
Glossary of Key Terms
Authentication Given a new typing sample X. “X is claimed to belong touser U. The system must decide if this is true or false. X may belongto U, to another known user, or to someone else (whose typing habitsare) completely unknown to the system.” [GP05]
Claimant Claimant Vector, Claimant Sample, etc . . . The typing samplethat we take in and compare to against a reference. It is a samplefrom someone “claiming” an identity and we need to verify this claim.
Classification Given a new typing sample X. “X comes from one of theknown users. The system must find who actually provided the sample.”[GP05]
Digraph A two keystroke combination. Sometimes used to refer to the tim-ing of that keystroke combination. The timing of a digraph is definedas the time elapsed from the release of the key and the depression ofthe second key. See Key Latency
EER Equal Error Rate. The point where FAR and IPR are equal.
FAR False Alarm Rate. An error rate that represents how often a FalseAlarm occurs. A False Alarm is when a valid user logging in is rejected.
Identification Given a new typing sample X. “X is presented to the system.The system has two possible answers: (a) X belongs to user U; or (b)X belongs to someone unknown. As in the case of authentication, Xmay, in fact, belong to one of the known users, or to someone unknownto the system.” [GP05]
39

IPR Impostor Pass Rate. An error rate that represent how often an Im-postor Pass occurs. An Impostor Pass is when an impostor attemptsto login and is accepted.
Key Duration The amount of time a key is depressed for. It is calculatedas the time elapsed from when the key is first depressed to the time itis released.
Keystroke Dynamics The timing information that describes when keysare depressed and released. Sometimes also used to signify the idea ofusing the timing information for authentication/identification.
Key Latency The time elapsed from the release of the first key and thedepression of the second key
Over-Fitting A situation where a method is modified to the point whereit achieves near perfect results for the experimental data. However,this optimized method does not work successfully given a new set ofdata.
Reference Reference Vector, Reference Profile, etc . . . The sample storedon file as the “authentic” typing sample. The reference is submittedby the user initially and is used to determine the validity of a ClaimantSample. Validity is determined by how similar/close the Claimant isto the Reference. The closer the better.
Trigraph A three keystroke combination. The timing of trigraph is definedas the time elapsed from the release of the first key to the depressionof the third key.
40

Appendix B
Data Collection:Supplemental
Some supplemental info about the data collection aspect of the experiment
Figure B.1: A screenshot of the web application we implemented
The following is a small sample of what users were asked to type
41

• Operator. Give me the number for 911.
• Oh, so they have internet on computers now.
• Bart, with $10,000, we’d be millionaires. We could buy all kinds ofuseful things like...love.
• Just because I don’t care doesn’t mean I don’t understand.
• I’m normally not a praying man, but if you’re up there, please saveme superman.
• You know, boys, a nuclear reactor is a lot like a woman. You just haveto read the manual and press the right buttons.
• Lisa, if you don’t like your job you don’t strike. You just go in everyday and do it really half-assed. That’s the American way.
• When will I learn? The answer to life’s problems aren’t at the bottomof a bottle, they’re on TV!
• Son, when you participate in sporting events, it’s not whether you winor lose: it’s how drunk you get.
• I’m going to the back seat of my car, with the woman I love, and Iwon’t be back for ten minutes!
42

Appendix C
Scale of Graphs
These are the scales used for the graphs in Chapter 5
Scales100% IPR 100% FAR Threshold Increment
Std. Dev. 0.074 0.705 0.000631Euclidean 31155 7900 -23.255Ratio 0.083 0.703 0.000620vDisorder 0.214 0.107 -0.000107vDisorder - 0 0.694 0.240 -0.000454
Table C.1: Scales for graphs
43

44

Appendix D
Database Statistics
The following is some statistical data about the digraph timings. Numberof times a digraph was typed refers to the maximum number times thatdigraph was typed in one sample. The units of measure for the timing datais milliseconds.
45

Minimum Digraph Time: 1Maximum Digraph Time: 500
REFERENCE PROFILE DATABASE STATISTICSNumber of users in database: 70Average Number of digraphs typed out of 676: 317.542857143Digraph typed the most: thNumber of times th was typed: 54Average Number of digraphs users typed: 1784.44285714Average Number of keystrokes typed out of 26: 23.7714285714Average Keystroke Duration: 121.399490048
CLAIMANT SAMPLES DATABASE STATISTICSNumber of users in database: 70Average Number of digraphs typed out of 676: 296.471428571Digraph typed the most: thNumber of times th was typed: 51Average Number of digraphs users typed: 1501.2Average Number of keystrokes typed out of 26: 23.8857142857Average Keystroke Duration: 127.092522121
FREE TEXT SAMPLES DATABASE STATISTICSNumber of users in database: 11Average Number of digraphs typed out of 676: 152.0Digraph typed the most: thNumber of times th was typed: 26Average Number of digraphs users typed: 333.727272727Average Number of keystrokes typed out of 26: 21.7272727273Average Keystroke Duration: 74.578198301
Table D.1: Database Statistics
46

Appendix E
Additional Graphs
The following graphs are on the scales of minimum possible score to maxi-mum possible score. For example, with the Euclidean distance, the minimumpossible distance is 0 and the maximum distance would be 676 multiplied bymaximum allowed digraph time. The IPR graph is the smooth curve thatstarts at 100% and declines. The FAR graph is the dotted curve that startsat 0% and increases.
Figure E.1: A graph of the standard deviation method scaled from 0% to100%
47

Figure E.2: A graph of the Euclidean distance method scaled from 0 to338000
Figure E.3: A graph of the ratio method scaled from 0% to 100%
48

Figure E.4: A graph of the vector disorder method scaled from a normalizeddisorder of 1.0 to 0.0
49

50

Bibliography
[BGP02] Francesco Bergadano, Daniele Gunetti, and Claudia Picardi.User authentication through keystroke dynamics. ACM Trans.Inf. Syst. Secur., 5(4):367–397, 2002.
[Bis03] M. Bishop. Computer Security: Art and Science. Addison-Wesley Professional, 2003.
[BR94] M. Brown and S.J. Rogers. A practical approach to user au-thentication. Computer Security Applications Conference, 1994.Proceedings., 10th Annual, pages 108–116, 5-9 Dec 1994.
[BSB02] J. Bechtel, G. Serpen, and M. Brown. Passphrase authentica-tion based on typing style through an ART 2 Neural Network.International Journal of Computational Intelligence and Appli-cations, 2(2):131–152, 2002.
[CF07] N.L. Clarke and S.M. Furnell. Authenticating mobile phone usersusing keystroke analysis. International Journal of InformationSecurity, 6(1):1–14, 2007.
[CHHK00] S. Cho, C. Han, D.H. Han, and H.I. Kim. Web-Based KeystrokeDynamics Identity Verification Using Neural Network. Jour-nal of Organizational Computing and Electronic Commerce,10(4):295–307, 2000.
[CMD+] K. Code, S. Mani, D.M. D’Andrea, V.P. Images, LLC BioPass-word, and P. Class. Method and apparatus for multi-model hy-brid comparison system.
[Cou] F.F.I.E. Council. FFIEC guidance: Authentication in an Inter-net banking environment, Oct. 2005.
[Gar86] J.D. Garcia. Personal identification apparatus, November 41986. US Patent 4,621,334.
51
[GLPS80] R. Gaines, W. Lisowski, S. Press, and N. Shapiro. Authentica-tion by Keystroke Timing: Some Preliminary Results. Technicalreport, Report R-256-NSF. Rand Corporation, 1980.
[GP05] Daniele Gunetti and Claudia Picardi. Keystroke analysis of freetext. ACM Trans. Inf. Syst. Secur., 8(3):312–347, 2005.
[GSB07] D. Gafurov, E. Snekkenes, and P. Bours. Spoof Attacks onGait Authentication System. Information Forensics and Secu-rity, IEEE Transactions on, 2(3 Part 2):491–502, 2007.
[HLC06] S. Hwang, H. Lee, and S. Cho. mproving AuthenticationAccuracy of Unfamiliar Passwords with Pauses and Cues forKeystroke Dynamics-Based Authentication. WISI, pages 73–78,2006.
[JG] R. Joyce and G. Gupta. Identity Authentication Based onKeystroke Latencies.
[KC07] S. Karatzouni and N. Clarke. Keystroke Analysis for Thumb-based Keyboards on Mobile Devices. International Federationfor Information Processing Publications, 232:253, 2007.
[LW88] J. Leggett and G. Williams. Verifying identity via keyboardcharacteristics. Int. J. Man-Machine Studies, 28(1):67–76, 1988.
[LWU89] J. Leggett, G. Williams, and D. Umphress. Verification of useridentity via keystroke characteristics. Human Factors in Man-agement Information Systems, 1989.
[MR97] Fabian Monrose and Aviel Rubin. Authentication via keystrokedynamics. In CCS ’97: Proceedings of the 4th ACM conferenceon Computer and communications security, pages 48–56, NewYork, NY, USA, 1997. ACM.
[MRW02] F. Monrose, M.K. Reiter, and S. Wetzel. Password hardeningbased on keystroke dynamics. International Journal of Informa-tion Security, 1(2):69–83, 2002.
[OS97] M.S. Obaidat and B. Sadoun. Verification of computer usersusing keystroke dynamics. Systems, Man, and Cybernetics, PartB, IEEE Transactions on, 27(2):261–269, Apr 1997.
52

[PB07] H.J. Postley and S.S. Bender. Key sequence rhythm recognitionsystem and method, April 17 2007. US Patent 7,206,938.
[Pol97] D. Polemi. Biometric Techniques: Review and Evaluation of Bio-metric Techniques for Identification and Authentication. Insti-tute of Communication and Computer Systems, National Tech-nical University of Athens, April, 1997.
[RLCM98] J.A. Robinson, V.W. Liang, J.A.M. Chambers, and C.L.MacKenzie. Computer user verification using login stringkeystroke dynamics. Systems, Man and Cybernetics, Part A,IEEE Transactions on, 28(2):236–241, Mar 1998.
[UW85] D. Umphress and G. Williams. Identity verification through key-board characteristics. INT. J. MAN MACH. STUD., 23(3):263–274, 1985.
[YH89] J.R. Young and R.W. Hammon. Method and apparatus for ver-ifying an individual’s identity, February 14 1989. US Patent4,805,222.
53