identifying mood by analysing keystroke dynamics mood by analysing keystroke dynamics undergraduate...
TRANSCRIPT

Identifying Mood by Analysing
Keystroke Dynamics
Undergraduate Awards Submission
29 April 2016
Redactions were made in this paper where name = ****.
2
Abstract
The aim of this paper is to investigate the possibility that intelligent systems could be used to
recognise different human moods. A large amount of research has been done in recent years
that demonstrates how keystroke dynamics can be used to confirm an individual’s identity.
Certain characteristics and timings of keystroke rhythm have been found to be as unique as
handwriting. The question posed by this paper is whether or not these unique characteristics
change in such a manner that it is then possible to identify mood.
An application was developed to address this question. This application executes in the
background and records a user’s keystroke data and corresponding mood. Ten participants
were monitored over a number of weeks resulting in datasets being collected ranging from 10
to 60 thousand different keystrokes. The data obtained was then evaluated using a large
variety of different classifiers. The eight best performing classifiers produced error rates
ranging from 0.155 to 0.567 on three target features. The initial application was modified to
use a combination of the three best performing classifiers to return a prediction of the
individual’s mood on the fly.

3
Table of Contents 1 Introduction ........................................................................................................................ 7
1.1 Introduction ............................................................................................................. 7
1.2 Project Overview ..................................................................................................... 7
1.2.1 Mood Detection Application................................................................................ 7
1.2.2 Research Element................................................................................................. 7
1.3 Project Objectives .................................................................................................... 7
1.4 Project Challenges ................................................................................................... 8
1.4.1 Feature Choice ..................................................................................................... 8
1.4.2 Data Recording .................................................................................................... 8
1.4.3 Data Pre-Processing ............................................................................................. 8
1.4.4 Data Evaluation .................................................................................................... 8
1.4.5 Predicting Mood................................................................................................... 9
1.5 Report Structure ....................................................................................................... 9
1.5.1 Research ............................................................................................................... 9
1.5.2 Design .................................................................................................................. 9
1.5.3 Architecture and Development ............................................................................ 9
1.5.4 Testing and Evaluation ........................................................................................ 9
1.5.5 Conclusion ........................................................................................................... 9
2 Research ............................................................................................................................ 10
2.1 Introduction ........................................................................................................... 10
2.2 Affective Computing ............................................................................................. 10
2.3 Keystroke Dynamics.............................................................................................. 10
2.4 Machine learning ................................................................................................... 11
2.5 Academic Research ............................................................................................... 11
2.6 Research Risk to Users .......................................................................................... 13
2.7 Existing Solutions to Mood Identification............................................................. 13
2.8 Weka ...................................................................................................................... 13
2.9 Evaluation Approach – Cross Validation .............................................................. 14
2.10 Classifiers .............................................................................................................. 15
2.10.1 Bagging with REP Tree ..................................................................................... 15
2.10.2 Support Vector Machine .................................................................................... 15
2.10.3 J48 ...................................................................................................................... 16
2.11 Balancing Data – SMOTE ..................................................................................... 16
2.12 Java Key Logging Functionality............................................................................ 16

4
3 Design ............................................................................................................................... 17
3.1 Introduction ........................................................................................................... 17
3.2 Use Cases ............................................................................................................... 17
3.2.1 User Use Case Overview ................................................................................... 17
3.2.2 View Application Information ........................................................................... 18
3.2.3 Pause / Resume Key Logging ............................................................................ 18
3.2.4 Make Prediction ................................................................................................. 19
3.2.5 Set Mood ............................................................................................................ 19
3.2.6 Developer Use Case Overview .......................................................................... 20
3.2.7 Data Analysis ..................................................................................................... 20
3.2.8 Create Error Rate Report ................................................................................... 21
3.2.9 Set Application Variables .................................................................................. 21
3.3 Storage Design ....................................................................................................... 22
3.3.1 Key Data CSV.................................................................................................... 22
3.3.2 ARFF Dataset..................................................................................................... 22
3.3.3 Log File .............................................................................................................. 23
3.3.4 Error Rate File.................................................................................................... 23
3.4 User Interface Design ............................................................................................ 23
3.4.1 Application Functionality .................................................................................. 23
3.4.2 Request Mood Prompt ....................................................................................... 24
3.4.3 Application Information..................................................................................... 24
3.4.4 Prediction Prompt .............................................................................................. 25
3.5 Source Code Layout .............................................................................................. 25
3.5.1 Application Controller ....................................................................................... 25
3.5.2 Data Analysis Controller.................................................................................... 25
3.5.3 Keystroke Log .................................................................................................... 26
3.5.4 Storage Layer ..................................................................................................... 26
3.5.5 User Interface Classes ........................................................................................ 26
4 Architecture and Development ......................................................................................... 26
4.1 Introduction ........................................................................................................... 26
4.2 Technical Architecture and Diagram ..................................................................... 26
4.3 Challenges Overcome ............................................................................................ 27
4.3.1 Research Endeavour........................................................................................... 27
4.3.2 Collecting Data .................................................................................................. 27
4.3.3 Mood Prediction................................................................................................. 27
5
4.3.4 Skewed Datasets ................................................................................................ 27
4.4 Key Development Components ............................................................................. 28
4.4.1 Mood Prediction................................................................................................. 28
4.4.2 Key Stroke Logging ........................................................................................... 29
4.4.3 Data Analysis ..................................................................................................... 30
4.4.4 Data Preprocessing............................................................................................. 31
4.4.5 Application Flow ............................................................................................... 31
4.5 External APIs ......................................................................................................... 33
4.5.1 Weka .................................................................................................................. 33
4.5.2 Keyboard Hook .................................................................................................. 33
5 Testing and Evaluation ..................................................................................................... 34
5.1 Introduction ........................................................................................................... 34
5.2 Error Rate Report ................................................................................................... 34
5.2.1 ZeroR Comparison ............................................................................................. 35
5.2.2 Balanced Comparison ........................................................................................ 36
5.2.3 Classifier Comparison ........................................................................................ 37
5.2.4 Classification Future Research. ......................................................................... 37
5.3 Confusion Matrix Comparison .............................................................................. 38
5.4 User Testing ........................................................................................................... 39
6 Conclusion ........................................................................................................................ 40
6.1 Introduction ........................................................................................................... 40
6.1.1 Results ................................................................................................................ 40
6.1.2 Future Work ....................................................................................................... 40
7 Bibliography ..................................................................................................................... 42

6
Table of Figures Figure 1: Keystroke features: Dwell Time and Flight Time [7] .............................................. 11 Figure 2: Recognition rate of emotional category negative and positive [22] ......................... 12 Figure 3: Variation of typing speed for positive and neutral emotional states [22] ................ 12 Figure 4: User Use Case Overview .......................................................................................... 17
Figure 5: Application Information Use Case ........................................................................... 18 Figure 6: Pause/Resume Use Case ........................................................................................... 18 Figure 7: Make Prediction Use Case ....................................................................................... 19 Figure 8: Set Mood Use Case .................................................................................................. 19 Figure 9: Developer Use Case Overview................................................................................. 20
Figure 10: Data Analysis Use Case ......................................................................................... 20 Figure 11: Error Rate Report Use Case ................................................................................... 21 Figure 12: Set Run Variable Use Case .................................................................................... 21 Figure 13: Storage Design Overview ....................................................................................... 22
Figure 14: Key Data File Example .......................................................................................... 22 Figure 15: Dataset Arff File Example ...................................................................................... 22 Figure 16: Log File Example ................................................................................................... 23
Figure 17: Error Rate File Example ......................................................................................... 23 Figure 18: Tray Icon Options ................................................................................................... 23 Figure 19: Request Mood GUI Choice .................................................................................... 24 Figure 20: Application Info GUI Choice ................................................................................. 25
Figure 21: Prediction Prompt GUI ........................................................................................... 25 Figure 22: Technical Architecture Diagram ............................................................................ 26
Figure 23: MoodPrediction.java .............................................................................................. 28 Figure 24: MoodPrediction.java .............................................................................................. 28 Figure 25: KeystrokeLog.java ................................................................................................. 29
Figure 26: KeyData.java .......................................................................................................... 29 Figure 27 DataAnalysis.java .................................................................................................... 30
Figure 28: DetailedAnalysis.java ............................................................................................. 30 Figure 29: BuildTestData.java ................................................................................................. 31
Figure 30: ApplicationController.java ..................................................................................... 31 Figure 31: BuildTrayIcon.java ................................................................................................. 32 Figure 32: CurrentMood.java................................................................................................... 32 Figure 33: CurrentMood.java................................................................................................... 32
Figure 34: BuildTrayIcon.java ................................................................................................. 33 Figure 35: Testing Approach ................................................................................................... 34 Figure 36: Error Rate Results .................................................................................................. 34 Figure 37: Classifier vs. ZeroR Comparison ........................................................................... 35 Figure 38: Balanced vs. Unbalanced Data ............................................................................... 36
Figure 39: Classifier Comparison ............................................................................................ 37 Figure 40: Average Error Rate ................................................................................................. 37
Figure 41: Confusion Matrix Comparison ............................................................................... 38 Figure 42: Randomised Target Feature Comparison ............................................................... 38

7
1 Introduction
1.1 Introduction This chapter details a basic overview of the project as a whole. It highlights the challenges
that were overcome in the completion of the project. It clearly states the objectives of the
project and the layout of this report.
1.2 Project Overview
1.2.1 Mood Detection Application An application has been developed to record the duration of certain characteristics of a user’s
typing. The application process flow can be in one of two states based on whether or not
enough training data has been recorded. In Training State, the application requests the user to
state their mood at a pre-set intervals. In Prediction State, the application attempts to predict a
user’s mood based on their current keystroke dynamics, the user is then requested to confirm
the success of the prediction. The dataset obtained is evaluated on the fly and the classifier
algorithm with the best result is chosen to attempt to predict the individual’s mood. The
application has built in functionality which allows users to pause keystroke logging or view
detailed information about current processes.
1.2.2 Research Element This paper investigates the possibility that data obtained from keystrokes could be used to
predict an individual’s mood. The data obtained from users has been evaluated using a
number of the most renowned modern artificial intelligence classifier algorithms. The
evaluation method used to test these classifiers has been Cross Validation using 10 folds. The
results from this evaluation have been compared by calculating certain values such as
Precision, Recall, F-Measure, Error Rate and a Confusion Matrix. The evaluation results have
shown that there is a link between mood and keystroke data. This was deduced by calculating
the difference in error rate between using a ZeroR classifier, which predicts the
majority target feature, and a number of other classifiers. It was found that, when the dataset
was sufficiently balanced, the chance of a classifier predicting an individual’s mood was far
greater than just random chance.
1.3 Project Objectives The objective of this project is to discover if it is possible to identify an individual’s mood by
analysing their keystrokes. To achieve this, an application has been developed that records
keystroke and mood data. The data has been recorded in a format that is easily accessible for
use in a wide range of evaluation approaches. The application can be used for further study in
the area, and to verify the conclusions drawn in this experiment.
The secondary object of this project is to develop an application that an everyday user can
operate and find beneficial. The application runs in the background with minimal interference
to the user’s normal computer use. The application can inform the user when their mood has
changed. With the emergence of smart technology, a solution like this could enable systems
to make better decisions about how to interact with their users. Developers could build on the
application’s functionality to develop an application that could be used to assist people with
mood disorders, such as bipolar disorder.
8
1.4 Project Challenges This section highlights the main challenges that were considered when completing this
project.
1.4.1 Feature Choice Research and careful consideration were needed to decide which features would be most
suitable for noticing differences in mood. A large amount of testing was required with
different combinations of features until a satisfactory feature list was devised. The final list
comprises of six features, including both nominal and numerical features.
The target feature choice also required a large research effort. Initially, it was thought to have
five different values for the target feature. However after reconsidering, it was decided that
three would be more suitable because of limitations of data collection and the total number of
possible keystroke dynamic features available. The three target features chosen for definitions
of mood were: Positive, Normal and Negative.
1.4.2 Data Recording Key logging is a very dubious process in the modern computer world, especially when the
application is active in the background while a user is in normal computer use. The main
challenge was that while the application was running it would record all passwords and
personal correspondence. It was important to put users at ease by implementing safety
features. Functionality was added to allow users to pause and resume key logging when
required. All recorded data was randomised so that the output file did not store data in an
ordered format. The output file was visible and accessible to the user at all times, and this file
could be deleted at any time by the user. Another challenge for the recording of data was to
be able to record correct timings even when two keys were simultaneously pressed. An
algorithm was created which monitors the first and second keys pressed and each of the
timings involved in the press. Features were then calculated from these, the data processed
and then stored on disk.
1.4.3 Data Pre-Processing Nearly all data that was collected had a heavy skew to a particular one of the three target
features. As a result of this skew, classifiers which merely predicted the majority target value
returned best results. Many different methods for balancing a dataset were researched and
examined. It was found that resampling the dataset by applying the Synthetic Minority
Oversampling Technique achieved best results. An iterative development process was
required to decide the maximum amount of rows which could be added to rebalance the
dataset. The algorithm created for this process involved checking the size of the balanced
dataset in relation to the original size of the dataset. If the difference in size was found to be
greater than a certain defined value, the data balancing stopped.
1.4.4 Data Evaluation The datasets obtained from application users was evaluated using 10 fold cross validation.
The results were analysed to investigate whether or not the data contained qualities which
could be used to identify a user’s mood. Another challenge was to compare evaluation results
obtained from many different classifiers in an attempt to narrow down the number of
classifiers which should be considered. To make these comparisons the number of correctly
classified instances as well as the resulting conclusion matrix were compared. The eight best
preforming classifiers were chosen to be examined in more detail. An error rate report was
generated which displayed the error rate obtained for each of the eight classifiers on each

9
dataset. The report was then used to narrow the selection to the three best preforming
classifiers.
1.4.5 Predicting Mood The challenge was to enable the application to predict mood and to run the appropriate
algorithms in the background while the application continued in normal use. The applications
first task is to evaluate and choose the most successful classifier to be used to classify the
user’s dataset. It achieves this by comparing evaluation results of three different classifiers.
The classifier which returns the lowest error rate is then trained using the dataset previously
obtained from the user. The trained classifier is then used to classify which mood the most
recently recorded keystroke most closely corresponds with.
1.5 Report Structure This section outlines a basic overview of the main elements of the report.
1.5.1 Research This section presents research into key areas of the project such as keystroke analysis and
affective computing. Previous academic research which focuses on a similar hypothesis as
this paper is also explored. It contains research into the Java API’s used throughout the
project. The main classifiers which the application uses are examined in detail. This section
concludes with research into other solutions for identifying mood which currently exist.
1.5.2 Design This chapter examines the development methodology and design aspects of the project. It
also discusses and demonstrates the development use cases, storage design and user interface
design.
1.5.3 Architecture and Development This chapter discusses the architecture of the application and the challenges overcome in its
development. It highlights key development components which were necessary for the
application to function.
1.5.4 Testing and Evaluation This chapter discusses how different testing approaches were undertaken throughout the
development lifecycle to ensure that the application was as user friendly as possible while
still collecting useful data. The main classifier evaluation techniques and results are also
discussed.
1.5.5 Conclusion This chapter discusses the results obtained on completion of this project and the conclusion
that can be drawn from them. It aims to predict how the work can be improved and continued
into the future.

10
2 Research
2.1 Introduction This section presents research into key areas of the project such as keystroke analysis and
affective computing. Previous academic research which focuses on a similar hypothesis as
this paper is also explored. It contains research into the Java API’s used throughout the
project. The main classifiers which the application uses are examined in detail. This section
concludes with research into other solutions for identifying mood which currently exist.
2.2 Affective Computing There has been a wide range of research done to try to determine human emotions using
different computing techniques. This area of study is known as affective computing, and it
aims to develop systems and devices that can “recognize, interpret, process, and simulate
human affects. It is an interdisciplinary field spanning computer science, psychology, and
cognitive science.”[1] Affective computing mainly focuses on human speech and facial
expression as a way to identify emotions. In cognitive science and neuroscience there have
been attempts to classify emotions using either the continuous or the categorical model. The
continuous model is applied to analyse facial expression, “it defines each facial expression of
emotion as a feature vector in a face space.” [2] The model aims to measure different
intensities of emotion. In contrast, the categorical model does not use a scale of intensities,
but rather creates discrete categories. [2] Speech recognition software has been used to
identify a person’s state using the fact that the autonomic nervous system can alter speech.
The software developed in this area analyses speech patterns using vocal parameters, such as
pitch and speech rate. Research into speech recognition suggests that it is still an ambivalent
way of identifying emotions, one example having an average success rate of 63%. [3]
2.3 Keystroke Dynamics Keystroke dynamics is the study of the manner and rhythm in which a person types
characters on a keyboard. It attempts to identify unique timing patterns and to create a
biometric template of the user’s typing. [4] Keystroke dynamic research has been used to
develop authentication systems that can identify an individual based on their typing patterns.
In security, keystroke dynamics is often used together with user name and password
authentication, as a form of multifactor authentication. [5] Multifactor authentication can
greatly increase the security of a system, however it can cause usability issues. The basic
measurements used for keystroke dynamics are known as Dwell time and Flight time. Dwell
time is the measure of the duration that a key is pressed. Flight time is the measure of the
duration between releasing a key and pressing a new one. [5] Research has been done to
prove that, similar to handwritten signatures, an individual’s typing pattern is sufficiently
unique for them to be identified. [6]

11
Figure 1: Keystroke features: Dwell Time and Flight Time [7]
The basic equations for Dwell and Flight time are as follows.
Dwell Time (D1) = Key1 Release time (R1) – Key1 Press time (P1)
Flight Time (D2) = Key2 Press time (P2) – Key1 Press time (P1)
Flight Time (D3) = Key2 Press time (P2) – Key1 Release time (R1)
Flight Time (D4) = Key2 Release time (R2) – Key1 Release time (R1) [7]
It is important to note the possibility of D3 and D4 being a negative number. In the case of
flight time (D3), this would occur if P2 was pressed before R1 was released.
2.4 Machine learning Machine learning is a subject in computer science that grew out of the study of pattern
recognition and computational learning theory in artificial intelligence. [8] It aims to
construct algorithms that can learn from and make predictions on data. A model is created
from example inputs in order to make data driven decisions and predictions. [9] Machine
learning techniques such as artificial neural network, association rule learning, hierarchical
clustering and cluster analysis are commonly used in computer science. It is possible to use a
classification algorithm, such as the decision tree or a support vector machine model, for
analysis of keystroke dynamics for user authentication. [17, 18] The decision tree algorithm
employs a simple flowchart-like approach. It has been described as being a simple low-cost
solution for keystroke dynamic analyses. [10, 18] A number of other solutions use a Support
Vector Machine classifier, to compare the patterns of different users’ keystroke dynamics, in
an attempt to identify the user. [19]
2.5 Academic Research In 2011, the author published a master’s thesis in which he investigated the possibility of
identifying emotional states using keystroke dynamics. [10] As part of the project he
conducted a field study from July to October, 2009 with twenty-six participants. A data
collection application written in C# was installed on each of the participant’s computers.
Dwell and flight time were recorded from key presses, and extensive processing was used to
group these into graphs of 2 or 3 symbols. A combination of the user’s overall keystroke
dynamics, digraph (2 symbols) and trigraph (3 symbols) were analysed together to identify
the user’s mood. The study concluded that it was possible to determine user emotion by
analysing the rhythm of users’ typing patterns. It recorded accuracies for identifying
confidence, hesitance, sadness and nervousness ranging from 77.4 to 87.8%. [10] The
researchers involved with this project were contacted. The author, stated that the research
code for this project was unmaintained and no longer compiled.

12
An experiment was conducted in 2010 by Preeti Khanna and M.Sasikumar to investigate the
possibility of recognising emotions from keyboard stroke patterns. [23] They started their
experiment with an empirical study that involved 300 users of varying educational
backgrounds answering questions on how they typed. The results showed that 88% of
participants agreed that they type normally when they are in a neutral state. 62% of
participants said that their typing speed increases when in a positive emotional state. They
developed a program to capture parameters that they hoped would give an indication of
emotional state. They used classification algorithms, such as simple logistics, SMO, J48,
Multilayer Perceptron, BF Tree and Random Tree, to analyse the data. Their experiments
achieved the following results.
Figure 2: Recognition rate of emotional category negative and positive [22]
This experiment concluded showing that 70% of users decrease typing speed in a negative
emotional state, while 83% of users increase typing speed in a positive emotional state.
Figure 3: Variation of typing speed for positive and neutral emotional states [22]
An amount of research has been done in the security authentication area to see whether it is
possible to recognise a user, based solely on their mouse movements. [21] There are
conflicting reports about the success rate of this method. One report concludes that they had
success in identifying a user using fine-grained angle based metrics. [22] It was stated that the
metrics could distinguish a user accurately with very few mouse clicks. They used a support
vector machine classifier to verify a user as either an imposter or an authenticated party. The
report states that the solution achieved an equal error rate of just 1.3% in twenty mouse
clicks. [22] An author had done a research paper to investigate whether mouse dynamics
would yield information on mood. He stated that no information on mood had been
successfully obtained using mouse movements.

13
2.6 Research Risk to Users The software which is here being developed logs user keystrokes, and therefore it is
important to be aware of ethical issues concerning user privacy. It has been stated in previous
keystroke dynamic research that “Critics complain that the use of biometrics poses a
substantial risk to privacy rights”. [28] This comes from the fact that the application will
gather a lot of personal information about the user. This information could be used by large
businesses to achieve their own ends, for example information on user moods could be sold,
and could be very useful for website owners and advertisers. There is also a risk that
government or other large organisations could obtain this personal data and could use it in an
improper or intimidating manner. It might be possible for a malicious actor to compromise a
user’s machine using the keystroke software as a means to obtain users’ passwords. As a
consequence of this risk, it is essential to keep data security in mind as a priority at all stages
of development.
2.7 Existing Solutions to Mood Identification I am not aware of any current solution that exists that can measure mood by analysing
keystroke dynamics. However, solutions do exist to measure mood that use high definition
cameras to analyse facial movements, shape of the face, lips and eyes. Affectiva is a company
that grew from MIT's Affective Computing group in 2011. [24] Affectiva has collected a
database of over a billion facial expressions. It uses this to train algorithms to recognize basic
emotions such as anger and happiness, with an accuracy of over 90%. Affdex, a product
produced by Affectiva, has been used by advertisers to test reactions to their campaigns and
to adjust them appropriately. [24, 25]
“Affdex SDKs enable developers to create interactive and exciting emotion-aware apps and
digital experiences. Affdex SDKs capture and report emotional insights from facial
expressions using any iOS, Android or Microsoft Windows device, analyzing faces obtained
from the device camera, a video or even a single image processed on-device and in real-
time.” [24]
Applications are currently on the market that attempt to identity human mood from vocal
intonations. BeyondVerbal have developed an application that can indicate a speaker’s
emotional state by analysing a voice section. They also have developed an API which can be
downloaded from their site that can identify 11 mood groups, which include, anger,
loneliness, self-control and excitement. [26] A smartphone application is being developed by
Emotional Intelligence Technologies, which it claims tracks the tone, intensity and volume of
the user’s voice to identify whether the user is happy, sad, angry, calm or frightened. [27] The
main disadvantage of current solutions is that they require a large intrusion into the user’s
life. Many people would feel uncomfortable if they were being constantly recorded.
2.8 Weka Waikato Environment for Knowledge Analysis (Weka) comprises of a suite of machine
learning software written in Java. It was developed at the University of Waikato and operates
as free software under the GNU General Public License. Weka contains a collection of
machine learning algorithms that can be used for data mining or machine learning. [29] Weka
has functionality to assist with data pre-processing, regression, classification, clustering, and
visualization. The algorithms can be applied directly using the Weka GUI Explorer or using
the Weka Java API. One of its main benefits is that it has great portability, since it is fully
developed in Java and as a result can function correctly on almost any modern computer. The

14
Weka Knowledge Explorer is a graphical user interface which contains several panels
providing access to the main functionality of the software. [30] The Pre-process panel has the
ability to import data from a number of different formats for example .csv or .arff file. This
data can then be transformed using filters, such as converting numerical features into nominal
ones. It also adds the ability to clean data, such as deleting instances and attributes according
to certain criteria. The Classify panel facilitates the application of classification and
regression algorithms to a current dataset. A classifier is selected and an evaluation method is
chosen to be applied to the dataset. The results, which are displayed on screen, estimate the
accuracy of the chosen classifier. [30] The Weka API offers the same functionality as the
Knowledge Explorer when implemented in code. There is a distinct lack of information
available that details the use of the API, however, it is possible to understand the API by
reviewing the source code and Java Doc. [31]
2.9 Evaluation Approach – Cross Validation Cross validation, or rotation estimation, is a data validation technique for evaluating in what
way the results of a statistical analysis generalise to an independent dataset. [32] Cross
validation is normally used when the goal of the classifier is prediction. It attempts to
estimate the accuracy a predictive model will have when it operates in practice. Often in a
prediction problem, a model is given a training dataset with known target values on which the
model is trained, and also a test dataset of unknown target values against which the model is
tested. [33] The aim of cross validation is to create a test dataset in the training phase, in an
attempt to limit problems such as overfitting. It then attempts to demonstrate how the model
would function when presented with a real prediction dataset with unknown target values.
Cross validation normally comprises of a multiple number of rounds, also known as folds.
For each individual round of cross validation the dataset is partitioned into complementary
subsets, it then performs the analysis on one of these called the training set. Each training set
is then evaluated using a subset called the testing set. [34] In an attempt to reduce variability,
the dataset is split into a set number of randomised partitions know as folds, one round of
cross validation is then performed on each partition. The validation results are then averaged
over the rounds of cross validation. [34] Another name for this process is k-fold cross
validation which is aptly described as follows:
“In k-fold cross-validation, the original sample is randomly partitioned into k equal sized
subsamples. Of the k subsamples, a single subsample is retained as the validation data for
testing the model, and the remaining k − 1 subsamples are used as training data. The cross-
validation process is then repeated k times (the folds), with each of the k subsamples used
exactly once as the validation data. The k results from the folds can then be averaged (or
otherwise combined) to produce a single estimation.” [35]
An evaluation approach can obtain certain values which measure the performance of the
classifier being tested. Values for fMeasure, Precision, Recall and Error Rate can be used to
compare how accurately a classifier is classifying individual instances. Precision is the
proportion of instances belonging to a class divided by the total number of instances
classified as that class. Recall is the proportion of instances classified as a certain class
divided by the total instances in that class. fMeasure is a combination of both Precision and
Recall, fMeasure = 2 * Precision * Recall / (Precision + Recall). Error Rate, is the proportion
of incorrectly classified instances divided by the total number of instances. [51]

15
2.10 Classifiers A classifier is an algorithm that implements a classification process on a certain dataset. The
following section will explore three different classifiers. It is also important to note that a
ZeroR classifier [52] can be used to set a baseline, at which other classifiers should pass to
measure their success. The ZeroR classifier always predicts the target feature which has the
highest number of instances.
2.10.1 Bagging with REP Tree Bagging is a meta-algorithm, which was originally designed for classification models. It is
normally applied to decision tree models, however, research has suggested that it can be used
with any type of model for classification or regression. [36] It aims to reduce variance and
helps to avoid overfitting.
“Given a standard training set D of size n, bagging generates m new training sets D_i, each
of size n′, by sampling from D uniformly and with replacement. By sampling with
replacement, some observations may be repeated in each D_i. If n′=n, then for large n the set
D_i is expected to have the fraction (1 - 1/e) (≈63.2%) of the unique examples of D, the rest
being duplicates.” [37]
In Weka, bagging can be implemented in combination with a base learner classifier, normally
a variation of a decision tree algorithm. [38] RepTree is a variation of a decision tree which
produces particularly good results when applied with bagging. [39]
“RepTree uses the regression tree logic and creates multiple trees in different iterations.
After that it selects best one from all generated trees. That will be considered as the
representative. In pruning the tree the measure used is the mean square error on the
predictions made by the tree. Basically Reduced Error Pruning Tree ("REPT") is fast
decision tree learning and it builds a decision tree based on the information gain or reducing
the variance. REP Tree is a fast decision tree learner which builds a decision tree using
information gain as the splitting criterion, and prunes it using reduced error pruning.” [40]
2.10.2 Support Vector Machine Support Vector Machine (SVM) is known as a discriminative classifier, and is formally
defined by a separating hyperplane. The algorithm works by learning a training dataset,
which outputs an optimal hyperplane which then can be used to categorise new examples.
[44]
“An SVM model is a representation of the examples as points in space, mapped so that the
examples of the separate categories are divided by a clear gap that is as wide as possible.
New examples are then mapped into that same space and predicted to belong to a category
based on which side of the gap they fall on.” [20]
It has been stated that a good separation is achieved by the hyperplane that has the greatest
distance to the closest training-data point of any target feature. In general it has been found
that the larger the margin of separation the lower the overall generalisation error of the
classifier will be. [44] The Weka classifier SMO is an adaption of the SVM algorithm, and
functions in a similar manner. [45] The original SVM is designed for use on only two target
features, SMO solves this problem by using pairwise classification.

16
2.10.3 J48 The J48 decision tree classifier algorithm is an implementation of C4.5 which was published
by Ross Quinlan in 1993. [41] It is an extension of the earlier ID3 algorithm which is one of
the most well-known decision tree algorithms.
“The C4.5 algorithm builds decision trees from a set of training data in the same way as ID3,
using the concept of information entropy. The training data is a set S = {s_1, s_2, ...} of
already classified samples. Each sample s_i consists of a p-dimensional vector (x_{1,i},
x_{2,i}, ...,x_{p,i}) , where the x_j represent attribute values or features of the sample, as
well as the class in which s_i falls. At each node of the tree, C4.5 chooses the attribute of the
data that most effectively splits its set of samples into subsets enriched in one class or the
other. The splitting criterion is the normalized information gain (difference in entropy). The
attribute with the highest normalized information gain is chosen to make the decision. The
C4.5 algorithm then recurs on the smaller sublists.” [42]
The C4.5 algorithm made improvements on the original ID3 decision tree. It has the ability to
handle both continuous and discrete features. To process continuous features it creates a
threshold and then splits the feature values into those which are greater than the threshold and
those which are less than or equal to it. It has the ability to handle training data with missing
attribute values by excluding these from gain and entropy calculations. It also prunes the
decision tree after its creation, by removing the branches that are irrelevant and replacing
them with leaf nodes. [43]
2.11 Balancing Data – SMOTE Synthetic Minority Over-sampling Technique (SMOTE) [47] is used to try to balance a
dataset that is unbalanced. A dataset is said to be unbalanced if the amount of all the target
feature values are not approximately equally represented. SMOTE attempts to generate
synthetic samples by randomly sampling the attributes from instances in the minority target
feature. [46] These samples can then be added back into the training set. SMOTE
differentiates itself from other balancing algorithms by creating synthetic samples from the
minority target feature instead of creating copies. “It selects two or more similar instances
(using a distance measure) and perturbing an instance one attribute at a time by a random
amount within the difference to the neighbouring instances.” [46]
SMOTE can be implemented using the Weka API as a filter. [47] It is stated that the original
dataset must be able to fit entirely in memory. Certain variables of SMOTE can be set, such
as the percentage size of the required data inflation. The amount of nearest neighbours that
the algorithm uses when creating samples may also be specified.
2.12 Java Key Logging Functionality Java contains built-in functionality that can be used to record key strokes. The KeyListener
interface [13] and KeyEvent class [14] can be imported into the Java program. When a key is
pressed, released or typed, while inside a Java program scope, an event object is generated
and passed to the KeyListener object. Methods such as getKeyChar() can be called on the
KeyEvent object to return the information on each key press. System times can be taken
when the KeyPress and KeyRelease events occur. [14] Dwell time and flight time can then be
calculated from this. The main issue with the Java functionality is that it can only access
information within the Java application scope. An example of this is when a window loses
focus (e.g. when minimized), it stops receiving any more keyboard events. [49] To overcome

17
this, it would be possible to write code in C and have this pass the key events to Java.
However, this might add an unnecessary layer of complexity.
An open source API has been developed that can record key events and mouse movements
outside the Java application scope called Selenium. [15] Using the KeyDownAction and
KeyUpAction classes that it contains, it is possible to accurately calculate dwell and flight
time. [15] The main issue with using the Selenium API is that it has a huge amount of extra
functionality that would not be useful for this project. A different open source library,
KeyboardHook, has been developed with the aim of creating a workaround to the fact that
keyboard and mouse events only work while the registered component is in focus. [49] The
library implements a low level system wide hook which makes it possible to receive
keyboard events when out of focus.
3 Design
3.1 Introduction This chapter examines the development methodology and design aspects of the project. It
also discusses and demonstrates the development use cases, storage design and user interface
design.
3.2 Use Cases
3.2.1 User Use Case Overview
Figure 4: User Use Case Overview
The application was designed to execute in the background while the user is in normal
computer use. The functionality outlined in the above use case will be incorporated inside a
tray icon. This will allow the user to access the application when required without distracting
the user from normal use.

18
3.2.2 View Application Information
Figure 5: Application Information Use Case
The application gives the user the ability to view certain statistics about the current
application’s operation. The user can view this information on a Java Swing form graphical
user interface. The user can check which current mood the application is using when storing
key strokes. The user also has the ability to check the current session that the application is
running on, the session is incremented by one each time the application starts. The user has
the ability to check how long the application has been running for. This time has been
converted from epoch time to seconds: minutes: hours.
Key Logging status, has two states, either paused or active. This allows the user to check
whether or not their keystrokes are currently being recorded. The status changes state if the
user chooses to pause or resume the application. Prediction Status informs the user whether
or not the application is currently trying to identify the user’s current mood. This status has
two states, Training State, where the application is currently logging keystrokes for training,
and Prediction state, where the application uses the most recent keystrokes to attempt to
identify a user’s current mood. The user also has the ability to view the last prediction the
application has attempted to make about the user’s mood.
3.2.3 Pause / Resume Key Logging
Figure 6: Pause/Resume Use Case

19
The user has the ability to pause the application. If the user chooses to pause the application
the keylogging thread to no longer listens for the user’s keystrokes. The user may choose to
use this function while typing in a password or other sensitive information. This functionality
has been included to give the user peace of mind, as the data being recorded is personal. The
user then has the option to resume key logging, which returns the application to its normal
state of recording keystrokes.
3.2.4 Make Prediction
Figure 7: Make Prediction Use Case
The user has the option to manually start the prediction process. This should only be
attempted after a sufficient amount of keystrokes have been recorded, which includes some
data for each of the three mood target features. The recommendation is 10k rows of data, with
at least 1k row of data for each mood target feature.
3.2.5 Set Mood
Figure 8: Set Mood Use Case
When the application begins, the user is prompted to state their mood, this will continue after
a pre-set interval of time has passed. The amount of time between prompts can be easily
changed in the code. The user is asked to select one out of three options, negative, positive or
normal. The choice the user makes is then held in memory and combined with keystroke data
obtained after that choice. The user has the ability to manually set their own mood at any time
they wish. Users have been advised to use this option to set their mood when they notice it
changing. It is important to set the prompt time at a value which does not aggravate the user,
while still recording a correct mood.
20
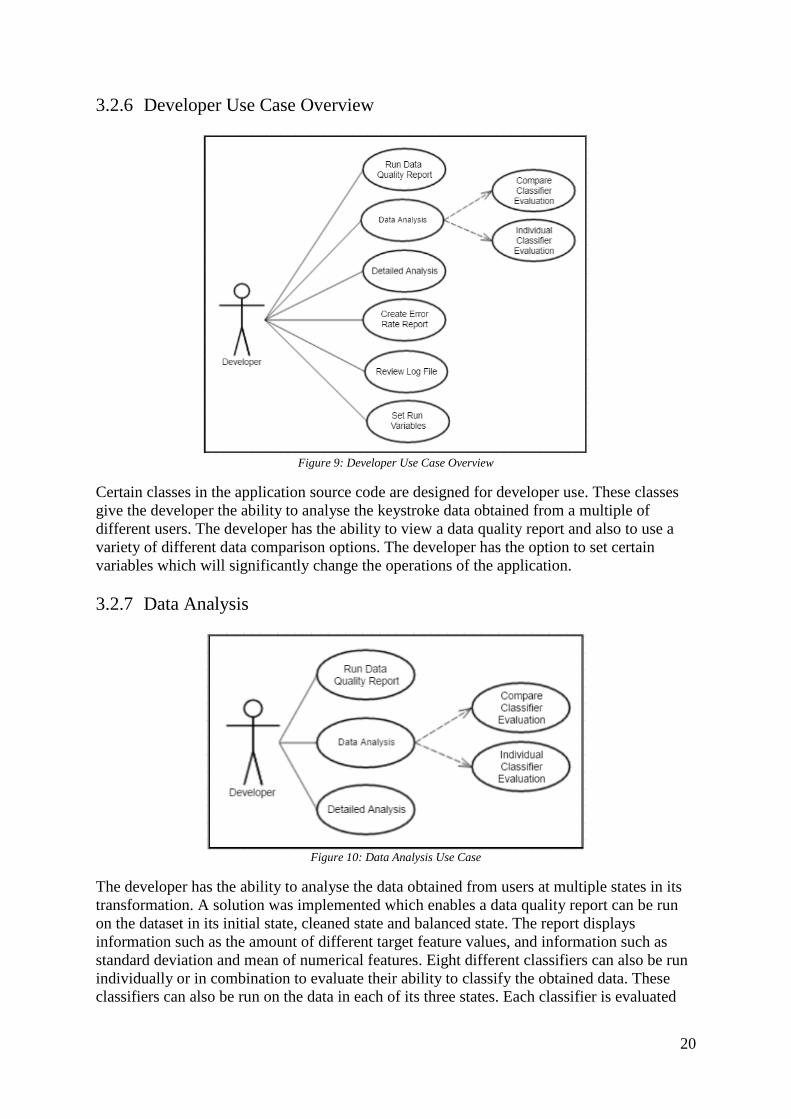
3.2.6 Developer Use Case Overview
Figure 9: Developer Use Case Overview
Certain classes in the application source code are designed for developer use. These classes
give the developer the ability to analyse the keystroke data obtained from a multiple of
different users. The developer has the ability to view a data quality report and also to use a
variety of different data comparison options. The developer has the option to set certain
variables which will significantly change the operations of the application.
3.2.7 Data Analysis
Figure 10: Data Analysis Use Case
The developer has the ability to analyse the data obtained from users at multiple states in its
transformation. A solution was implemented which enables a data quality report can be run
on the dataset in its initial state, cleaned state and balanced state. The report displays
information such as the amount of different target feature values, and information such as
standard deviation and mean of numerical features. Eight different classifiers can also be run
individually or in combination to evaluate their ability to classify the obtained data. These
classifiers can also be run on the data in each of its three states. Each classifier is evaluated
21
using 10 fold cross validation, and results such as fMeasure, Precision, Recall and Error Rate
are displayed. Detailed analysis can be implemented on each of the classifiers, which displays
results for each individual fold of the cross validation process. Multiple classifiers can be
executed on the same data with the corresponding classifier and error rate displayed on
screen.
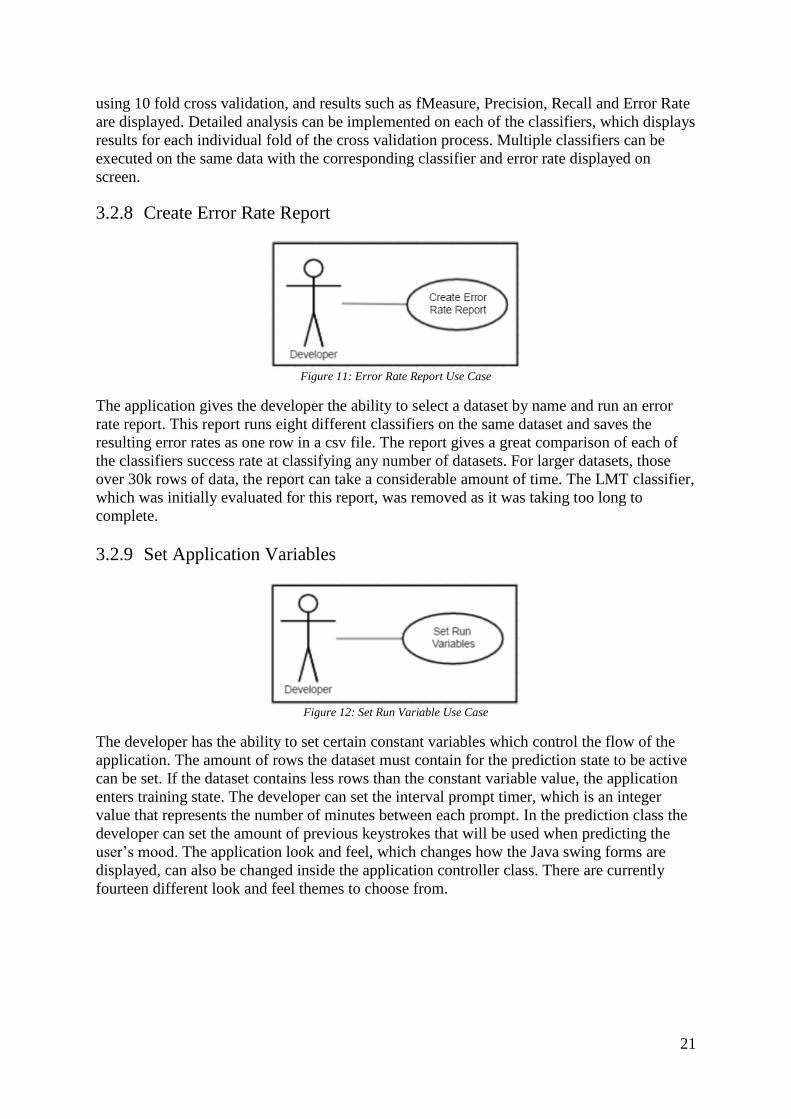
3.2.8 Create Error Rate Report
Figure 11: Error Rate Report Use Case
The application gives the developer the ability to select a dataset by name and run an error
rate report. This report runs eight different classifiers on the same dataset and saves the
resulting error rates as one row in a csv file. The report gives a great comparison of each of
the classifiers success rate at classifying any number of datasets. For larger datasets, those
over 30k rows of data, the report can take a considerable amount of time. The LMT classifier,
which was initially evaluated for this report, was removed as it was taking too long to
complete.
3.2.9 Set Application Variables
Figure 12: Set Run Variable Use Case
The developer has the ability to set certain constant variables which control the flow of the
application. The amount of rows the dataset must contain for the prediction state to be active
can be set. If the dataset contains less rows than the constant variable value, the application
enters training state. The developer can set the interval prompt timer, which is an integer
value that represents the number of minutes between each prompt. In the prediction class the
developer can set the amount of previous keystrokes that will be used when predicting the
user’s mood. The application look and feel, which changes how the Java swing forms are
displayed, can also be changed inside the application controller class. There are currently
fourteen different look and feel themes to choose from.
22
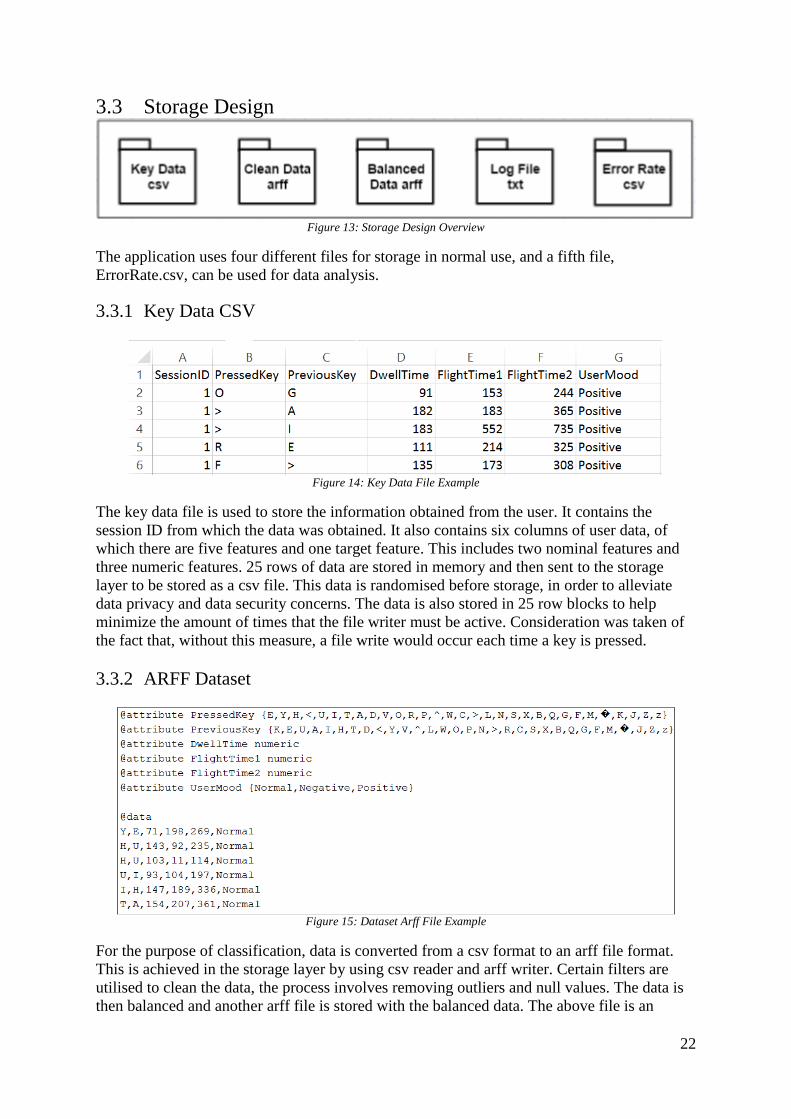
3.3 Storage Design
Figure 13: Storage Design Overview
The application uses four different files for storage in normal use, and a fifth file,
ErrorRate.csv, can be used for data analysis.
3.3.1 Key Data CSV
Figure 14: Key Data File Example
The key data file is used to store the information obtained from the user. It contains the
session ID from which the data was obtained. It also contains six columns of user data, of
which there are five features and one target feature. This includes two nominal features and
three numeric features. 25 rows of data are stored in memory and then sent to the storage
layer to be stored as a csv file. This data is randomised before storage, in order to alleviate
data privacy and data security concerns. The data is also stored in 25 row blocks to help
minimize the amount of times that the file writer must be active. Consideration was taken of
the fact that, without this measure, a file write would occur each time a key is pressed.
3.3.2 ARFF Dataset
Figure 15: Dataset Arff File Example
For the purpose of classification, data is converted from a csv format to an arff file format.
This is achieved in the storage layer by using csv reader and arff writer. Certain filters are
utilised to clean the data, the process involves removing outliers and null values. The data is
then balanced and another arff file is stored with the balanced data. The above file is an

23
example of data stored in arff format, the first row of the csv file is converted to attributes,
and it lists the possible values of the nominal features. The actual data row is stored
underneath the @data heading.
3.3.3 Log File
Figure 16: Log File Example
Each time the application is executed an entry is made into the log file. The first value
represents the current session the application is in. The second is the epoch time the
application was started. The epoch time can be later used to calculate the current run time of
the application.
3.3.4 Error Rate File
Figure 17: Error Rate File Example
The error rate file was created to analyse the success of each the nine classifier that were
examined to identify mood. The name of each classifier is in the top row, and the name of the
dataset being tested is in the left most column. The corresponding error rates are then
displayed throughout the file. Datasets that begin with a “b” have been balanced. This report
can be run on both balanced and unbalanced data and the difference in results compared.
3.4 User Interface Design
3.4.1 Application Functionality
Figure 18: Tray Icon Options
24
The above diagram demonstrates the options which are available to the user from the
applications tray icon as the application executes. The functionality of each option has been
outlined in the user use cases. Clicking on the tray icon itself will display the same dialog as
the above mood information button.
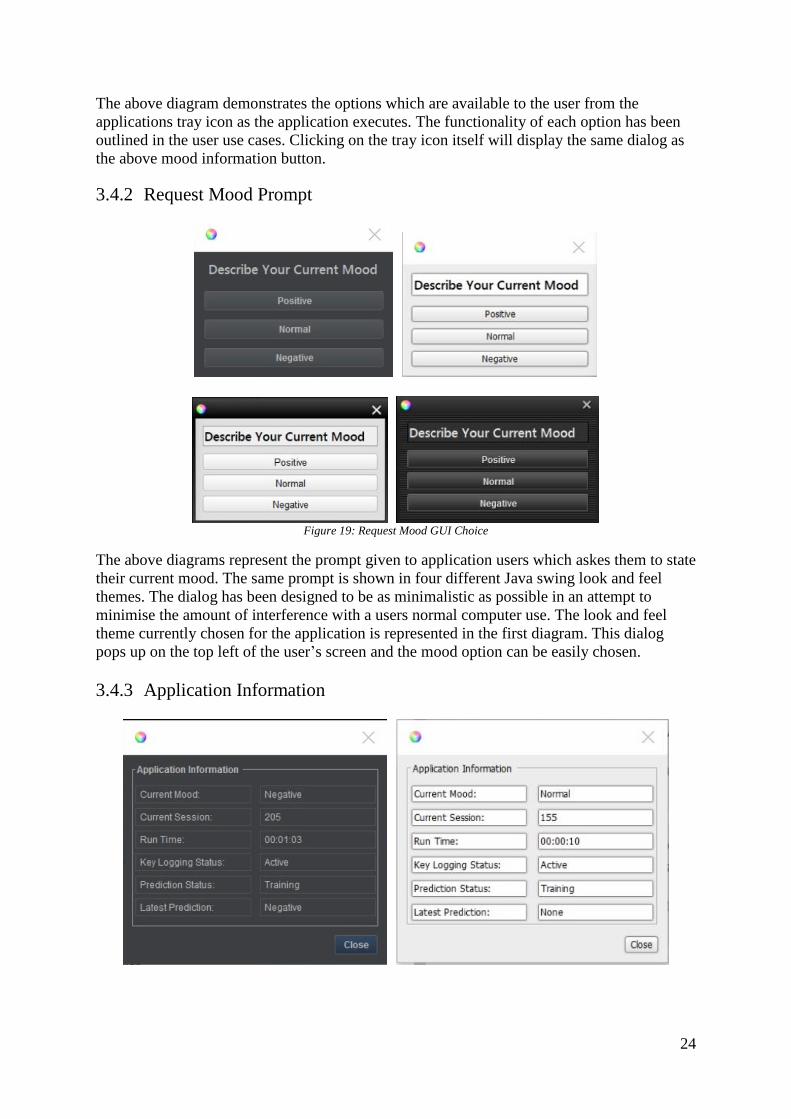
3.4.2 Request Mood Prompt
Figure 19: Request Mood GUI Choice
The above diagrams represent the prompt given to application users which askes them to state
their current mood. The same prompt is shown in four different Java swing look and feel
themes. The dialog has been designed to be as minimalistic as possible in an attempt to
minimise the amount of interference with a users normal computer use. The look and feel
theme currently chosen for the application is represented in the first diagram. This dialog
pops up on the top left of the user’s screen and the mood option can be easily chosen.
3.4.3 Application Information

25
Figure 20: Application Info GUI Choice
The above dialog boxes represent the information displayed to the user when the mood
information option is selected by the user. The interface desgin attempts to be minimalistic
while being as informative as possible.
3.4.4 Prediction Prompt
Figure 21: Prediction Prompt GUI
The prediction promt is displayed to the user after the application attempts to identify the
user’s mood. The current mood of the user will be updated based on the results of the
prediction. This prompt functions in a similar manner as the request mood prompt. The
choice of look and feel theme is made in an attempt to be as of little distraction to the user as
possible.
3.5 Source Code Layout This section attempts to assist with the understanding of the applications source code.
3.5.1 Application Controller The application controller class is used to control the flow of the program. The design allows
certain constants to be set in this class to have an impact on the program’s execution. It
instantiates the classes which initially build the application, such as BuildTrayIcon.java and
KeystrokeLog.java.
3.5.2 Data Analysis Controller The data analysis controller class is designed to be used by the developer to analyse the data
obtained from different users. As this functionality is not currently used in the applications
normal use, the lines of code which have previously been used to analyse different datasets
have been commented out.

26
3.5.3 Keystroke Log The keystroke log class is used to log each keypress and creates a KeyData object which
holds the data from that press.
3.5.4 Storage Layer The storage layer class deals with all read / write operations which are initiated in general
application use. It retrieves saved data and then passes this on to other classes which require
the data. The BuildTestData.java class is also part of the storage layer, and its aim is to
prepare datasets for use in data analysis and classification.
3.5.5 User Interface Classes There are three different swing form classes with corresponding Java controlling classes.
These are MoodInformation, PredictionResult and RequestMood, and they represent the view
of the application.
4 Architecture and Development
4.1 Introduction This chapter discusses the architecture of the application and the challenges overcome in its
development. It highlights key development components which were necessary for the
application to function.
4.2 Technical Architecture and Diagram
Figure 22: Technical Architecture Diagram
The above architecture diagram represents the architecture of the application in its normal
use. It does not represent the added functionality which has been built in for the developer’s
own use. The initial delivery mechanism for user input is shown as being the keyboard. The
user is later able to visualise results and control the application through the monitor. The
mouse is used for interaction with the application’s options. In the diagram, the services tab
represents the services (APIs) which are used by the application. The storage layer shows the
files which are being stored. The arrow going from the user demonstrates the steps involved
in the program’s full cycle, from recording to identifying mood.

27
4.3 Challenges Overcome
4.3.1 Research Endeavour The challenge was to research the computer science fields of artificial intelligence and
machine learning in such a way, that the most up to date available knowledge of the area
could be incorporated into the development process of the mood identification application.
This challenge was overcome by researching existing solutions in the machine learning field,
and viewing methods used in other projects.
4.3.2 Collecting Data One of the first challenges faced in collecting data was that the Java environment does not
allow keystroke events to be recorded outside the focus of the original program. Research
was done to find a solution that could modify Java in such a way as to make this possible.
The initial application that was developed used a selenium API, however this API required
quite a large overhead of other software. A more satisfactory solution was employed in the
second development of the application. This solution involved using a keyboard hook library
to override Java key listeners with ones which worked successfully.
The main challenge for data collection was creating an application that could balance the
need of obtaining quality data, with the concerns of users. The main concerns were the
interference with normal computer use and data security/privacy. An extreme example of this
would be, where the application would insist on the user giving their updated current mood
once every minute and the user no longer being able to use their computer efficiently. It was
important to keep this balance as users were given no monetary compensation for testing the
application.
4.3.3 Mood Prediction Mood prediction was added to the application at the later stages of development, after the
best performing classifiers had been chosen. The main challenge was that evaluating
classifiers was quite different to actually identifying mood. Two different datasets had to be
cleanly separated from the user obtained dataset. These became individual training and
testing datasets. It was important that the testing prediction keystrokes were not in the
training set. The values in the training set were looped through, starting with the last value,
and the testing data was then removed from the training dataset.
4.3.4 Skewed Datasets One of the major challenges the project faced was that the datasets obtained from users were
generally skewed heavily to one target feature. Often people stated the same mood class the
majority of the time. For example, one dataset contained 97% negative mood values and only
three rows of positive mood data. This meant that some datasets obtained from users could
not adequately be tested by all of the classifiers. In these cases the classifiers merely
predicted the majority target feature and did not achieve better results than the ZeroR
classifier. To overcome this issue, users were given instructions to state their mood as
positive when they felt they were feeling the best they had felt in a while, and negative when
they were at the lowest end of their feelings. Many different methods were also employed to
balance the datasets, of which the SMOTE filter achieved the best results. Evaluation on
balanced datasets achieved more successful classification results compared with unbalanced
data.
28
4.4 Key Development Components
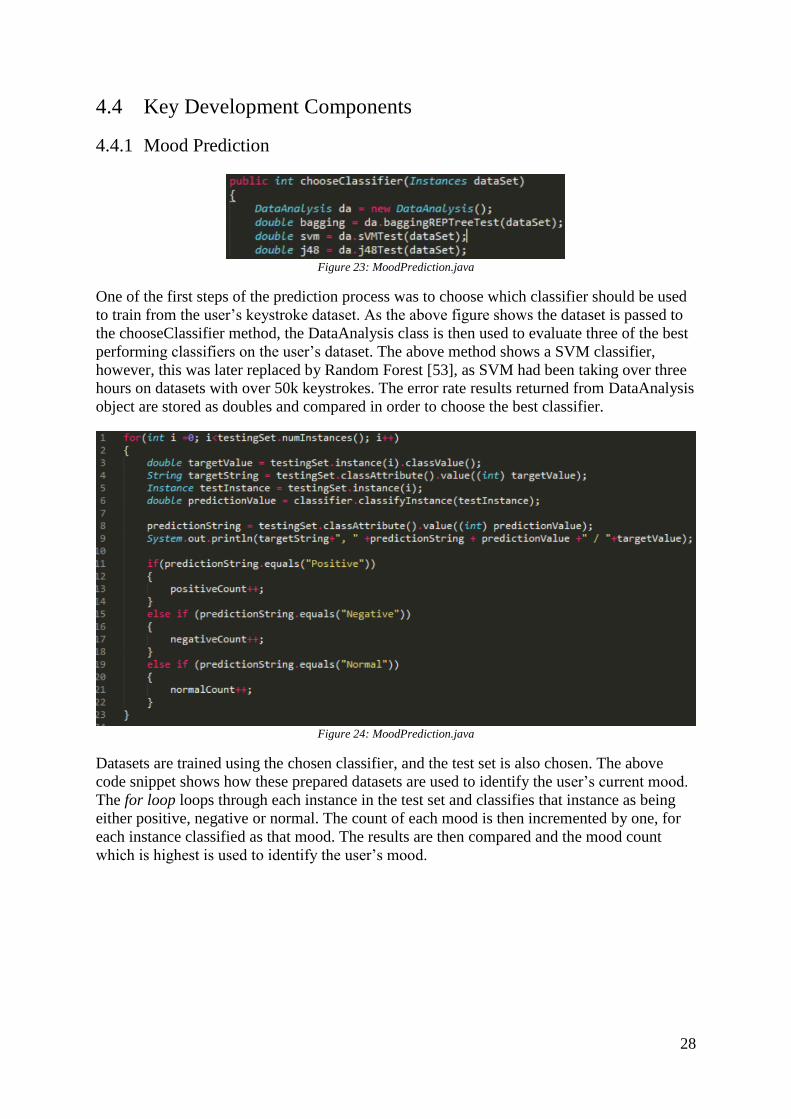
4.4.1 Mood Prediction
Figure 23: MoodPrediction.java
One of the first steps of the prediction process was to choose which classifier should be used
to train from the user’s keystroke dataset. As the above figure shows the dataset is passed to
the chooseClassifier method, the DataAnalysis class is then used to evaluate three of the best
performing classifiers on the user’s dataset. The above method shows a SVM classifier,
however, this was later replaced by Random Forest [53], as SVM had been taking over three
hours on datasets with over 50k keystrokes. The error rate results returned from DataAnalysis
object are stored as doubles and compared in order to choose the best classifier.
Figure 24: MoodPrediction.java
Datasets are trained using the chosen classifier, and the test set is also chosen. The above
code snippet shows how these prepared datasets are used to identify the user’s current mood.
The for loop loops through each instance in the test set and classifies that instance as being
either positive, negative or normal. The count of each mood is then incremented by one, for
each instance classified as that mood. The results are then compared and the mood count
which is highest is used to identify the user’s mood.
29
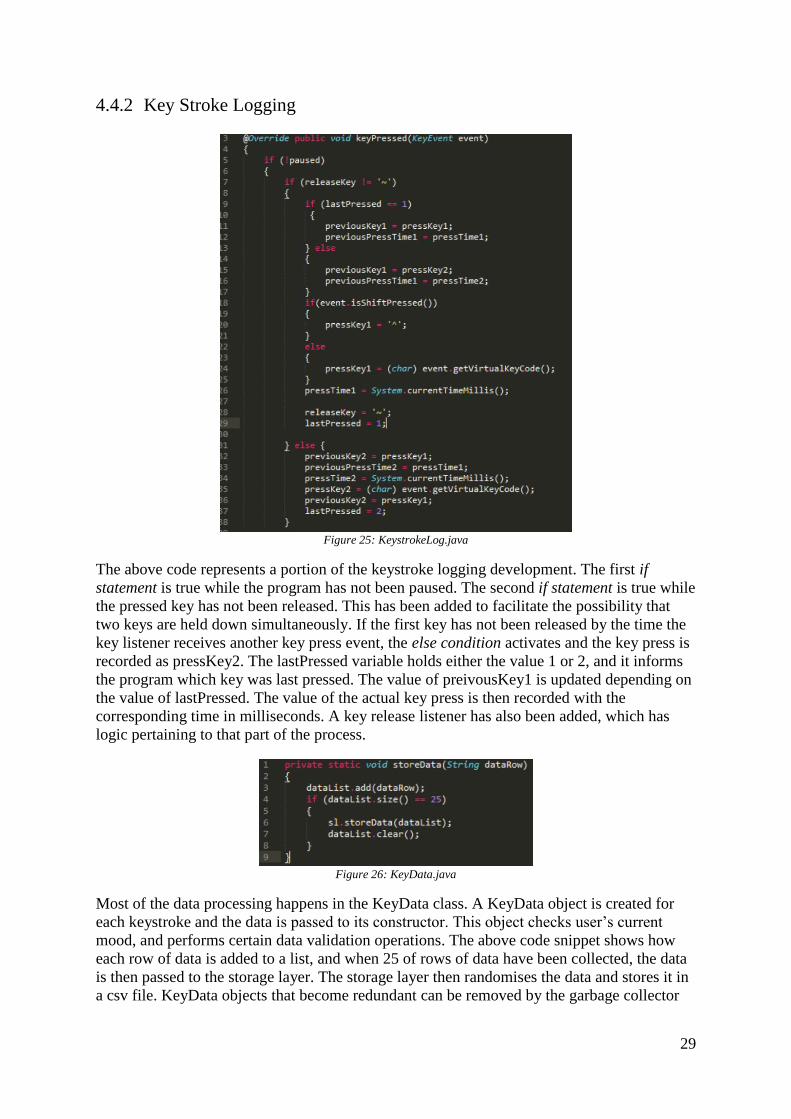
4.4.2 Key Stroke Logging
Figure 25: KeystrokeLog.java
The above code represents a portion of the keystroke logging development. The first if
statement is true while the program has not been paused. The second if statement is true while
the pressed key has not been released. This has been added to facilitate the possibility that
two keys are held down simultaneously. If the first key has not been released by the time the
key listener receives another key press event, the else condition activates and the key press is
recorded as pressKey2. The lastPressed variable holds either the value 1 or 2, and it informs
the program which key was last pressed. The value of preivousKey1 is updated depending on
the value of lastPressed. The value of the actual key press is then recorded with the
corresponding time in milliseconds. A key release listener has also been added, which has
logic pertaining to that part of the process.
Figure 26: KeyData.java
Most of the data processing happens in the KeyData class. A KeyData object is created for
each keystroke and the data is passed to its constructor. This object checks user’s current
mood, and performs certain data validation operations. The above code snippet shows how
each row of data is added to a list, and when 25 of rows of data have been collected, the data
is then passed to the storage layer. The storage layer then randomises the data and stores it in
a csv file. KeyData objects that become redundant can be removed by the garbage collector

30
the moment they are added to the dataList. DataList is declared as static, and therefore its list
of stored keystroke rows remains persistent.
4.4.3 Data Analysis
Figure 27 DataAnalysis.java
The DataAnalysis class contains code for the implementation and evaluation of ten different
classifiers. This class is used to compare the results of multiple classifiers on the same
dataset. The above code snippet demonstrates how the error report is compiled. Nine
classifiers are passed the same dataset, on which they each employ 10 fold cross validation on
the dataset and return a double value with 3 decimal places, error rate. This information is
then passed to the data analysis storage layer class known as BuildTestData and stored.
Figure 28: DetailedAnalysis.java
Detailed analysis can be performed on any available classifier, currently J48 is shown in the
above snippet. Detailed analysis returns evaluation results on each iteration of the 10 fold
cross validation process and not just an average of all 10 folds. This class can be used to
explore each classifier in more depth. Currently the class is set to 10 fold evaluation, however
any number of folds can be set. The first iteration of the for loop passes 1/10 of the dataset to
the testing set. The training set is passed the full dataset and the testing dataset values are then
deleted. The classifier is then used to evaluate that fold, and the results are displayed.
31
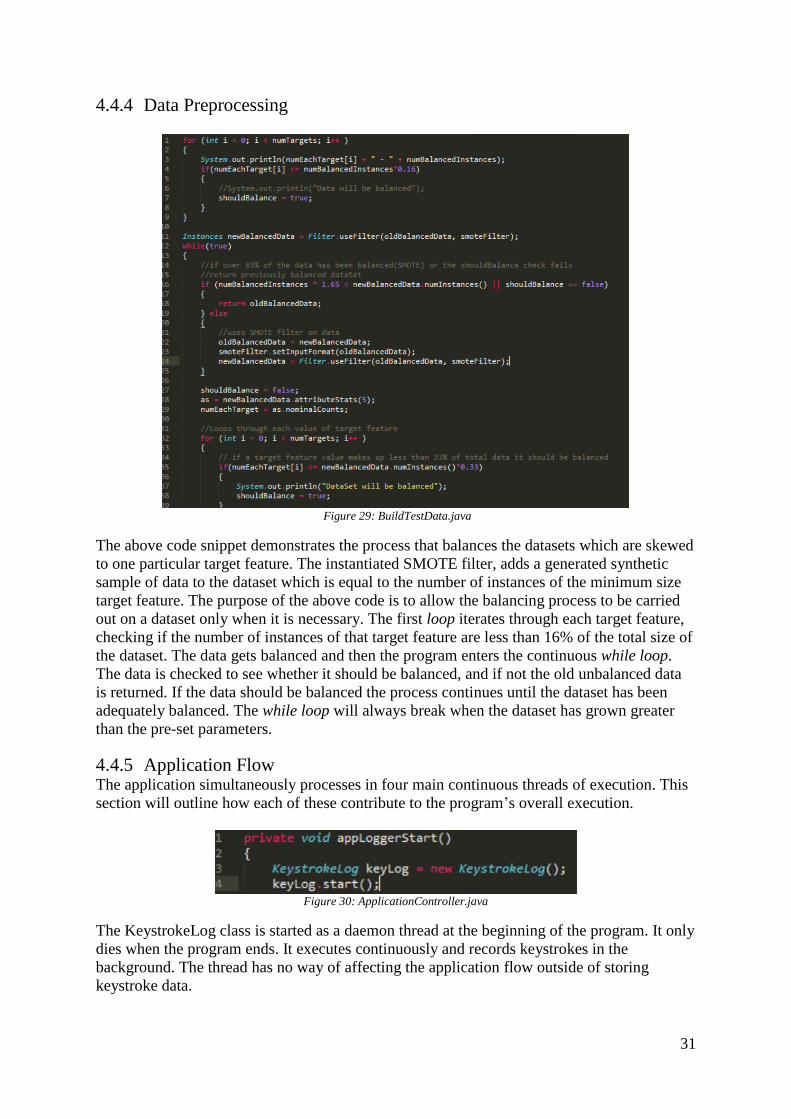
4.4.4 Data Preprocessing
Figure 29: BuildTestData.java
The above code snippet demonstrates the process that balances the datasets which are skewed
to one particular target feature. The instantiated SMOTE filter, adds a generated synthetic
sample of data to the dataset which is equal to the number of instances of the minimum size
target feature. The purpose of the above code is to allow the balancing process to be carried
out on a dataset only when it is necessary. The first loop iterates through each target feature,
checking if the number of instances of that target feature are less than 16% of the total size of
the dataset. The data gets balanced and then the program enters the continuous while loop.
The data is checked to see whether it should be balanced, and if not the old unbalanced data
is returned. If the data should be balanced the process continues until the dataset has been
adequately balanced. The while loop will always break when the dataset has grown greater
than the pre-set parameters.
4.4.5 Application Flow The application simultaneously processes in four main continuous threads of execution. This
section will outline how each of these contribute to the program’s overall execution.
Figure 30: ApplicationController.java
The KeystrokeLog class is started as a daemon thread at the beginning of the program. It only
dies when the program ends. It executes continuously and records keystrokes in the
background. The thread has no way of affecting the application flow outside of storing
keystroke data.
32
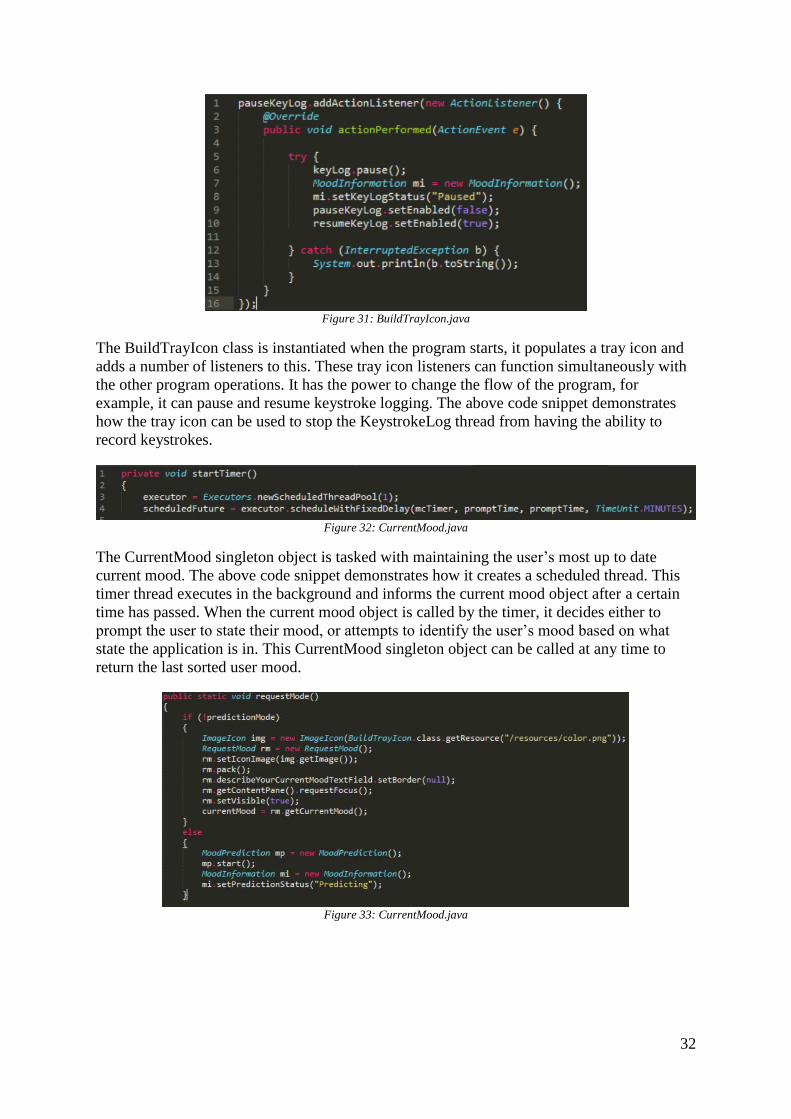
Figure 31: BuildTrayIcon.java
The BuildTrayIcon class is instantiated when the program starts, it populates a tray icon and
adds a number of listeners to this. These tray icon listeners can function simultaneously with
the other program operations. It has the power to change the flow of the program, for
example, it can pause and resume keystroke logging. The above code snippet demonstrates
how the tray icon can be used to stop the KeystrokeLog thread from having the ability to
record keystrokes.
Figure 32: CurrentMood.java
The CurrentMood singleton object is tasked with maintaining the user’s most up to date
current mood. The above code snippet demonstrates how it creates a scheduled thread. This
timer thread executes in the background and informs the current mood object after a certain
time has passed. When the current mood object is called by the timer, it decides either to
prompt the user to state their mood, or attempts to identify the user’s mood based on what
state the application is in. This CurrentMood singleton object can be called at any time to
return the last sorted user mood.
Figure 33: CurrentMood.java
33
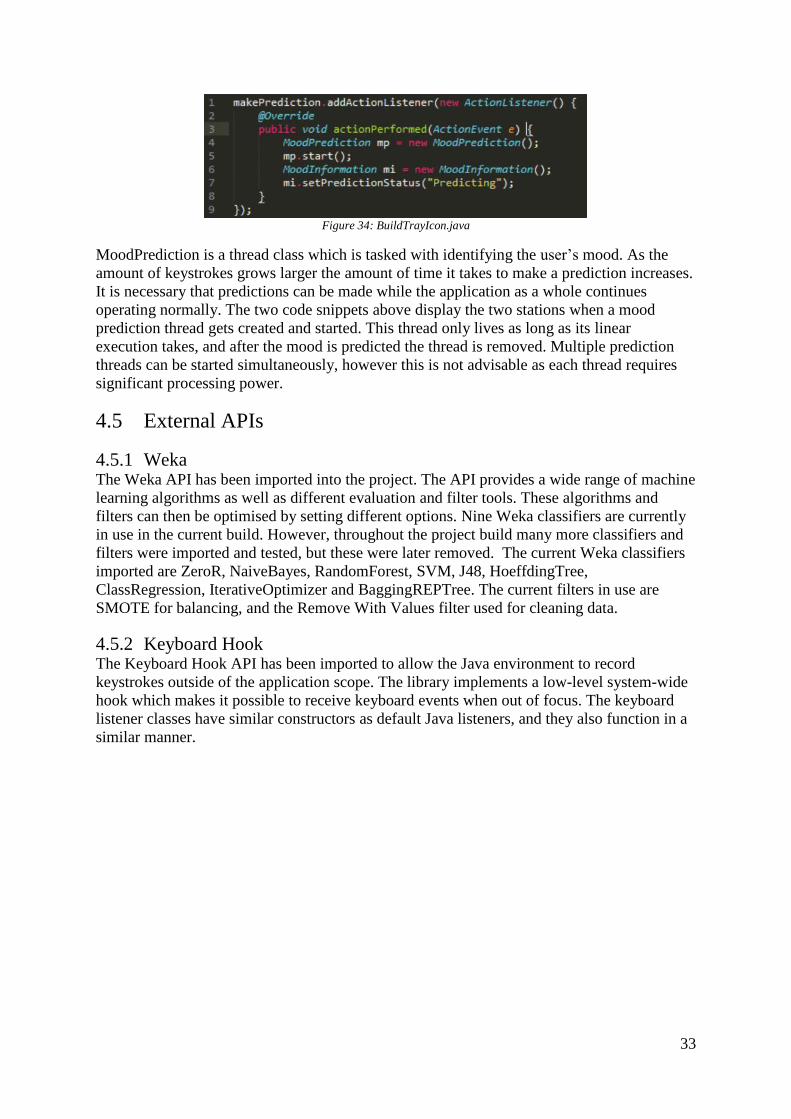
Figure 34: BuildTrayIcon.java
MoodPrediction is a thread class which is tasked with identifying the user’s mood. As the
amount of keystrokes grows larger the amount of time it takes to make a prediction increases.
It is necessary that predictions can be made while the application as a whole continues
operating normally. The two code snippets above display the two stations when a mood
prediction thread gets created and started. This thread only lives as long as its linear
execution takes, and after the mood is predicted the thread is removed. Multiple prediction
threads can be started simultaneously, however this is not advisable as each thread requires
significant processing power.
4.5 External APIs
4.5.1 Weka The Weka API has been imported into the project. The API provides a wide range of machine
learning algorithms as well as different evaluation and filter tools. These algorithms and
filters can then be optimised by setting different options. Nine Weka classifiers are currently
in use in the current build. However, throughout the project build many more classifiers and
filters were imported and tested, but these were later removed. The current Weka classifiers
imported are ZeroR, NaiveBayes, RandomForest, SVM, J48, HoeffdingTree,
ClassRegression, IterativeOptimizer and BaggingREPTree. The current filters in use are
SMOTE for balancing, and the Remove With Values filter used for cleaning data.
4.5.2 Keyboard Hook The Keyboard Hook API has been imported to allow the Java environment to record
keystrokes outside of the application scope. The library implements a low-level system-wide
hook which makes it possible to receive keyboard events when out of focus. The keyboard
listener classes have similar constructors as default Java listeners, and they also function in a
similar manner.

34
5 Testing and Evaluation
5.1 Introduction
Figure 35: Testing Approach
Throughout the lifetime of the project a large amount of testing and evaluation was required
to locate the best performing classifiers and to examine if they were functioning correctly.
The application was released to users at multiple development iterations. It was then tested by
users and the feedback given was implemented in the next iteration. Users returned datasets
in a csv file format. Initially, the Weka interface was used to test a large number of different
classifiers on datasets returned by users. Two classes were also implemented for developer
use, which were used to obtain evaluation information. These classes were continually
updated with different classifiers and with different evaluation techniques. The most
successful classifiers and techniques are shown in these classes in the project’s final build.
Users later gave feedback on whether or not the application was predicting their mood
successfully.
5.2 Error Rate Report
Figure 36: Error Rate Results
The above table displays the error rates achieved when the classifiers, ZeroR, NaiveBayes,
RandomForest, SVM, J48, HoeffdingTree, ClassRegression, IterativeOptimizer and
BaggingREPTree were used to evaluate the dataset in the right column. Techniques
(described in 5.2.1) were employed to compare error rates and to evaluate if these classifiers
achieved a better success rate at classifying mood than random chance. All the datasets
DataSet ZeroR NaiveBayes RandomForest SVM J48 HoeffdingTreeClassRegression IterativeOptimizerBaggingREPTree
c****KeyData 0.579 0.528 0.498 0.526 0.496 0.532 0.488 0.505 0.486
bc****KeyData 0.614 0.53 0.42 0.517 0.431 0.526 0.459 0.513 0.423
t****KeyData 0.519 0.474 0.5 0.474 0.476 0.473 0.468 0.475 0.483
bt****KeyData 0.567 0.533 0.482 0.53 0.486 0.516 0.511 0.528 0.48
s****KeyData 0.238 0.24 0.296 0.238 0.238 0.238 0.239 0.238 0.259
bs****KeyData 0.355 0.282 0.258 0.261 0.219 0.282 0.216 0.288 0.233
m****KeyData 0.529 0.523 0.561 0.523 0.519 0.518 0.515 0.524 0.53
bm****KeyData 0.6 0.565 0.495 0.575 0.505 0.545 0.53 0.567 0.489
c****KeyData 0.417 0.446 0.475 0.417 0.43 0.417 0.416 0.418 0.445
bc****KeyData 0.538 0.518 0.391 0.486 0.392 0.513 0.404 0.488 0.389
d****KeyData 0.268 0.283 0.339 0.268 0.268 0.268 0.269 0.269 0.287
bd****KeyData 0.391 0.4 0.315 0.387 0.298 0.391 0.306 0.376 0.293
a****KeyData 0.155 0.155 0.198 0.155 0.155 0.155 0.155 0.155 0.157
ba****KeyData 0.483 0.451 0.159 0.453 0.18 0.389 0.189 0.448 0.171
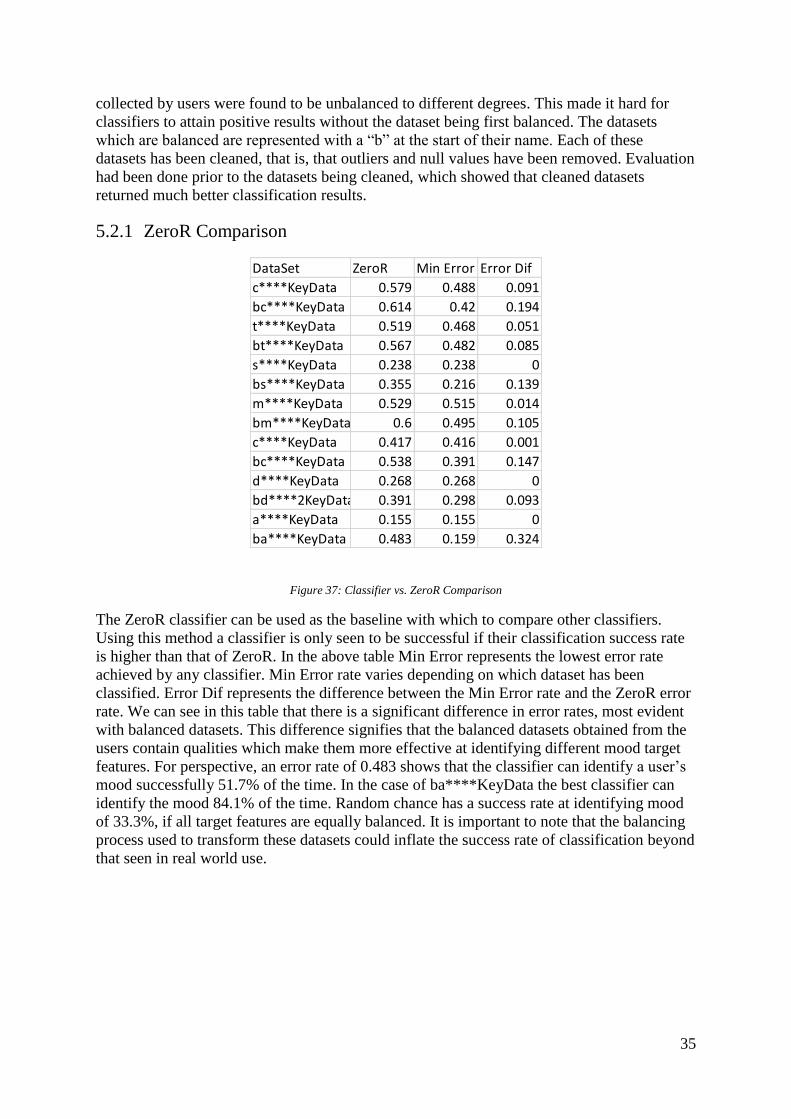
35
collected by users were found to be unbalanced to different degrees. This made it hard for
classifiers to attain positive results without the dataset being first balanced. The datasets
which are balanced are represented with a “b” at the start of their name. Each of these
datasets has been cleaned, that is, that outliers and null values have been removed. Evaluation
had been done prior to the datasets being cleaned, which showed that cleaned datasets
returned much better classification results.
5.2.1 ZeroR Comparison
Figure 37: Classifier vs. ZeroR Comparison
The ZeroR classifier can be used as the baseline with which to compare other classifiers.
Using this method a classifier is only seen to be successful if their classification success rate
is higher than that of ZeroR. In the above table Min Error represents the lowest error rate
achieved by any classifier. Min Error rate varies depending on which dataset has been
classified. Error Dif represents the difference between the Min Error rate and the ZeroR error
rate. We can see in this table that there is a significant difference in error rates, most evident
with balanced datasets. This difference signifies that the balanced datasets obtained from the
users contain qualities which make them more effective at identifying different mood target
features. For perspective, an error rate of 0.483 shows that the classifier can identify a user’s
mood successfully 51.7% of the time. In the case of ba****KeyData the best classifier can
identify the mood 84.1% of the time. Random chance has a success rate at identifying mood
of 33.3%, if all target features are equally balanced. It is important to note that the balancing
process used to transform these datasets could inflate the success rate of classification beyond
that seen in real world use.
DataSet ZeroR Min Error Error Dif
c****KeyData 0.579 0.488 0.091
bc****KeyData 0.614 0.42 0.194
t****KeyData 0.519 0.468 0.051
bt****KeyData 0.567 0.482 0.085
s****KeyData 0.238 0.238 0
bs****KeyData 0.355 0.216 0.139
m****KeyData 0.529 0.515 0.014
bm****KeyData 0.6 0.495 0.105
c****KeyData 0.417 0.416 0.001
bc****KeyData 0.538 0.391 0.147
d****KeyData 0.268 0.268 0
bd****2KeyData 0.391 0.298 0.093
a****KeyData 0.155 0.155 0
ba****KeyData 0.483 0.159 0.324

36
5.2.2 Balanced Comparison
Figure 38: Balanced vs. Unbalanced Data
From the above table we can see that data obtained from users which has not yet been
balanced achieves a significantly lower error rate difference from the baseline. The Balanced
Dif column represents the difference between the unbalanced dataset and the balanced. It
shows that when c****KeyData is balanced it has a 10% higher chance of correctly
classifying mood, than that of the unbalanced data. It also shows than in some cases, such as
a****KeyData where the dataset has been extremely skewed to one target feature, that it is
impossible to implement an efficient learning classifier without first balancing the dataset. On
average a balanced dataset has a 13.28% better chance of classifying mood compared with
unbalanced dataset taking into account a baseline set by the ZeroR classifier.
DataSet Min Error Error Dif Balance Dif
c****KeyData 0.488 0.091
bc****KeyData 0.42 0.194 0.103
t****KeyData 0.468 0.051
bt****KeyData 0.482 0.085 0.034
s****KeyData 0.238 0
bs****KeyData 0.216 0.139 0.139
m****KeyData 0.515 0.014
bm****KeyData 0.495 0.105 0.091
c****KeyData 0.416 0.001
bc****KeyData 0.391 0.147 0.146
d****2KeyData 0.268 0
bd****2KeyData 0.298 0.093 0.093
a****KeyData 0.155 0
ba****KeyData 0.159 0.324 0.324
Average 0.357786 0.088857 0.1328571
Max 0.515 0.324 0.324
Min 0.155 0 0.034
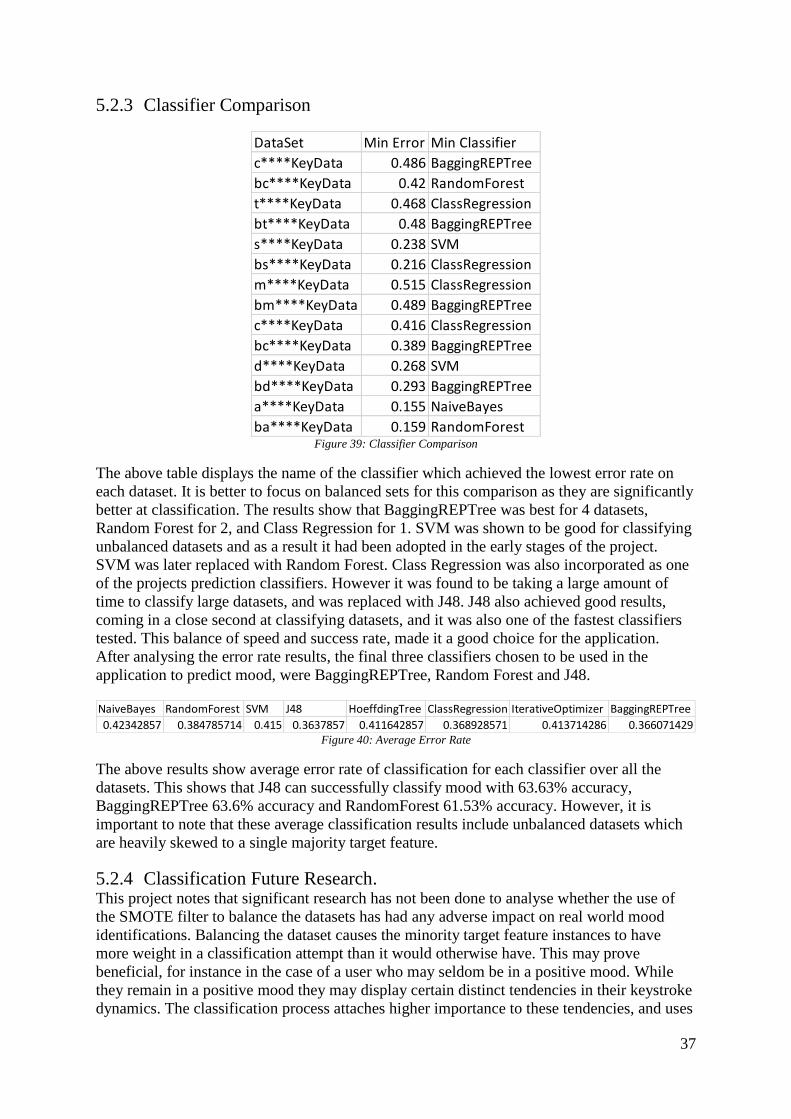
37
5.2.3 Classifier Comparison
Figure 39: Classifier Comparison
The above table displays the name of the classifier which achieved the lowest error rate on
each dataset. It is better to focus on balanced sets for this comparison as they are significantly
better at classification. The results show that BaggingREPTree was best for 4 datasets,
Random Forest for 2, and Class Regression for 1. SVM was shown to be good for classifying
unbalanced datasets and as a result it had been adopted in the early stages of the project.
SVM was later replaced with Random Forest. Class Regression was also incorporated as one
of the projects prediction classifiers. However it was found to be taking a large amount of
time to classify large datasets, and was replaced with J48. J48 also achieved good results,
coming in a close second at classifying datasets, and it was also one of the fastest classifiers
tested. This balance of speed and success rate, made it a good choice for the application.
After analysing the error rate results, the final three classifiers chosen to be used in the
application to predict mood, were BaggingREPTree, Random Forest and J48.
Figure 40: Average Error Rate
The above results show average error rate of classification for each classifier over all the
datasets. This shows that J48 can successfully classify mood with 63.63% accuracy,
BaggingREPTree 63.6% accuracy and RandomForest 61.53% accuracy. However, it is
important to note that these average classification results include unbalanced datasets which
are heavily skewed to a single majority target feature.
5.2.4 Classification Future Research. This project notes that significant research has not been done to analyse whether the use of
the SMOTE filter to balance the datasets has had any adverse impact on real world mood
identifications. Balancing the dataset causes the minority target feature instances to have
more weight in a classification attempt than it would otherwise have. This may prove
beneficial, for instance in the case of a user who may seldom be in a positive mood. While
they remain in a positive mood they may display certain distinct tendencies in their keystroke
dynamics. The classification process attaches higher importance to these tendencies, and uses
DataSet Min Error Min Classifier
c****KeyData 0.486 BaggingREPTree
bc****KeyData 0.42 RandomForest
t****KeyData 0.468 ClassRegression
bt****KeyData 0.48 BaggingREPTree
s****KeyData 0.238 SVM
bs****KeyData 0.216 ClassRegression
m****KeyData 0.515 ClassRegression
bm****KeyData 0.489 BaggingREPTree
c****KeyData 0.416 ClassRegression
bc****KeyData 0.389 BaggingREPTree
d****KeyData 0.268 SVM
bd****KeyData 0.293 BaggingREPTree
a****KeyData 0.155 NaiveBayes
ba****KeyData 0.159 RandomForest
NaiveBayes RandomForest SVM J48 HoeffdingTree ClassRegression IterativeOptimizer BaggingREPTree
0.42342857 0.384785714 0.415 0.3637857 0.411642857 0.368928571 0.413714286 0.366071429
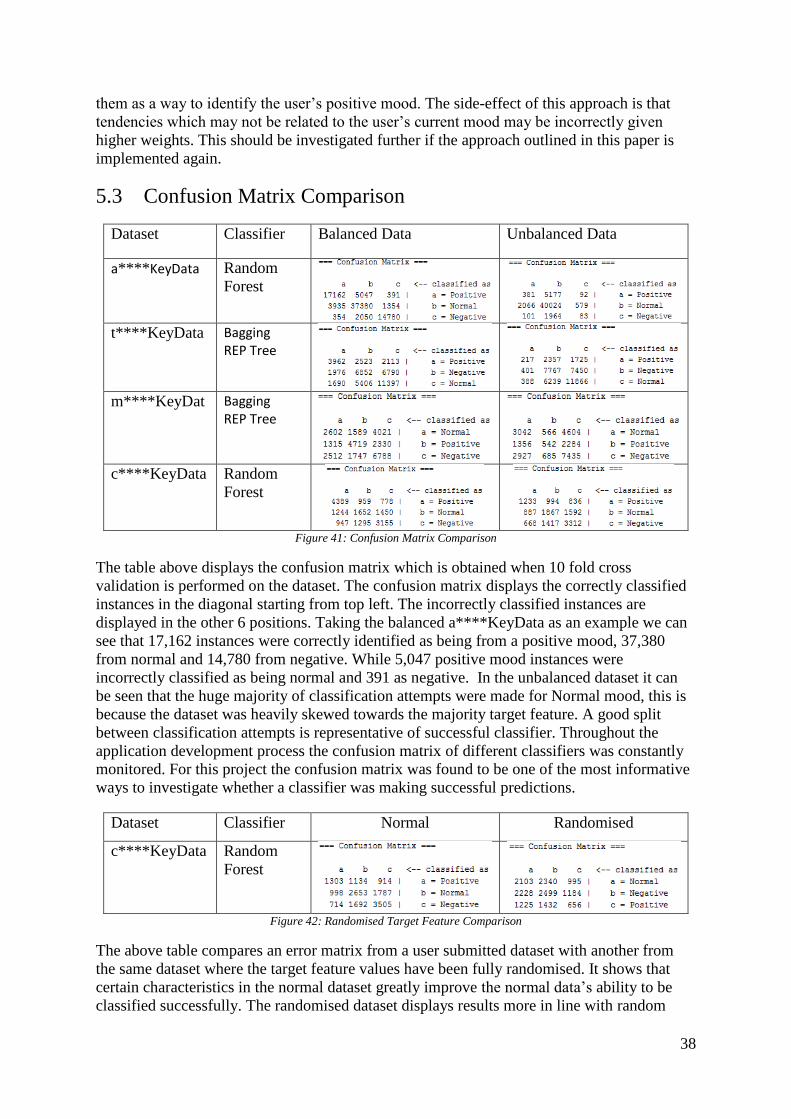
38
them as a way to identify the user’s positive mood. The side-effect of this approach is that
tendencies which may not be related to the user’s current mood may be incorrectly given
higher weights. This should be investigated further if the approach outlined in this paper is
implemented again.
5.3 Confusion Matrix Comparison
Dataset Classifier Balanced Data Unbalanced Data
a****KeyData
Random
Forest
t****KeyData Bagging
REP Tree
m****KeyDat Bagging REP Tree
c****KeyData Random
Forest
Figure 41: Confusion Matrix Comparison
The table above displays the confusion matrix which is obtained when 10 fold cross
validation is performed on the dataset. The confusion matrix displays the correctly classified
instances in the diagonal starting from top left. The incorrectly classified instances are
displayed in the other 6 positions. Taking the balanced a****KeyData as an example we can
see that 17,162 instances were correctly identified as being from a positive mood, 37,380
from normal and 14,780 from negative. While 5,047 positive mood instances were
incorrectly classified as being normal and 391 as negative. In the unbalanced dataset it can
be seen that the huge majority of classification attempts were made for Normal mood, this is
because the dataset was heavily skewed towards the majority target feature. A good split
between classification attempts is representative of successful classifier. Throughout the
application development process the confusion matrix of different classifiers was constantly
monitored. For this project the confusion matrix was found to be one of the most informative
ways to investigate whether a classifier was making successful predictions.
Dataset Classifier Normal Randomised
c****KeyData Random
Forest
Figure 42: Randomised Target Feature Comparison
The above table compares an error matrix from a user submitted dataset with another from
the same dataset where the target feature values have been fully randomised. It shows that
certain characteristics in the normal dataset greatly improve the normal data’s ability to be
classified successfully. The randomised dataset displays results more in line with random
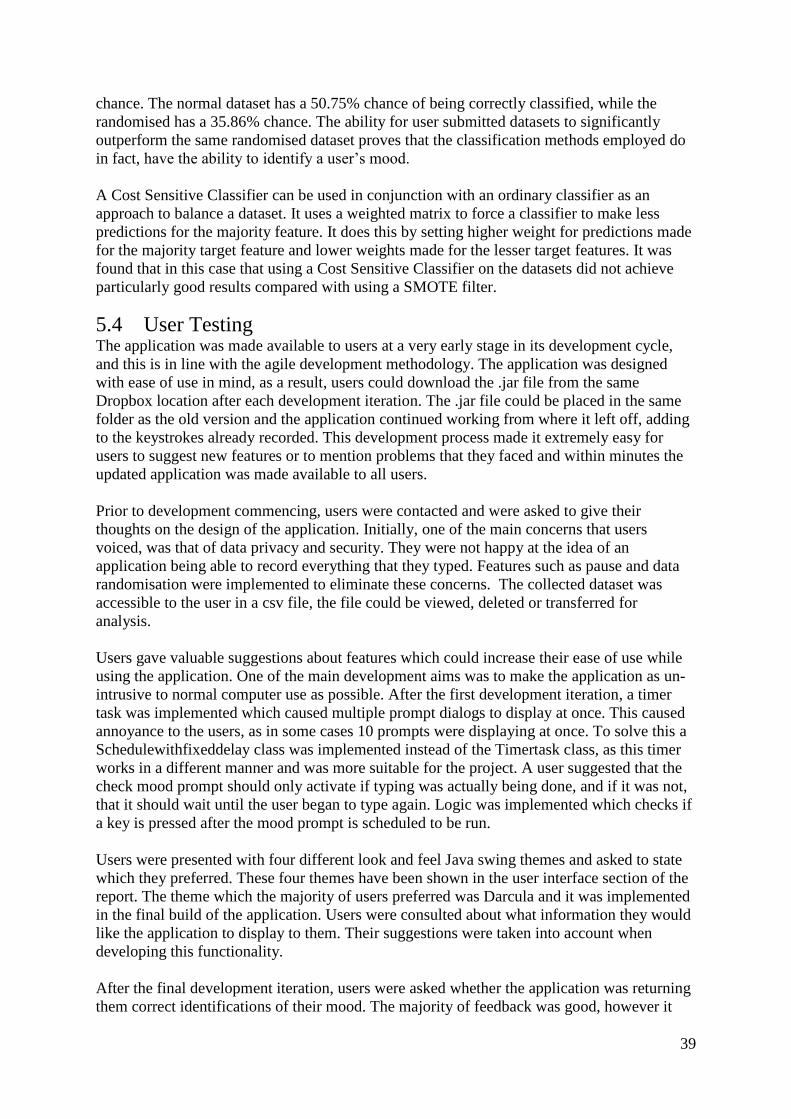
39
chance. The normal dataset has a 50.75% chance of being correctly classified, while the
randomised has a 35.86% chance. The ability for user submitted datasets to significantly
outperform the same randomised dataset proves that the classification methods employed do
in fact, have the ability to identify a user’s mood.
A Cost Sensitive Classifier can be used in conjunction with an ordinary classifier as an
approach to balance a dataset. It uses a weighted matrix to force a classifier to make less
predictions for the majority feature. It does this by setting higher weight for predictions made
for the majority target feature and lower weights made for the lesser target features. It was
found that in this case that using a Cost Sensitive Classifier on the datasets did not achieve
particularly good results compared with using a SMOTE filter.
5.4 User Testing The application was made available to users at a very early stage in its development cycle,
and this is in line with the agile development methodology. The application was designed
with ease of use in mind, as a result, users could download the .jar file from the same
Dropbox location after each development iteration. The .jar file could be placed in the same
folder as the old version and the application continued working from where it left off, adding
to the keystrokes already recorded. This development process made it extremely easy for
users to suggest new features or to mention problems that they faced and within minutes the
updated application was made available to all users.
Prior to development commencing, users were contacted and were asked to give their
thoughts on the design of the application. Initially, one of the main concerns that users
voiced, was that of data privacy and security. They were not happy at the idea of an
application being able to record everything that they typed. Features such as pause and data
randomisation were implemented to eliminate these concerns. The collected dataset was
accessible to the user in a csv file, the file could be viewed, deleted or transferred for
analysis.
Users gave valuable suggestions about features which could increase their ease of use while
using the application. One of the main development aims was to make the application as un-
intrusive to normal computer use as possible. After the first development iteration, a timer
task was implemented which caused multiple prompt dialogs to display at once. This caused
annoyance to the users, as in some cases 10 prompts were displaying at once. To solve this a
Schedulewithfixeddelay class was implemented instead of the Timertask class, as this timer
works in a different manner and was more suitable for the project. A user suggested that the
check mood prompt should only activate if typing was actually being done, and if it was not,
that it should wait until the user began to type again. Logic was implemented which checks if
a key is pressed after the mood prompt is scheduled to be run.
Users were presented with four different look and feel Java swing themes and asked to state
which they preferred. These four themes have been shown in the user interface section of the
report. The theme which the majority of users preferred was Darcula and it was implemented
in the final build of the application. Users were consulted about what information they would
like the application to display to them. Their suggestions were taken into account when
developing this functionality.
After the final development iteration, users were asked whether the application was returning
them correct identifications of their mood. The majority of feedback was good, however it

40
was mentioned that the time it took the prediction process to identify their mood meant that
their mood could have changed by the time the result was returned. This meant that the
application prediction process was comparing the user’s mood from the time it started and
returned the identification prediction some time later. All users who returned feedback said
that the application had made successful identifications.
6 Conclusion
6.1 Introduction This chapter discusses the results obtained on completion of this project and the conclusions
that can be drawn from them. It aims to predict how the work can be improved and continued
into the future.
6.1.1 Results Results returned in this project suggest that a mood, Positive, Normal or Negative can be
classified with 50.5% to 84.1% accuracy. The average prediction accuracy was found to be
64.33% over all balanced and unbalanced datasets. The datasets collected in this project were
mainly unbalanced, and as a result it was necessary to generate a baseline accuracy using a
ZeroR classifier for comparison. Calculations were done to determine the validity of the
project’s classification approach by subtracting the baseline error rate from the classifier error
rate. The results obtained suggest that mood can be identified from 8.8% to 32.4% more
accurately than by merely predicting the majority target feature. It was found that the more
balanced a dataset was, the larger the classification accuracy grew compared to the baseline.
Different balancing approaches were examined and it was found that using the SMOTE filter
returned the best results. On average, a balanced dataset has a 13.28% better chance of
classifying mood compared with an unbalanced dataset, taking into account a baseline set by
the ZeroR classifier. The best result found that a balanced dataset identified mood with 32.4%
more accuracy than did the same unbalanced set.
Many different classifiers were compared and it was found that on average the J48 classifier
could successfully classify mood with 63.63% accuracy, BaggingREPTree with 63.6%
accuracy, RandomForest with 61.53% accuracy, ClassRegression with 63.11% accuracy and
SVM with 58.5% accuracy. The classifiers implemented in the application’s final build were,
RandomForest, BaggingREPTree and J48. Near the end of the project’s lifecycle the
application was updated and released with the mood prediction functionality enabled. Users
returned feedback which suggests that that application frequently correctly predicted their
current mood.
It can be concluded, based on the results obtained from the classifier evaluations done
throughout this project that a user’s unique keystroke pattern does change in such a manner
as to facilitate the identification of mood.
6.1.2 Future Work With the emergence of smart technology, I anticipate that a solution like this could enable
systems to make better decisions about how to interact with their users. The solution could be
developed as an API and could be a great resource for Java developers to avail of when
creating applications. For example a developer who is creating a game, that requires an
amount of text input, could use this API to incorporate the user’s real life mood into the
surrounding game. Advertisers could use this API to discover how users respond to their
41
advertisements. Applications could be developed for the medical industry to assist people
with mood disorders, where the application could alert family and friends if the user was
unwell.
Statistical data obtained from the application could be stored on a cloud service. Similarities
in different users’ typing dynamics could then be aggregated and compared. There is
potential for the scientific community to use a solution like this to get a better understanding
of how individuals use computers. If this project continues it would be important to record
and analyse the real world mood predictions made by the application. In the future it might be
feasible to integrate mouse movements into the identification of mood. It could be possible to
use mouse click dwell time, flight time and movement positions to assist with the
classification of different moods. It might also be possible to develop a solution that could
measure a person’s mood while they use a mobile phone, using the same techniques
employed in the solution.
There is potential to use a second form of mood identification, such as sensors that monitor
areas of the user’s body. This form of identification could be used in unison with this
application while it was recording a training dataset. This may give more exact readings for
the user’s mood, which would then result in the dataset being more complete. It might be
possible to identify other human emotions such as tiredness and stress, using keystroke
dynamics and the classification approach discovered in this project.

42
7 Bibliography
1 Tao, Jianhua; Tieniu Tan. Affective Computing: A Review. Affective Computing and
Intelligent Interaction. LNCS 3784. Springer.2005; 981–995.
2 Aleix Martinez, Shichuan Du, A Model of the Perception of Facial Expressions of
Emotion by Humans 2012;1591-1608
3 Hudlicka, Eva (2003). To feel or not to feel: The role of affect in human-computer
interaction". International Journal of Human-Computer Studies 59 (1–2): 1–32.
4 Deng Y, Zhong Y. Keystroke Dynamics User Authentication Based on Gaussian Mixture
Model and Deep Belief Nets. ISRN Signal Processing. 2013;2013:1-7.
5 Biometric-solutions.com. Keystroke Dynamics [Internet]. 2015 [cited 1 December 2015].
Available from: http://www.biometric-
solutions.com//solutions/index.php?story=keystroke_dynamics
6 Joyce R, Gupta G. Identity authentication based on keystroke latencies. Communications
of the ACM. 1990;33(2):168-176.
7 Solanki R, Shukla P. Estimation of the User’s Emotional State by Keystroke Dynamics.
International Journal of Computer Applications. 2014;94(13):21-23.
8 Encyclopedia Britannica. Machine learning | artificial intelligence [Internet]. 2014 [cited
1 December 2015]. Available from: http://www.britannica.com/technology/machine-
learning
9 17. Bishop C. Pattern recognition and machine learning. New York, NY: Springer
Science + Business Media LLC; 2010.
10 Epp, C., Lippold, M., Mandryk, R.L.: Identifying emotional states using keystroke
dynamics. Proceedings of the 2011 Annual Conference on Human Factors in Computing
Systems. 2011;715–724.
11 Nahin A, Alam J, Mahmud H, Hasan K. Identifying emotion by keystroke dynamics and
text pattern analysis. Behaviour & Information Technology. 2014;33(9):987-996.
12 Epp, C. Identifying emotional states through keystroke dynamics. 2010.
http://hci.usask.ca/uploads/203-p715-epp.pdf
13 Docs.oracle.com. KeyListener (Java Platform SE 7 b99) [Internet]. 2015 [cited 2
December 2015]. Available from:
http://docs.oracle.com/javase/7/docs/api/java/awt/event/KeyListener.html
14 Docs.oracle.com. KeyEvent (Java Platform SE 7 b99) [Internet]. 2015 [cited 1 December
2015]. Available from:
http://docs.oracle.com/javase/7/docs/api/java/awt/event/KeyEvent.html
15 Selenium.googlecode.com. org.openqa.selenium.interactions [Internet]. 2015 [cited 2
December 2015]. Available from:
http://selenium.googlecode.com/svn/trunk/docs/api/java/org/openqa/selenium/interactions
/package-summary.html
16 GitHub. SeleniumHQ/selenium [Internet]. 2015 [cited 2 December 2015]. Available
from: https://github.com/SeleniumHQ/selenium
17 18. De Ville B. Decision trees. Wiley Interdisciplinary Reviews: Computational Statistics.
2013; 5(6):448-455.
18 Sheng Y., Phoha V., and Rovnyak, S. A parallel decision tree-based method for user
authentication based on keystroke patterns. IEEE Transactions on Systems, Man, and
Cybernetics 2005; 35(4):826-833.
19 Romain Giot, Mohamad El-Abed, Christophe Rosenberger. Keystroke Dynamics With
Low Constraints SVM Based Passphrase Enrollment. IEEE International Conference on
Biometrics: Theory, Applications and Systems 2009;
43
20 Badioze Zaman H. Advances in visual informatics. Third International Visual Informatics
Conference, IVIC 2013;
21 Feher C, Elovici Y, Moskovitch R, Rokach L, Schclar A. User identity verification via
mouse dynamics. Information Sciences. 2012;201:19-36.
22 Nan Zheng, Aaron Paloski, Haining Wang. An Efficient User Verification System via
Mouse Movements. Department of Computer Science, The College of William and Mary.
2013
23 Khanna P, Sasikumar M. Recognising Emotions from Keyboard Stroke Pattern.
International Journal of Computer Applications. 2010;11(9):1-5.
24 Affectiva. Home - Affectiva [Internet]. 2015 [cited 4 December 2015]. Available from:
http://www.affectiva.com/
25 Kieron Monks f. This new tech can detect your mood - CNN.com [Internet]. CNN. 2015
[cited 4 December 2015]. Available from:
http://edition.cnn.com/2014/02/04/tech/innovation/this-new-tech-can-detect-your-mood/
26 Beyondverbal.com. Beyond Verbal | Analyze your emotions now! [Internet]. 2015 [cited
4 December 2015]. Available from: http://www.beyondverbal.com/
27 Stylus | Innovation Research & Advisory. Xpression Voice-Monitoring App | Stylus |
Innovation Research & Advisory [Internet]. 2015 [cited 4 December 2015]. Available
from: http://www.stylus.com/kqgqxp
28 Jain A, Bolle R, Pankanti S. Biometrics: Personal Identification in Networked Society
New York: Kluwer; 2002.
29 Weka 3 - Data Mining with Open Source Machine Learning Software in Java [Internet].
Cs.waikato.ac.nz. 2016 [cited 2 April 2016]. Available from:
http://www.cs.waikato.ac.nz/ml/weka/
30 Weka 3 - Data Mining with Open Source Machine Learning Software in Java [Internet].
Cs.waikato.ac.nz. 2016 [cited 2 April 2016]. Available from:
http://www.cs.waikato.ac.nz/~ml/weka/gui_explorer.html
31 Weka API [Internet]. Weka.sourceforge.net. 2016 [cited 2 April 2016]. Available from:
http://weka.sourceforge.net/doc.stable/
32 Geisser S. Predictive inference. New York: Chapman & Hall; 1993.
33 Study Resource for Dunlop's Statistics and Data Analysis : From Elementary to
Intermediate; 2016.
34 MADlib: Cross Validation [Internet]. Doc.madlib.net. 2016 [cited 2 April 2016].
Available from: http://doc.madlib.net/v1.1/group__grp__validation.html
35 Arabnia H. Emerging trends in applications and infrastructures for computational
biology,... bioinformatics, and systems biology. [S.l.]: Morgan Kaufmann Publisher;
2016.
36 Sewell M. Bagging [Internet]. Machine-learning.martinsewell.com. 2016 [cited 2 April
2016]. Available from: http://machine-learning.martinsewell.com/ensembles/bagging/
37 Aslam, Javed A.; Popa, Raluca A.; and Rivest, Ronald L. (2007); On Estimating the Size
and Confidence of a Statistical Audit, Proceedings of the Electronic Voting Technology
Workshop (EVT '07), Boston, MA, August 6, 2007.
38 Bagging [Internet]. Weka.sourceforge.net. 2016 [cited 2 April 2016]. Available from:
http://weka.sourceforge.net/doc.dev/weka/classifiers/meta/Bagging.html
39 REPTree [Internet]. Weka.sourceforge.net. 2016 [cited 2 April 2016]. Available from:
http://weka.sourceforge.net/doc.dev/weka/classifiers/trees/REPTree.html
40 38. Analysis of WEKA Data Mining Algorithm REPTree, Simple Cart and RandomTree
for Classification of Indian News. International Journal of Innovative Science,
Engineering & Technology. 2015; 440-441.
44
41 J48 [Internet]. Weka.sourceforge.net. 2016 [cited 2 April 2016]. Available from:
http://weka.sourceforge.net/doc.dev/weka/classifiers/trees/J48.html
42 Top Data Mining Algorithms Identified by IEEE & Related Python Resources – Data
Science Central [Internet]. 2016 [cited 2 April 2016]. Available from:
http://www.datasciencecentral.com/m/blogpost?id=6448529%3ABlogPost%3A300584
43 Snasel V, Platos J, El-Qawasmeh E. Digital information processing and communications.
Berlin: Springer; 2011.
44 Introduction to Support Vector Machines — OpenCV 2.4.12.0 documentation [Internet].
Docs.opencv.org. 2016 [cited 2 April 2016]. Available from:
http://docs.opencv.org/2.4/doc/tutorials/ml/introduction_to_svm/introduction_to_svm.ht
ml
45 SMO [Internet]. Weka.sourceforge.net. 2016 [cited 2 April 2016]. Available from:
http://weka.sourceforge.net/doc.dev/weka/classifiers/functions/SMO.html
46 Chawla N. Data Mining for Imbalanced Datasets: An Overview. Data Mining and
Knowledge Discovery Handbook. 2009:875-886.
47 N. V. Chawla, K. W. Bowyer, L. O. Hall and W. P. Kegelmeyer SMOTE: Synthetic
Minority Over-sampling Technique. 2002: 321-357
48 SMOTE [Internet]. Weka.sourceforge.net. 2016 [cited 2 April 2016]. Available from:
http://weka.sourceforge.net/doc.packages/SMOTE/weka/filters/supervised/instance/SMO
TE.html
49 Java – Global (low level) Keyboard / Mouse Hook (Old) : Kristian Kraljic – kra.lc
[Internet]. Kra.lc. 2016 [cited 2 April 2016]. Available from:
http://kra.lc/blog/2011/07/java-global-system-hook-old/
50 Frost G, Frost G. Top 6 Benefits of Agile Software Development [Internet]. 51zero Ltd.
2016 [cited 3 April 2016]. Available from: http://www.51zero.com/blog/2016/2/23/top-5-
benefits-of-agile-software-development
51 Introduction to Weka [Internet]. 2016 [cited 4 April 2016]. Available from:
https://www.cs.auckland.ac.nz/courses/compsci367s1c/tutorials/IntroductionToWeka.pdf
52 ZeroR [Internet]. Weka.sourceforge.net. 2016 [cited 11 April 2016]. Available from:
http://weka.sourceforge.net/doc.dev/weka/classifiers/rules/ZeroR.html
53 RandomForest [Internet]. Weka.sourceforge.net. 2016 [cited 11 April 2016]. Available
from: http://weka.sourceforge.net/doc.dev/weka/classifiers/trees/RandomForest.html