a study of surface film formation on lini0.8co0.15al0.05o2 .../67531/metadc782899/m2/1/high... ·...
TRANSCRIPT

A Study of Surface Film Formation on LiNi0.8Co0.15Al0.05O2 Cathodes Using Attenuated Total Reflection Infrared Spectroscopy
S.-W. Song a,*, G. V. Zhuang b,*,z and P.N. Ross, Jr. b,*
a Environmental Energy Technologies Division bMaterials Sciences Division
Lawrence Berkeley National Laboratory Berkeley, CA 94720, USA
Abstract
The surface films formed on commercial LiNi0.8Co0.15Al0.05O2 cathodes (ATD Gen2) charged from 3.75V to 4.2V vs. Li/Li+ in EC:DEC - 1M LiPF6 were analyzed using ex-situ Fourier transform infrared spectroscopy (FTIR) with the attenuated total reflection (ATR) technique. A surface layer of Li2CO3 is present on the virgin cathode, probably from reaction of the active material with air during the cathode preparation procedure. The Li2CO3 layer disappeared even after soaking in the electrolyte, indicating that the layer dissolved into the electrolyte possibly even before potential cycling of the electrode. IR features only from the binder (PVdF) and a trace of polyamide from the Al current collector were observed on the surfaces of cathodes charged to below 4.2 V, i.e. no surface species from electrolyte oxidation. Some new IR features were, however, found on the cathode charged to 4.2 V and higher. An electrolyte oxidation product was observed that appeared to contain dicarbonyl anhydride and (poly)ester functionalities. The reaction appears to be an indirect electrochemical oxidation with overcharging (removal of > 0.6 Li ions) destabilizing oxygen in the oxide lattice resulting in oxygen transfer to the solvent molecules.
*Electrochemical Society Active Member zAuthor to whom all correspondence should be addressed. Phone: +1-510-486-4793 Fax: +1-510-486-5530 Email:[email protected]

2
Introduction
Lithium-ion cells generally exhibit a relatively large (ca. 15-20 %) irreversible
loss of capacity during the initial few cycles. Research in the last decade has established
that most of this irreversible capacity loss is due to the formation of the so-called solid-
electrolyte interface layer (SEI) on graphite and other carbon-based negative electrodes1-
11. These irreversible reactions are comprised of electrochemical reductions of the
electrolyte below the potential ca. 1.5V vs. Li/Li+, but the specific reactions occurring
and specific composition of the SEI layer in commercial cells has been difficult to
establish, and complicated by adventitious impurities introduced during processing and
assembly11. There have also been reports of irreversible capacity loss on the first few
cycles with LiCoO2 and LiMn2O4 cathodes12-17. There have been several reports that an
SEI layer also forms on cathodes such as LiCoO2, LiMn2O4, and LiNi1-xCoxO2 from
electrolyte oxidation18-25, although the nature of the reactions is unclear. More recently,
Abraham and co-workers26 proposed formation of an oxygen deficient surface layer on a
LiNi1-xCoxO2 cathode as a result of oxygen transfer reactions with the electrolyte. A
variety of spectroscopic methods have been applied ex-situ to analyze surface films
formed on Ni, Co and Mn-based cathodes harvested from cells, including NMR22, XPS23
(x-ray photoelectron spectroscopy) and XAS21,24,26 (x-ray absorption spectroscopy), but
the results were only suggestive not conclusive.
Recently, ab-initio density functional theory (DFT)27 was used to examine the
energetics of electrochemical oxidation of common battery solvents, including EC and
DEC and DMC. The thermodynamic potentials calculated for the initial one-electron
ionization to form a radical cation are 5.58 V (vs. Li/Li+) for EC and 5.46 V for DEC (or

3
DMC, there is very little difference). The experimental oxidation potential values
reported in the literature vary significantly. It appears that the solvent oxidation
potential can be influenced by composition of the cathode materials as well as the salt
used in the electrolyte. Impurities, particularly water, may also play an important role.
Another source of variability in the experimental measurement of the oxidation potential
is the arbitrary criteria used for determining the onset of anodic current. In general, with
inert electrodes like glassy carbon or Pt, the experimental oxidation potentials for the
common carbonate electrolytes are above 5 V (see Table V in ref. 27), but there are
exceptional reports even in recent literature.
Of particular relevance here are the recent conflicting reports on the oxidation
potential for EC-based electrolytes by Aurbach and co-workers28 and Joho and Novak29.
While Aurbach and co-workers studied many more solvent-salt combinations than Joho
and Novak, they did have one electrolyte in common, 1:1 EC:DMC – 1 M LiPF6, yet
reported dramatically different oxidation potentials using similar detection methods (in-
situ IR spectroscopy). Aurbach and co-workers reported an oxidation potential below 4
V for this electrolyte using Pt, Au and Al as electrodes, while Joho and Novak reported
an oxidation potential above 5 V. Joho and Novak noted a strong effect of water on the
oxidation potential (lowering), but it is not clear that adventitious water is the
explanation for the discrepancy. Kanamura and co-workers14-16 have also studied
electrolyte oxidation reactions with in-situ IR spectroscopy using PC with a variety of
salts and different electrode materials. When using Pt or Au electrodes14, they observed
the onset of PC oxidation at potentials above 5 V, but with LiCoO2 electrodes16 they
detected multiple products attributed to a PC ring opening reaction that was initiated at

4
4.2 V in all three salts, LiClO4, LiBF4, and LiPF6. Kanamura and co-workers have
termed the reaction of PC with LiCoO2 in the 4.2 – 4.8 V region as a “catalytic” reaction
without defining this term more completely. It would appear that the thermodynamic
potential for oxidation of carbonates like EC, PC and DEC/DMC by (outer-sphere) one-
electron ionization to form the radical cation is indeed in the region of 5.5 – 6 V as
calculated by DFT, but that other oxidation reactions are also possible, and these may
occur at lower potential due to specific interactions (the “catalytic” effect) with the
electrode surface, e.g. the lattice oxygen.
Recently, we reported high quality IR spectra of the passive film on graphite
anodes obtained ex-situ using the attenuated total reflection (ATR) technique30. The
graphite anodes were harvested from an 18650-type lithium cell with a
LiNi0.8Co0.15Al0.05O2 cathode, the same cathode material studied here, following
calendar aging31 (60% state of charge) at 55 oC as part of the ATD program managed by
DOE.32 There were no IR features of surface species (solvent oxidation products)
observable on the cathode. These cathodes were, however, rinsed in DMC before
analysis, and soluble oxidation products (as reported by Kanamura et al 16) would have
been washed off. In the present work, we report a more detailed study using ex-situ
ATR-IR spectroscopy of the LiNi0.8Co0.15Al0.05O2 cathode material following
electrochemical characterization in half cells vs. a Li counter electrode and varying
washing time with DMC. It is shown that indeed there is a surface reaction between
EC:DEC and LiNi0.8Co0.15Al0.05O2 , but only at 4.2 V or higher, and no reaction was
observed at the potential region corresponding to the 60 % state of charge used in the

5
calender aging of the 18650 cells. We also show that the reaction product at 4.2 V is
soluble in DMC and is removed by rinsing.
Experimental
The LiNi0.8Co0.15Al0.05O2 powder cathodes (denoted henceforth as the Gen2
cathode) laminated on the 30 µm thick aluminum current collector were provided by
Quallion Corp. (Sylmar, CA) and were composed of 84wt% active LiNi0.8Co0.15Al0.05O2
powders (Fuji CA 1505), 4wt% amorphous carbon (Chevron), 4wt% graphite (SFG16,
Timcal) and 8wt% PVdF (polyvinylidene-difluoride) binder (Kureha).26 The cathode
laminates as received were dried at 80oC overnight in a vacuum oven before storing in
the helium-filled glove box (water and oxygen content is less than 10 ppm).
Electrochemical cells for the cathodes with 1 cm2 area were assembled using Swagelok
fittings with a Li reference electrode and a Li counter electrode, and Celgard 2300
separator in 1M LiPF6/EC:DEC (1:1) electrolyte (LP 40 Selectipur™ from EM
Sciences) in the glove box. Identical cells were separately charged at a low rate of C/25
at room temperature using a commercial battery cycler (Arbin, College Station, TX). In
each case, the cell was charged (cathode was delithiated) to 3.75 V, discharged
(lithiated) to 3.0 V, then charged to final cut-off potentials between 3.75 and 4.2V vs.
Li/Li+. The cells were then held at those final potentials for two hours prior to
disassembly in the glove box, and the cathodes were removed from the glove box for IR
analysis. First unwashed cathodes were measured by FTIR, returned to the glove box,
and then washed with DMC followed by solvent evaporation in the glove box at room
temperature. IR spectra were obtained with varying washing time with DMC. For
comparison, we also prepared control samples of an as-received Gen2 cathode and gold

6
(Au) foil soaked in the same electrolyte for 24 hrs. without applying any
electrochemistry. DMC washing-time dependent IR spectra were also obtained. Under
no circumstances were any of the samples subject to air exposure. All samples were
transferred from the glove box to the helium-purged FTIR spectrometer sample chamber
using a portable vacuum-sealed container.
The FTIR measurements were obtained with a Nicolet Nexus 870 Spectrometer
equipped with a broadband Mercury-Cadmium-Telluride (MCT) detector. The spectra
were acquired in the Attenuated Total Reflection (ATR) mode using a hemispherical Ge
optic with spectral resolution of 4 cm-1 with a total of 512 scans co-added. All the
spectra were obtained from a 2 mm diameter area on samples pressed against the Ge
crystal. We emphasize that all the FTIR measurements were performed directly on the
surface of interest without any preparation such as scraping the cathode powders from
the aluminum current collector. The penetration depth of the (mid-)infrared light (2000
cm-1) into a medium with n = 1.5 (an optical constant typical for organic compounds) is
on the order of magnitude of 400 nm. The ATR-FTIR spectra were corrected for the
light penetration depth as function of wavelength. A linear background correction was
also performed to eliminate the sloping spectral background caused by surface
roughness. None of the spectra shown were subjected to a “smoothing” algorithm.
Results
LiNi0.8Co0.15Al0.05O2 cathode as-recieved
Infrared spectrum of the Gen2 cathode as-received from Quallion is presented in
Figure 1. Spectral comparison between the Gen2 cathode and just PVdF powder, used in
laminating Gen2 cathode, shows that most of the features in the spectral region of 1300-

7
800 cm-1 could be readily attributed to PVdF. However, the strongest feature centered
about 1400 cm-1 is much broader than that of the pure PVdF. Peak broadening and skew
in the low wave number region are typical for a rough sample surface, but the feature
broadening at 1400-1500 cm-1 is due to quite different origin. As shown by the reference
spectrum of Li2CO3 in Figure 1, the strong peak at 1416 cm-1 and a shoulder at 1500 cm-
1 could be assigned to the C-O asymmetric and symmetric stretching modes of Li2CO3.
Li2CO3 also has a sharp peak at 875 cm-1 associated with the (CO3)-2 bending mode,
which overlaps with spectral features from PVdF in the same region. To our knowledge,
this Li2CO3 is not an intentional additive, but is a layer that forms on the active cathode
material by reaction with CO2 in the air during processing. This observation is not new,
and in fact there has been a detailed study33 of the reaction of this class of cathode
material (LiNi1-x-yCoxAlyO2) with CO2 in ambient air, and Andersson et al.23 reported
finding Li2CO3 in the as-received GEN1 cathode material (y=0).
The IR spectrum in Figure 1 also shows that lithium carbonate is not the only
impurity introduced into the cathode material during processing. In the CH group
frequency region of 2750 – 3250 cm-1 shown in Figure 2 (top), PVdF has two sharp
peaks at 3020 cm-1 and 2982 cm-1 (from the olefinic =CH– group), but the most
prominent peaks observed on Gen2 cathode are at 2922 and 2849 cm-1 characteristic
asymmetric and symmetric stretching modes34,35 of the methylene group (–CH2– ), e.g.
in an alkyl or paraffin compound. To investigate the source of this impurity, we made
an FTIR measurement on regions of the Al current collector which is not covered by
cathode laminate. The presence of a polymer film is unmistakable from the spectrum
marked as cathode foil in the lower panel of Fig.2. This IR spectrum indicates the film
8
contains an amide group (R-CO-NH2). The features in the spectral region between 3100
– 3400 cm-1 are of the NH group frequency region. Specifically, peaks at 3352 cm-1 and
3183 cm-1 can be attributed to NH asymmetry and symmetry stretching modes of NH2
group, respectively. The feature at ~1640 cm-1 is characteristic of C=O in the amide34,35.
Judging from the relative peak intensities, the polymer is comprised of a significant
number of (-CH2-) units, although from IR one could not conclude the exact alkane
chain length. There is a striking spectral resemblance between the spectrum from the
cathode foil and the generic polymeric coating material oleamide, which is commonly
used as a corrosion inhibitor36. The strong broad peak centered at 916 cm-1 is from the
contribution of aluminum oxide. Based on the IR penetration depth of ca. 500nm and the
fact we observe the aluminum oxide, the polyamide coating thickness is less than 500
nm (0.5µm). The ν(NH) modes of the polyamide are, however, not seen in the spectrum
of the cathode laminate, while the ν(CH) modes are preserved. We surmise, therefore,
that in solvent casting the cathode layer with n-methyl-pyrrolidinone (NMP), the
polyamide film is stripped from the Al foil and a paraffin polymer is deposited in the
active layer during drying of the NMP.
Spectra of Electrolyte Residue
In order to identify by ex-situ analysis surface species derived from
electrochemically induced changes to an electrode, it is crucial to identify the spectral
features associated with residual electrolyte. In this context, we first examined the
residual electrolyte on a Au foil after it was dipped in the electrolyte. The IR spectra
obtained on Au foil prior to DMC washing is shown in curve (a) and (b) in Fig.3. While
some of the spectral features of DEC were discernable in spectrum (a), as indicated by

9
the presence of peaks at 1740 cm-1, 1300 cm-1, 1268 cm-1, and 1015 cm-1, the spectrum
(b) from a different spot on the surface is consistent with pure liquid phase EC 37 with
two additional features. First, the relatively strong peak at 840 cm-1 is not attributed to
either EC or DEC but is unambiguously assigned to the P-F stretching from solvated
LiPF630. Second, the relative intensity of two bands at 1804 cm-1 and 1769 cm-1, unique
to the EC carbonyl group, is different from that of pure solid or liquid phase EC. In
solid EC, two strong peaks at 1791 and 1829 cm-1 of equal intensity, and are due to a
Fermi resonance between C=O stretching and the overtone of the EC ring breathing
mode at 895 cm-1. A systematic comparison of spectra for solid EC and the residual EC
on Au indicates that the ring breathing mode shifts to 904 cm-1 and the intensity of the
ring breathing overtone at 1804 cm-1 is reduced as a result of the primary solvation of
the LiPF6 by the EC when the DEC evaporates, i.e. the residue is as expected for an
EC:LiPF6 solvate. All of these bands from the electrolyte residue disappeared after
washing with DMC for only 20 seconds (Figure 3(c)). No significant organic species
remain on the surface of the Au foil.
We then compared the spectra from the residue left on the Au foil with those on
the as-received LiNi0.8Co0.15Al0.05O2 cathode soaked in electrolyte under identical
conditions. The cathode soaked in the electrolyte has shown the similar spectral features
(Fig.4 (c)) with that of Au foil prior to DMC washing, suggesting that cathode was
covered by the same EC:LiPF6 solvate. After washing with DMC (as shown by curve (d)
in Fig. 4), peaks attributed to PVdF were observed, where two strong bands at 1171 cm-1
and 1071 cm-1 comes from ν( C-F), and the band at 1400 cm-1 from CH2 bending. Of
particular interest is the disappearance of spectral features from Li2CO3 on the cathode

10
after just soaking in the electrolyte, despite no electrochemistry applied. The strong peak
at 1416 cm-1 and a shoulder at 1500 cm-1, assigned to C-O asymmetric and symmetric
stretching modes of Li2CO3, are clearly absent in Fig. 4(b). The Li2CO3 pre-existing in
the as-received cathode must have been decomposed by contact with the electrolyte,
probably by reaction with the Lewis acid PF5 in equilibrium with LiPF6 in this
electrolyte.41 The electrode surface to electrolyte volume ratio in this experiment was
orders of magnitude higher than in a practical Li-ion battery, so it is not clear that the
pre-existing Li2CO3 layer would be decomposed simply by reaction with the electrolyte
in the cell upon assembly.
Electrochemical and Spectroscopic Characterization of Li1-xNi0.8Co0.15Al0.05O2,
cathodes
Fig. 5(a) shows a voltage profile of the Li1-xNi0.8Co0.15Al0.05O2 cathode between
3.0 and 4.2V in the 1M LiPF6/EC:DEC electrolyte during galvanostatic cycling at the
low rate of C/25. The charge and discharge curves of this cathode, due to the continuous
formation of Li1-xNi0.8Co0.15Al0.05O2 with an hexagonal structure in that voltage region,
are consistent with previous results.38 The irreversible processes are more clearly
distinguished in the calculated differential capacity plots shown in Fig. 5(b). The initial
charge curve shows a sharp large peak at 3.63V and a shoulder around 3.75V attributed
to the Li+ deintercalation. The peak at 3.63V shifted downward to 3.57V and became
smaller on the following cycle, showing a greater peak separation. This suggests two
lithium extraction processes, probably due to the structural change in this cathode
materil. Although the partial substitution of Al and Co for Ni stabilizes the 2-D character
of LiNiO2 structure and improves the electrochemical performance,39, 40 cation mixing

11
between the Li layer and Ni layers during cycling can destabilize the structure. It was
reported39 that the Li1-xNi0.8Co0.15Al0.05O2 type cathode retains a more stable structure,
compared to LiNiO2 until about 0.6 lithium ions are extracted, then the 2-D character of
this structure rapidly decreases when x>0.6. The charge passed to the 4.2V cut-off
voltage used in this work is close to that for the relatively unstable structural region.
Based on the discharge capacity of 1.22 mAh/cm2 (160mAh/g) and on the
calibration of voltage (OCV) vs. state of charge (SOC) for the Li1-xNi0.8Co0.15Al0.05O2
material, in fact 0.6 Li ions are extracted from the cathode charged to 4.2V.Although
extraction of about 0.6 Li from this cathode may not cause severe degradation to the
bulk structure, it could produce formation of an unstable and highly reactive lattice.
Manthiram and co-workers41,42 have reported that Li1-xNi0.85Co0.15O2 loses lattice oxygen
when chemically delithiated to x > 0.6-0.7. As they stated in Ref. 41, in the case of
electrochemical delithiation in an electrochemical cell, molecular oxygen would not be
evolved, rather reaction of the cathode material with the electrolyte may be expected.
The effect of Al doping on the stability of lattice oxygen is not known. But unstable
lattice oxygen formed at 4.2 V in this cathode material might be expected to react with
the electrolyte.
Spectra of the cathode charged to 3.75V before DMC washing are shown in Fig.
6(c). Unwashed cathode exhibits only strong vibration bands of the EC:LiPF6 solvate
from the electrolyte, as observed in control experiments with a Au foil and virgin
cathode soaked in electrolyte. We suggest that the report by Genies et al.6 of
polycarbonate formation on the surface of mesocarbon microbead (MCMB) anodes
charged in EC/LiPF6 electrolyte and examined ex-situ by FTIR is fundamentally a

12
misinterpretation. Their spectrum for the so-called SEI layer (Fig. 13 in ref. 6) is
essentially identical to our spectra in Figure 3 for the solvate on the Au foil.
There was no indication of any species other than the EC:LiPF6 solvate on the
surface of the cathode charged to 3.75 V, i.e. the process(s) producing the peak near 3.6
V in the charging curve (Fig. 5) on the first charge did not produce a product observable
by IR. The same was true of cathodes charged to potentials between 3.75 and 4.1 V.
However, new spectral features were observed on the surface of the unwashed cathode
charged to 4.2 V. Those new features are marked in arrows in curve (d) in Fig.6. In
addition to the new features in the C=O stretching region between 1800-1700 cm-1, two
new peaks appear at ~ 1200 cm-1 and 1084 cm-1. The bands at 1805 cm-1 and 1775 cm-1
could come from a dicarboxylic anhydride34,35, as shown by the reference spectrum in
Figure 7 for maleic anhydride. The simultaneous appearance of three bands of nearly
equal intensity at ca. 1750, 1200 and 1080 cm-1 indicates, in general, the presence of
esters34,35 of carboxylic acids, RCOOR', where the first band comes from carbonyl C=O
stretch, the second from asymmetric C-O-C stretching, and the third involves the ester
oxygen and carbon in an asymmetric stretch (O-C-C) mode. The reference spectrum of
propionic acid ethyl ester in Figure 7 shows these characteristic features as an example.
The reference compound spectra shown in Figure 7 were obtained with our spectrometer
in the same ATR geometry as the spectra from the cathode materials. Similar
functionalities (a dicarboxylic acid anhydride and/or a (poly)ester) were observed by K.
Kanamura et al.16 from in-situ FTIR experiments as electrochemical oxidation products
of propylene carbonate containing LiPF6 or LiBF4 on LiCoO2 cathodes in the
“overcharge” potential region 4.2 – 4.8 V.

13
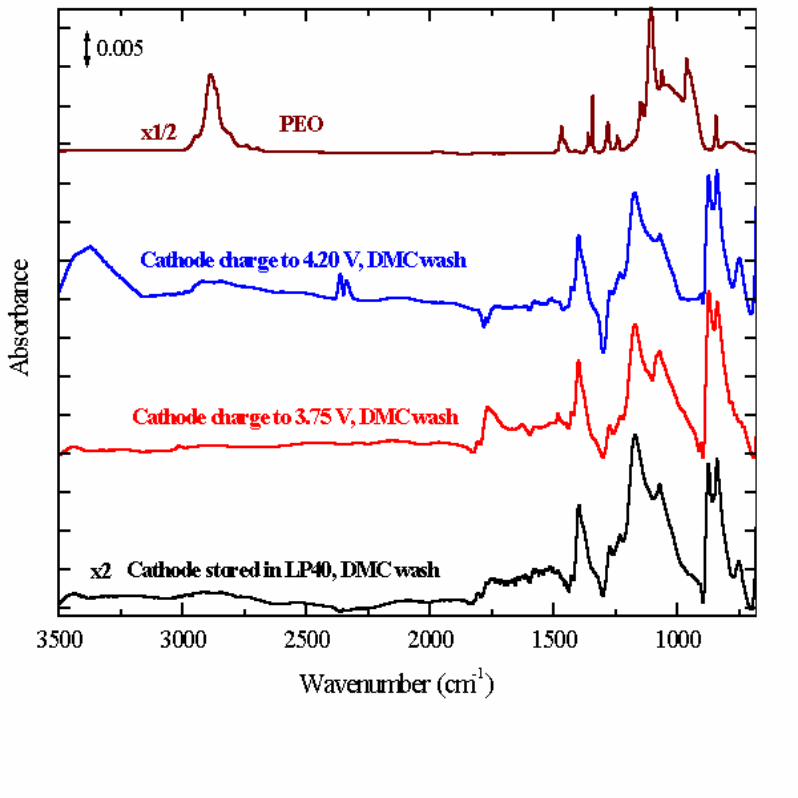
The spectra of the cathodes following DMC washing are shown in Figure 8
along with that of the control cathode (soaked in electrolyte but not charged or
discharged) and a polyether reference sample. Gentle rinsing (10 seconds) with DMC
resulted in much reduced intensity of the peaks in the 1700 – 1850 cm-1 region, and all
features were eliminated by another (10 second) rinse. Only the peaks of PVdF, already
present in the virgin cathode laminate, were observed from the cathodes washed in
DMC. PEO has a unique strong absorption band for the C-O-C (ether) asymmetric
stretching at 1104 cm-1, well-resolved from the vibrational bands of PVdF, which makes
it relatively easy to detect by FTIR. Such features were clearly not observed in the
rinsed cathodes. Still we could not rule out the possibility of a C-O-C (ether)
functionality on the un-washed cathode, since the absorption from the EC:LiPF6 residue
on unwashed cathodes was so strong that features from other species on the cathode
surface could be severely attenuated. Nevertheless, polymers such as PEO or
polyethercarbonate, if indeed formed on the cathode after electrochemistry, should still
be observable after DMC washing, and they are not. The reaction products (a
dicarboxylic acid anhydride and/or alkyl ester) that do form on the surface of the
cathode at 4.2 V are easily rinsed from the surface by DMC. Note that the signatures of
Li2CO3 are absent in the cathode spectra in Fig. 7, confirming the decomposition of the
Li2CO3 at some point in time in these experiments. The major product of LiPF6
decomposition has been reported to be LiF, as observed by NMR, X-ray photoelectron
and X-ray absorption spectroscopic analyses21-23. Unfortunately, LiF is invisible in the
mid-IR (700-4000 cm-1) region, and could not be observed in our experiments.

14
In other experiments from this laboratory using in-situ FTIR, we found that CO2
gas evolved from a glassy carbon working electrode in this identical EC/DEC electrolyte
only at potentials above 5.2 V, well above the 4.2 V cut-off used here and in Li-ion
batteries in general. No surface products could be detected on a glassy carbon electrode
at potentials below 5.2 V, consistent with the in-situ FTIR study by Kanamura et al. for
PC/LiClO4 with “inert” Pt and Au electrodes. DFT quantum chemical calculations have
shown27 that ionization of cyclic carbonates like EC and PC forms an unstable radical
cation, and that the most energetically favorable reaction path is dissociation into CO2
and the radical cation of ethylene oxide (•C2H4O+). In the condensed phase, the latter
could react with EC to form a poly(ether)carbonate, in the manner of Lewis acid
catalyzed polymerization of EC (which also generates CO2 as a co-product)43,44.
However, poly(ether)carbonate was not observed as a product in these experiments. At
lower potentials at oxide cathodes, there appears to be another solvent oxidation path
that is not initiated by ionization of the solvent molecule, but by a chemical interaction
of the solvent molecule with the oxide surface. The reaction appears to be an indirect
electrochemical oxidation, where removal of Li ions in this material at 4.2 V destabilizes
oxygen anions in the oxide lattice41,42, resulting in a highly reactive state and oxygen
transfer from the oxide to the solvent.
Conclusions
FTIR analysis of Gen2 cathodes, charged from 3.75 to 4.2V vs. Li/Li+ in the electrolyte
of EC:DEC(1:1) - 1M LiPF6, indicated formation of an organic surface layer containing
dicarbonyl anhydride and carbonyl ester (RCOOR’) functional groups, but only at 4.2 V.
The surface layer was removed by rinsing with DMC. As a result, only PVdF and a

15
polyamide from the Al current collector remained after washing and drying at room
temperature. A pre-existing surface layer of Li2CO3 present in the virgin cathode was
eliminated just by storing in the electrolyte, and no Li2CO3 was found on the cathode
after cycling. The reaction at 4.2 V appears to be an indirect electrochemical oxidation
where overcharging (x > 0.6) destabilizes oxygen in the oxide lattice resulting in oxygen
transfer from the oxide surface to the solvent molecules.
Acknowledgments
This work was supported by the Office of Advanced Automotive Technologies
of the U. S. Department of Energy under contract No. DE-AC03-76SF00098. We would
like to thank K. A. Striebel for supplying the Gen2 cathode material, J. Shim for his
assistance in electrochemical experiments, and John Kerr for critical discussions.
References
1. E. Peled, in Lithium Batteries, Chapt. 3, J. P. Gabano, Editor, Academic Press, London
(1983).
2. M. Winter, J. O. Besenhard, M. E. Spahr and P. Novak, Adv. Mater. , 10, 725 (1998).
3. A. N. Dey, B. P. Sullivan, J. Electrochem. Soc., 117, 222 (1970).
4. R. Fong, U. von Sacken, J. R. Dahn, J. Electrochem. Soc., 137, 2009 (1990).
5. A. C. Chu, J. Y. Josefowicsz, G. C. Farrington, J. Electrochem. Soc., 144, 41612 (1997)
6. S. Geniès, R. Yazami, J. Garden and J. C. Frison, Synth. Metals, 93, 77 (1998)
7. D. D. MacNeil, D. Larcher, J. R. Dahn, J. Electrochem. Soc., 146, 3596 (1999).
8. D. Aurbach, J. Power Sources, 89, 206 (2000).
9. O. Chusid, Y. Gefer, D. Aurbach, M. Watanabe, T. Momma, T. Osaka, J. Power
Sources, 97-98, 632 (2001)

16
10. K. I. Morigaki, J. Power Sources, 103, 253 (2002).
11. X. Zhang, P. N. Ross, Jr., R. Kostecki, F. Kong, S. Sloop, J. B. Kerr, K. Striebel, E. J.
Cairns, F. McLarnon, J .Electrochem. Soc., 148, A463 (2001).
12. D. D. MacNeil and J. R. Dahn, J. Electrochem. Soc., 148, A1205 (2001).
13. D. D. MacNeil and J. R. Dahn, J. Electrochem. Soc., 148, A1211 (2001).
14. K. Kanamura, J. Power Sources, 81-82, 123 (1999).
15. K. Kanamura, S. Tohyama, S. Shiraishi, M. Ohashi, Z. Takehara, J. Electroanal. Chem.,
419, 77 (1996).
16. K. Kanamura, T. Umegaki, M. Ohashi, S. Toriyama, S. Shiraishi and Z. Takehara,
Electrochim. Acta, 433, 47 (2001).
17. D. Aurbach, K. Gamolsky, B. Markovsky, G. Salitra, Y. Gofer, U. Heider, R. Oestern,
M. Schmidt, J. Electrochem. Soc., 147, 1322 (2000).
18. Z. Wang, X.Huang, L. Chen, J. Electrochem. Soc., 150, A199 (2003).
19. D. Aurbach, J. Power Sources, 81-82, 95 (1999).
20. D. Aurbach, J. Power Sources, 89, 206 (2000).
21. M. Balasubramanian, H. S. Lee, X. Sun, X. Q. Yang, A. R. Moodenbaugh, J. McBreen,
D. A. Fischer, Z. Fu, Electrochem. Solid-State Lett., 5, A22 (2002).
22. Y. Wang, X. Guo, S. Greenbaum, J. Liu, K. Amine, Electrochem. Solid-State Lett., 4,
A68 (2002).
23. A. M. Andersson, D. P. Abraham, R. Haasch, S. MacLaren, J. Liu and K. Amine, J.
Electrochem. Soc., 149, A1358 (2002).
24. T. Eriksson, A. M. Andersson, A. G. Bishop, C. Gejke, T. Gustafsson and J. O. Thomas,
J. Electrochem. Soc., 149, A69 (2002).

17
25. L. Vogdanis and W. Heitz, Macromol. Rapid Commun., 7,543 (1986); L. Vogdanis, B.
Martens, H. Uchtmann, F. Hensel and W. Heitz, Macromol. Chem., 191, 465 (1990).
26. D.P.Abraham, R.D. Twesten, M. Balasubramanian, J. Kropf, D. Fischer, J. McBreen, I.
Petrov, and K. Amine, J. Electrochem. Soc., 150, A1450(2003)
27. X. Zhang, J. K. Pugh and P. N. Ross, J. Electrochem. Soc., 148, E183 (2001).
28. M. Moshkovic, M. Cojocaru, H.E. Gottlieb, and D. Aurbach, J. Electroanal. Chem.
2001, 497, 84.
29. F. Joho and P. Novak, Electrochim. Acta 2000, 45, 3589.
30. G. V. Zhuang and P. N. Ross, Jr., Electrochem. Solid-State Lett., 6, 1 (2003).
31. PNGV Battery Test Manual, DOE/ID-10597, Revision 3, February, 2001.
32. I. Bloom, B.W. Cole, J.J. Sohn, S.A. Jones, E.G. Polzin, V.S. Battaglia, G.L.
Hendrikson, C. Motlock, and R. Richardson, J. Power Sources, 101, 238 (2001).
33. K. Matsumoto, R. Kuzuo, K. Takeya and A. Yamanaka, J. Power Sources, 81-82, 558
(1999).
34. D. Lin-Vien, N. B. Colthup, W.G. Fately, J.G. Graselli, The Handbook of Infrared and
Raman Characteristic Frequencies of Oragnic Molecules, Academic Press, San Diego,
1991.
35. N. B. Colthup, L.H. Daly and S.E. Wiberley, Introduction to Infrared and Raman
Spectroscopy, 3rd edition, Academic Press, San Diego, 1990.
36. Aldrich Handbook of Fine Chemicals and Laboratory Equipment, 2003, p.1494.
37. B. Fortunato, P. Mirone, G. Fini, Spectrochim. Acta, 27A, 1917 (1971).
38. J. Shim, R. Kostecki, T. Richardson, X. Song and K. A. Striebel, J. Power Sources, 112,
222 (2002).

18
39. K. K. Lee, W. S. Yoon, K. B. Kim, K. Y. Lee and S. T. Hong, J. Power Sources, 97-98,
308 (2001).
40. R.V. Chebiam, F. Prado, and A, Manthiram, J. Electrochem. Soc., 148, A49 (2001).
41. R.V. chebiam, A.M. Kannan, F. Prado and A. Manthiram, Electrochem. Commun., 3,
624 (2001).
42. S. Venkatraman, Y. Shin and A. Manthiram, Electrochem. Solid State Lett., 6, A9
(2003).
43. S. E. Sloop, J. K. Pugh, S. Wang, J. B. Kerr and K. Kinoshita, Electrochem. Solid State
Lett., 4, A42 (2001).
44. L. Vogdanis, B. Martens, H. Uchtmann, F. Hensel, and W. Heitz, Makromol. Chem.,
191, 465 (1990); L. Vogdanis and W. Heitz, Makromol. Chem. Rapid Commun., 7, 543
(1986).

19
Figure captions
Figure 1. IR spectra of the as-received Gen2 cathode LiNi0.8Co0.15Al0.05O2 and PVdF
used as a binder for the cathode laminate; spectrum of Li2CO3 also shown for reference.
Figure 2. (lower) Comparative IR spectra of as-received Gen2 cathode, an Al foil used
as a current collector for the cathode laminate and a reference spectrum of oleamide, a
common corrosion inhibitor. (upper) Comparison of C-H stretching region of the spectra
of the virgin cathode and the film on the Al foil current collector used in the cathode.
Figure 3. IR spectra of electrolyte residue on a Au foil soaked in electrolyte without
electrochemistry: (a) before washing with DMC (b) at a different spot and (c) after
washing with DMC and drying at room temperature.
Figure 4. IR spectra of: (a) as-received Gen2 cathode; (b) soaked in the electrolyte
without electrochemistry before washing and (c) after washing with DMC and drying in
glove box at room temperature; (d) the PVdF binder by itself.
Figure 5. (top) Voltage profile of a Gen2 cathode LiNi0.8Co0.15Al0.05O2
charged/discharged at about the C/25 rate and (bottom) the differential capacity curve.
Figure 6. Selected IR spectra of samples before DMC washing: (a) electrolyte residue
on Au foil; (b) electrolyte residue on as-received Gen2 cathode without
electrochemistry; (c) Gen2 cathode charged to 3.75 V; (d) Gen2 cathode charged to 4.20
V. New features appearing in the spectrum (d) are marked by arrows.
Figure 7. IR spectra of: (a) propionic acid methyl ester; (b) maleic anhydride; (c)
Gen2 cathode charged to 3.75 V not washed; (d) Gen2 cathode charged to 4.2 V not
washed.

20
Figure 8. IR spectra of GEN2 cathodes after rinsing with DMC compared with that for
just the PVdF binder.