a study of the fitness among indicators of quality management and
TRANSCRIPT
1
2010 7 1-26
135
9 17
____________________
[email protected], [email protected]
2010.05.27 2010.06.11 2010.06.30

2
Journal of Educational Administration and Evaluation
July, 2010, Vol. 9 pp. 1-26
A study of the fitness among indicators of
quality management and performance
management for quality school
Nien-Hsiang Yang Mu-Jin Chen
Abstract
This study examines the content of “indicators of quality management” and “indicators of
performance management” of the administration management dimension for quality
school. 135 administrators of elementary and middle schools in Taipei city (including
principals, directors, and section chiefs) were selected as subjects of the study. Data were
analyzed by structural equation modeling (SEM) and the main findings were as follows:
1.The fitness among indicators of quality management and indicators of performance
management are significant. 2.Indicators of quality management have remarkable
influences on indicators of performance management. Based on the results of the study,
conclusions and suggestions are offered to educational authorities, school administrative
personnels, and follow-up researchers.
Keyword: quality school, indicators of quality management, indicators of performance
management
____________________
Nien-Hsiang Yang: Doctoral student/Department of Education, National Chengchi University
Mu-Jin Chen: Director/Center for Teaching and Learning Development, National Chengchi
University
E-mail: [email protected], [email protected]
Manuscript received: 2010.05.27; Revised: 2010.06.11; Accepted: 2010.06.30
3
1994
2007
2006
2005 1982 Blue
Ribbon School Program
2003 1998
Beacon Schools
2003
2004
2004 2008
e
4
e
135
LISREL8.72
quality management, QM
Rusinko, 2005
2008
ISO 9000 ISO
P-D-C-A 1. Plan
2.
Do 3. Check /
4. Act
ISO, 2006
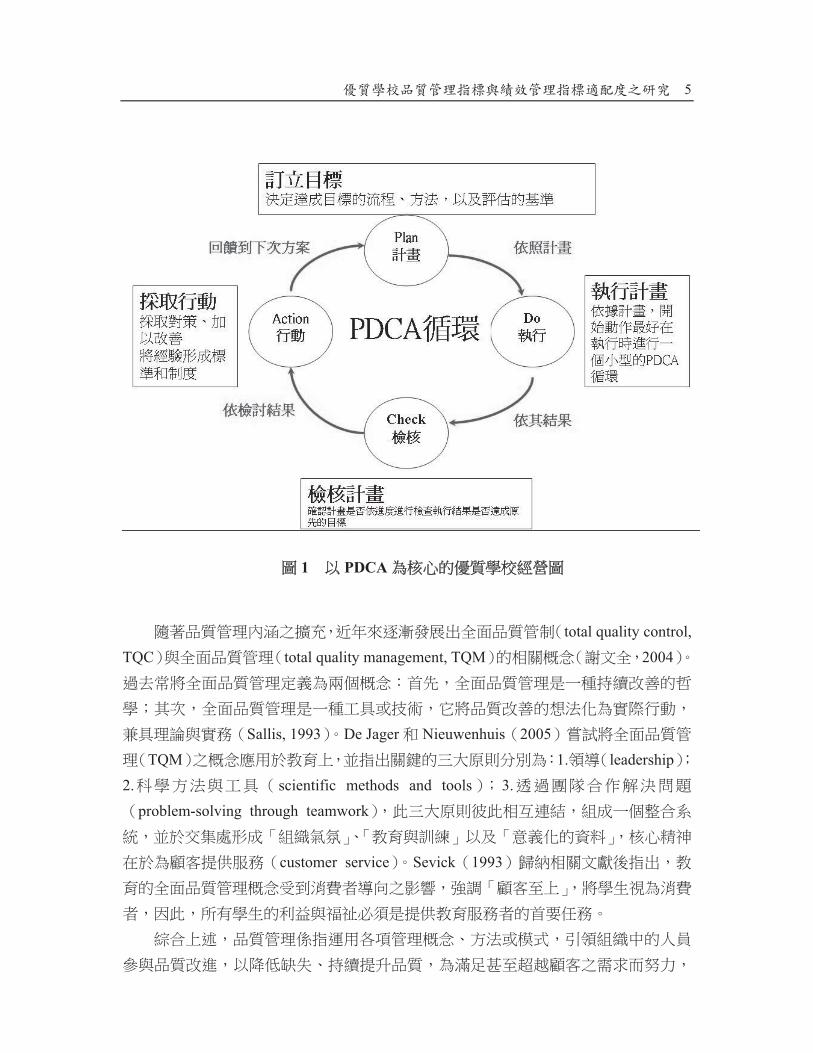
P-D-C-A 1
5
1 PDCA
total quality control,
TQC total quality management, TQM 2004
Sallis, 1993 De Jager Nieuwenhuis 2005
TQM 1. leadership
2. scientific methods and tools 3.
problem-solving through teamwork
customer service Sevick 1993

6
P-D-C-A
1.
2.
3.
4.
5. 6.
7.
2005
1.
2.
3.
4.
5.
6. PDCA
PDCA
2007
PDCA
7
e
performance management
2002 Bae 2006
2
2008
2004

8
2
Bae 2006: 1430-1437
1990 Kaplan Norton
2008
Poll,
2001
Karathanos & Karathanos, 2005 2005
1.
2.
3.
4.
1.

9
2.
3.
4.
5.
6.
2007
10
e
2007
e
2004
2009
e
2010 1

11
1 99
99
2010 6
2004 2009
135
LISREL8.72
LISREL8.72

12
1.
2.
LISREL 8.72
3
3
1. 1
2. !1
1. X1 X5
2. Y1 Y6
1. "1 "5
2. #1 #5
1. $11
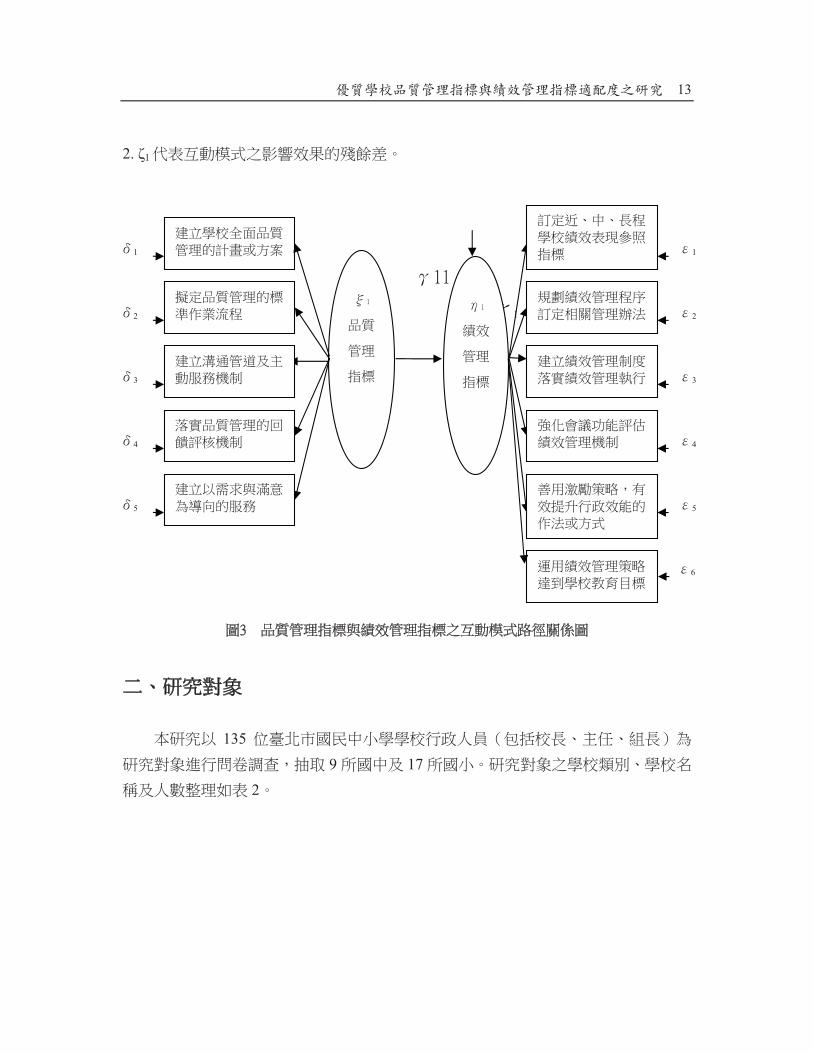
13
2. %1
135
9 17
2
1
2
3
4
5
1
3
2
4
5
6

14
2
1. 6
2. 5
3. 5
4. 5
5. 6
6. 5
7. 5
8. 4
9. 4
1. 6
2. 5
3. 5
4. 5
5. 5
6. 6
7. 5
8. 6
9. 6
10. 6
11. 5
12. 5
13. 5
14. 5
15. 5
16. 5
17. 5
135

15
&
2008 &
e
Likert-type
6 5 4 3 2 1
&
135
LISREL 8.72
2006
3
1.
RMR root mean square residual .028
.05
16
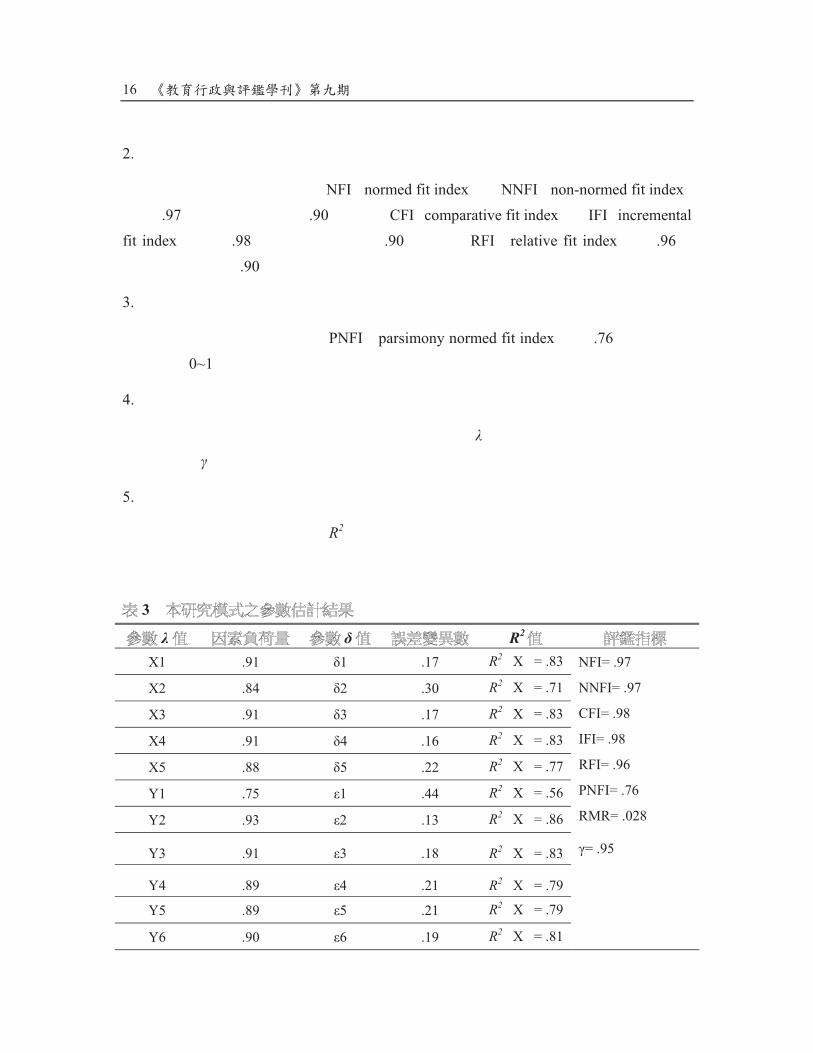
2.
NFI normed fit index NNFI non-normed fit index
.97 .90 CFI comparative fit index IFI incremental
fit index .98 .90 RFI relative fit index .96
.90
3.
PNFI parsimony normed fit index .76
0~1
4.
!
5.
R2
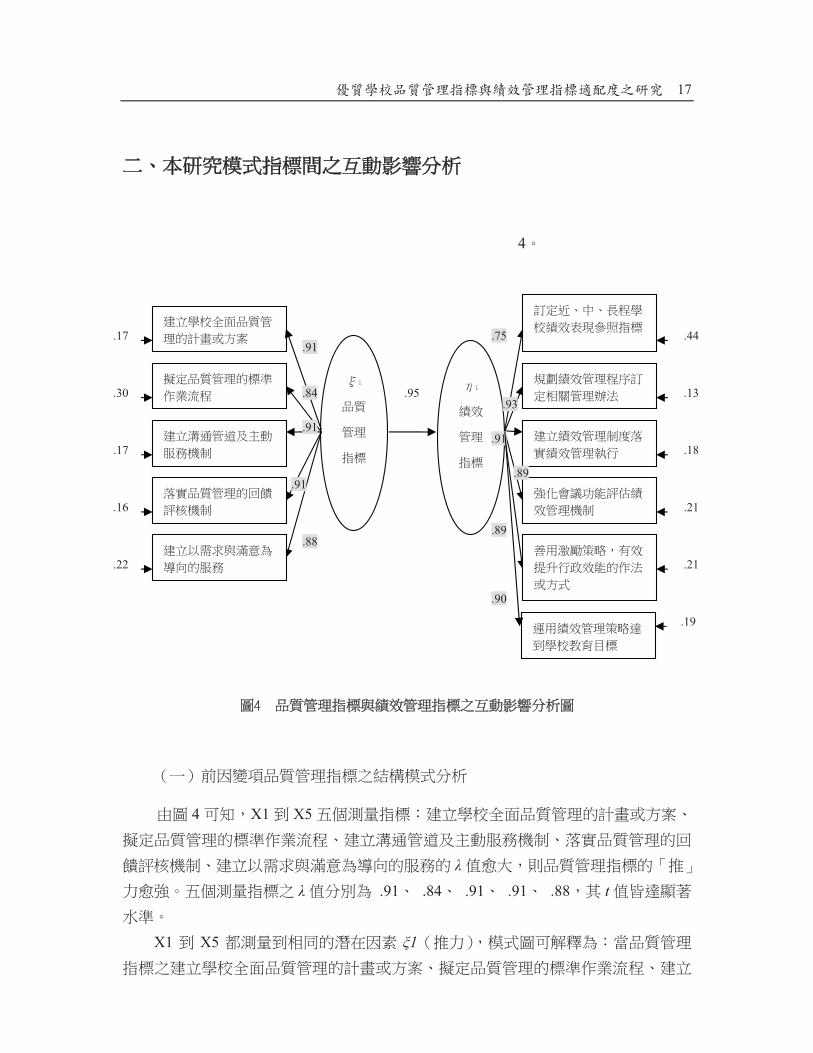
3
! R2
X1 .91 "1 .17 R2 X = .83 NFI= .97
NNFI= .97
CFI= .98
IFI= .98
RFI= .96
PNFI= .76
RMR= .028
$= .95
X2 .84 "2 .30 R2 X = .71
X3 .91 "3 .17 R2 X = .83
X4 .91 "4 .16 R2 X = .83
X5 .88 "5 .22 R2 X = .77
Y1 .75 #1 .44 R2 X = .56
Y2 .93 #2 .13 R2 X = .86
Y3 .91 #3 .18 R2 X = .83
Y4 .89 #4 .21 R2 X = .79
Y5 .89 #5 .21 R2 X = .79
Y6 .90 #6 .19 R2 X = .81
17
4
4 X1 X5
.91 .84 .91 .91 .88 t
X1 X5 "1
.95
.17
.30
.17
.16
.22
.44
.18
.19
.13
.21
.21
.91
.84
.91
.91
.88
.90
.75
.93
.91
.89
.89
18
4 Y1 Y6
.75 .93 .91 .89 .89 .90 t
Y1 Y6 #1
4
!11 .95 t 10.81 .001
2009

19
X1 X5
X1 X5
2005 ISO 9000
2007
2004
2005
Y1 Y6
Y1 Y6
2004
2004
2006
2006
2002

20
38.42%
61.92%
1. 2.
3. 4. 5.
1. 2.
3. 4.
5. 6.
135
21
1.
e
2.
1.

22
TQM
P-D-C-A
2.
e
1.
2.
23
2006 SIMPLIS
2002 P. Sydanmaanlakka
An intelligent organization : integrating
performance, competence and knowledge management
2003 50 117-118
2005
6-17
2006 2006 2006
6-13
2008 26 37-69
2005
2007
2003 25 16-18
2005
18-29
2006
2007
10-25
2007
50 87-102
2008 11
2005 ISO 9000
2006

24
2002
2008
2004
2004
99
2010 2010 6 14
http://tpqs.tp.edu.tw/comm/DocView.aspx?S=YER20091202142220ZSH&CDE=DO
C20091226115247LCD
2004
2004
2004
2009
Bae, Eul-Kyoo. (2006). Major elements and issues in performance management system: A
literature review. Columbus, OH: The Academy of Human Resource Development
international conference (AHRD). (ERIC Document Reproduction Service No. ED
492860)
De Jager, H. J., & Nieuwenhuis, F. J. (2005). Linkages between total quality management
and the outcomes-based approach in an education environment. Quality in Higher
Education, 11(3), 251-260.
ISO (2006). Understand the basics. Retrieved May 7, 2010, from
http://www.iso.org/iso/iso_catalogue/management_standards/understand_the_basics.
htm
Karathanos, D., & Karathanos, P. (2005). Applying the balanced scorecard to education.
Journal of Education for Business, 80(4), 222-230.
Poll, R. (2001). Performance, process, and costs: Managing service quality with the
balanced scorecard. Library Trends, 49(4), 709-717.
Rusinko, C. A. (2005). Using quality management as a bridge to environmental
25
sustainability in organizations. Advanced Management Journal 70(4), 54-60.
Sallis, E. (1993). Total quality management in education. London: Kogan Page.
Sevick, C. (1993, March). Can Deming’s concept of total quality management be applied
to education? Paper presented at the annual conference on Creating Quality Schools,
Oklahoma city, OK.

26