a study on consumer perception towards khadi textile ...icmrr.org/mar_2015/ijmrr/15302005.pdf · a...
TRANSCRIPT

A STUDY ON CONSUMER PERCEPTION TOWARDS KHADI
TEXTILE INDUSTRY IN THRISSUR DISTRICT
N.KATHIRVEL 1 SALINI B NAIR
2
1 Assistant Professor, Department of Commerce, Government Arts College, Udumaipet,Tiruppur
2 Research Scholar, Part-Time External Phd, Course- Bharathiyar University.
ABSTRACT
Khadi has its own unique features, which will influence their overall brand image. Historic
background, Gandhian concept, eco-friendliness etc creates great brand value for Khadi textile
industry. But above all salesmanship & hospitality has its own role in influencing the customer from
marketing point of view. Taking this aspect as base, a survey has conducted among Khadi textile
consumers to know about their perception towards Khadi textile industry in Thrissur district. This
study focus on various factors contributing to the creation of positive perception among Khadi textile
consumers such as level of Khadi textile consumer satisfaction and attitude , marketing attributes such
as price, quality, quality , availability, consumer services, and so on. This study has been conducted in
major Khadi bhavans in Thrissur district.
INTRODUCTION
The Micro, Small and Medium Enterprises (MSME) or Small and Medium enterprises (SMEs) or also
known as small scale industries (SSIs) are defined on the basis of their investment in plant and
machinery (for manufacturing enterprise) as well as in equipments for service enterprises.MSME-
Development Institute,Thrissur, Kerala (MSME-DI,Thrissur), is the state level of Development
Commissioner(MSME) under the Ministry of MSME, Government of India to take care of the needs
of MSME sector in the State of Kerala and the Union Territory of Lakshadweep in the area of
Techno-economic and managerial consultancy services. Khadi work began in the state early in
1920‘s. On 15th January 1955,Kerala Khadi and Village Industries Association was registered. The
Khadi and Village industries association are engaged in providing livelihood to millions of spinners,
weavers and artisans in the rural areas. To survive these institutions need active Government support,
by way of provision of credit, access to technology and market support. The major Khadi products are
Honey, Fiber Products, Processed Fruits and Vegetarian Product, Handmade Paper ,Leather Products
,Village Oil,Pottery,Agarbathi and Khadi textile products (Cotton Khadi,Silk Khadi,Woolen
Khadi,Muslin Khadi).
OBJECTIVES OF THE STUDY
Primary objective
To understand the consumer perception towards Khadi textile industry in Thrissur
district
Secondary objectives
To know about the various existing marketing strategies adopted by Khadi and
Village Industries Association, in Thrissur.
To identify customer satisfaction level of Khadi textile customers
in Thrissur.
INTERCONTINENTAL JOURNAL OF MARKETING RESEARCH REVIEWISSN:2321-0346 - ONLINE ISSN:2347-1670 - PRINT -IMPACT FACTOR :0.882VOLUME 3, ISSUE 3, MARCH 2015
www.icmrr.org 47 [email protected]
WW
W.IC
MRR.ORG

To know about the factors contributing to the satisfaction level of Khadi textile
customers.
To identify the customer attitude & awareness towards Khadi textile industry.
To give suggestions and recommendations to Khadi and Village Industries for
improving their Khadi textile industries.
REVIEW OF LITERATURE
Hye Jeong Kim and Elena Karpova 2009 has conducted a study which examines consumer
motivations that can explain attitudes towards purchasing fashion counter feit goods and tests the
underlying mechanism of intent to purchase fashion counterfeits based on the theory of planned
behaviour. A random sample of female college students( N=336) participate in this study. Product
apperarance, past purchase behaviour, value consciousness, and normative susceptibility are
significant predictors of attitude towards buying fashion counterfeit goods. Attitude, subjective norm
and perceived behavioural control are significantly related to intent to purchase fashion counterfeit
goods. This research extends the theory of planned behaviour and tests two additional paths that
significantly improve explanatory power of the theory and prediction of consumer intent to buy
fashion counterfeit goods.
Devaraja T S 2011 wrote an article titled ― Indian textiel and garment industry- An overview‖. In this
article he mentioned that India is having the third possition after China and USA in the global textile
and garment industry and the second largest cotton consumer after China. The fundamental strength
of this industry flows from its strong productionbase of wide range of fibers/yarns from national fibers
like cotton, jute, silk and wool to synthetic/ man – made fibers like polyster, viscose, nylon and
acrylic. The growth pattern of the Indian textile industry in the last decade has been considerably
more than the previous decades, primarily on account of liberalization of trade and economic policies
intiated by the government in 1990. The growth in the production of textile fibers has facilitated the
growth of the spinning sector which results in the improvement in the production of siver in Khadi
industry. The total production of cloth by knitting and Khadi sector is 19%. In this article it is
mentioned that Tirupur is one of the important garment clusters in India providing employment to
more than 3,00,000 people directly and indirectly and is earning a considerable amount of feoreign
exchange by contributing more than 50% cotton knitwear exports from India.
RESEARCH METHODOLOGY
Field of study: Marketing
Population : Infinite
Sample size : 420
Variables under study:
Dependent variable
Consumer perception towards Khadi Textile Industry in Thrissur
Independent variable
Consumer buying behavior
Awareness about product
INTERCONTINENTAL JOURNAL OF MARKETING RESEARCH REVIEWISSN:2321-0346 - ONLINE ISSN:2347-1670 - PRINT -IMPACT FACTOR :0.882VOLUME 3, ISSUE 3, MARCH 2015
www.icmrr.org 48 [email protected]
WW
W.IC
MRR.ORG

Price
Reputation of the organization
Competitors
Political and legal
Consumer satisfaction
Consumer attitude & awareness
Research design
Descriptive research design is used for the study
Data needed for study
Primary data & Secondary data
Data collection tool
Primary data tools
Questionnaire
Secondary data tools
Company prospectus, Company websites, Reports, Magazines, Books
Analytical tool : Frequency analysis, chi-square test, Friedman test, Mann-whitney test,
Kruskalwallis test
Data Analysis
DEMOGRAPHIC PROFILE
Table 1. Area wise Classification Of Khadi Textile Consumers Based On Occupation
Occupation
Total
place of
residen
ce
priva
te
Govern
ment
self
emplo
yed
Retire
d
Homema
ker others
55
Urban
Count 16 26 16 10 58 64 2 192
% within
place of
residence
8.30
% 13.50% 8.30% 5.20% 30.20%
33.30
% 1.00%
100.00
%
semi-
urban
Count 42 36 14 6 14 26 0 138
% within
place of
residence
30.4
0% 26.10%
10.10
% 4.30% 10.10%
18.80
% 0.00%
100.00
%
Rural
Count 34 30 6 4 6 10 0 90
% within
place of
residence
37.8
0% 33.30% 6.70% 4.40% 6.70%
11.10
% 0.00%
100.00
%
Total
Count 92 92 36 20 78 100 2 420
% within
place of
residence
21.9
0% 21.90% 8.60% 4.80% 18.60%
23.80
% 0.50%
100.00
%
INTERCONTINENTAL JOURNAL OF MARKETING RESEARCH REVIEWISSN:2321-0346 - ONLINE ISSN:2347-1670 - PRINT -IMPACT FACTOR :0.882VOLUME 3, ISSUE 3, MARCH 2015
www.icmrr.org 49 [email protected]
WW
W.IC
MRR.ORG

As per table 1 it is clear that 23.8%of the selected customers have no fixed job, 21.9 per cent each of the
customers are private and government employees. Therefore it is concluded that majority of the
consumers are employees.
Table 2. Area wise Classification Of Khadi Textile Consumers Based On Gender
Gender
Total Male female 3
place of
residence
Urban
Count 74 118 0 192
% within place of
residence 38.50% 61.50% 0.00% 100.00%
semi-
urban
Count 84 53 1 138
% within place of
residence 60.90% 38.40% 0.70% 100.00%
Rural
Count 40 50 0 90
% within place of
residence 44.40% 55.60% 0.00% 100.00%
Total
Count 198 221 1 420
% within place of
residence 47.10% 52.60% 0.20% 100.00%
From the above table it is clear that majority of the Khadi textile consumers are females. They form
52.6 per cent of the total respondents. This shows the dominance of women over men in the
purchasing of Khadi textile products. Majority of the women consumers are from the urban side. The
above table also shows that the women consumers from rural areas are more interested in the Khadi
textile products compared to the semi-urban respondents.
Table 3. Area wise Classification Of Khadi Textile Consumers Based On Monthly Average
Income ( In Thousands)
monthly average income of consumer (in thousands)
Total below 10
10-
below20
20-
below30
30-
below40
40 and
above
Place of
residence
urban
Count 42 56 28 10 0 136
% within
place of
residence
30.90% 41.20% 20.60% 7.40% 0.00% 100.00%
semi-
urban
Count 38 65 20 8 0 131
% within
place of
residence
29.00% 49.60% 15.30% 6.10% 0.00% 100.00%
rural
Count 12 12 24 20 16 84
% within
place of
residence
14.30% 14.30% 26.70% 23.80% 19.00% 100.00%
Total
Count 92 133 72 38 16 351
% within
place of
residence
26.20% 37.90% 20.50% 10.80% 4.60% 100.00%
INTERCONTINENTAL JOURNAL OF MARKETING RESEARCH REVIEWISSN:2321-0346 - ONLINE ISSN:2347-1670 - PRINT -IMPACT FACTOR :0.882VOLUME 3, ISSUE 3, MARCH 2015
www.icmrr.org 50 [email protected]
WW
W.IC
MRR.ORG

The above table 3 indicates that 26.2 per cent of Khadi consumers are having the monthly income of
below 10,000, 37.9 per cent are having between 10,000 and 20,000 monthly earnings, 20.5 between
20,000 and 30,000 monthly earnings on an average basis. This clearly indicates that majority of Khadi
consumers are from low- medium income group and they represent urban-semi urban areas.
Table 4. Area wise Estimation Of Awareness About Khadi Textile Industry
are you aware of Khadi textile
industry Total
Yes no
place of
residence
Urban
Count 192 0 192
% within place
of residence 100.00% 0.00% 100.00%
semi-urban
Count 134 4 138
% within place
of residence 97.10% 2.90% 100.00%
Rural
Count 90 0 90
% within place
of residence 100.00% 0.00% 100.00%
Total
Count 416 4 420
% within place
of residence 99.00% 1.00% 100.00%
From the above table 4 it is clear that 99 per cent of samples selected for the study are aware about
Khadi textile industry. Therefore it is interpreted that Khadi industry is having good popularity and
social influence in the society, ie in urban, semi-urban and in rural areas.
Table 5. Area wise Classification Of Khadi Textile Consumers Based On The Sources Of
Information
how did you come to know of Khadi textile industry
Total radio
news
paper TV magazines friends/relatives
place of
residence
urban
Count 59 28 46 15 44 192
% within
place of
residence
30.70% 14.60% 24.00% 7.80% 22.90% 100.00%
semi-
urban
Count 31 27 22 11 47 138
% within
place of
residence
22.50% 19.60% 15.90% 8.00% 34.10% 100.00%
rural
Count 30 6 10 4 40 90
% within
place of
residence
33.30% 6.70% 11.10% 4.40% 44.40% 100.00%
Total
Count 120 61 78 30 131 420
% within
place of
residence
28.60% 14.50% 18.60% 7.10% 31.20% 100.00%
The table 5 shows that 31.2 per cent of respondents come to know about Khadi textile industry
through friends/relatives. From this it can be interpreted that Khadi consumers are more influenced by
INTERCONTINENTAL JOURNAL OF MARKETING RESEARCH REVIEWISSN:2321-0346 - ONLINE ISSN:2347-1670 - PRINT -IMPACT FACTOR :0.882VOLUME 3, ISSUE 3, MARCH 2015
www.icmrr.org 51 [email protected]
WW
W.IC
MRR.ORG

word of mouth, ie the opinions and comments of their friends/relatives compared to other sources of
information.
Table 5.1 Chi-Square Test
Ho- There is close relationship between the source of information about Khadi products and area of
residence.
Futher the Chi-square test shows that there is close association between the source of information
about Khadi products and the area of residence of the customers as the value of Chi-square is
satistically significnat at 5 per cent level of siginificance( Value of Chi-square=35.860 with P=.000)
Table 6. Area wise Estimation Of The Most Influential Khadi Textile Advertisement Media
Among Khadi Textile Consumers
if yes in which media
Total
Radio TV news
paper Magazines Others
place of
residence
urban
Count 95 50 18 12 17 192
% within
place of
residence 49.50% 26.00% 9.40% 6.30% 8.90% 100.00%
semi-
urban
Count 45 36 28 9 20 138
% within
place of
residence 32.60% 26.10% 20.30% 6.50% 14.50% 100.00%
rural
Count 31 36 11 6 6 90
% within
place of
residence 34.40% 40.00% 12.20% 6.70% 6.70% 100.00%
Total
Count 171 122 57 27 43 420
% within
place of
residence 40.70% 29.00% 13.60% 6.40% 10.20% 100.00%
The table 6 represents that 40.7 per cent of Khadi textile consumers agree that they have heard Khadi
textile products‘ advertisements in radio. This highlights that Khadi textile industry is having more
audience , especially from urban areas for radio advertising compared to other medias of advertising.
This is one of the special features of Khadi industry.
Value df Asymp. Sig. (2-
sided)
Pearson Chi-Square 35.860a 12 .000
N of Valid Cases 420
INTERCONTINENTAL JOURNAL OF MARKETING RESEARCH REVIEWISSN:2321-0346 - ONLINE ISSN:2347-1670 - PRINT -IMPACT FACTOR :0.882VOLUME 3, ISSUE 3, MARCH 2015
www.icmrr.org 52 [email protected]
WW
W.IC
MRR.ORG

Table 7. Area wise Estimation Of Attractive Feature Of Khadi Textile Industry
what attracted you to khadi textile industry
Total Dignit
y
Ideolo
gy
Simpli
city purity
eco-
friendl
iness
rural
empl
oyme
nt
plac
e of
resid
ence
urban
Count 3 90 69 21 7 2 192
% within
place of
residenc
e
1.60% 46.90
%
35.90
%
10.90
% 3.60%
1.00
% 100.00%
semi-
urban
Count 12 18 68 35 5 0 138
% within
place of
residenc
e
8.70% 13.00
%
49.30
%
25.40
% 3.60%
0.00
% 100.00%
rural
Count 10 26 22 17 9 6 90
% within
place of
residenc
e
11.40
%
28.90
%
24.40
%
18.90
%
10.00
%
6.70
% 100.00%
Total
Count 25 134 159 73 21 8 420
% within
place of
residenc
e
6.00% 31.90
%
37.90
%
17.40
% 5.00%
1.90
% 100.00%
The above table 7 shows that 37.9 per cent Khadi consumers were attracted by the simplicity of Khadi
cloths and 31.9 per cent commented that they were attracted by the ideology of Khadi industry. From
this it is clear that majority were attracted by the simple design and look of Khadi cloths and also by
the ideological strength of Khadi industry
Table 7.1 Chi-Square Test
For Testing Area wise Influential Level Of Variables Under Study On Khadi Textile
Consumers
Value Df Asymp. Sig. (2-
sided)
Pearson Chi-Square 82.284a 15 .000
N of Valid Cases 420
Ho: There is close relationship between features of Khadi textile products and their area of residence
INTERCONTINENTAL JOURNAL OF MARKETING RESEARCH REVIEWISSN:2321-0346 - ONLINE ISSN:2347-1670 - PRINT -IMPACT FACTOR :0.882VOLUME 3, ISSUE 3, MARCH 2015
www.icmrr.org 53 [email protected]
WW
W.IC
MRR.ORG

Further the Chi-square test shows that there is close association between the Khadi textile products‘
features and the area of residence of the Khadi textile consumers as the value of Chi-square is
statistically significant at 5 per cent level of significance.( Value of Chi-square 82.284 with P=.000)
Marketing Attributes
Table 8 Tests of Between-Subjects Effects Based On Marketing Attributes
Source Type I Sum
of Squares
df Mean Square F Sig.
Place 1160.977 3 386.992 1.631 0.181
Timing 3292.067 2 1646.034 6.939 0.001
Centre of purchase 6450.429 3 2150.143 9.064 .000
Error 97499.089 411 237.224
Corrected Total 108402.562 419
Table 8.1 Area wise Estimated Marginal Means Based On Marketing Attributes
place of residence Mean Std.
Error
95% Confidence Interval
Lower Bound Upper Bound
Urban 137.522 2.922 131.778 143.266
semi-urban 137.88 3.153 131.683 144.077
Rural 139.998 3.285 133.541 146.456
Table 8.2 Estimated Marginal Means of Marketing Attributes Based On The Occasion Of
Purchase
when do you purchase khadi
products Mean
Std.
Error
95% Confidence Interval
Lower Bound Upper Bound
festival seasons 142.101 4.086 134.068 150.134
rebate periods 142.05 4.153 133.886 150.214
on regular basis 135.41 4.129 127.293 143.527
Tabl e 8.3. Estimated Marginal Means Of Marketing Attributes Based On The Point Of
Purchase
from where do you buy khadi
cloths Mean Std. Error
95% Confidence Interval
Lower Bound Upper Bound
khadi emporium 152.326 3.686 145.08 159.573
khadi gramodyog 153.284 2.819 147.742 158.825
Exhibitions 144.719 3.549 137.742 151.697
other sources 109.084 11.338 86.798 131.371
Ho: Khadi textile consumers were influenced by various marketing attributes of Khadi textile industy
INTERCONTINENTAL JOURNAL OF MARKETING RESEARCH REVIEWISSN:2321-0346 - ONLINE ISSN:2347-1670 - PRINT -IMPACT FACTOR :0.882VOLUME 3, ISSUE 3, MARCH 2015
www.icmrr.org 54 [email protected]
WW
W.IC
MRR.ORG
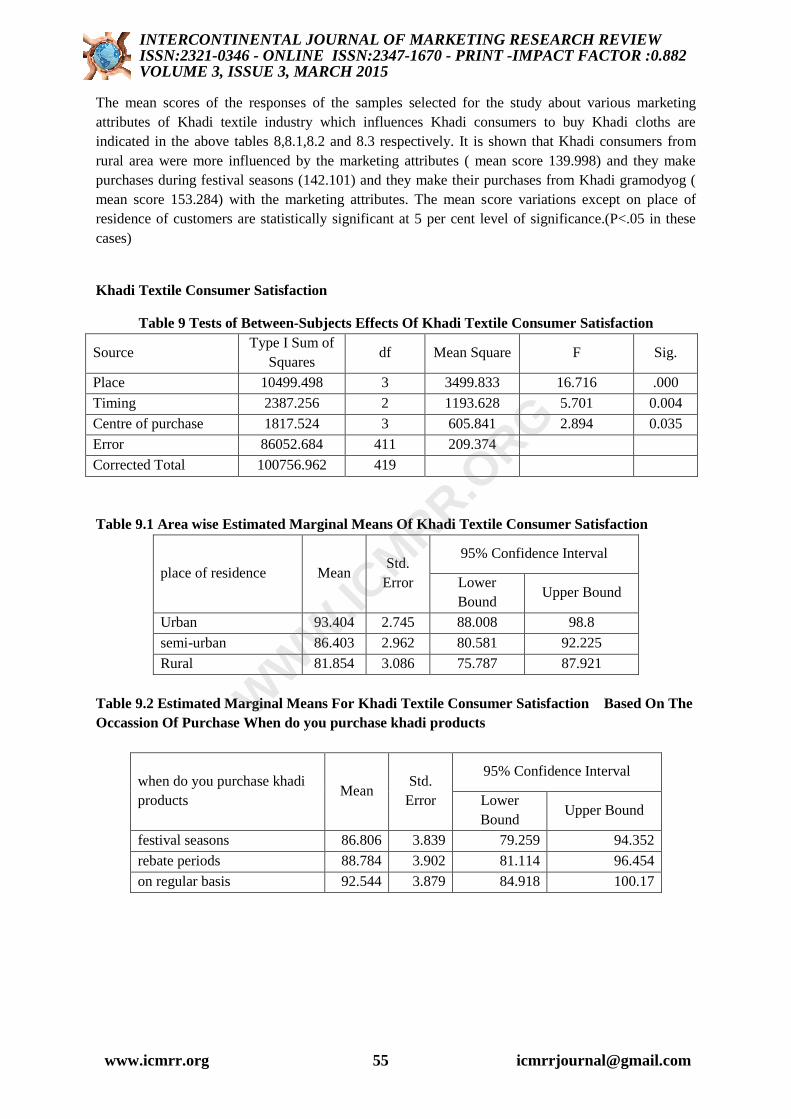
The mean scores of the responses of the samples selected for the study about various marketing
attributes of Khadi textile industry which influences Khadi consumers to buy Khadi cloths are
indicated in the above tables 8,8.1,8.2 and 8.3 respectively. It is shown that Khadi consumers from
rural area were more influenced by the marketing attributes ( mean score 139.998) and they make
purchases during festival seasons (142.101) and they make their purchases from Khadi gramodyog (
mean score 153.284) with the marketing attributes. The mean score variations except on place of
residence of customers are statistically significant at 5 per cent level of significance.(P<.05 in these
cases)
Khadi Textile Consumer Satisfaction
Table 9 Tests of Between-Subjects Effects Of Khadi Textile Consumer Satisfaction
Source Type I Sum of
Squares df Mean Square F Sig.
Place 10499.498 3 3499.833 16.716 .000
Timing 2387.256 2 1193.628 5.701 0.004
Centre of purchase 1817.524 3 605.841 2.894 0.035
Error 86052.684 411 209.374
Corrected Total 100756.962 419
Table 9.1 Area wise Estimated Marginal Means Of Khadi Textile Consumer Satisfaction
place of residence Mean Std.
Error
95% Confidence Interval
Lower
Bound Upper Bound
Urban 93.404 2.745 88.008 98.8
semi-urban 86.403 2.962 80.581 92.225
Rural 81.854 3.086 75.787 87.921
Table 9.2 Estimated Marginal Means For Khadi Textile Consumer Satisfaction Based On The
Occassion Of Purchase When do you purchase khadi products
when do you purchase khadi
products Mean
Std.
Error
95% Confidence Interval
Lower
Bound Upper Bound
festival seasons 86.806 3.839 79.259 94.352
rebate periods 88.784 3.902 81.114 96.454
on regular basis 92.544 3.879 84.918 100.17
INTERCONTINENTAL JOURNAL OF MARKETING RESEARCH REVIEWISSN:2321-0346 - ONLINE ISSN:2347-1670 - PRINT -IMPACT FACTOR :0.882VOLUME 3, ISSUE 3, MARCH 2015
www.icmrr.org 55 [email protected]
WW
W.IC
MRR.ORG
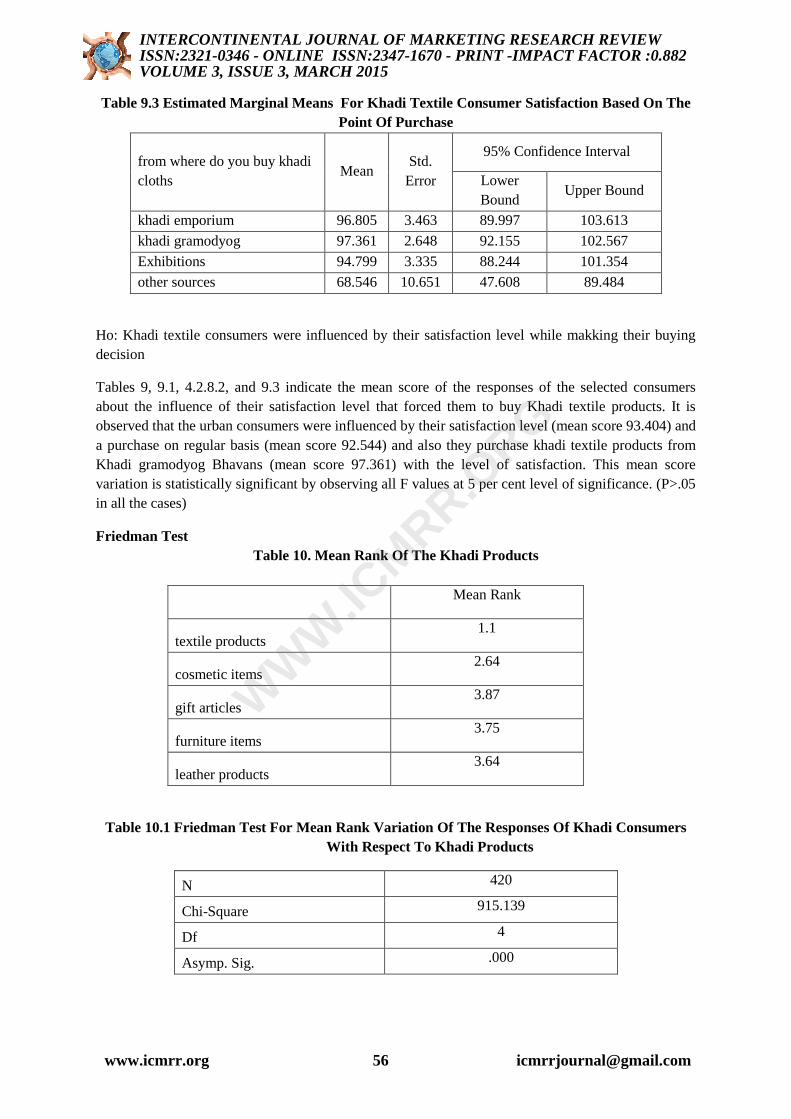
Table 9.3 Estimated Marginal Means For Khadi Textile Consumer Satisfaction Based On The
Point Of Purchase
from where do you buy khadi
cloths Mean
Std.
Error
95% Confidence Interval
Lower
Bound Upper Bound
khadi emporium 96.805 3.463 89.997 103.613
khadi gramodyog 97.361 2.648 92.155 102.567
Exhibitions 94.799 3.335 88.244 101.354
other sources 68.546 10.651 47.608 89.484
Ho: Khadi textile consumers were influenced by their satisfaction level while makking their buying
decision
Tables 9, 9.1, 4.2.8.2, and 9.3 indicate the mean score of the responses of the selected consumers
about the influence of their satisfaction level that forced them to buy Khadi textile products. It is
observed that the urban consumers were influenced by their satisfaction level (mean score 93.404) and
a purchase on regular basis (mean score 92.544) and also they purchase khadi textile products from
Khadi gramodyog Bhavans (mean score 97.361) with the level of satisfaction. This mean score
variation is statistically significant by observing all F values at 5 per cent level of significance. (P>.05
in all the cases)
Friedman Test
Table 10. Mean Rank Of The Khadi Products
Mean Rank
textile products 1.1
cosmetic items 2.64
gift articles 3.87
furniture items 3.75
leather products 3.64
Table 10.1 Friedman Test For Mean Rank Variation Of The Responses Of Khadi Consumers
With Respect To Khadi Products
N 420
Chi-Square 915.139
Df 4
Asymp. Sig. .000
INTERCONTINENTAL JOURNAL OF MARKETING RESEARCH REVIEWISSN:2321-0346 - ONLINE ISSN:2347-1670 - PRINT -IMPACT FACTOR :0.882VOLUME 3, ISSUE 3, MARCH 2015
www.icmrr.org 56 [email protected]
WW
W.IC
MRR.ORG
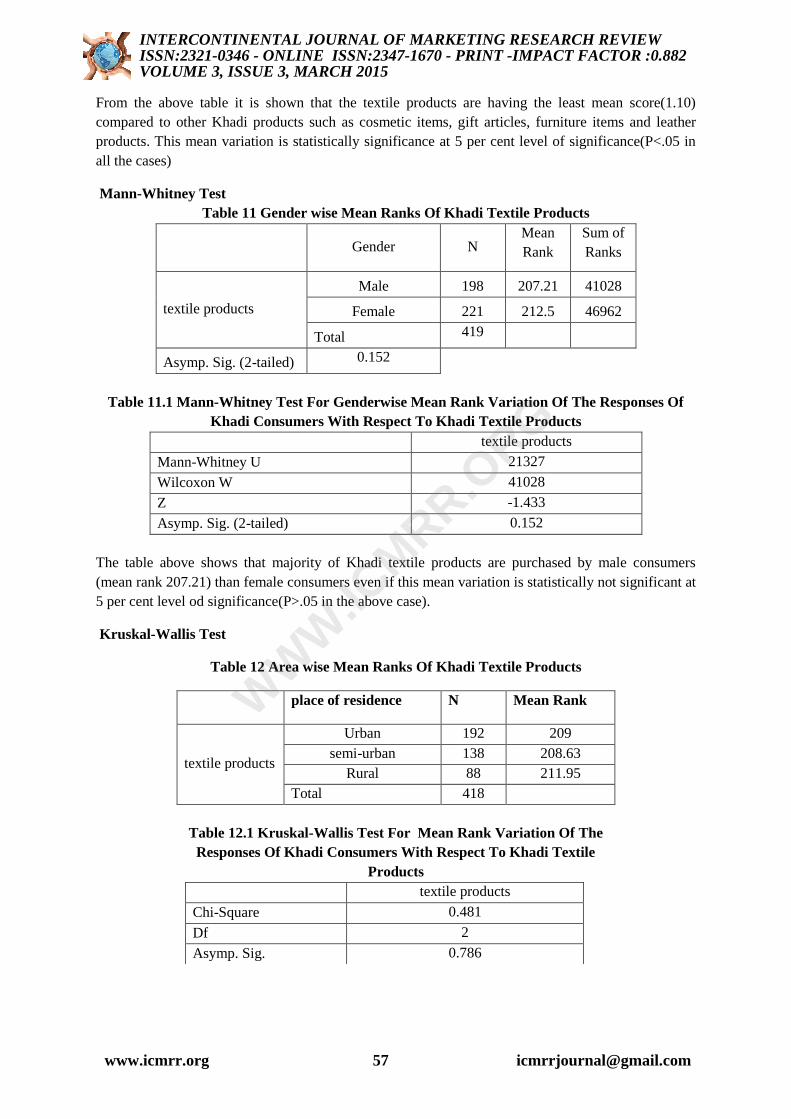
From the above table it is shown that the textile products are having the least mean score(1.10)
compared to other Khadi products such as cosmetic items, gift articles, furniture items and leather
products. This mean variation is statistically significance at 5 per cent level of significance(P<.05 in
all the cases)
Mann-Whitney Test
Table 11 Gender wise Mean Ranks Of Khadi Textile Products
Gender N
Mean
Rank
Sum of
Ranks
textile products
Male 198 207.21 41028
Female 221 212.5 46962
Total 419
Asymp. Sig. (2-tailed) 0.152
Table 11.1 Mann-Whitney Test For Genderwise Mean Rank Variation Of The Responses Of
Khadi Consumers With Respect To Khadi Textile Products
textile products
Mann-Whitney U 21327
Wilcoxon W 41028
Z -1.433
Asymp. Sig. (2-tailed) 0.152
The table above shows that majority of Khadi textile products are purchased by male consumers
(mean rank 207.21) than female consumers even if this mean variation is statistically not significant at
5 per cent level od significance(P>.05 in the above case).
Kruskal-Wallis Test
Table 12 Area wise Mean Ranks Of Khadi Textile Products
place of residence N Mean Rank
textile products
Urban 192 209
semi-urban 138 208.63
Rural 88 211.95
Total 418
Table 12.1 Kruskal-Wallis Test For Mean Rank Variation Of The
Responses Of Khadi Consumers With Respect To Khadi Textile
Products
textile products
Chi-Square 0.481
Df 2
Asymp. Sig. 0.786
INTERCONTINENTAL JOURNAL OF MARKETING RESEARCH REVIEWISSN:2321-0346 - ONLINE ISSN:2347-1670 - PRINT -IMPACT FACTOR :0.882VOLUME 3, ISSUE 3, MARCH 2015
www.icmrr.org 57 [email protected]
WW
W.IC
MRR.ORG
The above table indicates that the Khadi textile products are frequently purchased by the consumers
from rural area (mean rank 211.95) compared to consumers from urban (mean rank 209) and semi-
urban areas(mean rank 208.63). This mean variation is statistically insignificant at 5 per cent level of
significance (P>.05 in above cases)
FINDINGS
1.Majority of theKhadi textile consumers are employees.
2. Majority of the Khadi textile consumers are females. Majority of the women consumers are from
the urban side.
3. Majority of Khadi textile consumers are from low- medium income group and they represent urban
&semi urban areas.
4. Khadi industry is having good popularity and social influence in the society, ie in urban, semi-
urban and in rural areas
5 Khadi industry is having good popularity and social influence in the society, ie in urban, semi-urban
and in rural areas.
6. Majority of the Khadi textile consumers are mostly influenced by word of mouth, ie the opinions
and comments of their friends/relatives compared to other sources of information.
7. Khadi textile industry is having more audience , especially from urban areas for radio advertising
compared to other medias of advertising.
8. Majority of the Khadi textile consumers were attracted by the simple design and look of Khadi
cloths and also by the ideological strength of Khadi industry
9. Majority of the Khadi textile consumers(urban) prefer to buy Khadi textile products from Khadi
bhavans,
10. Most of the khadi textile consumers are regular users of Khadi textile products
Recommendations & conclusion
As a part of conclusion it is recommended that it will be always beneficial to Khadi textile industry to
adopt both traditional and modern marketing techniques like e-marketing, CRM etc to attract & create
possitive perception about the industry
References
1. Hyejeong Kim and Elena Karpova, ― Consumer attitudes towards fashion counterfeits:
Application of the theory of planned behaviour‖, Clothing and Textiles Research Journal, April
2010, pp 79-94
2. Dr Devaraja T S, ― Indian textile and garment industry- An overview‖, ICSSR journal , May
2011 , pp 1-27
3. www.kvic.com
4. www.kvic.co.in
INTERCONTINENTAL JOURNAL OF MARKETING RESEARCH REVIEWISSN:2321-0346 - ONLINE ISSN:2347-1670 - PRINT -IMPACT FACTOR :0.882VOLUME 3, ISSUE 3, MARCH 2015
www.icmrr.org 58 [email protected]
WW
W.IC
MRR.ORG