a study on market penetration of naga …ijirms.com/downloads/211120162016010317.pdf · ·...
TRANSCRIPT

International Journal of Innovative Research in Management Studies (IJIRMS) ISSN (Online): 2455-7188 Volume 1 | Issue 3 | April 2016
www.ijirms.com Page | 190
A STUDY ON MARKET PENETRATION OF NAGA PRODUCTS IN
DINDIGUL AND TRICHY DISTRICTS
S.Susindharan*
*II Year MBA student, School of Management, SASTRA University, Thanjavur
ABSTRACT
Market Penetration is the measure of the amount of sales or adoption of a product or service
compared to the total theoretical market for that product or service. The amount of sales or
adoption can be an individual company's sale or industry while the theoretical market can be the
total population or an estimate of total potential consumers for the product. The objective of the
study is to find out the market penetration and brand value of NAGA products across different
retail industry and identify the position of market share and holdings of flour segment in the retail
market. Were the data will be collected through quality questionnaire (primary data) from Dindigul
and Trichy districts. The company is going to introduce instant parotta and chappathi according to
the opinion of the customers. The study covered the area of Trichy and Dindigul districts.
Customers’ opinions are collected through random sampling. 54% of the respondents told parotta
and chappathi are considered as family food and they want to eat at home even though they are
cornered to buy from stall, with homemade kuruma.40% of the respondents told that they don’t
know to do veechu. 96% of people are aware of the Naga products .80% of people are satisfied
with naga products. Suggestions are provided to the company regarding the reach of Naga products
and introduction of instant parotta and chappathi.
Key words: market penetration, brand value, Customers’ opinions, introduction of products.
1. INTRODUCTION
Marketing is the management process through which goods and services move from concept to
the customer. It includes the coordination of four elements called the 4 P's of marketing:
Identification, selection and development of a product,
Determination of its price,
Selection of a distribution channel to reach the customer's place, and
Development and implementation of a promotional strategy.

International Journal of Innovative Research in Management Studies (IJIRMS) ISSN (Online): 2455-7188 Volume 1 | Issue 3 | April 2016
www.ijirms.com Page | 191
Market Penetration measure of the amount of sales or adoption of a product or service compared
to the total theoretical market for that product or service. The amount of sales or adoption can be
an individual company's sale or industry while the theoretical market can be the total population
or an estimate of total potential consumers for the product.
FMCG goods are popularly known as consumer packaged goods. Items in this category include
all consumables (other than groceries/pulses) people buy at regular intervals. The most common
in the list are toilet soaps, detergents, shampoos, toothpaste, shaving products, shoe polish,
packaged foodstuff, and household accessories and extends to certain electronic goods. These
items are meant for daily of frequent consumption and have a high return.
2. REVIEW OF LITERATURE
William Applebaum(1966)This study tells an existing store trade is always determined by
technique known as customer spotting this involves interviewing the representative sample of the
customer.
SungkyuLee,Rachel A. Grana, Stanton A. Glantz,( 2014) This study deals with South Korea
electronic cigarettes (e-cigarettes) are marketed, in part, as a smoking cessation aid.
Costas Arkolakis, 2010, This study tells marketing costs and introduce it into a model of trade
with product differentiation and firm productivity heterogeneity the market penetration cost
introduces an extensive margin of new consumers in firms' sales.
JHadley, J M Mitchell (1997) This study examine investigate whether geographic variations in
health maintenance organization market penetration are associated with practices number of hours
worked per year, number of patients seen per week, and satisfaction with the current practice.
H McGavock,C H Webb, G D Johnston, E Milligan(1993) The purpose of the study is to
determine the use of new drugs in the United Kingdom region Examination of data on prescribing
of angiotensin converting enzyme inhibitors, new broad spectrum antibiotics, and H2 receptor
antagonists.
3. OBJECTIVES OF THE STUDY
To study the advertising strategy and reach of the Naga products.
To study the availability of the Naga products.

International Journal of Innovative Research in Management Studies (IJIRMS) ISSN (Online): 2455-7188 Volume 1 | Issue 3 | April 2016
www.ijirms.com Page | 192
To analyze the Market penetration of products and position of products in the retail market.
To examine the brand value of the NAGA Product in the retail Industry.
The market analysis for instant chappathi and parotta done through survey method
4. SCOPE OF THE STUDY
The study is carried out in NAGA LIMITED, Dindigul, to understand the marketing penetration
and management practices of Naga Ltd and to analyze their efficiency.
5. ANALYSIS AND DISCUSSION
5.1 Analysis and Interpretation of Data Collected in Dindigul District
Table 5.1.1
Gender
Gender Frequency Percent
Male 36 72.0
Female 14 28.0
Total 50 100.0
From the above table it is inferred that 72% of the respondents are male and 28% of the respondents
are female.
Table 5.1.2
Age
From the above table it is inferred that 4% of respondents are below 20 of age, 26% of respondents
are 20-30 of age, 24% of respondents are 30-40 of age, 30% of respondents are 40-50 of age, and
16% of respondents are above 50.
Table 5.1.3
Age Frequency Percent
Below 20 2 4.0
20-30 13 26.0
30-40 12 24.0
40-50 15 30.0
50 above 8 16.0
Total 50 100.0
International Journal of Innovative Research in Management Studies (IJIRMS) ISSN (Online): 2455-7188 Volume 1 | Issue 3 | April 2016
www.ijirms.com Page | 193
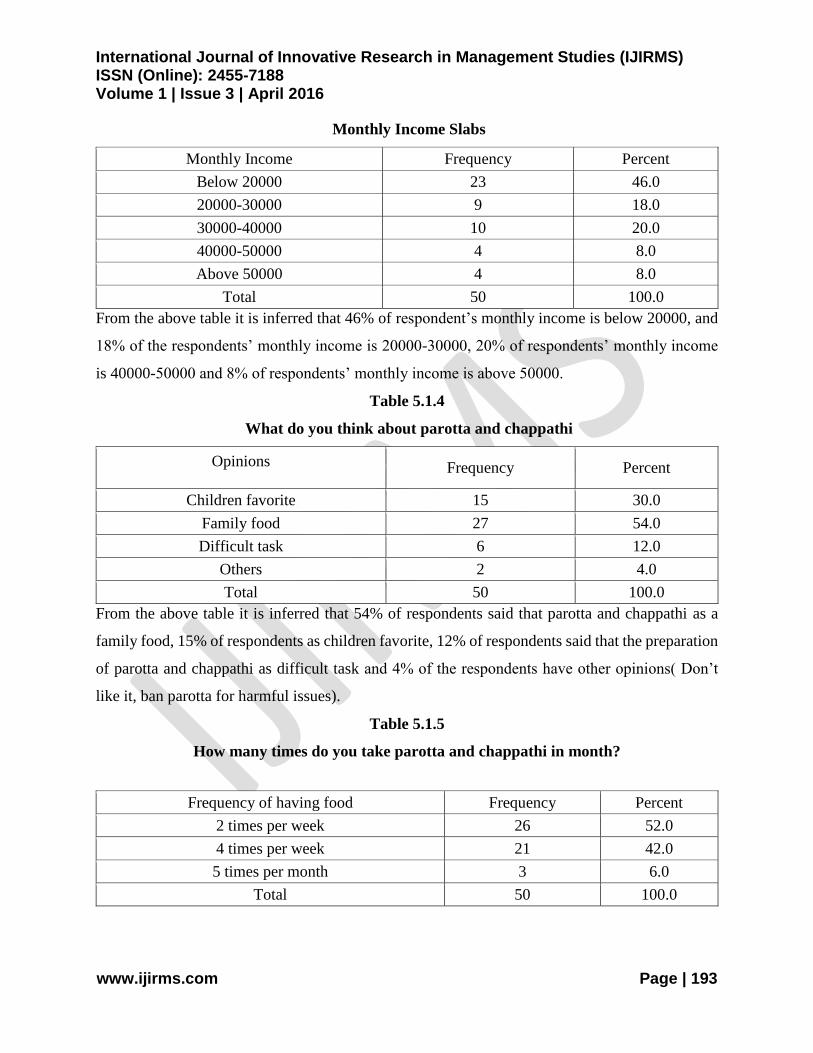
Monthly Income Slabs
Monthly Income Frequency Percent
Below 20000 23 46.0
20000-30000 9 18.0
30000-40000 10 20.0
40000-50000 4 8.0
Above 50000 4 8.0
Total 50 100.0
From the above table it is inferred that 46% of respondent’s monthly income is below 20000, and
18% of the respondents’ monthly income is 20000-30000, 20% of respondents’ monthly income
is 40000-50000 and 8% of respondents’ monthly income is above 50000.
Table 5.1.4
What do you think about parotta and chappathi
Opinions Frequency Percent
Children favorite 15 30.0
Family food 27 54.0
Difficult task 6 12.0
Others 2 4.0
Total 50 100.0
From the above table it is inferred that 54% of respondents said that parotta and chappathi as a
family food, 15% of respondents as children favorite, 12% of respondents said that the preparation
of parotta and chappathi as difficult task and 4% of the respondents have other opinions( Don’t
like it, ban parotta for harmful issues).
Table 5.1.5
How many times do you take parotta and chappathi in month?
Frequency of having food Frequency Percent
2 times per week 26 52.0
4 times per week 21 42.0
5 times per month 3 6.0
Total 50 100.0

International Journal of Innovative Research in Management Studies (IJIRMS) ISSN (Online): 2455-7188 Volume 1 | Issue 3 | April 2016
www.ijirms.com Page | 194
From the above table it is inferred that 52% of respondents consume parotta and chappathi 2 times
per week, 42% respondents consume 4 times per week and 6% of respondents consume 5 times
per month.
Table 5.1.6
Where do you eat the Parotta and Chappathi
Place of taking food Frequency Percent
Hotel 12 24.0
parotta stall 2 4.0
Home 36 72.0
Total 50 100.0
From the above table it is inferred that 24% of the respondents take food in hotel, 4% in parotta
stall and 72% in home.
Table 5.1.7
How will you take your food?
From the above table it is inferred that 58% of respondents take food away (parcel) and 42% take
food in stall/hotel.
Table 5.1.8
Preference of side dish for parotta and chappathi
Side dish Frequency Percent
Homemade kuruma 33 66.0
Kuruma prepared at hotel 16 32.0
If others specified 1 2.0
Total 50 100.0
From the above table it is inferred that 66% of the respondents prefer to have homemade kuruma,
32% prefer to have kuruma prepared at hotel and 2% prefer to have other than kuruma (veggies).
Mode of taking food Frequency Percent
Parcel 29 58.0
in stall/hotel 21 42.0
Total 50 100.0
International Journal of Innovative Research in Management Studies (IJIRMS) ISSN (Online): 2455-7188 Volume 1 | Issue 3 | April 2016
www.ijirms.com Page | 195
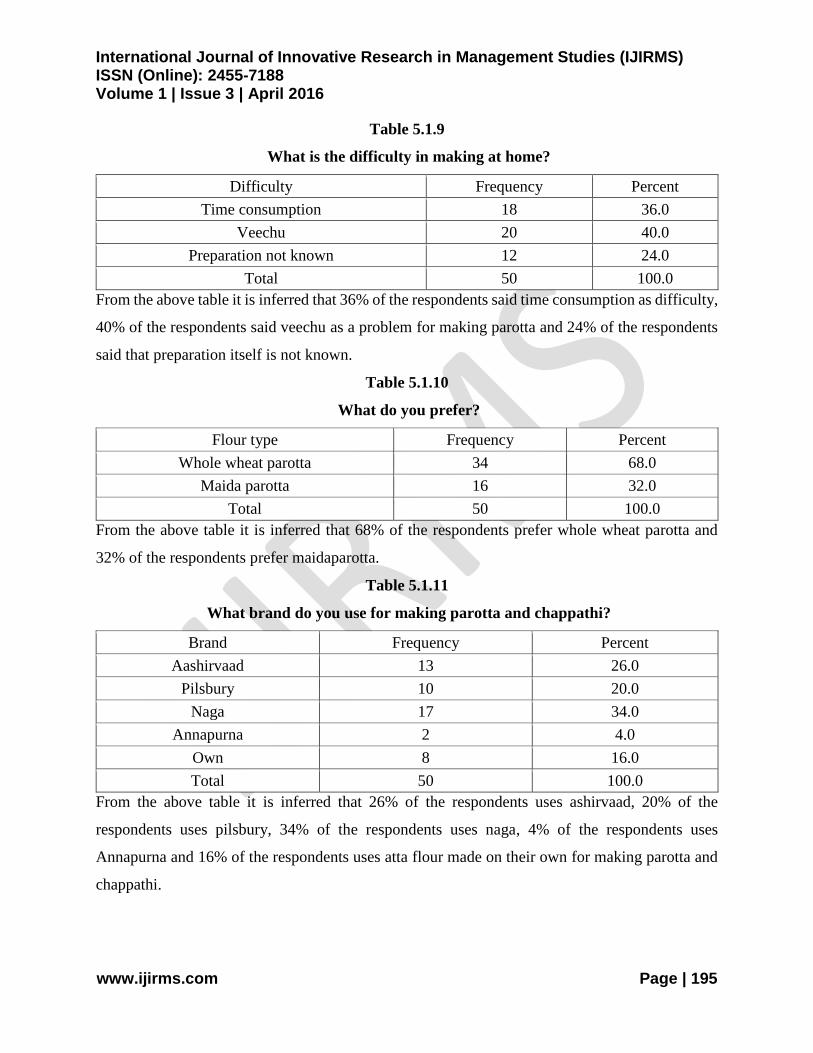
Table 5.1.9
What is the difficulty in making at home?
Difficulty Frequency Percent
Time consumption 18 36.0
Veechu 20 40.0
Preparation not known 12 24.0
Total 50 100.0
From the above table it is inferred that 36% of the respondents said time consumption as difficulty,
40% of the respondents said veechu as a problem for making parotta and 24% of the respondents
said that preparation itself is not known.
Table 5.1.10
What do you prefer?
Flour type Frequency Percent
Whole wheat parotta 34 68.0
Maida parotta 16 32.0
Total 50 100.0
From the above table it is inferred that 68% of the respondents prefer whole wheat parotta and
32% of the respondents prefer maidaparotta.
Table 5.1.11
What brand do you use for making parotta and chappathi?
Brand Frequency Percent
Aashirvaad 13 26.0
Pilsbury 10 20.0
Naga 17 34.0
Annapurna 2 4.0
Own 8 16.0
Total 50 100.0
From the above table it is inferred that 26% of the respondents uses ashirvaad, 20% of the
respondents uses pilsbury, 34% of the respondents uses naga, 4% of the respondents uses
Annapurna and 16% of the respondents uses atta flour made on their own for making parotta and
chappathi.

International Journal of Innovative Research in Management Studies (IJIRMS) ISSN (Online): 2455-7188 Volume 1 | Issue 3 | April 2016
www.ijirms.com Page | 196
Table 5.1.12
Are you aware of the Naga Products?
Awareness Frequency Percent
Yes 48 96.0
No 2 4.0
Total 50 100.0
From the above table it is inferred that 96% of the respondents are aware of naga products and 4%
of the respondents are not aware of Naga products.
Table 5.1.13
If yes, through which medium
Medium Frequency Percent
TV commercial 11 22.0
Radio 2 4.0
News paper 1 2.0
Word of mouth 34 68.0
None 2 4.0
Total 50 100.0
From the above table it is inferred that 22% of the respondents aware of naga products through TV
commercials, 4% of the respondents through radio, 2% of the respondents through newspaper,
68% get aware through word of mouth and 4% are not aware of naga products.
Table 5.1.14
Are the products available in your convenient market?
Market convenience Frequency Percent
Yes 42 84.0
No 8 16.0
Total 50 100.0
From the above table it is inferred that 84% of the respondents feel that naga products are market
convenient and 16% of the respondents feel that naga products are not market convenient.

International Journal of Innovative Research in Management Studies (IJIRMS) ISSN (Online): 2455-7188 Volume 1 | Issue 3 | April 2016
www.ijirms.com Page | 197
Table 5.1.15
Overall satisfaction about Naga products
Overall satisfaction Frequency Percent
Highly satisfied 10 20.0
Satisfied 40 80.0
Total 50 100.0
From the above table it is inferred that 20% of the respondents are highly satisfied with Naga
products and 80% of the respondents are satisfied with Naga products.
5.2 Analysis and Interpretation of Data Collected in Tiruchirappalli District
Table 5.2.1
Gender
Gender Frequency Percent
Male 18 36.0
Female 32 64.0
Total 50 100.0
From the above table it is inferred that 36% of the respondents are male and 64% of the respondents
are female.
Table 5.2.2
Age
From the above table it is inferred that 6% of respondents are below 20 of age,28 % of respondents
are 20-30 of age, 30% of respondents are 30-40 of age, 30% of respondents are 40-50 of age, and
6% of respondents are above 50.
Age Frequency Percent
Below 20 3 6.0
20-30 14 28.0
30-40 15 30.0
40-50 15 30.0
50 above 3 6.0
Total 50 100.0
International Journal of Innovative Research in Management Studies (IJIRMS) ISSN (Online): 2455-7188 Volume 1 | Issue 3 | April 2016
www.ijirms.com Page | 198
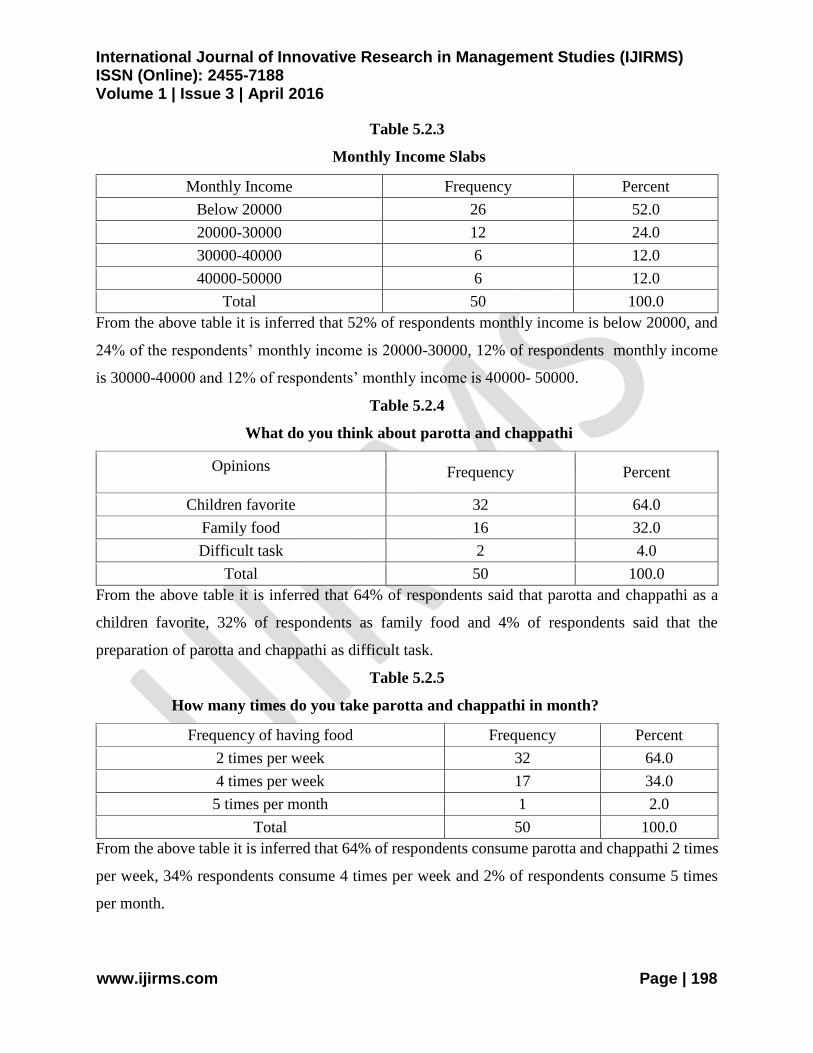
Table 5.2.3
Monthly Income Slabs
Monthly Income Frequency Percent
Below 20000 26 52.0
20000-30000 12 24.0
30000-40000 6 12.0
40000-50000 6 12.0
Total 50 100.0
From the above table it is inferred that 52% of respondents monthly income is below 20000, and
24% of the respondents’ monthly income is 20000-30000, 12% of respondents monthly income
is 30000-40000 and 12% of respondents’ monthly income is 40000- 50000.
Table 5.2.4
What do you think about parotta and chappathi
Opinions Frequency Percent
Children favorite 32 64.0
Family food 16 32.0
Difficult task 2 4.0
Total 50 100.0
From the above table it is inferred that 64% of respondents said that parotta and chappathi as a
children favorite, 32% of respondents as family food and 4% of respondents said that the
preparation of parotta and chappathi as difficult task.
Table 5.2.5
How many times do you take parotta and chappathi in month?
Frequency of having food Frequency Percent
2 times per week 32 64.0
4 times per week 17 34.0
5 times per month 1 2.0
Total 50 100.0
From the above table it is inferred that 64% of respondents consume parotta and chappathi 2 times
per week, 34% respondents consume 4 times per week and 2% of respondents consume 5 times
per month.

International Journal of Innovative Research in Management Studies (IJIRMS) ISSN (Online): 2455-7188 Volume 1 | Issue 3 | April 2016
www.ijirms.com Page | 199
Table 5.2.6
Where do you eat the parotta and chappathi?
Place of taking food Frequency Percent
Hotel 24 48.0
Parotta stall 9 18.0
Home 17 34.0
Total 50 100.0
From the above table it is inferred that 48% of the respondents take food in hotel, 18% in parotta
stall and 34% in home.
Table 5.2.7
How will you take your food?
Mode of taking food Frequency Percent
Parcel 37 74.0
in stall/hotel 13 26.0
Total 50 100.0
From the above table it is inferred that 74% of respondents take food away (parcel) and 26% take
food in stall/hotel.
Table 5.2.8
Preference of side dish for parotta and chappathi
From the above table it is inferred that 22% of the respondents prefer to have homemade kuruma
and 78% prefer to have kuruma prepared at hotel.
Table 5.2.9
What is the difficulty in making at home?
Difficulty Frequency Percent
Time consumption 15 30.0
Veechu 35 70.0
Total 50 100.0
Side dish Frequency Percent
Homemade kuruma 11 22.0
Kuruma prepared at hotel 39 78.0
Total 50 100.0

International Journal of Innovative Research in Management Studies (IJIRMS) ISSN (Online): 2455-7188 Volume 1 | Issue 3 | April 2016
www.ijirms.com Page | 200
From the above table it is inferred that 30% of the respondents said time consumption as difficulty
and 70% of the respondents said veechu as a problem for making parotta.
Table 5.2.10
What do you prefer?
Flour type Frequency Percent
Whole wheat parotta 21 42.0
Maida parotta 29 58.0
Total 50 100.0
From the above table it is inferred that 42% of the respondents prefer whole wheat parotta and
58% of the respondents prefer maidaparotta.
Table 5.2.11
What brand do you use for making parotta and chappathi?
Brand Frequency Percent
Aashirvaad 15 30.0
Pilsbury 7 14.0
Naga 16 32.0
Annapurna 12 24.0
Total 50 100.0
From the above table it is inferred that 30% of the respondents uses ashirvaad, 14% of the
respondents uses pilsbury, 32% of the respondents uses naga and 24% of the respondents uses
Annapurna.
Table 5.2.12
Are you aware of the Naga products?
Awareness Frequency Percent
Yes 49 98.0
No 1 2.0
Total 50 100.0
From the above table it is inferred that 98% of the respondents are aware of Naga products and 2%
of the respondents are not aware of Naga products.
International Journal of Innovative Research in Management Studies (IJIRMS) ISSN (Online): 2455-7188 Volume 1 | Issue 3 | April 2016
www.ijirms.com Page | 201
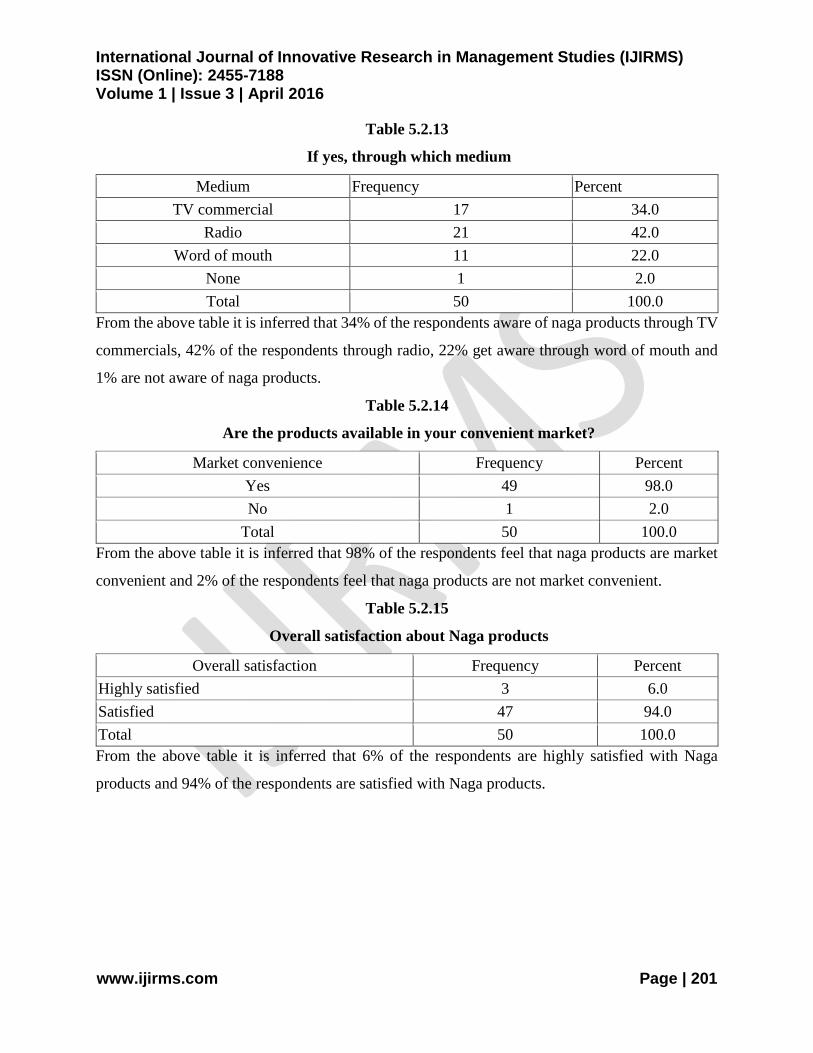
Table 5.2.13
If yes, through which medium
Medium Frequency Percent
TV commercial 17 34.0
Radio 21 42.0
Word of mouth 11 22.0
None 1 2.0
Total 50 100.0
From the above table it is inferred that 34% of the respondents aware of naga products through TV
commercials, 42% of the respondents through radio, 22% get aware through word of mouth and
1% are not aware of naga products.
Table 5.2.14
Are the products available in your convenient market?
Market convenience Frequency Percent
Yes 49 98.0
No 1 2.0
Total 50 100.0
From the above table it is inferred that 98% of the respondents feel that naga products are market
convenient and 2% of the respondents feel that naga products are not market convenient.
Table 5.2.15
Overall satisfaction about Naga products
Overall satisfaction Frequency Percent
Highly satisfied 3 6.0
Satisfied 47 94.0
Total 50 100.0
From the above table it is inferred that 6% of the respondents are highly satisfied with Naga
products and 94% of the respondents are satisfied with Naga products.
International Journal of Innovative Research in Management Studies (IJIRMS) ISSN (Online): 2455-7188 Volume 1 | Issue 3 | April 2016
www.ijirms.com Page | 202
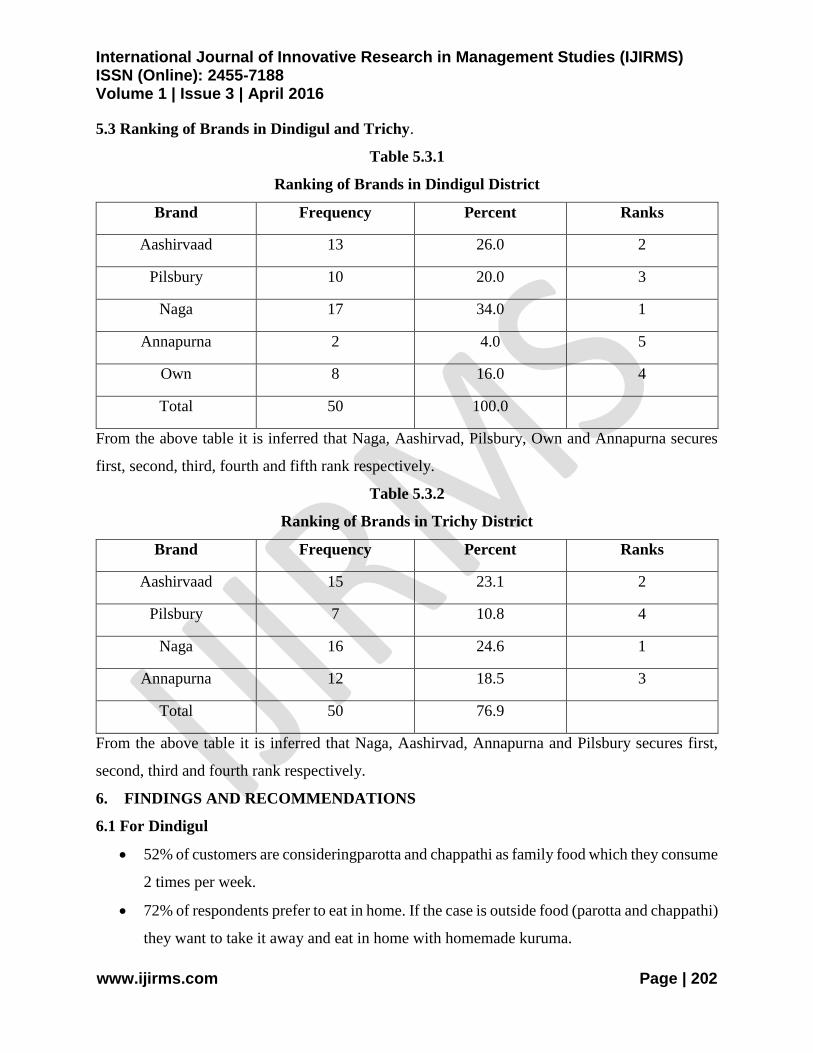
5.3 Ranking of Brands in Dindigul and Trichy.
Table 5.3.1
Ranking of Brands in Dindigul District
Brand Frequency Percent Ranks
Aashirvaad 13 26.0 2
Pilsbury 10 20.0 3
Naga 17 34.0 1
Annapurna 2 4.0 5
Own 8 16.0 4
Total 50 100.0
From the above table it is inferred that Naga, Aashirvad, Pilsbury, Own and Annapurna secures
first, second, third, fourth and fifth rank respectively.
Table 5.3.2
Ranking of Brands in Trichy District
Brand Frequency Percent Ranks
Aashirvaad 15 23.1 2
Pilsbury 7 10.8 4
Naga 16 24.6 1
Annapurna 12 18.5 3
Total 50 76.9
From the above table it is inferred that Naga, Aashirvad, Annapurna and Pilsbury secures first,
second, third and fourth rank respectively.
6. FINDINGS AND RECOMMENDATIONS
6.1 For Dindigul
52% of customers are consideringparotta and chappathi as family food which they consume
2 times per week.
72% of respondents prefer to eat in home. If the case is outside food (parotta and chappathi)
they want to take it away and eat in home with homemade kuruma.

International Journal of Innovative Research in Management Studies (IJIRMS) ISSN (Online): 2455-7188 Volume 1 | Issue 3 | April 2016
www.ijirms.com Page | 203
48% of respondents face the difficulty of veechu.68% of customers prefer whole wheat
parotta.
96% of customers aware of Naga products and mostly aware of word of mouth. Naga
products reach 84% of the sample customers and mostly people are satisfied with Naga
product.
6.2 For Trichy
The respondents in trichy Considerparotta and chappathi as children food which they
consume 2 times per week.
48% of the respondents prefer to eat in hotel.and 34% of respondents prefer to eat in home.
If the case is outside food (parotta and chappathi) they want to take it away and eat in home
with kuruma prepared at hotel.
70% of respondents face the difficulty of the veechu. which they don’t know to do.
42% prefer whole wheat parotta. 58% prefer maidaparotta. 98% of the sample are aware
of Naga products and mostly cause of Radio and next comed TV Commercial.
Naga products reach 98% of the sample customers and mostly people are satisfied with
Naga products.
7. SUGGESTIONS
Some people neglected parotta for the harmfulness of maida. So if we release whole wheat
parotta we can gain market.
Mostly parotta and chappathi are considered as family food and they want to eat at home
even though they are cornered to buy from stall, with homemade kuruma. But most people
don’t know to do veechu. So if we release instant parotta and chappathi (whole wheat)
which satisfies all these issues we can win the market.
Mostly all people in Dindigul are aware of the Naga products and mostly all are satisfied
with the products. Thus, we have greater scope in local market (Dindigul) and can capture
it.
Word of mouth is the main source of information. For the Naga to be popular. So it is
recommended to concentrate more on advertising strategies for brand building.
42% of the respondents prefer whole wheat parotta and 58% of the respondents prefer
maidaparotta. So we have good scope for both the varieties.

International Journal of Innovative Research in Management Studies (IJIRMS) ISSN (Online): 2455-7188 Volume 1 | Issue 3 | April 2016
www.ijirms.com Page | 204
Mostly parotta and chappathi are considered as children favorite and they want to eat at
home even though they are cornered to buy from stall, with kuruma made at hotel. But
most people don’t know to do veechu. So if we release instant parotta and chappathi (whole
wheat and maida) which satisfies all these issues we can win the market.
98% of the respondents in Trichy are aware of the Naga products and mostly all are
satisfied with the products. Thus, we have greater scope in Trichy market and can capture
the market share.
8. CONCLUSION
From the study it is concluded that advertisement strategy is essential for every company to have
a good brand image. Instant parotta and chappathi can be introduced, at the same time, it is to be
noted that people prefer whole wheat products over maida products for health consciousness. If
the Naga introduces as suggested, firm can very well establish in the market as consumers are
kings.
REFERENCES
1. Abraham-Murali, L.&Littrell, M.A. (1995). Consumer’s conceptualization of Apparel
attributes. Clothing and Textile Journal, Vol. 13, No. 2, pp.65-74.
2. Ali, A., Ram, V., Thumiki, R., &Khan, N. (2012). Factors Influencing Purchaseof FMCG by
Rural Consumers in South India: An Empirical Study. International Journal of Business
Researchand Development,Vol. 1, No. 1, pp.48Ǧ57.
3. Allport, G., W. (1935). Handbook of Social Psychology, edited by C. Murchison, pp. 798-844,
Worcester, MA: Clark University Press., American Marketing Association (AMA) Dictionary
(Print Version,1995),
4. Anand, &Hundal, B.S. (2008). Behaviour of consumers towards promotional schemes for
durables: a study in Punjab. The ICFAI University Journal of Consumer Behaviour, Vol. 3, No.
2, pp.17-31.
5. Anand, S. & Krishna, R. (2008). Rural Brand Preference Determinants in India. Marketing to
Rural Consumer, Understanding and Tapping the Rural Market Potential: Proceedings of the
Conference held at IIMK, pp.1-5.
*****