a study on morphological characterization of black bengal
TRANSCRIPT

Vol. 12(2), pp. 86-97, April-June 2021
DOI: 10.5897/IJLP2021.0771
Article Number: 2B2DCB067010
ISSN 2141-2448
Copyright © 2021
Author(s) retain the copyright of this article
http://www.academicjournals.org/IJLP
International Journal of Livestock
Production
Full Length Research Paper
A Study on Morphological Characterization of Black Bengal Goat at three Villages under Bhaluka upazila in
Mymensingh district of Bangladesh
A. Akhtar1, M. A. Hoque2, A. K. F. H. Bhuiyan2, M. R. Amin2 and M. A. Habib3*
1Department of Livestock Services (DLS), Farmgate, Dhaka, Bangladesh.
2Department of Animal Breeding and Genetics, Bangladesh Agricultural University (BAU), Mymensingh, Bangladesh.
3Bangladesh Livestock Research Institute (BLRI), Savar, Dhaka, Bangladesh.
Received 20 February, 2021; Accepted 6 April, 2021
The study was carried out in a community goat breeding program at three villages of Bhaluka upazila in Mymensingh district to characterize Black Bengal goat (BBG) by coat color phenotype and morphological body measurements. Data on coat color and body measurements were collected among 200 BBG populations along with different ages and sexes from three villages and analyzed statistically by SPSS 17.0. Among the studied population, black coat color was the highest (53%), followed by brown bezoar (16%), silver bezoar (15%), black with toggenburg pattern (9%), dutch belt pattern (5%), solid brown (3%), and non-distinguished (1%). The average body weight, body length, chest girth, wither height, head length, head width, ear length and ear breadth were 1.36±0.03 kg, 19.40±0.10, 23.72±0.08, 22.88±0.04, 8.42±0.02, 6.41±0.01, 6.64±0.04 and 3.61±0.01cm, respectively at birth. The body weight, body length, chest girth and wither height of male kids were significantly (p<0.05-p<0.001) higher than those of female kids at birth. All the parameters were linearly increased with progressing ages and at 12 month age those traits averaged as 14.38±0.13 kg, 47.51±0.17, 56.94±0.13, 47.17±0.29, 17.42±0.09, 10.77±0.07, 14.42±0.08 and 6.06±0.03 cm, respectively. At six month and onward, all the body measurements in males were significantly (p<0.05-p<0.001) higher than those of females. Strong positive correlations were found among body weight, body length, chest girth, and wither height (ranging from 0.88 to 0.99). From this study, it can be concluded that rather than sex, there have no distinct morphological differences among BBG population of different areas and different coat color variants.
Keywords: Black Bengal goat, characterization, color morphology, body measurement
INTRODUCTION Among small ruminants, goats are popularly known as poor’s people cow. Goats have been reared in Bangladesh from the time of human settlement in this part of the earth. There are 767.93 (1,094 in 2019,
reported by FAOSTAT, 2021) million goats in the world at present and among the total goat population, 92.76% of goats are found in Asia and Africa (FAO, 2013).
Asia has the largest population of goats (63.66% of *Corresponding author. E-mail: [email protected].
Author(s) agree that this article remain permanently open access under the terms of the Creative Commons Attribution
License 4.0 International License

world population), within which the largest populations are found in China (35.36%), India (25.46%), Pakistan (10.79%) and Bangladesh (7.05%) as reported by (FAO, 2011). These countries together possess about 71.61% of the population of goats in Asia. Although various types of goats are available in Bangladesh, Black Bengal goats (BBG) are most popular for their delicious meat and prolificacy. However, the limitation of BBG is that, it cannot produce higher amount of milk and body weight gain. Kids’ mortality is higher due to their poor genetic potentiality in milk production (Devendra and Burns, 1983). Thus, attempts should be given to genetic improvement for the traits which have economic importance. Selection and breeding is the tools for genetic improvement of the traits of importance. Characterization of BBG is the first step before designing and implementing a genetic improvement program. Morphometric measurement in live animals is important as it has correlation with body weight and growth traits and could be associated with other production traits. Prasad et al. (1981) reported that there is a correlation of body weight with length, height and heart girth in BBG. Relationship between body weight and length might be due to close association between weight and growth of muscles and bones leading to increase in length. Increase in chest girth includes the growth of bones, muscle and viscera (Jalil et al., 2018). Therefore, the aim of the study was to explore the morphometric characterization of BBG from three villages’ goat population as to enrich the available information on the study for this matter conducted so far in the country. MATERIALS AND METHODS
Study location, ecology and climate The study was conducted at rural community level goat flocks of three different villages namely: Gangatia, Borochala and Pachpai of Hobirbari union under Bhaluka upazila of Mymensingh district in Bangladesh. The study area is 70 km apart in the north side from the capital city, Dhaka and is bounded by Fulbaria and Trishal upazilas on the north, Sreepur upazila on the south, Gafargaon upazila on the east and Sakhipur and Ghatail upazilas on the west. The study location is geographically located in between 24°16´ and 24°29´ N latitude and in between 90°14´ and 90°29´ E longitudes. The ecology of the three villages is more or less the same. The temperature ranges from
33 to 12°C, and the annual rainfall
averages 2147 mm during the study period. Grazing land for the goat is available in Gangatia, Borochala and Pachpai village.
Animals and data recording
Before going to execute the community goat breeding program, an explicit baseline survey was conducted among randomly selected households at rural community level goat flocks of the three villages by a well-structured questionnaire to acquire some information on the distribution pattern, population size and morphological characteristics of BBG. For baseline survey, 183 households were randomly selected, and out of 183 households, 73 households were BBG raisers. The animals of the BBG raisers were taken under the
Akhtar et al. 87 consideration of data collection. The subsequent records of those animals for body measurements from birth to 3, 6, 9 and 12-month old were taken during the study period. Body weights were measured in kilogram by a hanging spring balance and other morphological body parameters were measured in centimeter by a measuring tape. Flock management Traditional housing with semi-intensive management system was practiced by the goat keeper households in the three villages. The bucks and does were allowed to graze separately tethered by rope in naturally available pasture land and adjoining fields of the farmer’s house. Goats were also provided with tree leaves, kitchen waste and leftover from family meals, table salt as well as cut and carry green grass ad lib during the day time. However, pregnant and lactating does were allowed to feed concentrate feeds like rice gruel, rice bran, broken rice, wheat bran etc. at 200 g/day. Fresh drinking water was also supplied for the goat ad-libitum. Does were mated naturally by bucks with unplanned breeding. Vaccination and de-worming were very rarely practiced by the goat keepers. Definition of coat color phenotypes In BBG population, several coat color variants are available in Bangladesh. However, most visible color types identified in the study areas among BBG population are defined as follows: Solid black (SB) Black coat around the body with no pattern (Figure 1). The gene responsible for black coat is A
a
Black with toggenburg pattern (TB) Dark body, dark belly, pale legs, ears and facial stripes (Figure 2). The Toggenburg pattern (A
sm), when eumelanin is brown.
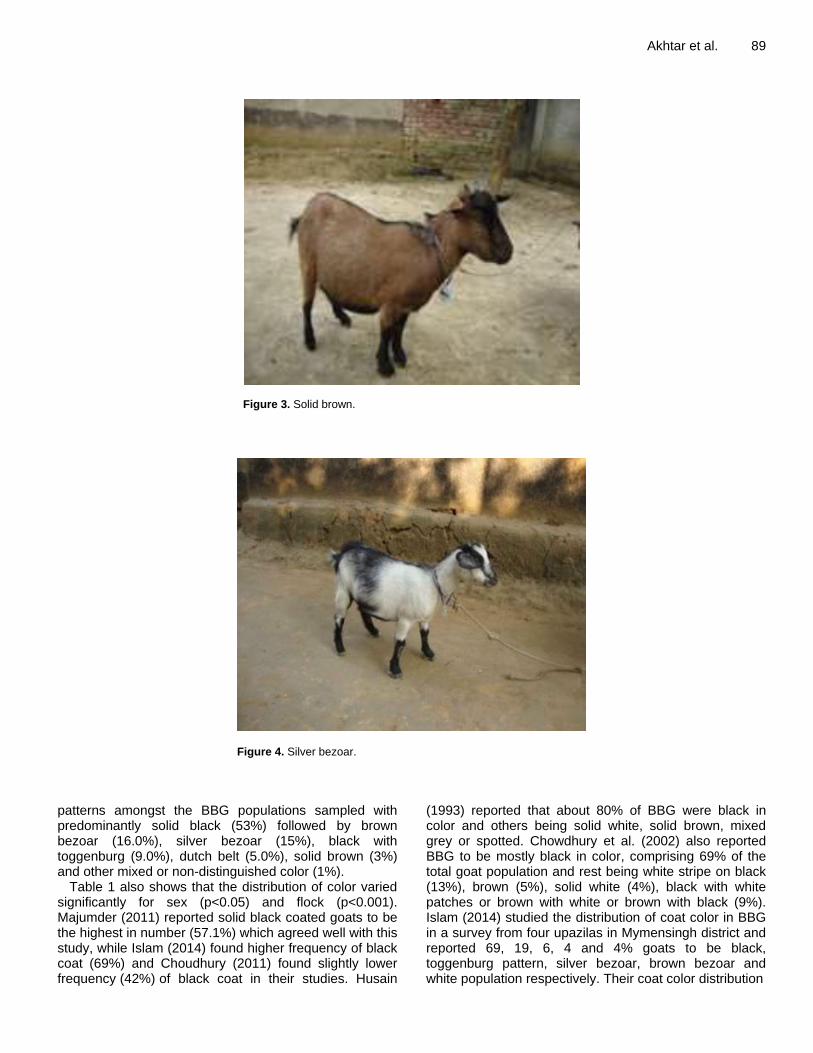
Solid brown (SBR)
Brown eumelanin varies from very dark (Bd) to very light brown (B
l)
(Figure 3).
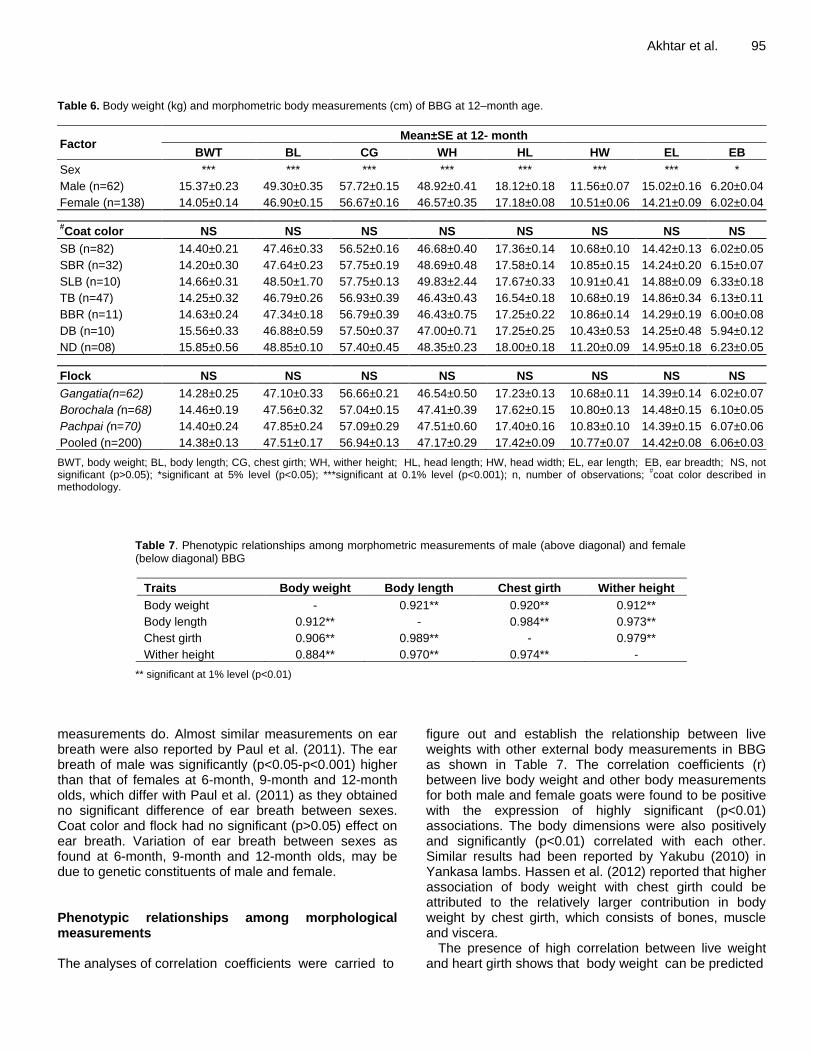
Bezoar Wild color (A
+), tan body, dark head with stripes, pale belly, striped
legs and back, black shoulder stripe; darker in males than in females. Bezoar consists of two types: silver bezoar (SLB) (Figure 4) and brown bezoar (BBR) (Figure 5). Dutch belt pattern (DB)
This varies from a nice ring around the barrel of the goat to a nearly white goat with colored tail and head (Figure 6). Also includes some with single side spots.
Non-distinguished pattern (ND)
Combination of different colors or mixed color with no distinct pattern (Figure 7).

88 Int. J. Livest. Prod.
Figure 1. Solid black
Figure 2. Black with toggenburg pattern.
Statistical Model and Data Analysis
The animals were of different populations, ages and sexes and number of observations within each sub-group was unequal. Thus, data were sufficient heterogeneity and hierarchy in nature. As a result, the design of experiment of this study was non-orthogonal factorial in nature. Descriptive statistics, Pearson’s correlation coefficient, analysis of variance (ANOVA) and Chi-square test for non-parametric variables were performed by SPSS 17.0 (1998) package. The significance of independent variables (fixed or non-genetic factors) was tested by least-squares analyses of variance using the general linear model (GLM) procedure with the following model given below:
Yijkl = μ + Si + Cj + Fk + eijkl
Where, Yijkl = Record of lth goat belonging to i
th sex of j
th coat color in
kth village flock.
μ = Overall population mean for body measurement traits; Si = Effect of i
th sex (where i = male and female),
Cj = Effect of jth coat color (where j = SB, SBR, TB, DB, BBR,
SLB and ND), Fk = Effect of k
th village flock (where k = Gangatia, Borochala and
Pachpai), eijkl = Random residual error associated with Yijk observation RESULTS AND DISCUSSION Coat color pattern As shown in Table 1, there were variations of color
Akhtar et al. 89
Figure 3. Solid brown.
Figure 4. Silver bezoar.
patterns amongst the BBG populations sampled with predominantly solid black (53%) followed by brown bezoar (16.0%), silver bezoar (15%), black with toggenburg (9.0%), dutch belt (5.0%), solid brown (3%) and other mixed or non-distinguished color (1%).
Table 1 also shows that the distribution of color varied significantly for sex (p<0.05) and flock (p<0.001). Majumder (2011) reported solid black coated goats to be the highest in number (57.1%) which agreed well with this study, while Islam (2014) found higher frequency of black coat (69%) and Choudhury (2011) found slightly lower frequency (42%) of black coat in their studies. Husain
(1993) reported that about 80% of BBG were black in color and others being solid white, solid brown, mixed grey or spotted. Chowdhury et al. (2002) also reported BBG to be mostly black in color, comprising 69% of the total goat population and rest being white stripe on black (13%), brown (5%), solid white (4%), black with white patches or brown with white or brown with black (9%). Islam (2014) studied the distribution of coat color in BBG in a survey from four upazilas in Mymensingh district and reported 69, 19, 6, 4 and 4% goats to be black, toggenburg pattern, silver bezoar, brown bezoar and white population respectively. Their coat color distribution
1
Fig. 4 (Silver bezoar)

90 Int. J. Livest. Prod.
Figure 5. Brown bezoar.
Figure 6. Dutch belt pattern.
patterns are not in agreement with the distribution pattern obtained in this study. The distribution of coat color variations as observed from different researchers may be due to color choice of farmers in different locations, market demand, adaptability, litter size, kid mortality, milk yield potentiality, etc. Whatever may be the reason, black coat color is predominantly most frequent all over the country due to its meat and skin demand to the consumers. Body weight and morphometric body measurements The body weight of BBG at different ages according to sex, coat color and flock are illustrated in Tables 2 to 6.
Body weight The body weight increased linearly with increasing ages as other reports indicated (Choudhury et al., 2012; Paul et al., 2011; Husain, 1993). The body weight of BBG at birth and at 3, 6, 9 and 12-month olds varied significantly between sex (p<0.05; p<0.01); males were higher than those of females. Choudhury et al. (2012) reported average body weight of BBG to be 14.47±0.48 kg at 12-month old, which closely coincides with this study. Paul (2008) studied the body weight of bucks and does at 12 months old for the same breed and found 14.20±0.20 and 12.40±0.41 kg respectively, which were lower than these findings. Singh et al. (1981) found 14.25 kg body weight at 12-month old for buck of the same breed which is

Akhtar et al. 91
Figure 7. Other combinations.
Table 1. Distribution of coat color pattern of BBG according to sex and flock.
Factor Distribution of different types
# of BBG based on coat color observation (%) Sig.
level SB TB SBR SLB BBR DB ND
Sex
Male (n=62) 58.1 08.1 01.6 19.4 09.7 01.6 01.6 *
Female (n=138) 50.0 09.4 02.9 11.6 18.8 06.5 00.7
Flock
Gangatia (n=75) 46.7 13.3 01.3 10.7 24.0 04.0 00.0
*** Borochala (n=43) 46.5 04.7 04.7 23.3 07.0 11.6 02.3
Pachpai (n=82) 59.8 06.1 02.4 14.6 12.2 03.7 01.2
Overall (n=200) 52.5 09.0 02.5 14.5 16.0 04.5 00.5
*p<0.05; ***p<0.001; n, number of observations; #types described in methodology.
slightly lower than this study. Islam (2014) in his survey found 4.67±0.15 and 7.12±0.14 kg body weight of female goat at 3-month and 6-month, respectively which is lower than this study. The body weight did not differ significantly for coat color and flock for any of the ages. Earlier, Choudhury et al. (2012) studied the morphological characteristics of BBG in the same locations and found no significant differences of body weight among different coat colors and villages which coincides with this study. However, in contrast, Hassen et al. (2012) found significant differences of body weights among indigenous goat populations in Ethiopia. Actually, body weight depends on many factors like age, body condition, nutrition, population, feeding and management and methods of measurements. Any of those factors may be the reason for variable body weights obtained by different researchers for the same breed.
Body length The body length increased linearly with age which corroborated with the findings of Paul et al. (2011) and Choudhury et al. (2012). Paul et al. (2011) studied the characterization of BBG at Bangladesh Agricultural University goat flock and estimated body length of male and female goat at birth, 3, 6, 9 and 12-month olds, which is closely in agreement with the present study. Rahman (2007) reported body length for the same ages in BBG bucks as 24.15±0.38, 29.70±0.75, 41.20±0.76, 43.87±0.54 and 47.83±0.75 cm, respectively which are slightly different from these findings. Alam (2006) conducted an experiment with white coat color in BBG and reported body length of female goats at 6-month, 9-month and 12-month olds to be 38.77, 42.85 and 46.95 cm, respectively which are closely in agreement with the

92 Int. J. Livest. Prod. Table 2. Body weight (kg) and morphometric body measurements (cm) of BBG at birth.
Factor Mean±SE at birth
BWT BL CG WH HL HW EL EB
Sex * * ** * NS NS NS NS
Male (n=62) 1.47±0.05 19.77±0.21 24.10±0.14 23.02±0.09 8.43±0.04 6.42±0.03 6.69±0.07 3.64±0.03
Female (n=138) 1.32±0.04 19.28±0.11 23.59±0.09 22.83±0.04 8.41±0.02 6.40±0.01 6.62±0.04 3.60±0.02
#Coat color NS NS NS NS NS NS NS NS
B (n=82) 1.37±0.05 19.44±0.14 23.81±0.12 22.88±0.06 8.42±0.03 6.41±0.02 6.63±0.06 3.62±0.2
SBR (n=32) 1.33±0.07 19.32±0.26 23.81±0.24 22.92±0.10 8.37±0.04 6.40±0.03 6.66±0.10 3.58±0.03
SLB (n=10) 1.38±0.11 19.63±0.55 23.63±0.09 22.67±0.08 8.40±0.05 6.32±0.05 6.73±0.16 3.61±0.05
TB (n=47) 1.33±0.07 19.48±0.19 23.64±0.12 22.88±0.08 8.48±0.03 6.43±0.02 6.57±0.07 3.62±0.03
BBR (n=110 1.46±0.09 19.07±0.67 22.96±0.49 22.96±0.22 8.33±0.07 6.38±0.04 6.64±0.24 3.56±0.07
DB (n=10) 1.44±0.12 18.88±0.72 24.75±0.27 22.69±0.16 8.46±0.07 6.35±0.03 6.54±0.20 3.65±0.07
ND (n=08) 1.37±0.11 19.45±0.74 23.95±0.15 23.00±0.18 8.28±0.11 6.40±0.03 7.05±0.05 3.71±0.04
Flock NS NS NS NS NS NS NS NS
Gangatia (n=62) 1.36±0.06 19.34±0.18 23.68±0.15 22.89±0.07 8.40±0.03 6.41±0.02 6.62±0.07 3.59±0.03
Borochala(n=68) 1.35±0.05 19.40±0.16 23.83±0.14 22.80±0.06 8.42±0.03 6.40±0.02 6.60±0.06 3.62±0.02
Pachpai (n=70) 1.37±0.05 19.46±0.18 23.65±0.12 22.94±0.06 8.43±0.03 6.41±0.02 6.69±0.06 3.63±0.02
Pooled (n=200) 1.36±0.03 19.40±0.10 23.72±0.08 22.88±0.04 8.42±0.02 6.41±0.01 6.64±0.04 3.61±0.01
BWT, body weight; BL, body length; CG, chest girth; WH, wither height; HL, head length; HW, head width; EL, ear length; EB, ear breadth; NS, not significant (p>0.05); *significant at 5% level (p<0.05); ** significant at 1% level (p<0.01); n, number of observations;
#coat color described in
methodology. findings of this study. The variations of body length among literatures could be attributed to different population, measuring methods, age, size, and genotype. Body length of male was significantly higher (p<0.05; p<0.001) than that of female. The earlier reports (Yakubu, 2010; Okpeku et al., 2011) also stated body measurements to be higher for male than female.
However, body length did not varied significantly (p>0.05) among different coat color and flocks which agreed well by another study in the same locations (Choudhury et al., 2012). This could be due to same characteristics found in all BBG population. Chest girth The measures of chest girth in this study increased linearly with age which is in general agreement with all other studies. Male had significantly (p<0.01; p<0.001) higher chest girth than that of female. In general agreement, Yakubu (2010) and Okpeku et al. (2011) reported higher body measurements of male than female in their studies. Hasanat et al. (2003) reported significantly (p<0.01) higher chest girth in male than female which is accorded but their measurements were slightly lower (55.42 and 52.93 cm) than this study. The chest girth estimated at different ages in both sexes is very closely agreed by the estimates of Paul et al. (2011)
for the same genotype, while Rahman (2007) found slightly higher values of chest girth at birth, 6-month, 9-month and 12-month olds than those of this study. Choudhury et al. (2012) reported average chest girth as 56.10±0.60 cm in BBG, which perfectly agreed by 12-month measurement of this study. Chest girth did not differ significantly (p>0.05) among the population of different coat colors and flocks which is in agreement with the study of Choudhury et al. (2012), but contradicts with other effect of the same authors as they found significant difference of chest girth among different villages. The variation of chest girth within the same genotype obtained by different researchers could be due to difference of population size, place of study, methods of measurements, age etc. The differences in chest girth between sexes may be reflected due to the genetic causes. Wither height Wither height increased linearly with age as other body measurements do. The estimates of wither height of BBG at birth, 3, 6, 9 and 12-month olds for both buck and does by Paul et al. (2011) are in line estimates of this study. Earlier, Rahman (2007) reported almost similar measurements of BBG buck at 6-month, 9-month and 12-month olds. Wither height of male was significantly higher

Akhtar et al. 93 Table 3. Body weight (kg) and morphometric body measurements (cm) of BBG at 3-month old.
Factor Mean±SE at 3- month
BWT BL CG WH HL HW EL EB
Sex * *** ** * ** *** *** NS
Male (n=62) 5.47±0.21 31.69±0.25 39.42±0.17 35.68±0.28 12.06±0.02 8.56±0.04 9.20±0.07 4.71±0.03
Female (n=138) 4.93±0.13 30.79±0.10 38.86±0.10 34.96±0.18 11.94±0.02 8.06±0.03 8.93±0.02 4.66±0.02
#Coat color NS NS NS NS NS NS NS NS
SB (n=82) 5.10±0.18 31.19±0.14 39.12±0.13 35.27±0.27 11.98±0.03 8.15±0.05 9.00±0.04 4.70±0.02
SBR (n=32) 5.02±0.27 30.76±0.28 38.79±0.20 35.10±0.40 11.95±0.05 8.14±0.07 9.02±0.08 4.66±0.03
SLB (n=10) 5.08±0.44 31.17±0.49 39.67±0.46 35.42±0.52 12.01±0.11 8.32±0.16 8.92±0.08 4.58±0.04
TB (n=47) 4.97±0.25 31.10±0.21 38.90±0.17 34.76±0.30 11.93±0.04 8.17±0.06 9.00±0.06 4.67±0.03
BBR (n=11) 5.45±0.41 30.00±0.59 38.79±0.52 34.68±0.43 11.86±0.09 8.11±0.10 8.79±0.10 4.62±0.04
DB (n=10) 5.01±0.62 31.00±0.71 38.75±0.43 35.44±0.66 11.98±0.13 8.26±0.09 9.13±0.13 4.61±0.05
ND (n=08) 5.00±0.51 31.00±0.35 39.00±0.33 36.35±0.74 12.15±0.07 8.60±0.07 9.24±0.19 4.78±0.11
Flock NS NS NS NS NS NS NS NS
Gangatia (n=62) 5.02±0.21 30.90±0.20 38.94±0.15 35.36±0.30 11.95±0.04 8.12±0.05 9.00±0.05 4.67±0.02
Borochala (n=68) 5.09±0.18 31.12±0.18 39.09±0.14 35.01±0.26 11.98±0.03 8.26±0.06 9.02±0.05 4.67±0.02
Pachpai (n=70) 5.09±0.20 31.02±0.17 38.98±0.15 35.08±0.27 11.96±0.04 8.17±0.05 8.99±0.04 4.68±0.03
Pooled (n=200) 5.07±0.11 31.02±0.10 39.00±0.09 35.14±0.16 11.97±0.02 8.18±0.03 9.00±0.03 4.67±0.01
BWT, body weight; BL, body length; CG, chest girth; WH, wither height; HL, head length; HW, head width; EL, ear length; EB, ear breadth; NS, not significant (p>0.05); *significant at 5% level (p<0.05); **, significant at 1% level (p<0.01); ***, significant at 0.1% level (p<0.001); n, number of observations;
#coat color described in methodology.
(p<0.05-p<0.001) than that of female for all ages which strongly supports by earlier works of Paul et al. (2011), Yakubu (2010) and Okpeku et al. (2011). Coat color and flock had no significant (p>0.05) effects on wither height measurements at those ages which disagreed by Hassen et al. (2012) who reported significant (p<0.001) variations of linear body measurements among indigenous goats of different ecotypes in Ethiopia. On the other hand, Choudhury et al. (2012) found no significant variations of wither height for different coat color and population of different villages which clearly accrues of this finding. Head length
Head length increased linearly with increasing ages. Head length of male was significantly (p<0.01; p<0.001) higher than that of female except at birth. The head length of male and female BBG obtained in this study is very similar to the results obtained by Paul et al. (2011) and Rahman (2007). Head length did not differ significantly (p>0.05) for coat color and flock. Only the cause for sex differentiation is due to sexual dimorphism. Head width Head width increased linearly with progressing ages. Male had significantly (p<0.001) higher head width than that of female in all ages, except at birth. The head width
of male and female BBG as found in this study is very concomitant with the results published by Paul et al. (2011) and Rahman (2007). Head width did not vary significantly (p>0.05) for coat color and flock. The sexual variation of head width as shown after birth is controlled genetically. Ear length The ear length increased linearly with advance age, which is very common phenomenon of biological norm. The ear length of BBG as estimated in this study is very consonant with the results documented by Paul et al. (2011) for birth at 3, 6 and 9-month olds, but at 12-months old it was lower than that of this study. Ear lengths of males were significantly (p<0.05; p<0.001) higher than those of females in all ages, except at birth, which differ with results of Paul et al. (2011) as they obtained no significant difference of ear length between sexes. However, the results obtained in this study are closely in line with that of Rahman (2007) and Alam (2006). Ear length did not vary significantly (p>0.05) for coat color and flock. Variation of ear length between sexes as found at different ages may be due to genetic.
Ear breadth The ear breath increased linearly in later ages as other

94 Int. J. Livest. Prod. Table 4. Body weight (kg) and morphometric body measurements (cm) of BBG at 6-month old.
Factor Mean±SE at 6-months
BWT BL CG WH HL HW EL EB
Sex * *** *** ** *** *** * ***
Male (n=62) 9.15±0.42 38.96±0.24 48.36±0.18 40.67±0.30 14.72±0.03 10.63±0.09 11.05±0.09 5.21±0.04
Female (n=138) 8.12±0.23 37.97±0.09 47.63±0.10 39.80±0.14 14.54±0.02 8.48±0.02 10.83±0.05 5.07±0.02
#Coat color NS NS NS NS NS NS NS NS
SB (n=82) 8.44±0.34 38.22±0.15 47.88±0.13 39.95±0.19 14.60±0.02 9.00±0.14 10.87±0.06 5.07±0.03
SBR (n=32) 8.24±0.48 38.10±0.23 47.62±0.26 40.71±0.40 14.56±0.04 8.89±0.19 10.88±0.10 5.16±0.06
SLB (n=10) 8.79±0.59 38.33±0.65 48.58±0.44 40.58±0.85 14.61±0.09 9.33±0.54 11.04±0.15 5.23±0.10
TB (n=47) 8.19±0.48 38.29±0.51 47.71±0.50 40.07±0.38 14.51±0.09 8.94±0.29 11.18±0.23 5.05±0.08
BBR (n=11) 8.93±0.65 38.12±0.19 47.72±0.19 39.78±0.29 14.57±0.04 8.99±0.19 10.80±0.90 5.07±0.04
DB (n=10) 8.57±1.04 38.25±0.66 47.50±0.61 39.06±0.26 14.65±0.12 9.14±0.63 10.88±0.16 5.16±0.12
ND (n=08) 8.12±1.08 39.20±0.72 48.00±0.28 39.40±0.32 14.67±0.05 9.75±0.25 11.05±0.30 2.25±0.11
Flock NS NS NS NS NS NS NS NS
Gangatia(n=62) 8.40±0.38 38.08±0.16 47.76±0.15 40.00±0.23 14.55±0.03 8.92±0.14 10.84±0.07 5.07±003
Borochala (n=68) 8.38±0.33 38.31±0.18 47.99±0.16 40.26±0.25 14.63±0.03 9.18±0.17 10.97±0.07 5.13±0.03
Pachpai (n=70) 8.37±0.37 38.27±0.17 47.69±0.17 39.80±0.22 14.57±0.03 8.98±0.14 10.84±0.07 5.11±0.03
Pooled (n=200) 8.38±0.21 38.22±0.10 47.81±0.09 40.02±0.14 14.58±0.02 9.03±0.09 10.89±0.04 5.10±0.02
BWT, body weight; BL, body length; CG, chest girth WH, wither height; HL, head length; HW, head width; EL, ear length; EB, ear breadth; NS, not significant (p>0.05), *significant at 5% level (p<0.05) **significant at 1% level (p<0.01); ***significant at 0.1% level (p<0.001); n, number of observations;
#coat color described in methodology.
Table 5. Body weight (kg) and morphometric body measurements (cm) of BBG at 9-month old.
Factor Mean±SE at 9- month
BWT BL CG WH HL HW EL EB
Sex ** *** *** *** *** *** *** **
Male (n=62) 12.16.±0.44 43.30±0.24 52.62±0.19 44.14±0.24 15.01±0.04 10.97±0.08 12.01±0.07 5.46±0.04
Female (n=138) 10.87±0.23 42.49±0.12 51.82±0.10 42.54±0.14 14.80±0.02 9.46±0.04 11.76±0.03 5.31±0.03
#Coat color NS NS NS NS NS NS NS NS
SB (n=82) 11.29±0.34 42.95±0.18 51.90±0.14 42.83±0.20 14.89±0.02 9.83±0.10 11.87±0.05 5.32±0.04
SBR (n=32) 10.95±0.48 42.45±0.31 52.12±0.22 43.46±0.28 14.87±0.04 9.60±0.16 11.76±0.07 5.42±0.05
SLB (n=10) 11.20±0.72 42.75±0.57 52.67±0.48 43.42±0.78 14.83±0.06 10.08±0.43 11.83±0.14 5.46±0.11
TB (n=47) 11.06±0.49 41.79±0.24 51.64±0.59 42.57±0.62 14.78±0.06 9.89±0.24 11.86±0.13 5.29±0.09
BBR (n=11) 11.84±0.59 42.52±0.17 52.08±0.19 42.62±0.30 14.81±0.04 9.93±0.16 11.78±0.06 5.30±0.05
DB (n=10) 11.20±1.10 42.88±0.66 51.63±0.52 42.75±0.52 14.96±0.07 9.93±0.40 12.00±0.18 5.35±0.13
ND (n=08) 11.05±1.07 43.10±0.64 52.65±0.42 44.10±0.58 14.75±0.05 10.23±0.18 11.75±0.14 5.63±0.12
Flock NS NS NS NS NS NS NS NS
Gangatia (n=62) 11.18±0.39 42.65±0.20 51.74±0.16 42.59±0.24 14.88±0.02 9.76±0.11 11.81±0.05 5.28±0.04
Borochala (n=68) 11.16±0.34 42.88±0.19 52.22±0.16 43.27±0.20 14.87±0.03 9.99±0.13 11.86±0.05 5.40±0.04
Pachpai (n=70) 11.24±0.38 42.55±0.18 52.09±0.16 42.95±0.25 14.82±0.03 9.79±0.11 11.81±0.05 5.35±0.04
Pooled (n=200) 11.19±0.21 42.69±0.11 52.02±0.09 42.94±0.13 14.85±0.02 9.85±0.07 11.83±0.03 5.35±0.02
BWT, body weight; BL, body length; CG, chest girth; WH, wither height; HL, head length; HW, head width; EL, ear length; EB, ear breadth; NS, not significant (p>0.05); **significant at 1% level (p<0.01); ***significant at 0.1% level (p<0.001); n, number of observations;
#coat color described in
methodology.
Akhtar et al. 95 Table 6. Body weight (kg) and morphometric body measurements (cm) of BBG at 12–month age.
Factor Mean±SE at 12- month
BWT BL CG WH HL HW EL EB
Sex *** *** *** *** *** *** *** *
Male (n=62) 15.37±0.23 49.30±0.35 57.72±0.15 48.92±0.41 18.12±0.18 11.56±0.07 15.02±0.16 6.20±0.04
Female (n=138) 14.05±0.14 46.90±0.15 56.67±0.16 46.57±0.35 17.18±0.08 10.51±0.06 14.21±0.09 6.02±0.04
#Coat color NS NS NS NS NS NS NS NS
SB (n=82) 14.40±0.21 47.46±0.33 56.52±0.16 46.68±0.40 17.36±0.14 10.68±0.10 14.42±0.13 6.02±0.05
SBR (n=32) 14.20±0.30 47.64±0.23 57.75±0.19 48.69±0.48 17.58±0.14 10.85±0.15 14.24±0.20 6.15±0.07
SLB (n=10) 14.66±0.31 48.50±1.70 57.75±0.13 49.83±2.44 17.67±0.33 10.91±0.41 14.88±0.09 6.33±0.18
TB (n=47) 14.25±0.32 46.79±0.26 56.93±0.39 46.43±0.43 16.54±0.18 10.68±0.19 14.86±0.34 6.13±0.11
BBR (n=11) 14.63±0.24 47.34±0.18 56.79±0.39 46.43±0.75 17.25±0.22 10.86±0.14 14.29±0.19 6.00±0.08
DB (n=10) 15.56±0.33 46.88±0.59 57.50±0.37 47.00±0.71 17.25±0.25 10.43±0.53 14.25±0.48 5.94±0.12
ND (n=08) 15.85±0.56 48.85±0.10 57.40±0.45 48.35±0.23 18.00±0.18 11.20±0.09 14.95±0.18 6.23±0.05
Flock NS NS NS NS NS NS NS NS
Gangatia(n=62) 14.28±0.25 47.10±0.33 56.66±0.21 46.54±0.50 17.23±0.13 10.68±0.11 14.39±0.14 6.02±0.07
Borochala (n=68) 14.46±0.19 47.56±0.32 57.04±0.15 47.41±0.39 17.62±0.15 10.80±0.13 14.48±0.15 6.10±0.05
Pachpai (n=70) 14.40±0.24 47.85±0.24 57.09±0.29 47.51±0.60 17.40±0.16 10.83±0.10 14.39±0.15 6.07±0.06
Pooled (n=200) 14.38±0.13 47.51±0.17 56.94±0.13 47.17±0.29 17.42±0.09 10.77±0.07 14.42±0.08 6.06±0.03
BWT, body weight; BL, body length; CG, chest girth; WH, wither height; HL, head length; HW, head width; EL, ear length; EB, ear breadth; NS, not significant (p>0.05); *significant at 5% level (p<0.05); ***significant at 0.1% level (p<0.001); n, number of observations;
#coat color described in
methodology.
Table 7. Phenotypic relationships among morphometric measurements of male (above diagonal) and female (below diagonal) BBG
Traits Body weight Body length Chest girth Wither height
Body weight - 0.921** 0.920** 0.912**
Body length 0.912** - 0.984** 0.973**
Chest girth 0.906** 0.989** - 0.979**
Wither height 0.884** 0.970** 0.974** -
** significant at 1% level (p<0.01)
measurements do. Almost similar measurements on ear breath were also reported by Paul et al. (2011). The ear breath of male was significantly (p<0.05-p<0.001) higher than that of females at 6-month, 9-month and 12-month olds, which differ with Paul et al. (2011) as they obtained no significant difference of ear breath between sexes. Coat color and flock had no significant (p>0.05) effect on ear breath. Variation of ear breath between sexes as found at 6-month, 9-month and 12-month olds, may be due to genetic constituents of male and female. Phenotypic relationships among morphological measurements The analyses of correlation coefficients were carried to
figure out and establish the relationship between live weights with other external body measurements in BBG as shown in Table 7. The correlation coefficients (r) between live body weight and other body measurements for both male and female goats were found to be positive with the expression of highly significant (p<0.01) associations. The body dimensions were also positively and significantly (p<0.01) correlated with each other. Similar results had been reported by Yakubu (2010) in Yankasa lambs. Hassen et al. (2012) reported that higher association of body weight with chest girth could be attributed to the relatively larger contribution in body weight by chest girth, which consists of bones, muscle and viscera.
The presence of high correlation between live weight and heart girth shows that body weight can be predicted

96 Int. J. Livest. Prod.
Figure 8. Relationship between body weight and body length.
Figure 9. Relationship between body weight and chest girth.
from heart girth measurements of goats, which is in agreement with other reports (Sowande et al., 2010; Cam et al., 2010; Hassen et al., 2012). Paul et al. (2011) reported correlation coefficients with highly significant associations (p<0.01) between body weight with body length, chest girth and wither height in BBG buck and does to be 0.95 and 0.97, 0.86 and 0.857 and 0.94 and 0.94, respectively. They also reported strongly positive correlations among other body measurements which closely agree with estimates of this study. These findings are also in line findings of Moela (2014), who obtained high and significant (p<0.01) correlations between all measurements for both male and female indigenous goats in South Africa. The findings of Moela (2014) reveal the consonance of this study, as the author found strong
Figure 10. Relationship between body weight and wither height.
relationships between body weight and body length (rmale= 0.85, rfemale= 0.80) and between body weight and heart girth (rmale= 0.91, rfemale= 0.89).
However, the high and significant correlations between body weight with body length, chest girth and wither height suggest that either of these variables or their combination would provide a good estimator for predicting body weight in BBG, especially in areas where weighing scale is not available. Moreover, such strong relationship of body length or chest girth or wither height with body weight could be used as a proxy to estimate body weight for indigenous goats for tropical countries like Bangladesh where formal breed data recording schemes are not well established. In general, such assessment of body measurements in goats remains very important for avoiding the errors of visual determination of animal weights in areas where weighing balance cannot be assessed. CONCLUSION From this study it was found that color phenotype in BBG is not a determinant on body measurements. However, morphometric characteristics as obtained in this study are more or less likely to be the unique character of this genotype. The strong positive relationship with higher coefficient of determination (R
2) values between body
weight and body length (Figure 8), or body weight and chest girth (Figure 9), or body weight and wither height (Figure 10), indicate that body weight can easily be estimated by developing regression equation from multiple or single body measurement. CONFLICT OF INTERESTS The authors have not declared any conflict of interest.
y = 0.4493x - 7.9935 R² = 0.8368
-2
0
2
4
6
8
10
12
14
16
18
20
0 20 40 60
Bo
dy
weig
ht
(kg
)
Body length (cm)
BWT
Linear(BWT)
Bo
dy
we
igh
t (k
g)

REFERENCES
Alam MK (2006). Characterization and performance evaluation of white
goat in some selected areas of Bangladesh. M. S. Thesis, Department of Animal Breeding and Genetics. Bangladesh Agricultural University. Mymensingh pp.35-69.
Cam MA, Olfaz M, Soydan E (2010). Possibilities of using morphometrics characteristics as a tool for body weight prediction in Turkish hair goats (Kilkeci). Asian Journal of Animal and Veterinary Advances 5(1):52-59.
Choudhury MP (2011). Studies on the morphometry and performance of Black Bengal Goat at community level. MS Thesis, Department of Animal Breeding and Genetics, Bangladesh Agricultural University, Mymensingh.
Choudhury MP, Sarker SC, Islam F, Ali A, Bhuiyan AKFH, Ibrahim MNM, Okeyo AM (2012). Morphometry and performance of Black Bengal goats at the rural community level in Bangladesh. Bangladesh Journal of Animal Science 41(2):83-89.
Chowdhury SA, Bhuiyan MSA, Faruque S (2002). Rearing Black Bengal goat under semi–intensive management. 1. Physiological and reproductive performances. Asian-Australasian Journal of Animal Science 15(4):477-484.
Devendra C, Burns M (1983). Goat Production in the tropics. Common wealth Agricultural Bureaux, Farnham House, UK pp. 49-54.
Food and Agriculture Organization (FAO) (2011). FAOSTAT, Food and Agriculture Organization, Rome, Italy.
Food and Agriculture Organization (FAO) (2021). FAOSTAT, Food and Agriculture Organization, Rome, Italy.
Food and Agriculture Organization (FAO) (2013). World Livestock 2013. Food and Agriculture Organization of United Nations. Rome. Italy.
Hasanat MT, Husain SS, Amin MR, Miah G (2003). Characterization of Black Bengal goats for some qualitative and quantitative traits. Bangladesh Journal of Animal Science 32:109-120.
Hassen H, Baum M, Rischkowsky B, Tibbo M (2012). Phenotypic characterization of Ethiopian Indigenous goat populations. African Journal of Biotechnology 11(73):13838-13846
Husain SS (1993). A study on the productive performance and genetic potentials of Black Bengal goats. A Ph.D. Thesis, Bangladesh Agricultural University, Mymensingh pp. 3-108.
Islam AFMF (2014). Study on breeding and performance profile of Black Bengal goats in Mymensingh district. MS thesis, Department of Animal Breeding and Genetics, Bangladesh Agricultural University, Mymensingh pp. 1-45.
Jalil MA, Choudhury MP, Kabir MM, Habib MA (2018). Morphometric characterization of Black Bengal Goat under farming condition in Bangladesh. Asian Journal of Medical and Biological Research 4(1):95-104, doi: 10.3329/ajmbr.v4i1.36827.
Majumder MKH (2011). Characterization of Black Bengal goat in north western region of Bangladesh. M. S. Thesis. Department of Animal Breeding and Genetics, Bangladesh Agricultural University, Mymensingh.
Moela AK (2014). Assessment of the relationship between body weight and body measurements in indigenous goats using path analysis. A dissertation for Master of Agricultural Management (Animal Production). Department of Agricultural Economics and Animal Production, School of Agricultural and Environmental Sciences, Faculty of Science and Agriculture, University of Limpopo, South Africa pp. 1-56.
Akhtar et al. 97 Opeku M, Yakubu A, Peters SO, Ozoje MO, Ikeobi CON, Adebambo
OA, Imumorin IG (2011). Application of multivariate principal component analysis to morphological characterization of indigenous goats in Southern Nigeria. Acta Agriculturae Slovenica 98(2):101-109.
Paul S (2008). Characterization of Black Bengal Goat. MS Thesis, Department of Animal Breeding and Genetics, Bangladesh Agricultural University, Mymensingh.
Paul S, Khandoker MAMY, Moinuddin MA, Paul RC (2011). Characterization of Black Bengal goat. Journal of Bangladesh Agricultural University 9(1):61-66.
Prasad B, Singh CSP, Mishra HR (1981). Note on body weight-measurement relationship in Black Bengal goats. Indian Journal of Animal Science 51:880-882. doi: https://agris.fao.org/agris-search/search.do?recordID=US201301976738.
Rahman FMD (2007). Prediction of carcass weight from the body characteristics of black Bengal goat. International Journal of Agriculture and Biology 3:431-434.
Singh CSP, Mukherjee DK, Prasad B, Mishra HR (1981). Note on body measurements and weights of Black and Brown Bengal goats. Indian Journal of Animal Science 51(2):234-236. https://agris.fao.org/agris-search/search.do?recordID=IN19820727053
Sowande O, Oyewale B, Iyasere O (2010). Age and sex dependent regression models for predicting the live weight of West African Dwarf goat from body measurements. Tropical Animal Health and Production 42(5):969-975.
Statistical Package for the Social Sciences (SPSS) (1998). Statistical Package for the Social Sciences. SPSS Inc. an IBM Company Headquarters. Chicago, Illinois, USA.
Yakubu A (2010). Path coefficient and path analysis of body weight and biometric traits in Yankasa lambs. Slovakian Journal of Animal Science 43:17-25.