a study on social impact of women self help groups in ... · moinqasi (1997) in his work “self...
TRANSCRIPT

International Journal of Social Science & Interdisciplinary Research__________________________________ ISSN 2277 3630 IJSSIR, Vol. 2 (3), MARCH (2013) Online available at indianresearchjournals.com
1
A STUDY ON SOCIAL IMPACT OF WOMEN SELF HELP GROUPS IN
METTUR TALUK, SALEM DISTRICT, TAMILNADU
P.UMAMAHESWARI*; M.GURUSAMY**; DR. A. JAYAKUMAR***
*ASSISTANT PROFESSOR
DEPARTMENT OF MANAGEMENT STUDIES
PAAVAI COLLEGE OF ENGINEERING
NAMAKKAL – 637 018
TAMIL NADU, INDIA
** ASSISTANT PROFESSOR AND HEAD
DEPARTMENT OF MANAGEMENT STUDIES
PAAVAI COLLEGE OF ENGINEERING
NAMAKKAL – 637 018
TAMIL NADU, INDIA
*** PROFESSOR AND FORMER CONTROLLER OF EXAMINATIONS,
DEPARTMENT OF COMMERCE,
PERIYAR UNIVERSITY,
SALEM - 636 011
TAMIL NADU, INDIA
______________________________________________________________________________
ABSTRACT
In recent years, the empowerment of women has been recognized as a central issue in
determining their status. The objective of the study are to study the social impact of women self-
help groups, to analyze the changes in the social condition SHGs, to measure the impact of the
SHGs on the social condition of the members, and to analyze the attitude of the members of the
SHGs towards social impact. The study is descriptive nature. Only primary data has been made
used off for the purpose of analysis. Primary data have been collected through a field survey.
The sample size of the study is 120 respondents. The researcher has used stratified random
sampling. The questionnaire has used to collect the data from respondents. The sample area is
MetturTaluk in Salem District, Tamil Nadu. The Discriminant Analysis has used to analysis the
collected data.In short, the study would be highly useful to researchers, planners and policy
makers in overcoming the problems of women and in formulating strategies for the social
development and empowerment women through SHGs in Tamilnadu in general and particularly
in MetturTaluk in Salem District.
KEYWORDS: Empowerment, NGO, Social Condition, SHG, and Socio-Economic
Development
______________________________________________________________________________
International Journal of Social Science & Interdisciplinary Research__________________________________ ISSN 2277 3630 IJSSIR, Vol. 2 (3), MARCH (2013) Online available at indianresearchjournals.com
2
1. INTRODUCTION
India is a nation of extraordinary diversity, the second largest in Asia and the seventh largest and
second most populous country on Earth. It is the giant of the Indian subcontinent, which
comprises fully one third of Asia. India has made tremendous progress in various spheres of life
during the last 5 ½ decades. Its economy has expanded and diversified, the society has become
cohesive and politically democratized. It has also been facing many problems, some of which
have been successfully solved, but many others still remain unsolved. Poverty is one of such
challenge, India has been facing today.As a measure of reducing poverty, most of the developing
countries have adopted the system of empowering the individual to be self-reliant. As a means of
helping the individual to be self-reliant, the Government, Non-Governmental Organizations
(NGOs), Rural Banks and Commercial Banks have been giving these individuals some amount
of help in the form of capital. This is to help the individual to start some income generating
activities so as to save them from poverty. In this regard, „Rural Development‟ has become a
distinct approach and strategy implemented mainly by the Government, NGO‟s and private
agencies in developing countries. Its focus on poverty makes it stand in a special category of
interventions for bringing about socio-economic change.
2. REVIEW OF LITERATURE
MoinQasi (1997) in his work “Self Help Groups – A Novel Approach to Rural Development,”
makes an attempt to study the reasons for the linkage of members of Self-Help Groups in rural
development. According to his findings, a common bond like caste, sub-caste, blood,
community, and place of origin or activity linked the members of Self-Help Groups. He stated
that woman Self-Help Groups are more effective than those of others and they have more
chances for survival. Although social homogeneity is used in establishing these groups, the real
objective is for economic factors, the author stated. The author further insisted that while
providing support to self-help groups it is necessary to keep in mind the sentiments and
emotional values of rural women. The support provided must be sensitive to their feelings,
appropriate and timely. NilanjanSengupta (1998) in his study “Empowerment: A Socio-
Psychological Approach to Self Help Groups Formation,” identifies the different forms of
community organisations, which involve people‟s participation and the role played by them for
the empowerment of these organisations. He also discusses social leaning as an empowerment
strategy for increasing the participation of people at the grass-root level. Further, he gives the
project design for people‟s participation at the grass-root level. According to him, social
awareness among the group members has to be created first and then they could move towards
economic empowerment. The researcher feels that to ensure the development of skills and
consciousness for sustainability of any activity in the long run social and psychological
empowerment is a must. K.R.Lakshmikandan (2000) in his study titled “Self Help Groups in the
Life of Rural Poor – A Philibhit Case Study,” stated that most of the membership of the Self-
Help Groups consisted of small landholders and agricultural labourers. He is of the opinion that
facilities for entrepreneurial development are available within the group only at the micro level
when compared to the large basic functions like market study, providing resources, general
production management and marketing management. The literacy rate of the members of some
self-help groups has improved from five per cent to 90 per cent he stated. N.Manimekalai and
G.Rajeswari (2000) in their work “Empowerment of Women through Self Help Groups,”
analysed the women self-help groups formed by the Non-Governmental Organisations in the

International Journal of Social Science & Interdisciplinary Research__________________________________ ISSN 2277 3630 IJSSIR, Vol. 2 (3), MARCH (2013) Online available at indianresearchjournals.com
3
rural areas of Tiruchirappalli District for the purpose of promoting rural women through self-employment.
The Non-Governmental Organisation namely, Society for Education and Village Action and
Empowerment (SEVAE) has been working in 362 villages and helping a total of one-lakh women
beneficiaries consisting of different avenues of self-employment like petty businesses, processing,
production and service units. A.Suriakanthi (2000) in her study “Literacy – Essential for SHGs” analyses
the need for literacy of the self-help group members. The female office-bearers manage to carry on the
activities with the help of their husbands and educated wards. They use to narrate the incidents that
happen in the meetings to their husband/ward and they prepare the report. Fifty per cent of the group‟s
survey shown that only literate members prepare the minutes and accounts on behalf of the office-bearers
who are illiterate. It is found that ten per cent of the illiterate members do not even know the amount
saved by them. She strongly insists on the necessity of imparting basic education to all Self-Help Groups.
3. STATEMENT OF THE PROBLEM
In recent years, the empowerment of women has been recognized as a central issue in determining their
status. For the accelerated socio-economic development of any community, the active participation of
women is essential. In a social set up like India, their participation has to be ensured through tangible
measures, taken at various levels, which result in their empowerment in the real sense. Empowerment of
women is one of the concepts that have developed in connection with improving their status.
Empowerment includes higher literacy levels, education, better healthcare, equal ownership of productive
resources, increased participation in economic and commercial sectors, awareness of rights and
responsibilities, improved standards of living, self-reliance, self-esteem and self-confidence.
4. OBJECTIVES OF THE STUDY
To study the social impact of women self-help groups
To analyse the changes in the social condition SHGs;
To measure the impact of the SHGs on the social condition of the members
To analyse the attitude of the members of the SHGs towards social impact
5. RESEARCH METHODOLOGY
The study is descriptive nature. Only primary data has been made used off for the purpose of analysis.
Primary data have been collected through a field survey. For the selection of the sample respondents, the
researcher approached the NGOs functioning under the MahalirThittam (Plan for Women), a Government
sponsored programme. Under MahalirThittam in Salem District, 24 NGOs have developed women self-
help groups in 20 blocks. The sample size of the study is 120 respondents. The researcher has used
stratified random sampling. The questionnaire has used to collect the data from respondents. The sample
area is MetturTaluk in Salem District, Tamil Nadu. The sample unit is the members of women self-help
groups in MetturTaluk in Salem District. The Discriminant Analysis has used to analysis the collected
data. Under the Discriminant Analysis, the following statistical tools were used to data analysis: Group
Statistics, Tests of Equality of Group Means, Box's Test of Equality of Covariance Matrices- Log
Determinants; Canonical Discriminant Functions - Eigenvalues, Wilks' Lambda, Standardized Canonical
Discriminant Function Coefficients, Structure Matrix, Functions at Group Centroids; Classification
Statistics - Prior Probabilities for Groups, Classification Function Coefficients, Classification
Results.

International Journal of Social Science & Interdisciplinary Research__________________________________ ISSN 2277 3630 IJSSIR, Vol. 2 (3), MARCH (2013) Online available at indianresearchjournals.com
4
6. DATA ANALYSIS AND INTERPRETATION
6.1 DISCRIMINANT ANALYSIS
Table No.1: Group Statistics
News
papers Mean
Std.
Deviation
Valid N (listwise)
Unweighted Weighted
Never Ability to mix with people freely 4.00 0.000 37 37
Ability to manage the family economically 4.00 0.000 37 37
Awareness about the transaction through banks 2.49 0.731 37 37
Ability to question others has improved 3.84 0.764 37 37
Ability to contribute to the development of the
neighbours 3.76 0.435 37 37
Ability to articulate for individual needs 3.62 0.492 37 37
Level of self-confidence is enhanced 3.76 0.435 37 37
Ability to earn has increased more from your activity 3.89 0.315 37 37
Family members sought your decision in all the family
matters 4.00 0.000 37 37
Ability to adopt any changes 3.51 0.507 37 37
Rarely Ability to mix with people freely 4.00 0.000 48 48
Ability to manage the family economically 4.00 0.000 48 48
Awareness about the transaction through banks 3.29 0.504 48 48
Ability to question others has improved 3.79 0.459 48 48
Ability to contribute to the development of the
neighbours 3.92 0.347 48 48
Ability to articulate for individual needs 3.92 0.347 48 48
Level of self-confidence is enhanced 4.00 0.000 48 48
Ability to earn has increased more from your activity 4.00 0.000 48 48
Family members sought your decision in all the family
matters 4.00 0.000 48 48
Ability to adopt any changes 4.19 0.394 48 48
Some
times
Ability to mix with people freely 3.43 0.502 35 35
Ability to manage the family economically 3.74 0.443 35 35
Awareness about the transaction through banks 4.09 0.919 35 35
Ability to question others has improved 3.89 0.323 35 35
Ability to contribute to the development of the
neighbours 4.00 0.000 35 35
Ability to articulate for individual needs 4.00 0.000 35 35
Level of self-confidence is enhanced 4.00 0.000 35 35
Ability to earn has increased more from your activity 4.29 0.458 35 35
Family members sought your decision in all the family
matters 4.00 0.000 35 35
Ability to adopt any changes 4.00 0.000 35 35
Total Ability to mix with people freely 3.83 0.374 120 120
Ability to manage the family economically 3.92 0.264 120 120
Awareness about the transaction through banks 3.28 0.943 120 120
Ability to question others has improved 3.83 0.540 120 120 Ability to contribute to the development of the neighbours 3.89 0.338 120 120
Ability to articulate for individual needs 3.85 0.381 120 120
Level of self-confidence is enhanced 3.92 0.264 120 120
Ability to earn has increased more from your activity 4.05 0.339 120 120
Family members sought your decision in all the family
matters 4.00 0.000 120 120
Ability to adopt any changes 3.92 0.470 120 120
International Journal of Social Science & Interdisciplinary Research__________________________________ ISSN 2277 3630 IJSSIR, Vol. 2 (3), MARCH (2013) Online available at indianresearchjournals.com
5
In discriminant analysis the researcher are trying to predict a group membership, so firstly he
examine whether there are any significant differences between groups on each of the
independent variables using group means and ANOVA results data. The Group Statistics and
Tests of Equality of Group Means tables provide this information. If there are no significant
groupdifferences it is not worthwhile proceeding any further with the analysis. A rough idea of
variables that may be important can be obtained by inspecting the group means and standard
deviations. For example, mean differences between self-concept scores and anxiety scores
depicted in Table No.1 suggest that these may be good discriminators as the separations are
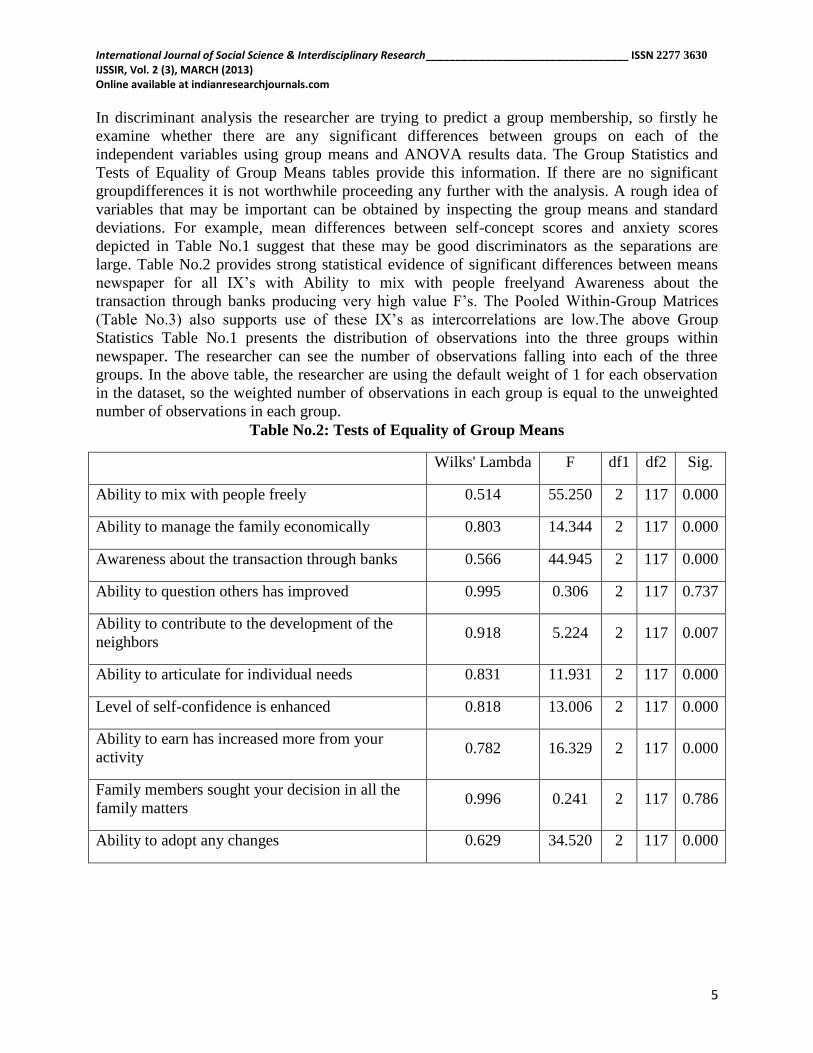
large. Table No.2 provides strong statistical evidence of significant differences between means
newspaper for all IX‟s with Ability to mix with people freelyand Awareness about the
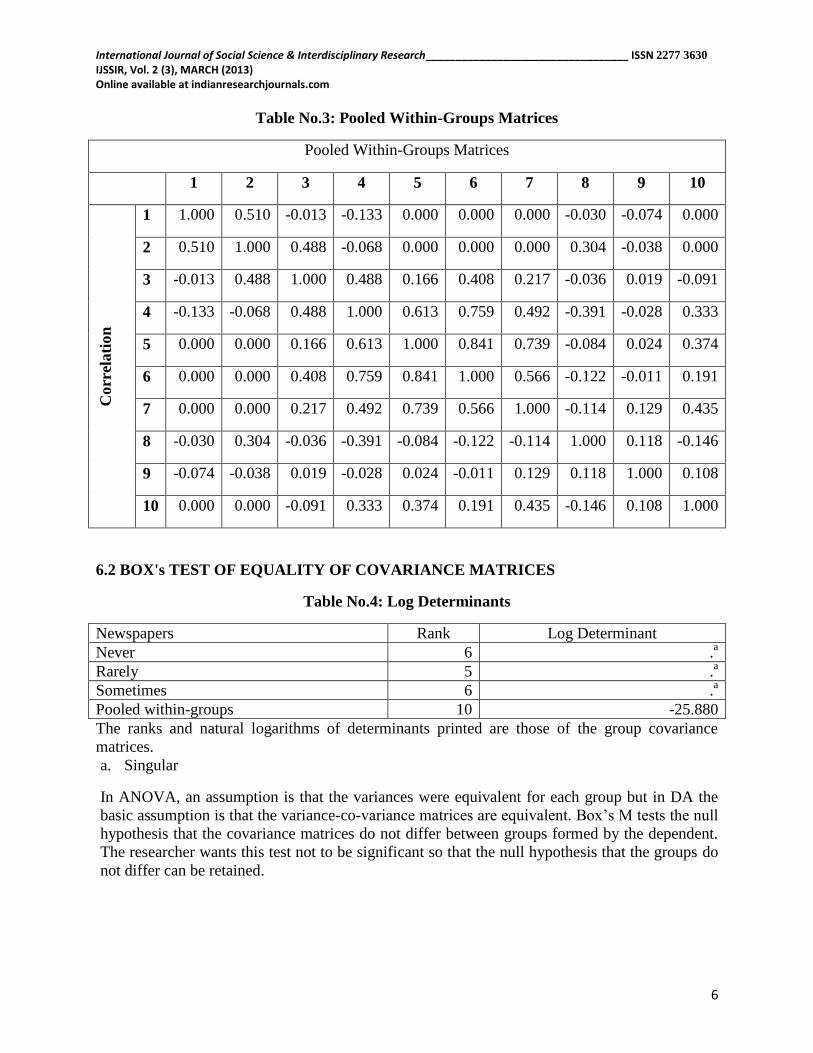
transaction through banks producing very high value F‟s. The Pooled Within-Group Matrices
(Table No.3) also supports use of these IX‟s as intercorrelations are low.The above Group
Statistics Table No.1 presents the distribution of observations into the three groups within
newspaper. The researcher can see the number of observations falling into each of the three
groups. In the above table, the researcher are using the default weight of 1 for each observation
in the dataset, so the weighted number of observations in each group is equal to the unweighted
number of observations in each group.
Table No.2: Tests of Equality of Group Means
Wilks' Lambda F df1 df2 Sig.
Ability to mix with people freely 0.514 55.250 2 117 0.000
Ability to manage the family economically 0.803 14.344 2 117 0.000
Awareness about the transaction through banks 0.566 44.945 2 117 0.000
Ability to question others has improved 0.995 0.306 2 117 0.737
Ability to contribute to the development of the
neighbors 0.918 5.224 2 117 0.007
Ability to articulate for individual needs 0.831 11.931 2 117 0.000
Level of self-confidence is enhanced 0.818 13.006 2 117 0.000
Ability to earn has increased more from your
activity 0.782 16.329 2 117 0.000
Family members sought your decision in all the
family matters 0.996 0.241 2 117 0.786
Ability to adopt any changes 0.629 34.520 2 117 0.000
International Journal of Social Science & Interdisciplinary Research__________________________________ ISSN 2277 3630 IJSSIR, Vol. 2 (3), MARCH (2013) Online available at indianresearchjournals.com
6
Table No.3: Pooled Within-Groups Matrices
Pooled Within-Groups Matrices
1 2 3 4 5 6 7 8 9 10
Corr
elati
on
1 1.000 0.510 -0.013 -0.133 0.000 0.000 0.000 -0.030 -0.074 0.000
2 0.510 1.000 0.488 -0.068 0.000 0.000 0.000 0.304 -0.038 0.000
3 -0.013 0.488 1.000 0.488 0.166 0.408 0.217 -0.036 0.019 -0.091
4 -0.133 -0.068 0.488 1.000 0.613 0.759 0.492 -0.391 -0.028 0.333
5 0.000 0.000 0.166 0.613 1.000 0.841 0.739 -0.084 0.024 0.374
6 0.000 0.000 0.408 0.759 0.841 1.000 0.566 -0.122 -0.011 0.191
7 0.000 0.000 0.217 0.492 0.739 0.566 1.000 -0.114 0.129 0.435
8 -0.030 0.304 -0.036 -0.391 -0.084 -0.122 -0.114 1.000 0.118 -0.146
9 -0.074 -0.038 0.019 -0.028 0.024 -0.011 0.129 0.118 1.000 0.108
10 0.000 0.000 -0.091 0.333 0.374 0.191 0.435 -0.146 0.108 1.000
6.2 BOX's TEST OF EQUALITY OF COVARIANCE MATRICES
Table No.4: Log Determinants
Newspapers Rank Log Determinant
Never 6 .a
Rarely 5 .a
Sometimes 6 .a
Pooled within-groups 10 -25.880
The ranks and natural logarithms of determinants printed are those of the group covariance
matrices.
a. Singular
In ANOVA, an assumption is that the variances were equivalent for each group but in DA the
basic assumption is that the variance-co-variance matrices are equivalent. Box‟s M tests the null
hypothesis that the covariance matrices do not differ between groups formed by the dependent.
The researcher wants this test not to be significant so that the null hypothesis that the groups do
not differ can be retained.

International Journal of Social Science & Interdisciplinary Research__________________________________ ISSN 2277 3630 IJSSIR, Vol. 2 (3), MARCH (2013) Online available at indianresearchjournals.com
7
6.3 SUMMARY OF CANONICAL DISCRIMINANT FUNCTIONS
Table No.5: Eigenvalues
Function Eigenvalue % of Variance Cumulative % Canonical Correlation
1 5.332a 83.7 83.7 0.918
2 1.042a 16.3 100.0 0.714
a. First 2 canonical discriminant functions were used in the analysis.
This provides information on each of the discriminate functions (equations) produced. The
maximum number of discriminant functions produced is the number of groups minus 1. The
researcher is only used three groups here, namely „Never‟, „Rarely‟, and „Sometimes‟, so only
four functions are displayed. The canonical correlation is the multiple correlations between the
predictors and the discriminant function. With only three functions it provides an index of
overall model fit which is interpreted as being the proportion of variance explained (R2).
In above table (Table No.5) this is the proportion of discriminating ability of the three continuous
variables found in a given function. This proportion is calculated as the proportion of the
function's eigenvalue to the sum of all the eigenvalues. A canonical correlation of 0.918 of
Function 1 suggests that the model explains 83.7% of the variation in the grouping variable, i.e.
whether a respondent feel never or rarely. A canonical correlation of 0.714 of Function 2
suggests that the model explains 16.3% of the variation in the grouping variable, i.e. whether a
respondent feel never or sometimes. The researcher can verify this by noting that the sum of the
eigenvalues is 5.332+1.042 = 6.374. Then (5.332/6.374) = 0.8365 i.e. 83.65% and (1.042/6.374)
= 0.1635 i.e. 16.35%.
Table No.6: Wilks' Lambda
Test of Function(s) Wilks' Lambda Chi-square df Sig.
1 through 2 0.077 287.945 20 0.000
2 0.490 80.320 9 0.000
Wilks‟ lambda indicates the significance of the discriminant function. This table (Table No.6)
indicates a highly significant function (p < .000) and provides the proportion of total variability
not explained, i.e. it is the converse of the squared canonical correlation. The test of function 1
through 2 is 7.7% and test of function 2 is 49% unexplained. The null hypothesis that a given
function's canonical correlation and all smaller canonical correlations are equal to zero is
evaluated with regard to this p-value. For a given alpha level, such as 0.05, if the p-value is less
than alpha, the null hypothesis is rejected. If not, then the researcher fail to reject the null
hypothesis.

International Journal of Social Science & Interdisciplinary Research__________________________________ ISSN 2277 3630 IJSSIR, Vol. 2 (3), MARCH (2013) Online available at indianresearchjournals.com
8
Table No.7: Standardized Canonical Discriminant Function Coefficients
Function
1 2
Ability to mix with people freely 0.107 0.262
Ability to manage the family economically -1.132 0.397
Awareness about the transaction through banks 1.486 -0.339
Ability to question others has improved -1.159 -0.796
Ability to contribute to the development of the neighbours 0.295 -1.371
Ability to articulate for individual needs 0.207 1.565
Level of self-confidence is enhanced -0.177 0.451
Ability to earn has increased more from your activity 0.322 -0.395
Family members sought your decision in all the family matters -0.169 -0.012
Ability to adopt any changes 0.760 0.701
The interpretation of the discriminant coefficients (or weights) is like that in multiple
regressions. Table No.7 provides an index of the importance of each predictor like the
standardized regression coefficients (beta‟s) did in multiple regression. The sign indicates the
direction of the relationship.
In the function 1, Ability to earn has increased more from your activity (0.322) was the strongest
predictor while Family members sought your decision in all the family matters and security score
(-0.169) was next in importance as a predictor. These two variables with large coefficients stand
out as those that never to or sometimes group. Other predictor scores were less successful as
predictors.
In the function 2, Ability to articulate for individual needs score (1.565) was the strongest
predictor while low Ability to contribute to the development of the neighboursscore (-1.371) was
next in importance as a predictor. These two variables with large coefficients stand out as those
that strongly predict allocation to never or sometimes group. Other predictor scores were less
successful as predictors.

International Journal of Social Science & Interdisciplinary Research__________________________________ ISSN 2277 3630 IJSSIR, Vol. 2 (3), MARCH (2013) Online available at indianresearchjournals.com
9
Table No.8: Structure Matrix
Function
1 2
Ability to mix with people freely 0.378* -0.078
Ability to manage the family economically 0.213* -0.190
Awareness about the transaction through banks 0.190* 0.106
Ability to question others has improved 0.129* 0.029
Ability to contribute to the development of the neighbours 0.028* 0.007
Ability to articulate for individual needs -0.331 0.587*
Level of self-confidence is enhanced 0.246 0.505*
Ability to earn has increased more from your activity -0.169 0.299*
Family members sought your decision in all the family matters 0.183 0.206*
Ability to adopt any changes 0.012 -0.066*
Pooled within-groups correlations between discriminating variables and standardized canonical
discriminant functions.
Variables ordered by absolute size of correlation within function.
*. Largest absolute correlation between each variable and any discriminant function
Table No.8 provides another way of indicating the relative importance of the predictors and it
can be seen below that the same pattern holds. Many researchers use the structure matrix
correlations because they are considered more accurate than the Standardized Canonical
Discriminant Function Coefficients. The structure matrix table (Table No.8) shows the
correlations of each variable with each discriminate function. These Pearson coefficients are
structure coefficients or discriminant loadings. They serve like factor loadings in factor analysis.
By identifying the largest loadings for each discriminate function the researcher gains insight
into how to name each function. Ability to articulate for individual needs (low scores) in the
function 1; Ability to manage the family economically(low scores) in the function 2 which
suggest a label of personal confidence and effectiveness as the function that discriminates
between never and sometimes. Generally, just like factor loadings, 0.30 is seen as the cut-off
between important and less important variables. Absence is clearly not loaded on the
discriminant function, i.e. is the weakest predictor and suggests that newspaper is not associated
with social impact of self-help groups but a function of other unassessed factors.

International Journal of Social Science & Interdisciplinary Research__________________________________ ISSN 2277 3630 IJSSIR, Vol. 2 (3), MARCH (2013) Online available at indianresearchjournals.com
10
Table No.9: Functions at Group Centroids
A further way of interpreting discriminant analysis results is to describe each group in terms of
its profile, using the group means of the predictor variables. These group means are called
centroids. These are displayed in the Group Centroids table (Table No.9). Cases with scores near
to a centroid are predicted as belonging to that group.
6.4 CLASSIFICATION STATISTICS
Table No.10: Prior Probabilities for Groups
Newspapers Prior Cases Used in Analysis
Unweighted Weighted
Never 0.308 37 37
Rarely 0.400 48 48
Sometimes 0.292 35 35
Total 1.000 120 120
Prior Probabilities for Groups is the distribution of observations into the newspapers with other
groups used as a starting point in the analysis. The default prior distribution is an equal allocation
into the groups. SPSS allows researcher to specify different priors with the priors subcommand.
Table No.11: Classification Function Coefficients
Newspapers
Never Rarely Sometimes
Ability to mix with people freely 27.959 31.136 29.989
Ability to manage the family economically 86.703 73.897 58.510
Awareness about the transaction through banks -30.863 -24.762 -18.569
Ability to question others has improved 37.284 27.298 25.222
Ability to contribute to the development of the neighbours -64.632 -69.567 -58.106
Ability to articulate for individual needs 35.192 45.675 37.334
Level of self-confidence is enhanced 84.668 85.753 79.835
Ability to earn has increased more from your activity 49.545 50.649 56.151
Family members sought your decision in all the family
matters 13.573 12.357 11.549
Ability to adopt any changes -3.424 6.933 7.852
(Constant) -481.661 -486.712 -450.129
Fisher's linear discriminant functions
Figure No.1: Territorial Map
Newspapers Function
1 2
Never -3.055 -0.674
Rarely 0.316 1.227
Sometimes 2.796 -0.969

International Journal of Social Science & Interdisciplinary Research__________________________________ ISSN 2277 3630 IJSSIR, Vol. 2 (3), MARCH (2013) Online available at indianresearchjournals.com
11
Table No.12: Symbols used in Territorial Map
Symbol Group Label
1 1 Never
2 2 Rarely
3 3 Sometimes
* Indicates a group centroid
Separate-Groups Graphs
Figure No.2: Canonical Discriminant Functions – Newspaper - Never

International Journal of Social Science & Interdisciplinary Research__________________________________ ISSN 2277 3630 IJSSIR, Vol. 2 (3), MARCH (2013) Online available at indianresearchjournals.com
12
Figure No.3: Canonical Discriminant Functions – Newspaper - Rarely
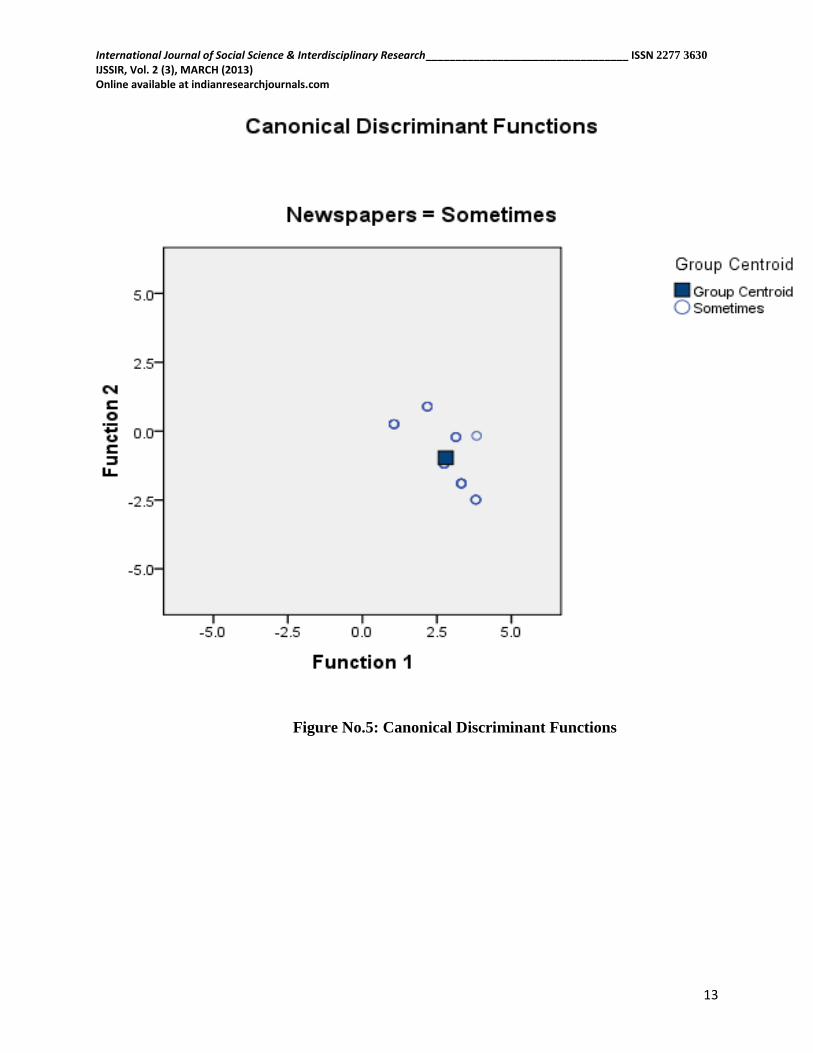
Figure No.4: Canonical Discriminant Functions – Newspaper - Sometimes
International Journal of Social Science & Interdisciplinary Research__________________________________ ISSN 2277 3630 IJSSIR, Vol. 2 (3), MARCH (2013) Online available at indianresearchjournals.com
13
Figure No.5: Canonical Discriminant Functions

International Journal of Social Science & Interdisciplinary Research__________________________________ ISSN 2277 3630 IJSSIR, Vol. 2 (3), MARCH (2013) Online available at indianresearchjournals.com
14
Table No.13: Classification Resultsb,c
Newspapers
Predicted Group Membership
Total Never Rarely Sometimes
Ori
gin
al
Count
Never 31 6 0 37
Rarely 1 47 0 48
Sometimes 0 10 25 35
%
Never 83.8 16.2 0 100
Rarely 2.1 97.9 0 100
Sometimes 0 28.6 71.4 100
Cro
ss-v
alid
ated
a
Count
Never 31 6 0 37
Rarely 1 47 0 48
Sometimes 0 10 25 35
%
Never 83.8 16.2 0 100
Rarely 2.1 97.9 0 100
Sometimes 0 28.6 71.4 100

International Journal of Social Science & Interdisciplinary Research__________________________________ ISSN 2277 3630 IJSSIR, Vol. 2 (3), MARCH (2013) Online available at indianresearchjournals.com
15
a. Cross validation is done only for those cases in the analysis. In cross validation, each case is
classified by the functions derived from all cases other than that case.
b. 85.8% of original grouped cases correctly classified.
c. 85.8% of cross-validated grouped cases correctly classified.
The classification results (Table No.13)reveal that 73.9% of respondents were classified
correctly into „Never‟ or „Rarely‟ or „Sometimes‟ groups. This overall predictive accuracy of the
discriminant function is called the „hit ratio‟. Rarely groups were classified with slightly better
accuracy (97.9%) than Never (83.8%), Sometimes (71.4). The researcher must compare the
calculated hit ratio with what he could achieve by chance. If two samples are equal in size then
you have a 50/50 chance anyway. Most researchers would accept a hit ratio that is 25% larger
than that due to chance.
7. FINDINGS
A canonical correlation of 0.918 of Function 1 suggests that the model explains 83.7% of the
variation in the grouping variable, i.e. whether a respondent feel never or rarely. A canonical
correlation of 0.714 of Function 2 suggests that the model explains 16.3% of the variation in the
grouping variable, i.e. whether a respondent feel never or sometimes.Ability to earn has
increased more from your activity (0.322) was the strongest predictor while Family members
sought your decision in all the family matters and security score (-0.169) was next in importance
as a predictor. Ability to articulate for individual needs score (1.565) was the strongest predictor
while low Ability to contribute to the development of the neighbours score (-1.371) was next in
importance as a predictor.Ability to articulate for individual needs (low scores) in the function 1;
Ability to manage the family economically (low scores) in the function 2 which suggest a label
of personal confidence and effectiveness as the function that discriminates between never and
sometimes.Rarely groups were classified with slightly better accuracy (97.9%) than Never
(83.8%), Sometimes (71.4).
8. SUGGESTIONS
Women SHGs are doing different kinds of small business for earning money to improve their
social status. So the government provide various financial schemes to improve their earning
capacity as well as their social status. They are facing lot of problems in the society in the
aspects of to fulfill their individual needs, family financial commitments and low personal
confidence, so to solve women SHG‟s problems that the government should facilitate new
motivational training programmes for motivating and getting good status in the society.
9. CONCLUSION
The critical issue that was researched into is the extent and ways to which the SHGs have
empowered women who are members i.e. how far the SHGs have helped in raising the incomes
and levels of their living to enable them to cross the poverty line. In short, the study would be
highly useful to researchers, planners and policy makers in overcoming the problems of women
and in formulating strategies for the social development and empowerment women through
SHGs in Tamil Nadu in general and particularly in MetturTaluk in Salem District.
International Journal of Social Science & Interdisciplinary Research__________________________________ ISSN 2277 3630 IJSSIR, Vol. 2 (3), MARCH (2013) Online available at indianresearchjournals.com
16
REFERENCES
MoinQasi (1997), “Self-Help Groups – A Novel Approach to Rural Development”, State
Bank of India, Monthly Review, September, pp.463-465.
NilanjanSengupta (1998), “Empowerment: A Socio-Psychological Approach to Self-Help
Group Formation”, Prajnan, Journal of Social and Management Sciences, Vol.XXVI, No.4,
January-March, pp.523-533.
K.R. Lakshmikandan (2000), “Self-Help Groups in the life of Rural Poor – A Philibhit Case
Study”, Women‟s Link, April – June, pp. 9-14.
N. Manimekalai and G. Rajeswari (2000), “Empowerment of Women through Self-help
Groups”, MARGIN, Vol.32, No.4, July-September, pp.74-7.
A.Suriakanthi (2000), “Literacy-Essential for SHGs”, Social Welfare, Vol.47, No.5,
September, pp.32-34.
*****