a study on the performance of initial public offering...
TRANSCRIPT

International Journal of Research in Finance and Marketing (IJRFM) Available online at : http://euroasiapub.org/current.php?title=IJRFM Vol. 6 Issue 11, November - 2016, pp. 31~46 ISSN(o): 2231-5985 | Impact Factor: 5.861 | Thomson Reuters ID: L-5236-2015
International Journal of Research in Finance & Marketing
Email:- [email protected], http://www.euroasiapub.org
An open access scholarly, peer-reviewed, interdisciplinary, monthly, and fully refereed journal
31
A STUDY ON THE PERFORMANCE OF INITIAL PUBLIC OFFERING OF COMPANIES LISTED IN NSE, INDIA & Gulf Base GCC Index.
Dr.S.Poornima1
Head & Associate Professor, Department of Business Administration,
PSGR Krishnammal College for Women, Coimbatore, India.
Aalaa J.Haji2,
Research Scholar, University of Bahrain, Bahrain.
Deepha.B3
Research Scholar-PhD,
Department of Business Administration, PSGR Krishnammal College for Women, Coimbatore, India.
Abstract:
Initial public offerings are gaining importance worldwide as an important source of funds for the companies to accelerate their growth by using the mobilised funds to implement innovative strategies as well as considered as an important tool for investment since it offers huge profits on the listing day. In this study the short run performance of the companies is analysed to understand the anomaly of abnormal returns as well long term performance to analyse the performance of the IPO’s in the long run. The period of study is from Jan 2013 – Dec 2014. The sample for the study includes 9 companies listed in National Stock Exchange of India pertaining to the study period. The results of this study will throw light on the performance of the IPO’s which are majorly considered as a speculative tool and hence aid in better decision making for the investors. The findings will also help conclude if IPO can be a long term investment tool or a speculative opportunity to earn booming profits.
Keywords: “Initial Public offering, Short term returns, long term returns, abnormal returns”.

International Journal of Research in Finance and Marketing (IJRFM)
Vol. 6 Issue 11, November - 2016
ISSN(o): 2231-5985 | Impact Factor: 5.861 |
International Journal of Research in Finance & Marketing
Email:- [email protected], http://www.euroasiapub.org
An open access scholarly, peer-reviewed, interdisciplinary, monthly, and fully refereed journal
32
Need for the study:
IPO’s are often looked upon as a speculative opportunity to earn abnormal profits on
the listing day. Companies which decide to go public face the added pressure of the market which may cause them to focus more on short-term results rather than long-term growth. The actions of the company's management also become increasingly scrutinized as investors constantly look for rising profits. This may lead management to perform somewhat questionable practices in order to boost earnings.
Before deciding whether or not to go public, companies must evaluate all of the
potential advantages and disadvantages that will arise and fix prices that are in the best interest of the company and investors. This study helps the investor to decide the suitable investment strategy to get maximized returns.
Objectives of the Study:
The main objective of the study was to evaluate the performance of IPOs in India. Keeping the above in consideration, the present study has been conducted with the following objectives
1. To find out the performance of Indian IPOs for short period, i.e. from the date of offer to the public to the date of their first day of trading after listing on stock exchange.
2. To measure the long term performance of Indian IPOs including and excluding initial returns.
3. To analyse whether the returns are more in short term or long term for better conclusion
Introduction:
A financial system is a system that allows the exchange of funds between lenders, investors
and borrowers. It promotes savings and investment in the economy and enlarges the resources flowing into the financial assets which are more productive than the physical assets. A financial market is a market in which people trade financial securities, commodities and other fungible items of value at low transaction costs and at prices that reflective supply and demand. Financial market has significant role to play in this context because it is a part of the financial system. It provides the financial resources needed for the long term and sustainable development of different sectors of the economy.
Investors have access to a large number of financial markets and exchanges representing a
vast array of financial products. Some of these markets have always been open to private investors; others remind the exclusive domain of major international banks and financial professional until the very end of the twentieth century. Financial market is divided into money market and capital market.
Primary market facilitate securities to the investors and assist the corporate sector in arranging funds in the form of public issue, offer for sale, private placement and right issue. Public issue can be further classified into initial public offer (IPOs) and further public offer (FPO). An initial public offering (IPO) is a company’s first offering of equity to the public. IPO is a major source of capital for firms.
IPO’s are important milestone in any company’s growth as it progresses from being a start- up/private limited company to public limited. Successful IPO can generate tremendous amount of wealth for company promoters as well as pre IPO investors. Historically a majority of

International Journal of Research in Finance and Marketing (IJRFM)
Vol. 6 Issue 11, November - 2016
ISSN(o): 2231-5985 | Impact Factor: 5.861 |
International Journal of Research in Finance & Marketing
Email:- [email protected], http://www.euroasiapub.org
An open access scholarly, peer-reviewed, interdisciplinary, monthly, and fully refereed journal
33
the IPO’s were under-priced with an aim to issue abnormal profits on the listing thus attracting more investors to subscribe to their stocks. Empirical studies have established the above in efficient markets.
Numerous research papers have studied the anomaly of underpricing and abnormal
returns yet they are insufficient to demystify the above. Hence this study will analyse the short term and the long term performance of the Initial Public Offerings and help the investors take an informed decision while investing for the same.
Literature Review:
Batool K. Asiri and Aalaa J. Haji (2014) documented the phenomenon of underpricing initial public offerings(IPOs) for 194 firms that went public between 2000 and 2013 in the markets of the six gulf cooperation council (GCC) countries. It investigates factors that potentially influence abnormal returns on the first day trading and focuses on assessing the most prominent determinants of the underpricing of IPOs in the GCC region. In addition to previously tested variables such as firm age and offer size, additional variables and external factors such as seasonal affective disorder have been added. The empirical findings had shown that firm age and offer size are clearly significant and both negatively related to underpricing and shows that a relationship does exist between financial and non-financial firms, and there are significant differences between banking versus insurance firms. In addition, the difference between the month of Ramadan and the month IPO was carried out appeared to be significant. The models carried out involving the financial crisis period almost all appeared to be significant.
Nurwati A. Ahmad-Zaluki 1and Lim Boon Kect (2012)provided evidence on both the short-run and long-run investment performance of Malaysian initial public offering (IPO) companies that are listed on the Mesdaq market. The factors that influence the performance are also investigated. In line with past Malaysian studies, the results of the raw and market-adjusted initial returns show that IPO companies are significantly underpriced in the short-run. However, in the long-run, both the car and the BHAR methods reveal that these companies underperform the market. Their results are concerning the long-run performance contrast with the results observed by previous Malaysian studies using a sample of companies listed on the main board and/or the second board. However, they are consistent with the results reported in other countries. They found that companies in the technology sector, issued in a hot issue period and underpriced IPO, perform less well in the long-run, which supports the fad hypothesis of long-run underperformance. Their results suggest that investors who purchase IPO shares on the Mesdaq market gain high positive returns in the short-run but do not fare well in the long-run. This study provides new information to investors when choosing IPOs listed on bursa Malaysia.
Deb and Marisitty (2011) examined the IPO grading was an assessment of the quality of initial equity offers. India is the only market in the world that introduced such grading process. They tested the efficiency of this unique certification mechanism with the data of 159 Indian IPOs. They found that IPOs grading decreased IPO underpricing and influenced demand of retail investors. Post listing, highly graded IPOs attract greater liquidity and exhibit lower risk. IPO grading successfully capture firm size, business group affiliation and firm’s quality of corporate governance. Their findings implied that in emerging markets regulator’s role to signal the quality of an IPO contributes towards the market welfare.
Gupta and Samdani (2010) proposed a weighted sentiment-index to measure investors’ representativeness bias in bookbuilding vs. fixed price Initial Public Offerings (IPOs). Sample data (1995 to 2007) span three regimes of fixed price method and book building method IPO

International Journal of Research in Finance and Marketing (IJRFM)
Vol. 6 Issue 11, November - 2016
ISSN(o): 2231-5985 | Impact Factor: 5.861 |
International Journal of Research in Finance & Marketing
Email:- [email protected], http://www.euroasiapub.org
An open access scholarly, peer-reviewed, interdisciplinary, monthly, and fully refereed journal
34
pricing mechanisms in India. Consistent with behavioural IPO literature, the results showed that sentiment was driven by IPO cycles. However, contrary to popular perception, sentiment was not driven by IPO pricing mechanism.
Dimovski (2009) analysed 45 property trust Initial Public Offerings (IPOs) in Australia from January
2002 to June 2008. It found that this sample of property trust IPOs had a significant 3.37% underpricing and that the direct costs of capital raising help explain this indirect cost of underpricing. There was some evidence also to suggest that property trust IPOs that seek to raise more equity capital have less underpricing while those that were subscribed to more quickly have higher underpricing. The findings offer insights for issuers who seek to maximize the value of the trust at the time of the IPO, underwriters who guarantee the success of the capital rising and for investors who are looking to invest in Australian property trust IPOsunderpricing, while those that were subscribed to more quickly have higher underpricing. The findings offer insights for issuers who seek to maximize the value of the trust at the time of the IPO, underwriters who guarantee the success of the capital raising and for investors who are looking to invest in Australian property trust IPOs. Singh and Sehgal (2008) investigated the possible determinants of underpricing and the long-run performance of 438 Indian initial public offerings (IPOs) listed on the Bombay Stock Exchange during June 1992--March 2001. In this paper mean underpricing has been found to be 99.20 per cent, which was very high if compared with the international evidence. Age of the firm, listing delay at IPO and number of times the issue were subscribed have been found to be the important determinants of underpricing. Indian IPOs do not tend to underperform in the long-run and underpricing has been primarily found to explain the long-run performance.
Alok Pande and R. Vaidyanathan(2007), looks at the pricing of IPOs in the NSE. In particular, it seeks to empirically explain the first day underpricing in terms of the demand generated during the book building of the issue, the listing delay between the closure of the book building and the first day listing of the issue and the money spent on the marketing of the IPO by the firms. It also seeks to understand any emerging patterns in Indian IPO market with reference to the previous studies. Moreover it seeks to find the post IPO returns for one month in the NSE. The results suggested that the demand generated for an issue during book building and the listing delay positively impact the first day underpricing whereas the effect of money spent on the marketing of the IPO is insignificant. They also found that in consonance with extant literature, the post IPO performance in one month after the listing for the firms under study is negative.
Ray Ball and Lakshmanan Shivakumar(2006) hypothesize that IPO firms supply the higher quality financial reports demanded by public investors, who face higher information asymmetry than private investors. Once public, firms are subject to greater regulatory scrutiny and penalties. From the point of releasing the public prospectus document onwards, IPO firms face a greater threat of shareholder litigation and regulatory action if they do not meet higher reporting standards. The evidence is overwhelmingly in favour of this hypothesis. They show that the evidence reported by Teoh, Welch and Wong (1998) in support of the alternative hypothesis, that IPO firms opportunistically inflate earnings to influence the IPO price, is unreliable for a variety of reasons. They conjecture that the types of bias we observe in conventional estimates of “discretionary” accruals occur in a broad genre of studies on earnings management around large transactions and events.

International Journal of Research in Finance and Marketing (IJRFM)
Vol. 6 Issue 11, November - 2016
ISSN(o): 2231-5985 | Impact Factor: 5.861 |
International Journal of Research in Finance & Marketing
Email:- [email protected], http://www.euroasiapub.org
An open access scholarly, peer-reviewed, interdisciplinary, monthly, and fully refereed journal
35
Mayur and Kumar (2006) examined the determinants of the going public decision of the Indian companies. A probity regression model was used to analyse the influence of fundamental financial data of Indian companies on their going public decision. The size, profitability, age and leverage emerged as the significant determinants of going public decision of Indian companies. The statistically insignificant relationship between the financing needs and likelihood of an IPO was found in the study.Ranjan and Madhusoodanan (2004) studied 92 IPOs issued during 1999 and 2003.They studied the impact of book-building mechanism on IPO pricing and found lesser amount of underpricing in book- built issues than fixed-price issues. They also documented less underpricing for larger issues and more underpricing for smaller issues.
Madan (2003) examined the relationship between return on listing and issue price, issue size, age of firm, issue capital listing and was found negative. The relationship was found to be statistically significant. However, relationship between return on listing and foreign equity, issue rating was found to be positive. This study also confirmed that in the long run (five year after listing), there was drastic fall in the return on IPOs returns and returns were found to be negative from the second to the fifth year of listing.
Kojo Menyahand Krishna Paudyal (2002) analysed how the major decisions made by issuers affect the costs of an initial public offer. The results show that using reputed underwriters to raise a large amount of money with a low sterling price per share and a large placing component reduces direct issue costs. Issues that use reputed underwriters to raise a large amount of money by selling a high proportion of equity have higher indirect issue costs. In general, total issue costs increase in the proportion of shares sold but decrease with the quality of the sponsor, the amount raised, the price per share and the use of a placing.
Raghuram Rajan and Henri Servaes (2002) developed a simple model in this paper in which two market conditions change over time: (i) investor sentiment or price-insensitive demand; and (ii) feedback trader risk or the propensity of investors to chase trends. The model shows that these conditions partially explain the three anomalies associated with the IPO market: (i) underpricing; (ii) windows of opportunity for new issues and (iii) long-term underperformance. The model is tested using a sample of firm commitment IPOs over the 1975-1987 period. The paper finds that the predictions of the model are largely borne out in the data.
Cornelli and Goldreich (2001) investigated that in the bookbuilding procedure; an investment banker solicits bids for shares from institutional investors prior to pricing an equity issue. The banker then priced the issue and allocated shares at his discretion to the investors. They examined the books for 39 international equity issues. They found that the investment banker awarded more shares to bidders who provide information in their bids. Regular investors received favourable allocations, especially when the issue was heavily oversubscribed. The investment banker also favoured revised bids and domestic investors.

International Journal of Research in Finance and Marketing (IJRFM)
Vol. 6 Issue 11, November - 2016
ISSN(o): 2231-5985 | Impact Factor: 5.861 |
International Journal of Research in Finance & Marketing
Email:- [email protected], http://www.euroasiapub.org
An open access scholarly, peer-reviewed, interdisciplinary, monthly, and fully refereed journal
36
Khurshed, Mudambi and Goergen (1999) found that long-run performance of IPOs was a function of pre-IPO factors, including managerial decisions and the firm’s performance prior to going public. They related long-run performance to a much richer set of explanatory factors than in the previous literature. Using a number of variables, they provided empirical evidence in support of this proposition. The manner in which a company is run before it is listed on the stock exchange gives a strong signal of how its shares will perform in its first few years of coming to the market. Using a UK data set, they found that the percentage of equity issued and the degree of multi-nationality were key predictors of IPO performance.
Narasimhan and Ramana (1995) focussed on the determination of the short-run returns of IPOs listed on the BSE. The analysis was carried out in two different time periods; phase-1, in which market index was on the rise and phase-II, when the index was on the decline. The study observed homogeneity in the degree of underpricing across time period. It further observed that the extent to which premium issues were underpriced was greater than in the case of par issues
Lee, Taylor and Walter (1994) analysed both initial underpricing and post listing returns of 266 Australian IPOs during the period of 1976-1989. The results showed that the Australian IPOs significantly over performed the market initially by 11.8 per cent, but underperformed market movements in the three years period subsequent to listing by (-)51 per cent. They also suggested a curvilinear relationship between initial returns and subsequent returns.
Loughran (1993) examined the returns from 3,556 IPOs during 1967-1987 and found an average six year total return of 17.29 per cent compared with 76.23 per cent for the NASDAQ index during an identical period. Strong underperformance was also found in comparison with the firms of similar size on both the New York Stock Exchange and on NASDAQ.
Keasey and Short (1992) investigated the level of underpricing of IPOs in the UK, during 1984-1988. The level of underpricing of IPOs was 14 per cent. Aggarwal, Leal and Hernandez (1993) examined the performance of IPOs in both the short run and the long run based on sample of 62 Brazilian IPOs during from 1980 to 1990, 36 Chilean IPOs from 1982 to 1990 and 44 Mexican IPOs from 1987 to 1990. Results indicated that initial one-day returns were found to be 78.5 per cent, 16.3 per cent and 2.8 per cent for Brazil, Chile and Mexico respectively. Levis (1993) reported average first day return of 14.3 per cent for 712 UK IPOs during the period of 1980-88. Research Methodology:
The short term returns are calculated for the listing day using the traditional method of calculating returns , i.e. The difference between the closing price on the first day of trading and offer price and divided by the offer price. The result figure was multiple by 100 to set the figure in percentage. To measure the raw return of IPOs, whether an investor gained or lost by buying the share during the IPO on offer date and selling at the prevailing price on the opening day the following formula has been used
Ri = p1-p0 * 100 …………..(1)
p0
Where

International Journal of Research in Finance and Marketing (IJRFM)
Vol. 6 Issue 11, November - 2016
ISSN(o): 2231-5985 | Impact Factor: 5.861 |
International Journal of Research in Finance & Marketing
Email:- [email protected], http://www.euroasiapub.org
An open access scholarly, peer-reviewed, interdisciplinary, monthly, and fully refereed journal
37
Ri = subscribers initial return (hereafter raw return) P1 = closing price on the first day of trading P0 = offer price
If Ri is more than zero, one can interpret that short term returns were positive and the issues were under-priced, if Ri is less than zero, one can interpret that short term returns were negative and the issues were overpriced, and if Ri was zero, it means there were no returns
Market adjusted excess returns (MAERs):
The returns measured by eq. (i) would be valid in a perfect market, where
there is no time gap between the application closing date and first day of trading but in India this time gap is quite long. During this period, a major change could occur in market conditions. As there was a lag between offer date and listing date, the price observed in the market on the listing day may be different from the offer price as a result of the overall market movements, the researcher also computed market adjusted returns of the IPOs for the same period. Therefore, the initial return estimated by eq. (i) is adjusted for market return as under;
MAER= p1-p0 – m1-m0 * 100 p0 m0
Where
P1 = closing price on the first day of trading
P0 = offer price
M1 = market index on the first day of trading
M0 = market index on the offer date
MAERit = market adjusted excess return
Annualizing factor
Since for different companies, the time taken to list varies so in order to normalize it annualized return has been taken into consideration. Annualized return has been calculated by multiplying raw return and MAER with annualizing factor. Annualizing factor has been computed as under :
365 Annualizing factor = ----------------------------------------------
After market trading lead time
International Journal of Research in Finance and Marketing (IJRFM)
Vol. 6 Issue 11, November - 2016
ISSN(o): 2231-5985 | Impact Factor: 5.861 |
International Journal of Research in Finance & Marketing
Email:- [email protected], http://www.euroasiapub.org
An open access scholarly, peer-reviewed, interdisciplinary, monthly, and fully refereed journal
38
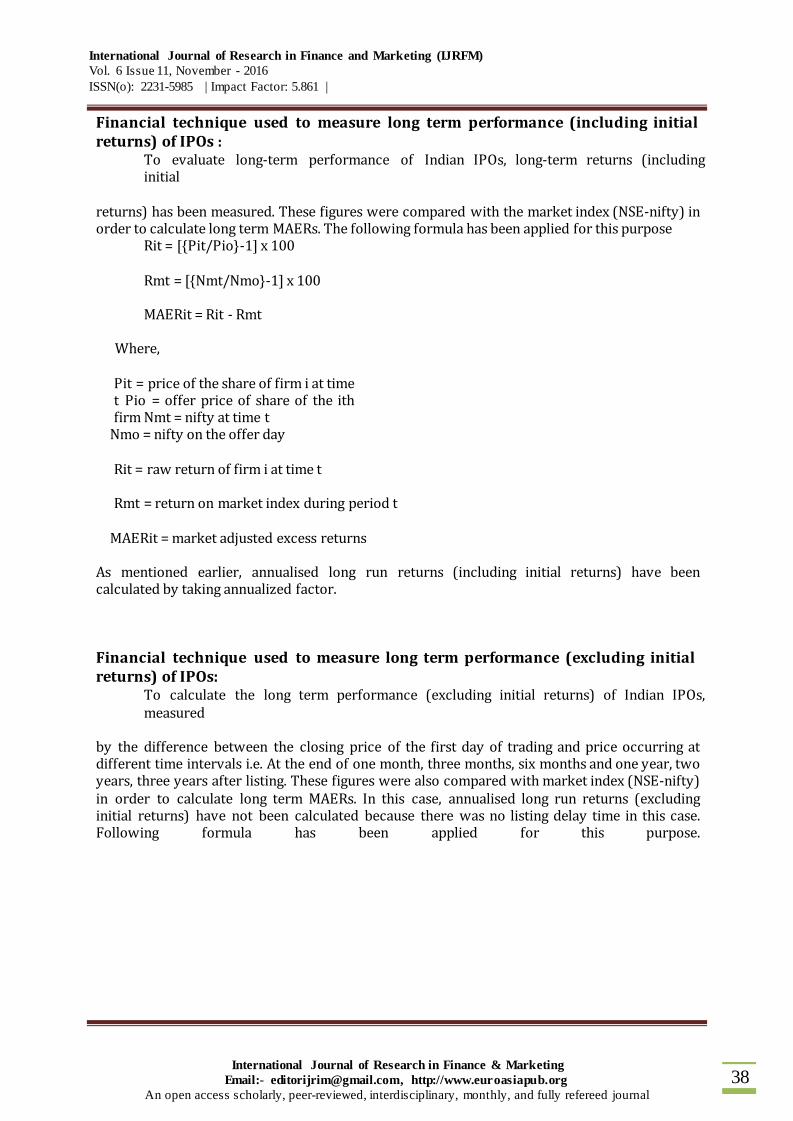
Financial technique used to measure long term performance (including initial returns) of IPOs :
To evaluate long-term performance of Indian IPOs, long-term returns (including initial
returns) has been measured. These figures were compared with the market index (NSE-nifty) in order to calculate long term MAERs. The following formula has been applied for this purpose
Rit = [{Pit/Pio}-1] x 100
Rmt = [{Nmt/Nmo}-1] x 100
MAERit = Rit - Rmt
Where,
Pit = price of the share of firm i at time t Pio = offer price of share of the ith firm Nmt = nifty at time t
Nmo = nifty on the offer day
Rit = raw return of firm i at time t
Rmt = return on market index during period t
MAERit = market adjusted excess returns
As mentioned earlier, annualised long run returns (including initial returns) have been calculated by taking annualized factor.
Financial technique used to measure long term performance (excluding initial returns) of IPOs:
To calculate the long term performance (excluding initial returns) of Indian IPOs, measured
by the difference between the closing price of the first day of trading and price occurring at different time intervals i.e. At the end of one month, three months, six months and one year, two years, three years after listing. These figures were also compared with market index (NSE-nifty) in order to calculate long term MAERs. In this case, annualised long run returns (excluding initial returns) have not been calculated because there was no listing delay time in this case. Following formula has been applied for this purpose.
International Journal of Research in Finance and Marketing (IJRFM)
Vol. 6 Issue 11, November - 2016
ISSN(o): 2231-5985 | Impact Factor: 5.861 |
International Journal of Research in Finance & Marketing
Email:- [email protected], http://www.euroasiapub.org
An open access scholarly, peer-reviewed, interdisciplinary, monthly, and fully refereed journal
39
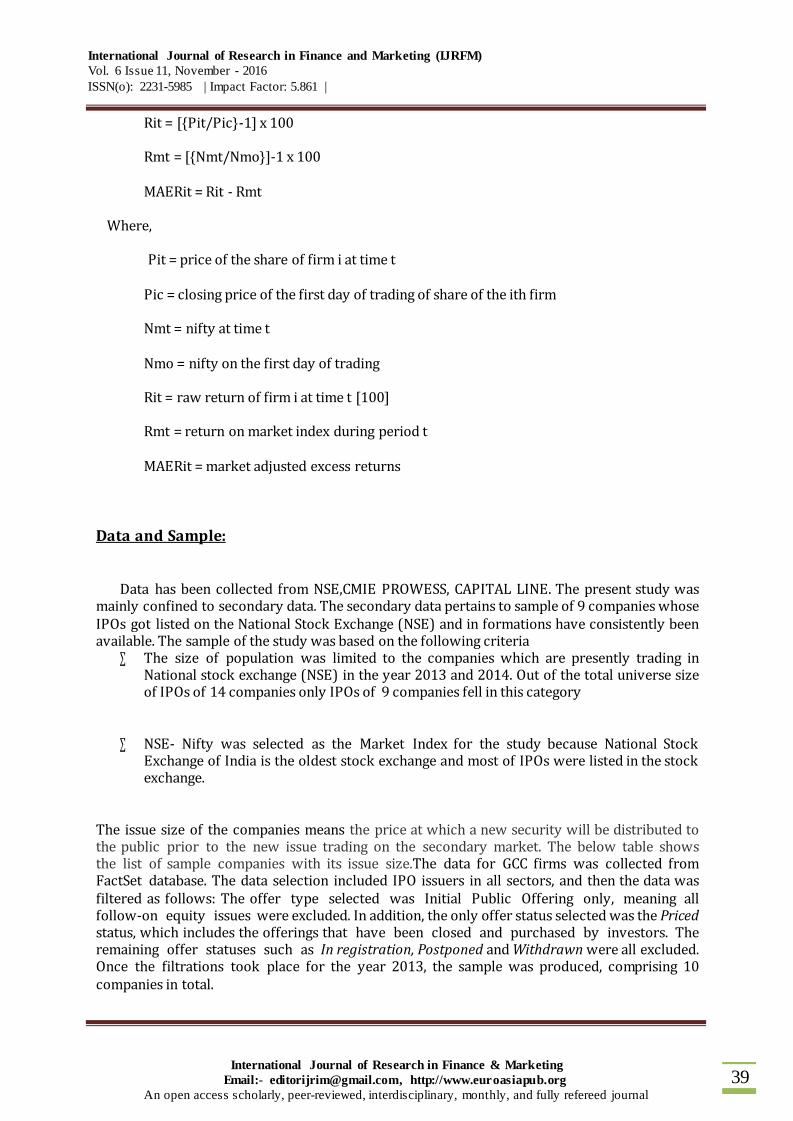
Rit = [{Pit/Pic}-1] x 100
Rmt = [{Nmt/Nmo}]-1 x 100
MAERit = Rit - Rmt
Where,
Pit = price of the share of firm i at time t
Pic = closing price of the first day of trading of share of the ith firm
Nmt = nifty at time t
Nmo = nifty on the first day of trading
Rit = raw return of firm i at time t [100]
Rmt = return on market index during period t
MAERit = market adjusted excess returns
Data and Sample:
Data has been collected from NSE,CMIE PROWESS, CAPITAL LINE. The present study was mainly confined to secondary data. The secondary data pertains to sample of 9 companies whose IPOs got listed on the National Stock Exchange (NSE) and in formations have consistently been available. The sample of the study was based on the following criteria
∑ The size of population was limited to the companies which are presently trading in National stock exchange (NSE) in the year 2013 and 2014. Out of the total universe size of IPOs of 14 companies only IPOs of 9 companies fell in this category
∑ NSE- Nifty was selected as the Market Index for the study because National Stock Exchange of India is the oldest stock exchange and most of IPOs were listed in the stock exchange.
The issue size of the companies means the price at which a new security will be distributed to the public prior to the new issue trading on the secondary market. The below table shows the list of sample companies with its issue size.The data for GCC firms was collected from FactSet database. The data selection included IPO issuers in all sectors, and then the data was filtered as follows: The offer type selected was Initial Public Offering only, meaning all follow-on equity issues were excluded. In addition, the only offer status selected was the Priced status, which includes the offerings that have been closed and purchased by investors. The remaining offer statuses such as In registration, Postponed and Withdrawn were all excluded. Once the filtrations took place for the year 2013, the sample was produced, comprising 10 companies in total.

International Journal of Research in Finance and Marketing (IJRFM)
Vol. 6 Issue 11, November - 2016
ISSN(o): 2231-5985 | Impact Factor: 5.861 |
International Journal of Research in Finance & Marketing
Email:- [email protected], http://www.euroasiapub.org
An open access scholarly, peer-reviewed, interdisciplinary, monthly, and fully refereed journal
40
LIST OF SAMPLE COMPANIES:
The issue size of IPOs in the year 2013 and 2014 are 1645.87 and 1479.68 crores respectively as per
S.no Year Company Name Issue size (lakh shares)
1 2013 Power Grid Corporation Of India Limited
Public Issue of 787,053,309 Equity Shares
2 2013 Just Dial ltd Public Issue of 17,493,458 Equity Shares of Rs. 10 each (including Anchor Portion of 3,936,925 equity shares)
3 2013 Repco Home Finance Limited Public Issue of 1,57,20,262 Equity Shares of Face Value of Rs 10 Each (including Anchor Portion of 23,31,039 equity shares)
4 2013 V-Mart Retail Limited Public Issue of 4,496,000 Equity Shares of Face Value of Rs 10 Each (including Anchor Portion of 6,74,400 equity shares)
5 2014 Monte Carlo Fashions Limited Public issue of 5433016 Equity Shares.(including Anchor Portion of 1,629,904 equity shares)
6 2014 Shemaroo Entertainment Limited Public Issue ofEquity Shares aggregating up to Rs 12,000 lakhs. (including Anchor Portion of 2,117,605 equity shares)
7 2014 Sharda Cropchem Limited Public Issue of 22,555,124 Equity Shares (including Anchor Portion of 3,383,100 equity shares)
8 2014 Snowman Logistics Limited Public Issue of 42,000,000 Equity Shares (including Anchor Portion of 94,50,000 equity shares)
9 2014 Wonderla Holidays Limited Public issue of 14,500,000 Equity Shares
report given in NSE report.
Findings and Discussions:
Listing Day Returns Calculation:
Company Average (%)
Raw
Returns
MAER Annualised Raw
Return
Annualised
MAER
International Journal of Research in Finance and Marketing (IJRFM)
Vol. 6 Issue 11, November - 2016
ISSN(o): 2231-5985 | Impact Factor: 5.861 |
International Journal of Research in Finance & Marketing
Email:- [email protected], http://www.euroasiapub.org
An open access scholarly, peer-reviewed, interdisciplinary, monthly, and fully refereed journal
41
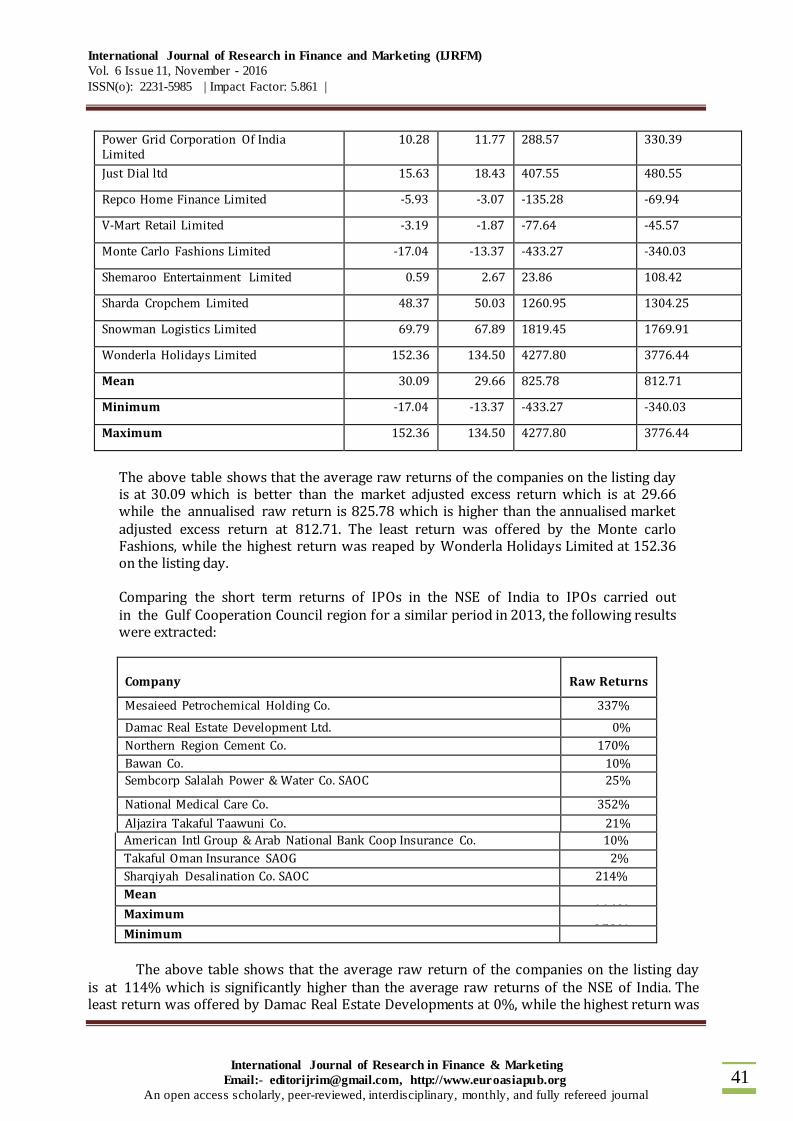
Power Grid Corporation Of India Limited
10.28 11.77 288.57 330.39
Just Dial ltd 15.63 18.43 407.55 480.55
Repco Home Finance Limited -5.93 -3.07 -135.28 -69.94
V-Mart Retail Limited -3.19 -1.87 -77.64 -45.57
Monte Carlo Fashions Limited -17.04 -13.37 -433.27 -340.03
Shemaroo Entertainment Limited 0.59 2.67 23.86 108.42
Sharda Cropchem Limited 48.37 50.03 1260.95 1304.25
Snowman Logistics Limited 69.79 67.89 1819.45 1769.91
Wonderla Holidays Limited 152.36 134.50 4277.80 3776.44
Mean 30.09 29.66 825.78 812.71
Minimum -17.04 -13.37 -433.27 -340.03
Maximum 152.36 134.50 4277.80 3776.44
The above table shows that the average raw returns of the companies on the listing day is at 30.09 which is better than the market adjusted excess return which is at 29.66 while the annualised raw return is 825.78 which is higher than the annualised market adjusted excess return at 812.71. The least return was offered by the Monte carlo Fashions, while the highest return was reaped by Wonderla Holidays Limited at 152.36 on the listing day. Comparing the short term returns of IPOs in the NSE of India to IPOs carried out in the Gulf Cooperation Council region for a similar period in 2013, the following results were extracted:
Company
Raw Returns
Mesaieed Petrochemical Holding Co. 337%
Damac Real Estate Development Ltd. 0%
Northern Region Cement Co. 170%
Bawan Co. 10%
Sembcorp Salalah Power & Water Co. SAOC 25%
National Medical Care Co. 352%
Aljazira Takaful Taawuni Co. 21%
American Intl Group & Arab National Bank Coop Insurance Co. 10%
Takaful Oman Insurance SAOG 2%
Sharqiyah Desalination Co. SAOC 214%
Mean 114% Maximum 352% Minimum
0% The above table shows that the average raw return of the companies on the listing day
is at 114% which is significantly higher than the average raw returns of the NSE of India. The least return was offered by Damac Real Estate Developments at 0%, while the highest return was

International Journal of Research in Finance and Marketing (IJRFM)
Vol. 6 Issue 11, November - 2016
ISSN(o): 2231-5985 | Impact Factor: 5.861 |
International Journal of Research in Finance & Marketing
Email:- [email protected], http://www.euroasiapub.org
An open access scholarly, peer-reviewed, interdisciplinary, monthly, and fully refereed journal
42
reaped by National Medical Care Co. at 352%. It should the noted that during this period, no company reported overpricing, unlike to the NSE of India which reported three initial overpricing in 2013 / 2014.
The following table provides an overview of the IPO underpricing according to sector. The highest average level of underpricing recorded for the GCC companies came from the Health Services sector, with the mean level as high as 352%. The next highest level of underpricing was found in the Process Industries sector (337%). The lowest level of underpricing recorded for this period was for the Producer Manufacturing sector, which included one company and had an average level of underpricing of 10%. The highest level of underpricing overall naturally came from a company listed in the Health Services sector, which was underpriced at 352%.
Sector Companies Mean Maximum Minimum
Finance
4
8%
21%
0%
Health Services
1
352%
352%
352%
Industrial Services
1
214%
214%
214%
Non-Energy Minerals
1
170%
170%
170%
Process Industries
1
337%
337%
337%
Producer Manufacturing
1
10%
10%
10%
Utilities
1
25%
25%
25%
Grand Total
10
114%
352%
0%
The following table provides an overview of the IPO underpricing on a country-by-
country basis in the GCC region. The highest average level of underpricing recorded was from Qatar at 337%. The next highest level of underpricing was found in Saudi Arabia, reaching an average of 113%. Oman’s average overpricing was also high at 80%, while the UAE’s average return was at 0% for this period.
Country
Companies
Mean
Maximum
Minimum
Oman
3
80%
214%
2%
Qatar
1
337%
337%
337%
Saudi Arabia
5
113%
352%
10%
United Arab Emirates
1
0%
0%
0%
Grand Total
10
114%
352%
0%
International Journal of Research in Finance and Marketing (IJRFM)
Vol. 6 Issue 11, November - 2016
ISSN(o): 2231-5985 | Impact Factor: 5.861 |
International Journal of Research in Finance & Marketing
Email:- [email protected], http://www.euroasiapub.org
An open access scholarly, peer-reviewed, interdisciplinary, monthly, and fully refereed journal
43
Period Average MAAR (% )
Including Initial
Returns
Excluding Initial
Returns
Listing Day 30.17 0
L+30 days 27.66 -2.02
L+60 days 41.66 8.03
L+90 days 35.82 10.90
L+120 days 45.75 13.10
L+130 days 45.35 13.58
L+160 days 46.56 15.39
L+190 days 61.83 28.24
L+220 days 63.61 31.09
L+250 days 71.23 38.55
L+280 days 67.02 33.68
L+310 days 59.14 27.11
L+340 days 69.97 37.07
Mean 51.21 19.59
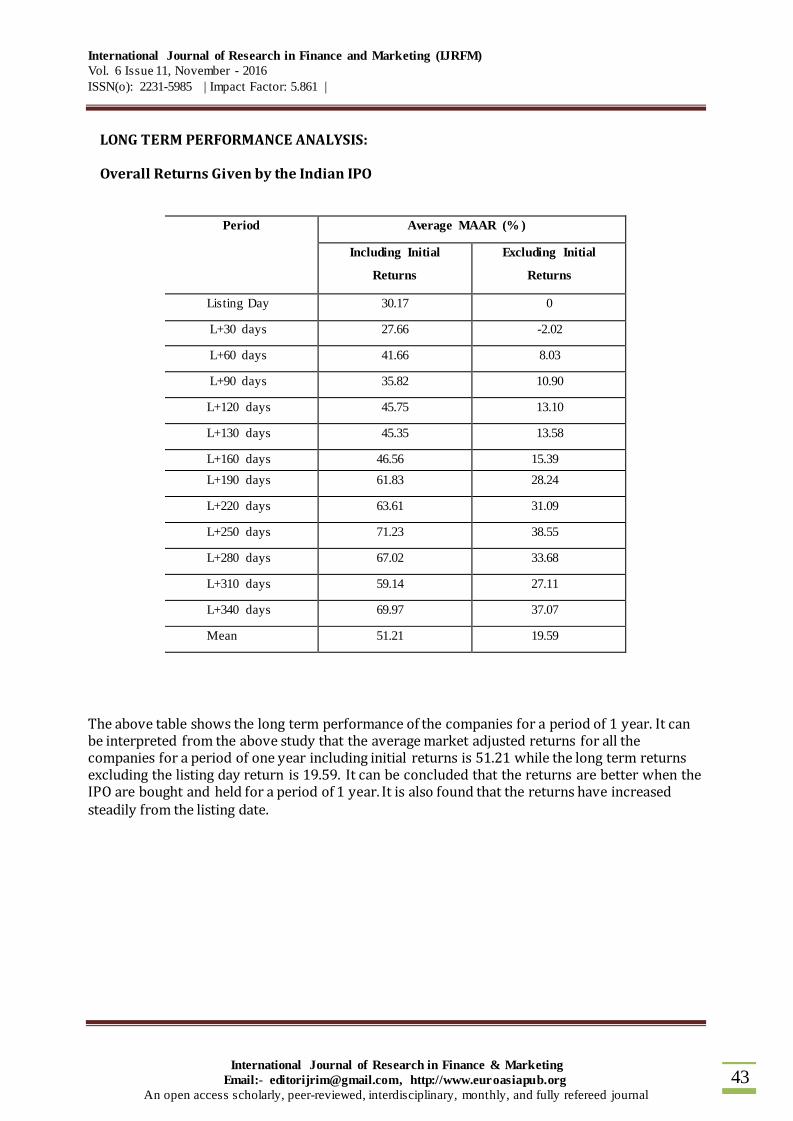
LONG TERM PERFORMANCE ANALYSIS: Overall Returns Given by the Indian IPO
The above table shows the long term performance of the companies for a period of 1 year. It can be interpreted from the above study that the average market adjusted returns for all the companies for a period of one year including initial returns is 51.21 while the long term returns excluding the listing day return is 19.59. It can be concluded that the returns are better when the IPO are bought and held for a period of 1 year. It is also found that the returns have increased steadily from the listing date.

International Journal of Research in Finance and Marketing (IJRFM)
Vol. 6 Issue 11, November - 2016
ISSN(o): 2231-5985 | Impact Factor: 5.861 |
International Journal of Research in Finance & Marketing
Email:- [email protected], http://www.euroasiapub.org
An open access scholarly, peer-reviewed, interdisciplinary, monthly, and fully refereed journal
44
COMPARATIVE TABLE SHOWING PRIMARY MARKET RETURNS AND SECONDARY MARKET RETURNS
S No Name of the Company Primary
market returns
Primary and
secondary market returns
Secondary
market returns
1 Power Grid Corporation of India Limited 10.28 35.23 22.63
2 Just Dial Limited 15.63 107.67 79.74
3 Repco Home Finance Limited -5.93 55.29 65.08
4 V-Mart Retail Limited -3.19 -6.54 -3.46
5 Monte Carlo Fashions Limited -17.04 -21.24 -5.53
6 Shemaroo Entertainment Limited 0.59 27.83 27.08
7 Sharda Cropchem Limited 48.57 87.02 30.1
8 Snowman Logistics Limited 69.79 97.45 16.3
9 Wonderla Holidays Limited 152.36 128.54 -9.44
Mean 30.12 56.81 24.72
The above table shows if the IPO can be used as a mere speculative opportunity or a long term instrument. From the above results it can be concluded that the returns are the maximum when the IPO’s are bought in the primary market and held in the secondary market. The average returns for stocks bought in the primary market and sold in the same is 30.12 while the IPO stocks bought in the secondary market and held in the secondary market is at 24.72. Hence it is concluded that IPO should be held for a long period of time to maximise profit.
CONCLUSIONS AND LIMITATIONS: This study aimed at analysing the performance of IPO both in primary market and secondary market. Investment tools like the Raw Returns, Market Adjusted Excess Returns is used to analyse both the short term and the long term performance. It isimportant for the investors to analyse the trend of IPO stocks to make informed decisions.
The results show that there are five companies that offered higher returns in the primary market and sold in the secondary market, whereas there is only one company which gives higher returns in the primary market and one company which gives higher returns in the secondary market. The sample size used in this study is small, and study period for the long term performance is also small since it may take more than 1 year for a company to improve their financials. The study implemented only Market Adjusted Excess Returns method to analyse the performance of the IPO due to time constraint whereas other tools like Buy and Hold Abnormal Returns and Wealth Relatives could be used to analyse the actual performance of IPO’s. Companies listed in Bombay Stock exchange can also be taken for study to understand the overall performance of IPO stocks in India. Factors influencing underpricing which results in abnormal profits can also be studied to have a comprehensive view on the exact reason behind the anomaly.

International Journal of Research in Finance and Marketing (IJRFM)
Vol. 6 Issue 11, November - 2016
ISSN(o): 2231-5985 | Impact Factor: 5.861 |
International Journal of Research in Finance & Marketing
Email:- [email protected], http://www.euroasiapub.org
An open access scholarly, peer-reviewed, interdisciplinary, monthly, and fully refereed journal
45
From the results it can be concluded that IPO stocks are a good long term investment instruments where they can be subscribed/bought in the primary market and held for stipulated period in the secondary market to maximise the profits. References:
Sherman, A. (2005), “Global Trends in IPOs Methods: Bookbuilding Versus Auctions with Endogenous Entry”, Journal of Financial Economics, Vol. 78, pp 615-649.
Bhalla, V. K. (2004), “Investment Management: Security Analysis and Portfolio Management”, S. Chand, New Delhi. Donald, E. Fischer and Ronald J. Jorda (2004), “Security Analysis and Portfolio Management”, Pearson Education (Singapore) Pvt. Ltd., India branch, 482 FIE. Delhi. Singh, B. and Mittal, R.K. (2003), “Underpricing of IPOs: Indian Experience”, ICFAI, Journal of Applied Finance, Vol. 9(2), pp 29-42. Avadhani, V.A. (2003), “Investment and Securities Market of India”, Himalaya Publishing House Mumbai, Delhi Nagpur, Bangalore, Hyderabad. Ritter, J. R. (1991), “The Long-Run Performance of Initial Public Offering”, Journal of Finance, Vol. 46(1), pp 3-27.
Omran, M. (2005), “Underpricing and Long run Performance of Share Issue Privatization in The Egyptian Stock Market”, Journal of Financial Research, Vol. 28(2), pp 215-234
Levis, M. (1993), “The Long-Run Performance of Initial Public Offerings: the U.K. Experience 1980-1998”, Journal of Financial Management, Vol. 22(1), pp 28-41.
Raju, M.T. (2004), “Capital Market Reforms in India: An Evaluation”, The Indian Journal of Commerce, Vol.12, pp 1-20.
Khan M.Y. (1978), “New Issues Market and Finance for Industry in India”, Allied Publishers, Bombay.

International Journal of Research in Finance and Marketing (IJRFM)
Vol. 6 Issue 11, November - 2016
ISSN(o): 2231-5985 | Impact Factor: 5.861 |
International Journal of Research in Finance & Marketing
Email:- [email protected], http://www.euroasiapub.org
An open access scholarly, peer-reviewed, interdisciplinary, monthly, and fully refereed journal
46
WEBSITES:
www.ssrn.com
www.nseindia.com
www.moneycontrol.com
www.yahoofinance.com
International Journal of Research in Finance and Marketing (IJRFM)
Vol. 6 Issue 11, November - 2016
ISSN(o): 2231-5985 | Impact Factor: 5.861 |
International Journal of Research in Finance & Marketing
Email:- [email protected], http://www.euroasiapub.org
An open access scholarly, peer-reviewed, interdisciplinary, monthly, and fully refereed journal
47