a study on trade union strategies on minimum wage ... · are only few trade unions who have signed...
TRANSCRIPT

1
A study on trade union strategies on minimum wage determination and setting
inHong Kong
Chris King-Chi Chan; Jacky Yuen-Hung Tai1
(Department of Applied Social Studies, City University of Hong Kong)
1 This research is commissioned by International Labour Organisation. Chris Chan is the principle
investigator and Jacky Tai is the research assistant to this project. We are very grateful to Hong Kong
Confederation of Trade Unions and our informants for helping this research. Corresponding email:

2
Table of Content
Executive summary 3
1. Introduction 4
2. Workforce out of the total population 6
2.1 Workforce by sex, age group and sector 7
2.2 Migrant domestic workers 10
2.3 Workforce in informal sector 11
3. GDP growth and living standards 14
3.1 GDP Performance 15
3.2 Public budget expenditure 17
3.3 Trend of the poverty 20
3.4 Inflation 22
4. Workers’ nominal and real wages 23
4.1 Wage change by sectors 24
4.2 Wage of informal workers 28
4.3 Wage costs 30
4.4 Labour productivity 31
4.5 Wage-related labour disputes 32
5. The MW setting mechanism 34
5.1 Key regulations of the MW ordinance 35
5.2 Minimum Wage Commission (MWC) 38
5.3 The involvement of the HKCTU in the consultation 40
5.4 Argument before the implementation of the MW 42
5.5 Current debates on the MW 43
6. Collective bargaining in Hong Kong 45
6.1 The unionization rate and the collective bargaining rates 46
6.2 Labour dispute cases and the negotiation of wage 48
7. Conclusion 49
Appendix 1 54

3
Executive summary
The working poor in Hong Kong have increased nearly double for the last ten years
due to the economic downturn plus the lack of collective bargaining and the poor
labour laws. Youth, elderly, female, migrant, low skill services and informal sectors
workers are the most vulnerable in the labour market.
Although the economy went up and down for the past decade, the average annual
GDP growth is 4 per cent. Nonetheless, the grassroots could not share the economic
growth and their living standard has not improved. It is due to the high inflation and
reduction of social welfare.
Grassroots workers can never share the economic prosperity as their wages
remained the same. In many sectors the real wages have decreased for the past ten
years. In general, higher ranks have higher pay rise while grassroots workers
encountered pay freeze or even pay drop. But if we look into the wage costs and
productivity, they indicate that workers should have a bigger pay rise. Thus more and
more labour disputes occurred after 2007.
After ten years campaigning for the legislative of the minimum wage (thereafter MW),
it was eventually implemented in May 2011. However, the MW rate setting
mechanism is nothing more than a black room deal, and the whole mechanism is
dominated by the government. Trade unions and labour organizations could only
pressure the government through social actions.
If we examine why the labour protection in Hong Kong is so insufficient, one of the
major reasons is the lack of collective bargaining rights. Even though the unionization
rate is over 23 per cent, workers who are covered by the collective agreement are
less than 1 per cent of total workforce.
In the future, trade unions and labour organizations should adopt a mixture of social
movement strategies and workplace organisation in the wage campaign.
4
1. Introduction
After a decade long struggle by the Hong Kong Confederation of Trade unions (HKCTU)
and social organizations, the minimum wage (hereafter MW) ordinance has
eventually been implemented since 1st May 2011. However, the MW campaign is far
from over. As the statuary hourly rate is only set at 28 Hong Kong dollars (hereafter
HK$),2 it is widely believed that the income cannot satisfy the basic living standard.
Even worse, the inflation rate has soared in the recent months and almost offset the
positive effects of the MW. Under the existing MW setting mechanism, the
government dominates decision making. Trade unions should prepare for another
wave of campaigns for raising the MW rate to a reasonable standard.
During the past 20 years, Hong Kong has experienced a dramatic change in the labour
market which was increasingly unfavourable to labour. Jobs in the manufacturing
industry disappear and are replaced by the low-paid jobs in the service sectors. Most
of the low paid jobs consist in catering, sanitary, security, personal care sectors. We
also saw the rapid increase of foreign domestic workers whose monthly salary is
barely around HK$3,400. And during the economic recession after 1998, many
workers were forced to modify their employment contracts to self-employment or to
work on part time basis.
Hong Kong experienced a W-shaped economic development during the first decade
of the 21st century. The economy went down from the late 1990s to 2004. It
recovered in 2004 and reached a peak in 2008 before the economic crisis. After a
short recession, the economy has boomed again since 2009. As a whole, Hong Kong
economy performed quite well. However, it does not mean the general living
standard improves. By contrast, the income gap increasingly widened. More and
more people have slumped under the poverty line, even though the government
refused to set an official poverty line.
The income disparity is the consequence of the laissez faire development model and
the polarization of the labour market. While the wages of the professional and well
educated employees elevated in the past decade, low income workers suffered from
the decline in wages. The group of “working poor”, who work for long hours without
decent salaries for their family livings, has been identified by the public3. People
started to reflect on the principles of “free economy” and “positive
2 USHK$1 is approximate to HK$7.8
3 Oxfam Hong Kong has produced a number of reports for public education and policy advocacy
purposes, see e.g. http://www.oxfam.org.hk/content/98/content_3565tc.pdf.

5
non-intervention” which has been taken for granted in Hong Kong.
In 2008, the government agreed to set the MW law. But the trade union and civil
society groups continued to criticize the weakness of the law and the MW setting
mechanism. They claimed that the government and the employers’ group tried to
minimize the functions of the MW. Due to the undemocratic political system, the
mechanism favours employers much more than employees. The government, which
is accused of colluding with the business sector, manipulates the setting mechanism
and leaves little room for trade unions to participate in the legislation process and in
the collective bargaining.
The right to collective bargaining is not recognized by the law in Hong Kong4. There
are only few trade unions who have signed the collective agreements with the
management. But all of these agreements are not binding. In view of this, employers
dominate the wage negotiation and many of them even ignore the trade unions.
The MW law is only the very first step towards a decent wage. As this research shows,
HKCTU has put the improvement of the setting mechanism and the legislation of
collective bargaining at the top of its agenda. However, this is never an easy task in
the context of Hong Kong, where full democracy does not exist and the independent
trade unions are strategically excluded in the policy setting institutions. The task can
only be achieved by stronger organization of workers and alliance with social
movements together forming a longer frontline.
Objectives
This study aims at analysing the government statistics and other information to
identify the characteristics and the causes of the working poor in Hong Kong. We also
compare the economic development with the change in wage and living standard.
Meanwhile, this paper is going to analyse the legal and practical elements of the MW
setting. The goal is to suggest a future direction of the MW campaign.
Key assumptions
Before discussing the figures and the MW mechanism, we would like to stress our
major assumptions on the MW, which are key to our discussion:
1. The MW is to minimize decent work deficits;
4 A collective bargaining law had been passed in the Legislative Council in 1997 before the handover
of Hong Kong’s sovereignty from Britain. However, .the law has been abandoned by the Provisional
Legislative Council after the handover.

6
2. The MW should be a part of social protection floor for decent living of workers
and their families. It echos to the concept of social protection floor advocated by
ILO;
3. The MW could has a positive contribution to economic growth;
4. The MW could be an essential element for social harmony and stability.
Methodology
This research is based on a number of sources. First of all, we have reviewed widely
the official statistics and publications from Hong Kong census and statistics
department and MW Commission. Many documents such as position papers of the
HKCTU and the newspaper reports have also been reviewed. We also conducted
in-depth interviews with several important stakeholders on the issue of MW,
including government officials, members of provisional MW commission (which is
responsible for setting the MW rate for the first time of its implementation), owners
of small and medium enterprises, commercial chambers, advocacy groups, trade
union leaders, and low income workers (see appendix I for the list of interviewees),
as well as many informal interviews with frontline trade union organisers.
1. Workforce out of the total population
The working poor in Hong Kong have increased rapidly for the last ten years due to
the economic downturn plus the lack of collective bargaining and the poor labour
laws. The government does not have an official definition of the working poor, but
most of the non-government organizations define the working poor as the
low-income households with one or more members in employment. The low-income
households refer to those households with monthly income equal to or less than the
poverty line which is accepted as half of the median monthly household income.
According to a research by Hong Kong Council of Social Service (HKCSS) in 2008, the
poverty lines for a family with one, two, three and four or above members are $3,275,
$7,100, 10,000 and $12,000 respectively5.
In 2000, there were around 210,000 working poor persons, not including the
migrant domestic workers6. The number jumped to nearly 328,600 in 20107 .
Employers can easily lay off workers without any compensation. Workers, especially
the low skill groups such as sanitary, property management, catering and elderly care,
have suffered from low wages in order to keep their jobs.
5 http://www.poverty.org.hk/taxonomy/term/22
6 http://web.swk.cuhk.edu.hk/~hwong/publication/Conference/Cause%20of%20Poverty.ppt
7 Quarterly Report on General Household Survey, October to December 2010,
http://www.statistics.gov.hk/publication/stat_report/labour/B10500012010QQ04B0100.pdf

7
In this section, we shall outline the pattern of the workforce in Hong Kong. Since
1980s, manufacturing have moved northward to mainland China and the share of
manufacturing sector in terms of labour has fallen drastically. By contrast, the
workers in the service sector increased to fill the gap. Most of the Hong Kong workers
are working in the service sector. But there is a polarization in the service sector.
While at the one end of the spectrum there are high valued services like finance,
accounting and law, at the other end many people work in the low skill service jobs.
The salaries of two groups have gone to two directions (we shall discuss in section 4).
Now we shall look into the official statistics to show the size and the characteristics
of the targeted workers of the MW.
1.1. Workforce by sex, age group and sector
As at the second quarter of 2011, Hong Kong has a total population of 7,029,900.
Among them, 3,747,400, or 60.5 per cent are the workforces. 1,964,100 are male
workers and 1,783,200 are female workers. In figure 2.1, it shows that males have a
higher labour force participation rate of 68.9 per cent while only 53.3 per cent
females participate in the labour market.8 In 2011, the unemployment rate of male
is 4.3 per cent while the female’s is 3.0 per cent.9
Figure 2.1: Male and Female labour
participation rate
68.9
53.3
20
40
60
80
Labour participation rate
Male
Female
.
Due to the free high school education and the growth of post-secondary education
opportunities, the workforce rates of the age group of 15-19 and 20-24 remains low.
Figure 2.2 points out that the former is 9.5 per cent and the latter is 60.4 per cent
However, as shown in the figure 2.3, the age group of 15-24 also faces the high
unemployment rate as 18.6 per cent of the youngest group are unemployed, and 9.2
per cent of the age group of 20-24 are unemployed. The unemployment of the youth
8 Census and Statistics Department, HKSAR, Quarterly Report on General Household Survey, April-June
2011 9 ditto

8
aged below 24 is much higher than the average unemployment rate of 3.6 per cent 10 It is believed that the youths are more difficult to find jobs due to their lack of
working experience. Another reason is that they change their jobs more frequently.
Figure 2.2: percentage of labour force by age
0
20
40
60
80
100
15-19 20-24 25-29 30-34 35-39 40-44 45-49 50-54 55-59 60-64 >65
Figure 2.3: Unemployment rate by age
18.6
9.2
3.7 2.6 2.7 2.6 3 3.6 3.81.9
0
5
10
15
20
15-19 20-24 25-29 30-34 35-39 40-44 45-49 50-54 55-59 >60
While many young people cannot find jobs, a certain number of elderly workers
remain in the labour market. Some of the people retire at the age of 55 (especially
the civil servants), so the labour participation rate drops at the age group of 55-59.
Nonetheless, 6.5 per cent of the people above 65 years old, the official retirement
age, is still working.11 Some elderly workers work because they do not want to retire,
but many of them are forced to work as there is no comprehensive retirement
protection. According to the statistics in 2010, the figure 2.4 shows the lower quartile
of the hourly wage by age group, the age group above 55 and 15-24 only earn
HK$28.5 and HK$31.3 per hour respectively, which is much lower than HK$39.5, the
lower quartile of the hourly wage of all employees. Compared with the youngest and
the elderly working population, the age group 25-34 earn HK$47.3 per hour, and
another age group 35-44 also receive HK$46.3 per hour12 We can observe the wage
gap among different age groups. It is obvious that more youth and middle aged
workers receive low income and we can thus infer that they are the targeted group of
10
ditto 11
ditto 12
2010 Report on Annual Earnings and Hours Survey

9
the MW.
Figure 2.4: the hourly wage of lower quartile by age group
31.3
47.3 46.3
36.528.5
0
10
20
30
40
50
15-24 25-34 35-44 45-54 >55
hour
ly p
ay (
$)
We now turn to analyze the workforce by sector. The following figure is the
comparison of the workforce by sector between 2000 and 2011. In the figure 2.5, we
can observe that the working population in the manufacturing industry has dropped
drastically by nearly 59 per cent from 340,400 to 140,200, while employees in the
financing sector has increased by 52 per cent from 446,700 to 678,700. Community
service, such as security guards and sanitary workers, have grown from 751,500 to
934,500, which is a jump of 24 per cent. If we compare the share of workforce by
sector, the changes are even more obvious. The figure 2.6 illustrates the share of
manufacturing sector has dropped from 10.6 per cent to only 3.9 per cent during the
past ten years. By contrast, the financing and the community sectors have risen from
13.9 and 23.4 per cent to 18.8 and 25.9 per cent respectively.13 An overwhelming
majority of the working population are now working in the tertiary sector.
Figure 2.5: No. of employed persons by sector
340000446700
751500
140200
678700
934500
0
200000
400000
600000
800000
1000000
Manufacturing Financing Community
2000
2011
Figure 2.6: precentage of the total employed persons by secotr
10.60%13.90%
23.40%
3.90%
18.80%
25.90%
0.00%
5.00%
10.00%
15.00%
20.00%
25.00%
30.00%
Manufacturing Financing Community
2000
2011
13
ditto

10
It is clear that the economic structure of Hong Kong centers more and more on the
service sector than the manufacturing sector. On the one hand, it has resulted in high
paid jobs in finance, business services and insurance sectors. On the other hand,
many low paid jobs in personal care, security and sanitary have arisen. This trend
contributes to the growing income disparity. We shall further discuss the low income
jobs in the section 4.
1.2. Migrant domestic workers (MDWs)
When the local labour market has become polarized, migrant domestic workers plays
a more important role in Hong Kong. In 1992, there were totally 101,182 MDWs. In
2009, the number went up to 267,778.14 In terms of nationality, , almost 90 per cent
of those workers came from Philippines in 1992, and the Indonesian workers have
increased rapidly from 24,706 in 1992 to 130,448 in 2009. There are now even more
Indonesian workers than Philippines workers. MDWs from other nations are
relatively few. For instance, the number of Thai MDWs was 6,451 in 2000, and it
dropped to 3,695 in 2010. Only 2,058 Indians, 542 Nepalese and 890 Sri Lankans
MDWs were working in Hong Kong in 2010.
Figure 2.7: No. of Migrant Domestic Workers
0
50000
100000
150000
200000
250000
300000
1992 1997 2002 2007 2009
Phillipines
Indonesian
Total
Unfortunately, the MDWs do not get the decent wages. The number of MDWs
accounts for almost 10 per cent of the total employees in Hong Kong. They are
mainly responsible for all the housework and taking care of the children, elderly or
disabled family members. They help release the labour force of local female workers.
The MW of MDWs’ wage is decided by the government. Employers are required to
use not less than the MW for employing MDWs. In reality, the MW also reflects the
actual wage that workers get. As the administration controls the wage level, MDWs
are the first group to be scarified when the economic goes down.
14
Hong Kong Annual Digest of Statistics, 2002 and 2010

11
Figure 2.8: Monthly wage of Migrant Domestic Wokers
3860
3670 3670 3670 3670
3270 3270 33203400
34803580 3580 3580
3740
2800
3000
3200
3400
3600
3800
4000
1998 1999 2000 2001 2002 2003 2004 2005 2006 2007 2008 2009 2010 2011
We should highlight the year 2003. As the economy went worse, the administration
sharply cut the MDWs’ wage by HK$400 without consulting the migrant workers’
groups. At the same time, the government collected the levy of HK$400 per month
from the employers of MDWs for retraining local unemployed workers. In other
words, the government taxed the MDWs in favour of the job training of local workers.
The MDWs’ wage has grown slowly amid the economic recovery. The existing
monthly wage of 3,740 in 2011 is still lower than that of 3,860 in 1998.
1.3. Workforce in informal sector
Since the economic recession in 1990s, employment has undergone the process of
informalization. The informal employment includes self-employment, part time and
causal employment, and contract based employment. Table 2.1 shows the total
employees have increased from 3.2 millions in 2000 to nearly 3.5 millions in 2010.
Self-employed persons have dropped from 207,300 in 2003 to 186,800 in 2010. It is
because the condition of self-employment is worse than the formal employment;
people choose to be employed when the overall economic performance is good.
Besides, the causal employees have decreased from 122,900 in 2000 to around
70,000 in 2002, and have kept steady until 2009. At last, there is a rising trend of
part-time employees; the number has increased from 122,000 in 2000 to 158,800 in
2009, or 30 per cent raise. We shall examine each item in more details.
Table 2.1: Number of total employees, self-employees, part-time employees and
causal employees
Year Total
employees
Self-employees Part time
employees
Causal
employees
2000 3,197,800 -- 122,000 122,900
2001 3,259,700 -- -- 93,800
2002 3,190,700 -- 130,900 65,600
2003 3,174,400 207,300 143,100 72,100
2005 3,326,300 -- 150,900 69,100

12
2009 3,485,700 -- 158,800 66,200
2010 3,477,800 186,800 -- --
It is believed that self-employment has soared since 2000. At that year, the
Mandatory Provident Fund was implemented. Employers and employees are
mandatory to make contributions of an amount equivalent to 5 per cent of the
employees’ salary. Many employers have forced their employees to be self-employed
in order to avoid making contributions. We do not have the statistics of
self-employment before 2000. In 2003, there were total 207,300 self-employed
persons, which account for 6.5 per cent of the total employed population.15 The
number has gone down a little bit in 2009 to 186,800, or 5.3 per cent of the total
employed population.16
Self-employed persons normally earn less than the the total employed population.
54.5 per cent of the self-employed persons earn less than HK$10,000 per month,
while only 44.6 per cent of the total employed population gain the same monthly
wage.17(Table 2.1) Therefore it is not surprised to notice that when the economic
condition improved in 2009, less workers were willing to be self-employed.
Table 2.2 comparison of monthly earnings of self-employed persons and total
employed populations
Monthly earnings from
main employment (HK$)
Self-employed
persons ( per
cent)
Total employed
populations
( per cent)
< 4,000 12.0 11.4
4,000-5,999 7.4 5.8
6,000-7,999 16.1 12.8
8,000-9,999 19.0 14.6
10,000-14,999 18.4 20.8
15,000-19,999 10.6 10.7
>20,000 16.4 23.9
The causal workers have been reduced from 102,500 in 1999 to 66,200 in 2009. At
present, the causal workers only share 2.1 per cent of all employees. However, it is
not because the employers transfer those causal workers into permanent workers.
The reason is that the construction industry, in which workers are mainly causal
15
Special Topic report No. 36 16
Special Topic report No. 56 17
ditto

13
workers, shirked in the past ten years.
Besides, the part-time employment becomes more common. In 1994, there were
only 67,800 part-time employees, i.e. 2.7 per cent of the total employees. 15 years
later, the number soars to 158,800, which is equivalent to 5.1 per cent of the total
employment population.18 Before 1997, Hong Kong economy was boosting and
employers were more willing to hire full time workers. But after the Asian financial
crisis in 1997, more part-time workers, who have less benefits and protection, have
been employed. It reached the highest share in 2003 and 2005 to 5.2 per cent of
total employees, which was in line with the worst economic performance. In 2009, it
fell by 0.1 per cent even the labour market has already
rebounded.
Figure 2.9: Part-time employees as % of total employees
2.7 2.8
4.1 4.34.7
5.2 5.2 5.1
2.0
3.0
4.0
5.0
6.0
1994 1997 1999 2000 2002 2003 2005 2009
It shows that employers tend to hire part-time workers instead of full time workers.
Among them, 64.4 per cent are female. And over 53 per cent of the part-time
workers earn less than HK$4,000 per month. The major reason for being part-time
workers is to take care of housework.19 Hence, those part-time employees have less
bargaining power on wage.
For the contract based workers, the government does not have statistics on it, and
there is no clear definition by the law. In general, we define the contract based
workers as workers who are employed within a limited time frame, say one or two
years. Most of the contract workers have fixed contract terms within the contract
period. So it is easier for the employers to lay off the contract workers by refusing to
renew the contract with them. Also, contract workers normally get lower pay and
less benefits as compared with permanent workers.
According to the information from different unions, there is a trend that more and
more employers have recruited contract workers since the mid-1990s. The
18
Special Topic Report No.52 19
ditto

14
low-waged contract workers are hired to replace the high-waged permanent staff.
Around 40-60 per cent of the employees are contract-based in many private
corporations. For example, the Cathy Pacific Airways has offered contracts on hourly
rate to new flight attendances since 1993. Until now, there are almost 60 per cent of
the flight attendances are covered by new contract.
To conclude, according to the government figures, 273,800 employees, or almost 10
per cent of total employed persons, earned less than HK$28 per hour in 2010. We
can outline the characteristic of those target beneficiaries of the MW by observing
the pattern of total workforce. First, the youth and elderly workers have less
bargaining power as compared with other age groups. Second, the low skill service
sectors like security, sanitary, food services and elderly care are more vulnerable to
exploitation. Third, workers in informal sector, especially part-time workers and
contract-based workers, earn less than full-time and permanent workers. Among
those part-time workers, around two third are female. At last, we should be aware
that over 260,000 migrant domestic workers are receiving low pays because their
MW has remained the same for the past 13 years.
As we examined before, those categories of worker have less bargaining power. They
are the targets to be exploited. Therefore, the MW is important to alleviate the low
wage phenomenon and protect the rights of these inferior groups. The free market
mechanism has failed to ensure people can get the decent wages. We will further
discuss the wage trend of different industries in section 4.
2. GDP growth and living standards
Even though Hong Kong has experienced two major recessions in the last decade, the
overall economic performance has been quite powerful. The real GDP has grown by
48 per cent from 2000 to 2010. Nonetheless, the grassroots could not share the
economic growth and their living standard has not improved. One of the main
reasons is the decrease of the real wages. Also the government cut the public
expenditure on social security, public housing and health. Moreover, the inflation has
rocketed since 2010. In views of these, the income disparity has gone worse and the
populations in poverty have increased. In this section, we shall look into the
performance of GDP, the inflation rate as compared with the poverty rate.
2.1. GDP performance
In 2000, the GDP was HK$1,175 billion. It has risen to HK$HK 1,743 billion in 2010 as

15
shown in figure 3.1.20 The compound growth rate is 48 per cent, and the average
annual growth rate is around 4 per cent. It is expected that the GDP will grow by 5-6
per cent annually in 2011.21
Figure 3.1: GDP growth (in $HK billion)
1175.8 1181.6 1203.4 1239.51344.5
1439.71540.8
1639.2 1677.3 1632.31743.5
1000
1200
1400
1600
1800
2000 2001 2002 2003 2004 2005 2006 2007 2008 2009 2010
The per capita GDP has also got a significant rise for about 25 per cent during the
past ten years, or 2.3 per cent annually, from HK$197,697 in 2000 to HK$247,332 in
2010.22 We note that during 2000 and 2003 the per capita GDP was subtracted in
the economic hardship. It went up again from 2004 to 2008 due to the economic
recovery. The current global economic recession has a relatively short-term impact
on the economy, which has boomed again since 2010.
Figure 3.2: per capita GDP (in HK$)
197,697193,500189,397183,449190,451
202,928215,158
233,266240,339
231,621247,332
150,000
170,000
190,000
210,000
230,000
250,000
270,000
2000 2001 2002 2003 2004 2005 2006 2007 2008 2009 2010
In terms of the economic activity, most of the GDP are contributed by the tertiary
sector, the primary and the secondary sectors have a very small percentage of GDP
contribution.23 Table 3.1 shows that agriculture, fishing, mining and quarrying
sectors only contribute to 0.1 per cent of total GDP. The contribution of the
manufacturing sector fell from 4.8 per cent in 2000 to only 1.8 per cent in 2009. In
20
2010 Gross Domestic Product 21
Economic Forecast 22
2010 Gross Domestic Products 23
http://www.censtatd.gov.hk/hong_kong_statistics/statistics_by_subject/index.jsp?subjectID=3&chars
etID=2&displayMode=T

16
the tertiary sector, Import/export trade, finance and insurance and public
administration have the greatest share of GDP growth. In 2009, their contributions
shared 52.9 per cent of total GDP. Among them, finance and insurance have a
significant growth from 11.9 per cent in 2000 to 15.2 per cent in 2009. Real estate,
professional and business services also increase its shares from 9.3 per cent to 11.3
per cent in the same period. Other services sectors, on the other hand, have kept
almost the same sharing to GDP. Hence, the figures show that during the last ten
years, finance, real estate and business services have dominated the growth.
Table 3.1: GDP by economic activity-- per cent contribution to GDP at basic prices
Economic Activiity 2000 2005 2009
Agriculture, fishing, mining and quarrying 0.1 0.1 0.1
Manufacturing 4.8 2.9 1.8
Electricity, gas and water supply, and waste
management
3.0 3.0 2.3
Construction 4.9 2.9 3.2
Services 87.2 91.2 92.6
Import/export trade 18.4 22.5 19.7
Wholesale and retail trades 3.3 3.7 3.9
Accommodation and food services 3.0 2.8 3.1
Transportation 7.7 8.5 6.4
Information and communications 3.3 3.3 3.0
Financing and insurance 11.9 12.7 15.2
Real estate, professional and business
services
9.3 9.0 11.3
Public administration, social and
personal services
18.8 17.9 18.0
Ownership of premises 11.5 11.0 12.1
Ownership of premises 1.3 0.0
Hong Kong citizens have experienced a up and down economic situation for the past
ten years. However, the actual figures show that overall economic performance was
not bad. In average we have had a considerable economic growth by the contribution
of the services sector. We should then ask whether ordinary workers were
beneficiaries or not, or who were benefited and who were not. It would be clear if
we look into the wage pattern in section 4.
3.2 Public budget expenditure

17
As constrained by the Basic Law24, Hong Kong’s mini-constitution, we shall follow the
principle of keeping the expenditure within the limits of revenues in drawing up its
budget. Under this principle, the government sets a rule that total public expenditure
should not exceed 20 per cent of the GDP. Since Hong Kong handover to China in
1997, the administration made its greatest effort to achieve the aforementioned goal.
In the time of recession, the salaries of the civil servants were reduced, some civil
servants were dismissed and social welfares were shrunken. The number of civil
servants has fallen from 189,384 in 1999 to 153,824 in 2006 and the remaining civil
servants encountered two consecutive wage cut in 2004 and 2005 (it will be
discussed in sector 4.1). But in the economic boom, the government has failed to
improve its services and expanded public expenditure. It has resulted in an income
disparity and social unrest especially in the period from 2003 to 2010. The
government has been more and more surplus while the people living under the
poverty line have been increasing. In the past two years, the government officials
started to realize the social discontents. However, their responses were giving one-off
subsidies instead of long term welfare reform.
The following figure 3.3 shows the trend of public expenditure on basic livings. In the
first few years after Asian financial crisis, although the per capita GDP fell (referring
to the figure 3.2), the government was still expanding the expenditure on education
and health (we shall discuss social welfare below). But starting from 2003, because of
the huge deficit, the government has tightened the budget. For example, the
authority has implemented a “drug formulary” in public hospitals and clinics since
2005, whereby the patients may need to purchase drugs at their own expenses. The
patients may get subsidies on purchasing expensive drugs only if they could pass the
harsh household income scrutiny.
24
See Article 107 of the Basic Law, where it is stated that “the Hong Kong Special Administrative
Region shall follow the principle of keeping the expenditure within the limits of revenues in drawing
up its budget, and strive to achieve a fiscal balance, avoid deficits and keep the budget commensurate
with the growth rate of its gross domestic product.”

18
Figure 3.3 Expenditure on education, health and social welfare, 1999-2010
0
5,000
10,000
15,000
20,000
25,000
30,000
35,000
1999-
2000
2000-
2001
2001-
2002
2002-
2003
2003-
2004
2004-
2005
2005-
2006
2006-
2007
2007-
2008
2008-
2009
2009-
2010
in
HK
$ m
illi
on
Education Health Social welfare
For the social welfare, the government cut the budget more fiercely. The social
welfare system in Hong Kong is called “Comprehensive Social Security Assistance”, or
CSSA. CSSA is a complicated scheme, people who are unemployed, disabled or living
by low income, can apply for the assistance. According to their specific situation, they
can get different amount of “standard rate” subsidies, you may check the table 3.2
for more details25 Besides standard rate subsidies, the applicant can also apply for
other long term or short term supplement. Regarding the eligibility, the applicant
must have been a Hong Kong resident for at least seven years, and he or she must
pass both the income and asset tests.
Table 3.2 Amount of standard rates by category
Category
Amount of standard rates per month (HK$)
Single
person Family member
Elderly person aged 60 or above (Rates from 1.2.2011)
Able-bodied/50%
disabled 2,680 2,530
100% disabled 3,245 2,870
25
Social welfare department,
http://www.swd.gov.hk/en/index/site_pubsvc/page_socsecu/sub_socialsecurity/#CSSAsr

19
Requiring constant
attendance 4,570 4,190
Ill-health/Disabled adult aged under 60 (Rates from 1.8.2011)
Ill-health/50% disabled 2,680 2,530
100% disabled 3,245 2,870
Requiring constant
attendance 4,570 4,190
Disabled child (Rates from 1.2.2011)
50% disabled 3,025 2,635
100% disabled 3,585 3,205
Requiring constant
attendance 4,900 4,525
Single
person
In a family comprising
not more than 2
able-bodied adults/
children
3 able-bodied
adults/
children
4 or more able-bodied
adults/
children
(Rates from 1.2.2011)
Able-bodied adult aged under 60
Single parent/Family
carer - 2,060 1,855 1,645
Other adult 1,890 1,685 1,520 1,360
Able-bodied child 2,275 1,880 1,690 1,505
In 1999, the social welfare department cancelled some allowances and reduced the
amount of assistance for CSSA’s recipients. At that time, a research showed that the
food expenditure of CSSA’s recipients dropped by 8 per cent and their financial deficit
was worse.26 Furthermore, in 2003 and 2004 fiscal year, the CSSA has been again
reduced by 11.1 per cent.
At the same time, the government amended the eligibility of the application. Before
2004 a person who lives in Hong Kong for one year is eligible to CSSA. It then
changed to a minimum requirement of 7 years in 2004. The authority only considers
26
http://www.swik.org.hk/SWIKPortal/DesktopDefault.aspx?tabIndex=0&tabid=50&ItemID=533

20
providing assistance to new arrival citizens case by case. In another words, many new
immigrants are excluded from the social security system. The number has dropped
from 72,816 in 2004 to 24,925 in 2009.27
After cutting the budget for several years, the expenditure of social welfare has
increased again since 2008 because the government provided one additional month
of CSSA payment to the recipients. But it was only a one-off measure in responding
to the social discontent of wide income gap.
We turn to look into the yearly surplus/deficit and the accumulative surplus of the
public account in figure 3.428. From 2000 to 2005, the government has totally 5
consecutive years of deficit account. But in comparison with the huge accumulative
surplus, it only spent about one fourth of the overall savings, which decreased from
430 billion in 2000 to 275 billion in 2004. As we mentioned before, the government
has reduced the public expenditure since 2004. The direct effect is an improvement
of government finance. The yearly surplus in 2007-08 fiscal year reached HK$ 123
billion. And the accumulative surplus attained the record high of HK$ 591 billion in
2010-11. In the recent years, the public starts to comment on the situation as “rich
government and poor citizens”.
Figure 3.4: Yearly surplus/deficit and accumulative surplus
-200
0
200
400
600
800
00-01 01-02 02-03 03-04 04-05 05-06 06-07 07-08 08-09 09-10 10-11
in H
K$
bil
lio
n
Yearly surplus/deficit Accumulative surplus
3.3. Trend of the poverty
While the government accumulative surplus went up, the poverty population was
also soaring. Hong Kong does not have an official poverty line. The government tends
to regard the level of CSSA as a de facto poverty line. But it is criticized for the reason
that the level of CSSA is too low to be a standard. Some organizations, like Hong Kong
27
Statistics on Comprehensive Social Security Assistance Scheme, 1999 to 2009 28
Budget 2000-2011, http://www.budget.gov.hk/2011/eng/previous.html

21
Council of Social Services (HKCSS), designates the poverty line as 50 per cent of the
median income. According to HKCSS, the poverty lines (50 per cent of the median
income) of 1, 2, 3 and 4-member household in 2010 were HK$ 3,275, HK$7,100,
HK$10,000 and HK$12,000 respectively. These incomes could hardly maintain a
decent living in Hong Kong.
Figure 3.5 presents the numbers of persons in poverty by two definitions.29 The
results are contradictive. According to the government definition, the poverty
populations have dropped drastically since 2002, from over 1 million to around
750,000 in 2010. On the other hand, according to the definition of HKCSS, the poor
persons increase from 1.18 million to more than 1.26 million, accounting for 18.1 per
cent of the total population.
Figure 3.5: the numbers of persons in povety by two definitions
500000
1000000
1500000
2001 2002 2003 2004 2005 2006 2007 2008 2009 2010
under government definition
under HKCSS defintion
The disparity explains the poverty condition in Hong Kong, that is, many low income
persons earn a little bit more than the CSSA amount. Trade unions and social
organizations always criticize that the government reduces the poverty population by
suppressing the amount of CSSA. The CSSA standard was only thoroughly reviewed in
1990s. For the past fifteen years, many groups have urged the government to review
the CSSA in order to keep up the standard of social security. However, all the advices
fall on deaf ears.
Low income workers and families have faced double blow. On the one hand, they
have suffered wage cut and unemployment in the economic recession. On the other
hand, the benefits of social welfare, with public health and education have
evaporated.
29
Report of the Commission of Poverty, http://www.cop.gov.hk/eng/report.htm; Legislative Council
Paper No CB(2)179/09-10(08), .
http://www.legco.gov.hk/yr09-10/english/panels/ws/papers/ws1109cb2-179-8-e.pdf; Legislative
Council Paper No.CE(2)2279/10-11(05),
http://legco.gov.hk/yr10-11/english/panels/ws/papers/ws0711cb2-2279-5-e.pdf;
http://www.poverty.org.hk/povertydata?tid=26

22
3.4 Inflation
Given that a large amount of population living in poverty or just above the poverty
line, high inflation will be a fatal attack to the low income group. Hong Kong faced
deflation a few years ago. But the situation turns worse in 2011.
Figure 3.6 shows the ten year changes of the consumer price index.30 For the first
five years, we experienced the price deflation. It weakened the economy. People had
less money to spend and caused the high unemployment. Starting from 2004, there
has been inflation again. But in the first few years (2004-2007), the rates were quite
moderate as the highest inflation rate was only 3.6 per cent in 2008. Nevertheless,
the real challenge has happened since 2011.
Figure 3.6: Year-on-year change of CPI
-3
-1.7
-3.2
-2.1
0
1.11.7
1.3
3.6
0.4
2.7
-4
-2
0
2
4
2000 2001 2002 2003 2004 2005 2006 2007 2008 2009 2010
The inflation has been constantly soaring from 1.8 per cent in August 2010 to 6.3 per
cent in August 2011. Hong Kong imports food from mainland China. The prices of
food go up rapidly due to the apprciation of Chinese Yuan as compared with the
depreciation of Hong Kong dollars, the food prices increased 12.2 per cent. Moreover,
the rent surges at the same time. It has soared 8.2 per cent by year. In table 3.3, we
can see both food and housing becomes the engine heads of the inflation, the
increased food prices contributed 56 per cent while the soared rent contributed 43
per cent of the total inflation. In August 2011, the inflation rate reached 6.3 per cent
as compared with last year. Almost all the increases are caused by the food and
housing.31
30
http://www.censtatd.gov.hk/hong_kong_statistics/statistics_by_subject/index.jsp?subjectID=12&char
setID=2&displayMode=T 31
Monthly report on consumer price index, August 2011

23
Figure 3.7: CPI in 2010 and 2011
1.82.4 2.3 2.5 2.8
3.5 3.5
4.4 4.75.3 5.6 5.9
6.3
1
2
3
4
5
6
7
8/10 9/10 10/10 11/10 12/10 1/11 2/11 3/11 4/11 5/11 6/11 7/11 8/11
Table 3.3 the yearly change of price of food and housing in August 2011
Section Weight of total
consumption
Yearly change Contribution to the
overall change
Food excluding meals bought
away from home
14.45 per cent 12.2 per cent 34 per cent
Meals bought away from
home
19.23 per cent 5.9 per cent 22 per cent
Housing 32.19 per cent 8.2 per cent 43.1 per cent
We should note that households which have lower income spend more on food. In
2009, the lowest 25 per cent of the households spend 41 per cent of their total
expenditure on food.32 In view of this, this wave of inflation seriously affects the low
income group if their income growth could not catch up with the inflation rate.
Actually, survey from the Hong Kong institution of human resources management has
shown that in 2011, the overall salary rise was only 4.2 per cent, much lower than
the inflation rate.33
To sum up, Hong Kong economic performance did very well in the last decade.
Nonetheless, the government’s fiscal policy did not stay in line with the GDP growth.
The fierce cutting of social welfare worsens the living standards of low income
households. As the low income workers’ wages have not improved, the high inflation
in recent months definitely hurt the poor. We shall further look into the change of
the wages.
3. Workers’ nominal and real wages
In the economic hardship, grassroots workers are requested to accept the reduction
32
2009/10 Household Expenditure Survey and the Rebasing of the Consumer Price Indices 33
http://www.hkihrm.org/ihrm_eng/ih_pre_01.asp?id=139

24
of salaries. In the economic boom, employers said as the production costs increase, it
is difficult to increase wages. As a result, grassroots workers can never share the
economic prosperity34. While the per capita GDP increased by 25 per cent from 2000
to 2010,35 low income workers’ wages have remained the same. In this section we
shall analyze the trend of the wages.
3.1. Wage change by sectors
We first examine the nominal wages changed by sector to see which sectors have
better pay rises. Figure 4.1 illustrates the trends of different sectors’ wages.36 The
wages in 1999 is indexed as 100. Financial and insurance activities, import/export
and wholesale trades, retail trade, real estate activities and accommodation and food
service activities have better wage in 2011 than in 1999. But we should stress that
except financial and insurance activities, all other industries have no pay rise until
2010 as compared with 1999. We could see that all other industries were around or
below 100 in figure 4.1. Financial and insurance activities have really outstanding pay
rise. Its wage index has rocketed to 150.7 in 2011. On the other hand, sectors like
manufacturing, transportation, information and communication, professional and
business services and social and personal services have suffered the pay freeze or
reduction in the last decade. For example, the wage index of the transportation
sector in 2011 is 93.9, or 6.1 per cent lower than the wage in 1999.
To better compare the pay rise with the living standard, we then look into the real
wages changed by sector. After considering the inflation, fewer sectors have real
income increases, only financial and insurance activities, import/export and
wholesale trades, retail trade and real estate activities. If we turn the clock back to
2010, then only financial and insurance activities and real estate activities have real
pay-rise.37 The result clearly explains that only financial and real estate employees
can benefit from the economic growth. As many mainland tourists come and buy
luxury goods in Hong Kong, the wholesale and retail trade workers have significant
pay rise in 2011. Except of these four sectors, all other industries have suffered from
real wage decline.
34
This view is generally shared by the trade union leaders and workers who were interviewed by us. 35
Refer to Figure 3.2 36
Quarterly Report of Wage and Payroll Statistics 37
ditto

25
Figure 4.1: Nominal wages changed by sector (1999 Q1 = 100)
70
80
90
100
110
120
130
140
150
160
2004 2005 2006 2007 2008 2009 2010 2011
Manufacturing
Import/export and wholesale
trades
Retail trade
Transportation
Accommodation and food
service activities
Information and
communications
Financial and insurance
activities
Real estate activities
Professional and business
services
Social and personal services
All Selected Industry Sections #
Figure 4.2: Real wages changed by sector (1999 Q1 = 100)
80
90
100
110
120
130
140
150
2004 2005 2006 2007 2008 2009 2010 2011
Manufacturing
Import/export and
wholesale trades
Retail trade
Transportation
Accommodation and food
service activities
Information and
communications
Financial and insurance
activities
Real estate activities
Professional and business
services
All Selected Industry
Sections #
Different ranks of the workers also have different wage change. In table 4.1 we can
observe the change in wage of different ranks of the workers. As compared with the
wages in 1999, Grassroots workers’ wages in 2010 have decreased by almost 4.6 per
cent in real terms, their average hourly rate has decreased from HK$34.3 in 1999 to
HK$32.9 in 2010. Service workers, who are mainly shopkeepers, also experienced the
real wage loss by 1.6 per cent. On the other hand, for managerial and professional

26
employees, the real wage index has risen from 107.1 in 1999 to 116.6 in 2010, totally
8.9 per cent supervisory and technical workers, and clerical and secretarial workers
have their income increased from 8.5 to 11.1 per cent in the same period.38
Table 4.1 Wage comparison between 1999 and 2010
Rank 1999 2010 per cent change
in real terms
Managerial and professional employees
(index June 1995 = 100)
107.1 116.6 +8.9 per cent
Supervisory and technical workers (hourly
rate)
HK$83.3 HK$90.8 +8.5 per cent
Clerical and secretarial workers (hourly
rate)
HK$59.0 HK$65.9 +11.1 per cent
Service workers (hourly rate) HK$39.6 HK$39.2 -1.6 per cent
Miscellaneous non-production workers
(hourly rate)
HK$34.3 HK$32.9 -4.6 per cent
Let us study more in depth the difference in wage with regard to various ranks and
sectors. Among managerial and professional employees, as we expect, employees in
financial and insurance services get the highest wage increases, their wage index
increased to 130.4 in 2010, while the baseline is 100 in 1995. In other sectors like
manufacturing, building, import/export and trades and transportation, the
managerial and professional employees have only enjoyed an accumulative pay rise
of 4.6 to 16.1 per cent for the past fifteen years39
Figure 4.3: Real Salary Indices of Managerial and Professional Employees by
sector in 2010 (1995 = 100)
105.1 104.6
116.1110.5
130.4
100
110
120
130
140
Manufacturing Building Import/export and
trades
Transportation Financial and
Insurance
On the other end of the spectrum, the grassroots workers in food services sectors
have the worst conditions among low income workers. According to the government
statistics, the average wages of the following occupations declined or remained
38
Quarterly Report of Wage and Payroll Statistics; Report of Salaries and Employee Benefits Statistics
Managerial and Professional Employees (Excluding top management) 39
Report of Salaries and Employee Benefits Statistics Managerial and Professional Employees
(Excluding top management)

27
unchanged for the last decade as shown in table 4.2.
Table 4.2: Wage comparison between 1999 and 2010 in food services sector
Industry and occupation Hourly rate
in 1999
Hourly rate
in 2010
per cent
change in
real terms
Chinese restaurant general worker HK$29.0 HK$26.7 -8.3 per
cent
Chinese restaurant junior cook HK$34.9 HK$33.8 -3.6 per
cent
Fast food shop customer services
worker
HK$28.5 HK$29.3 +2.2 per
cent
Fast food shop dishwasher/cleaner HK$27.3 HK$27.6 +0.6 per
cent
In 2010, several industry sections consisted of numerous low income workers. Retails,
restaurants and estate management are the three major sections40 Figure 4.4 shows
the median hourly income of all industry sections is HK$59.5, but several median
incomes of several low income industries are much lower. In restaurants section, the
median income is HK$ 33.7, which means more than 100,000 workers earned less
than HK$33.7 per hour. In estate management section, the median hourly income is
even lower as HK$28.5, more than 105,000 workers in this section, including security
guards and cleaners earned less than HK$28.5 per hour, which is very close to the
statutory MW HK$28. Miscellaneous section includes elderly home care workers,
messengers and workers in salons, etc. Their median hourly income is only HK$34.6.
In comparison, you may note that the lowest 5th percentile hourly wage in financial
and insurance activities section was HK$49.6.
Figure 4.4: Median hourly income by industry section
28.5
33.7
40.5
34.6
59.5
20
30
40
50
60
70
Estate management Restaurants Retail trade Miscellaneous All Industry sections
Ho
url
y r
ate
When the wages in private sector have polarized, the public sector’s wage remained
relatively stable. The accumulative pay rise in the upper salary band for the past ten
40
2010 Report on Annual Earnings and Hours Survey

28
years is 8.8 per cent, and middle and lower salary bands’ are 11.4 per cent.41 (Figure
4.5) This shows that the civil servants in middle and lower ranks have better pay rise
than those in higher ranks. We may note that in the economic recession, middle and
lower ranks officials normally have lower wage reduction.
Figure 4.5: Civil Servsant Salary Change
-10
-5
0
5
10
01-02 02-03 03-04 04-05 05-06 06-07 07-08 08-09 09-10 10-11 11-12
% c
ha
ng
e o
n y
ea
rly
ba
sis
Upper salary band
Middle salary band
lower salary band
The secret is because of the existing pay adjustment mechanism of civil service. The
wage is adjusted annually. According to the mechanism, the government conducts a
survey of the pay scale in the private sector. The results of the survey are then
subject to validation by the Pay Trend Survey Committee. Civil service trade unions
can then lobby or exert pressure on the committee and the government. And at last
the government decides the final pay adjustment. Although it is not a real collective
bargaining mechanism, civil service trade unions, to some extent, involve in the pay
adjustment decision making.
3.2. Wage of informal workers
However, there are some “second-class” government employees who do not get the
same treatment. Since 1999, departments and bureau have employed “non-civil
service contract (NCSC) staff”. The government claims that those employment are
“short-term or part-time, or subject to market fluctuations, or the mode of delivery
of the service is under review.”42 In 2009, the number increased to 16,186.43 In fact,
40 per cent of them have worked more than 3 years, 25 per cent of them have even
worked for five years or more. Those NCSC staff members normally have lower
salaries, fewer benefits and short contracts. 7.5 per cent of those workers have
earned less than HK$8,000. In 2009, there were 16,186 NCSC staff members. At the
same period, there were 155,378 civil servants. Thus the number of NCSC staff
members equivalent to 10 per cent of total civil servants It is no doubt that the
government use NCSC staff to replace the civil servants, creating low wage and less
protective jobs.
41
http://www.csb.gov.hk/english/admin/pay/55.html 42
http://www.csb.gov.hk/english/info/302.html 43
http://www.legco.gov.hk/yr09-10/english/panels/ps/papers/ps1221cb1-597-3-e.pdf

29
Workers under the government outsourcing contracts are even worse. In 1999, the
government stopped hiring civil servants. Except employing NCSC staff, some civil
services, such as security and cleaning services, are outsourced. Unfortunately, there
was a lack of monitoring on the sub-contractors. Some organizations exposed that
some public toilet cleaners only earned HK$7 per hour in 2001.44 The members of
public were shocked by the low wage. Government contract security guards and
cleaners only earned less than HK$4,000 before 2004. In 2004, the unions
successfully forced the government to guarantee the wages of all non-skilled contract
workers not lower than the median income of the employed population. The wages
of security guards then increased to around HK$5,500 and the cleaners’ incomes rose
to around HK$5,000.
But contract workers in private sector still suffered from low wages. In 2006, Cleaning
Service Industry Workers Union conducted a survey about the wage of the cleaners in
a bus company. It is found that the lowest hourly wage was only HK$8.3, and the
average hourly wage was around HK$11.45
Part-time workers in fast food shops have had lower income too. Catering industry
union surveyed the wages of different fast food chains in 2006, 2007, 2008 and 2010
and the results revealed that all of hourly pays are lower than HK$24 even in 2010.
The lowest wage jobs were in KFC. In 2006, the part-time wage was only HK$15.7. It
has risen to HK$21.4, which was still a low wage level. Other fast food chains had the
similar pay trend.46 It shows that part-time fast food workers have less bargaining
power on wage. They are more vulnerable than the permanent workers.
Table 4.3: a comparison of the hourly pay for fast-food workers from 2006 to 2010
Fast-food chain 2006 2007 2008 2010
KFC 15.7 16.2 18.9 21.4
Fairwood 16.5 18.4 19.8 23.1
McDonald 17.0 18.4 20.3 23.1
Maxrim’s MX 18.9 18.5 21.1 22.6
Yoshinoya 19.0 18.5 20.6 21.5
Café de Coral 17.7 19.4 20.2 22.4
44
Homeless exploited for cheap labour, South China Morning Post, 19-02-2001 45
http://www.hkctu.org.hk/cms/article.jsp?article_id=167&cat_id=42 46
Fast-food staff study fuels row over low pay. South China Morning Post, 6-10-2007;
http://chiegu.org.hk/archives/228;
http://foodteam123.mysinablog.com/index.php?op=ViewArticle&articleId=1690247

30
Pizza Hut 19.0 19.9 23.7 23.7
Another form of informal workers is self-employed. We have discussed before the
self-employed persons earn less than general employees. Tractors industry is one of
the major sections which have a lot of self-employed workers. According to the
government statistics, the real wage index of the workers was 65.5 in 2011, as
compared with 100 in 1992.47 In other words, their wages decreased 35 per cent for
the past twenty years.
Thus, all the above figures echo what we explained in section 2, that is, the
contracted, part-time and self-employed workers are more vulnerable than the
workers of formal employment.
3.3. Wage costs
We now turn to the proportion of wage costs in the total production costs. The
government statistics only consist of the data from 2005-2009. Actually, in most of
the industry sections, the proportion of wage costs in the total production costs did
not change much, given that the wages in many industries have increased for around
10 per cent. On the other hand, the proportions of gross surplus of some industries
have risen. Food services and accommodation services sections were the most
extreme case.48 In food services section, the compensation of employees has droped
its share from 30 per cent in 2005 to 27 per cent in 2009. On the other hand, the
gross surplus has increased from 5 per cent to 8 per cent in the same period. We may
note that in 2008 and 2009, the gross surplus has been declining mainly because of
the high rent and the economic downturn. The accommodation services sector
showed the similar pattern. The gross surplus went up amid the economic boom,
whereas the compensation of employees declined. Only the economic crisis in 2009
reduced the gross surplus. If we refer to the figure 4.2, we find that the wages of
food and accommodation services have almost the biggest income decline. Workers
earn less and the employers gain more.
47
Quarterly Report on Wage and Payroll Statistics 48
http://www.censtatd.gov.hk/hong_kong_statistics/statistics_by_subject/index.jsp?subjectID=6&chars
etID=1&displayMode=T

31
Figure 4.6: Ratio of input cotents to total business
receipts--Food services
0.3 0.30.27 0.28 0.27
0.05 0.060.11 0.09 0.08
0
0.1
0.2
0.3
0.4
2005 2006 2007 2008 2009
Compensation of
employees
Gross surplus
Figure 4.7: Ratio of input cotents to total business
receipts--Accomodation Services
0.28 0.26 0.25 0.250.280.29
0.33 0.35 0.360.31
0
0.1
0.2
0.3
0.4
2005 2006 2007 2008 2009
Compensation of
employees
Gross surplus
If we examine the compensation of employees as percentage of total value added,
proportion of wage costs have dropped in the years of good economic situation. In
2003, the compensation of employees was 53.6 per cent of total value added. When
there was economic boom, the share dropped to 50.1 per cent in 2006 and the
numbers remained low in 2007 and 2008. It went up again in 2009, not because of
the increase of the wage, but the decrease of the profit due to the economic crisis.49
So we can expect that in the proportion of wage costs have decreased in recent 2
years because the economy is rebounding again.
Figure 4.8 Compensation of Employees as % of total value added
53
54 53.953.6
52
50.750.1 50.3
51.4
53.9
50
51
52
53
54
55
2000 2001 2002 2003 2004 2005 2006 2007 2008 2009
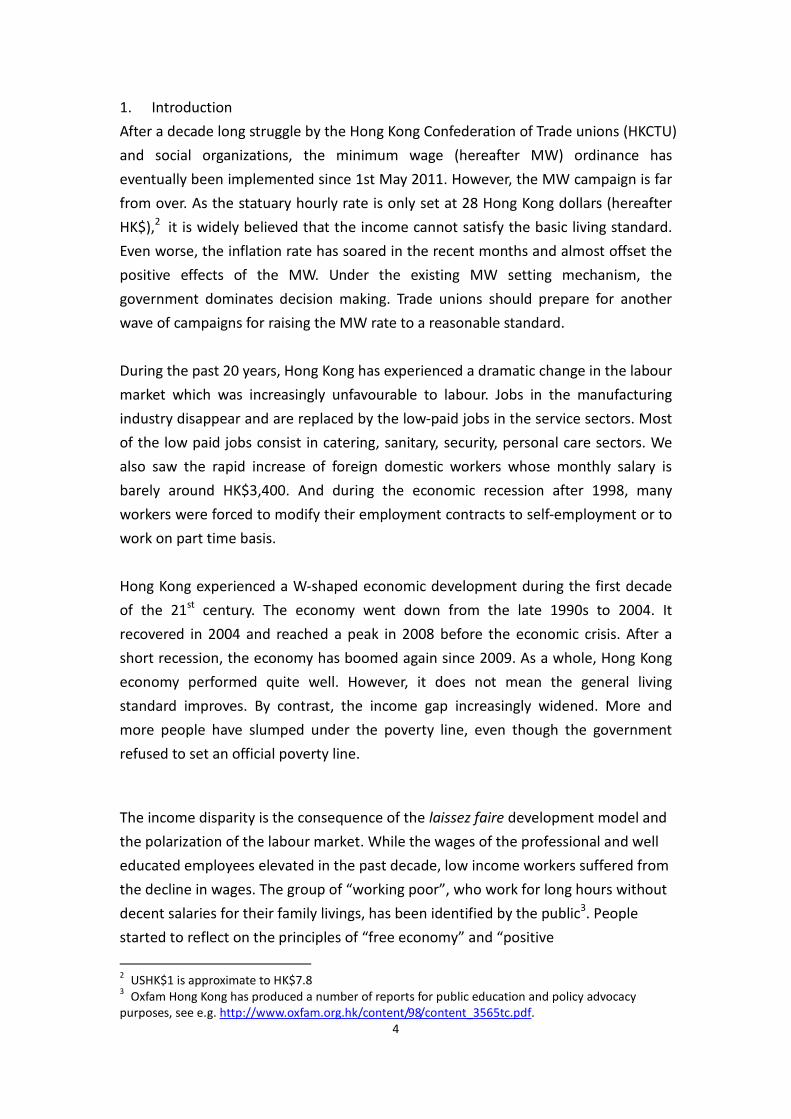
3.4. Labour productivity
While wages remain unchanged, most of the sections have increased their labour
productivity for the past ten years. The most outstanding industries were information
49
2010 Gross Domestic Product
32
and communications, financial and insurance activities and import/export trade.
Except manufacturing, all sections had at least 10 per cent increased for the last
decade.50 But if we compare the wage rises in different industries, only financial and
insurance activities have relatively reasonable return to the employees. The
productivity has increased by 1.3 times and the wages has risen 50 per cent. In other
industries, although their productivity also increased, their wages remain the same
or even went down. We take transportation section as an example; its productivity
has soared nearly by 50 per cent for the past ten years. But the workers have earned
the same amount in the same period.
Figure 4.9 Labour productivitiy indices (2000 = 100)
70
90
110
130
150
170
190
210
230
250
2001 2002 2003 2004 2005 2006 2007 2008 2009
Manufacturing
Import/export
Wholeale and retail trade
Transportation
Accommodation and food
service activities
Information and
communications
Financial and insurance
activities
Whole economy
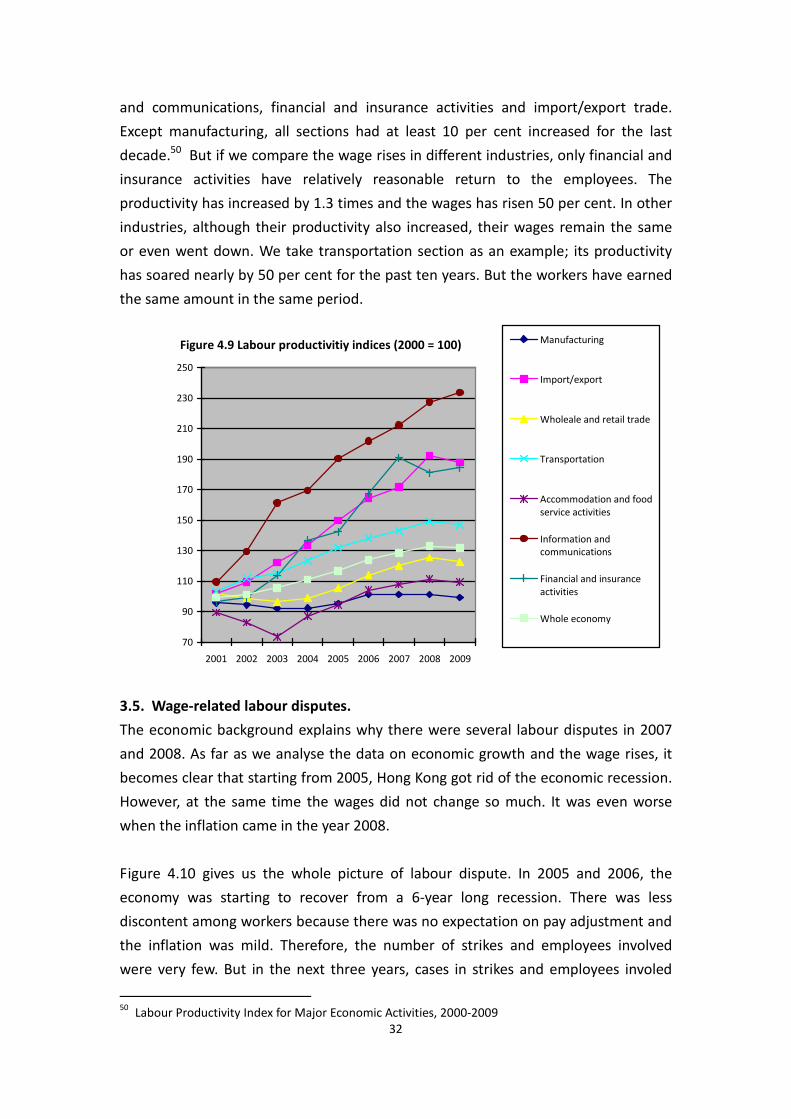
3.5. Wage-related labour disputes.
The economic background explains why there were several labour disputes in 2007
and 2008. As far as we analyse the data on economic growth and the wage rises, it
becomes clear that starting from 2005, Hong Kong got rid of the economic recession.
However, at the same time the wages did not change so much. It was even worse
when the inflation came in the year 2008.
Figure 4.10 gives us the whole picture of labour dispute. In 2005 and 2006, the
economy was starting to recover from a 6-year long recession. There was less
discontent among workers because there was no expectation on pay adjustment and
the inflation was mild. Therefore, the number of strikes and employees involved
were very few. But in the next three years, cases in strikes and employees involed
50
Labour Productivity Index for Major Economic Activities, 2000-2009

33
went up drastically. The employees involved in the strikes went up from 67 in 2006 to
849 in 2007, and it continuously increased to 1337 in 2008 before it went down to
770 in 200951 The figures echo to the inflation and the economic situation. In 2008,
there was high inflation with low pay rise. In 2009, due to economic downwards,
fewer workers joined the strikes.
Figure 4.10 Number of Strikes and Employees Involved
1 3 3 4 7200
67
849
1337
770
0
500
1000
1500
2005 2006 2007 2008 2009
Number of strikes
Employees involved
The first major strike in 2007 was launched by the bar bending construction workers.
Before 1997, they could earn around HK$1,200 per day. But in 2007, their wages
decreased to around HK$800 per day. The working time extended and the rest break
was cancelled. In 2007, the construction industry was recovering and the workers
expected a reasonable pay rise to compensate their loss for the last ten years.
However, employers only suggested a small percentage of pay rises. The anger broke
out and over 2,000 bar bending workers went on strike, around 50 per cent of the
total workers of the section. The strike lasted for 36 days and eventually the
employers agreed to give a higher pay rises and shorten the working hours. The daily
wage was increased to HK$860 and the working hours reduced to 8.
In 2008, the flame extended to the beverage production industries. The beverage
transportation workers had no income adjustment for more than 10 years. In
addition, the management even tried to change the pay scale and reduce workers’
wage. Therefore, in 2008, workers in Nestle, Vitasoy, Watsons and Coca-Cola went on
strike continuously to fight for pay rises. All of them succeeded and set up the
collective bargaining mechanism with the management52.
In 2009 and 2010, there were relatively less strikes because the corporations did not
dare to ignore the request of the workers. But in transportation section, workers took
several industrial actions for wage rises. If we look at the figure 4.2, it explains why
workers in transportation were discontented. In 2007, the real wage index of the
transportation was 106.1, while in 1999 the index was 100. It went down to 99.4 in
51
Labour Department Annual Report 2009, http://www.labour.gov.hk/eng/public/AnnualReport.htm 52
Information is from interviews with trade union organizers and documents from HKCTU.

34
2011. In other words, the transportation workers earned less in real terms in 2011
than in 1999. It was because their wages could not catch up with the inflation. Some
transportation workers, like the tractor drivers, even suffered from pay cut as we
mentioned before.
To conclude, as Hong Kong has no collective bargaining regulation (we will discuss
this issue in section 6), the wages are mainly determined by employers’ discretion.
No matter when the economy turned good or the labour productivity increased, the
wages remained the same or even went worse. We saw the contrast that the
economy went up while the wages went down. It is evident that middle and lower
income workers were marginalized by the benefit of economic growth after 2004.
The situation also changed people’s attitude towards government intervention, that
is, MW. If the free market economy cannot offer decent and fair wages, it is the
responsibility of the government to correct the uneven distribution.
4. The MW setting mechanism
There was a long campaign for the legislation of MW in Hong Kong. Due to a marked
decrease in the wage level and living standard of low income workers, HKCTU has
urged for the MW legislation since 1999 and the motions on legislation were negated
by the Legislative Council in 1999, 2000, 2002, 2004, 2005 and 2006. In 1999, there
were only 9 councillors in the Legislative Council who were in support of the MW bill.
This reveals that various political parties did not submit to the view that MW was
necessary in protecting the low income workers.53 In addition, the government and
the main stream of public opinion followed the “free market economy” ideology and
thus it was difficult to advocate the MW.
As we mentioned before, in the first phase (1999-2004), the target was to call for the
MW for the security guards and cleaners who were employed by the government
under contracts. Unions conducted many actions to raise the public awareness of
extremely low wages. HKCTU employed mainly moral condemnation to convey to the
public the fact that the workers paid all their efforts without being able to support
their families and maintain a decent life.54 It was nothing other than the policy of
contracting out of the public services that caused their low wages. Thus, the
government should shoulder the moral responsibility for improving the employment
conditions of the low income workers. The intervention of the student unions also
helped arouse the public awareness towards the problems of contracting out of
53
Refer to the interviews with Mr. Lee Cheuk Yan and Mr. Mong Siu Tat (Appendix 1) 54
Refer to the interviews with Mr. Lee Cheuk Yan and Mr. Mong Siu Tat (Appendix 1)

35
university services. HKCTU and several student unions took part in exposing the cases
of low wages within universities and in demanding the universities to be a
responsible employer and remedy the situation.55 In 2004, the government agreed
to set up the MW regulation for subcontractors. Afterwards, HKCTU called for the
extension of the regulations to public utilities, e.g. universities, public transport, etc.
In the second phase (2004-2008), HKCTU allied with various NGOs to fight for the
legislation of MW. A number of women groups, religious groups, community
organizations and student unions also called for MW to alleviate poverty. In 2006,
“People Alliance for MW,” composed of 35 different NGOs, was formed and took
several protests and processions to raise public awareness. The Alliance went into
contact with numerous people who do not fall into the network of unions, for
example, the family members of low income workers and the workers who do not
belong to a union. The Alliance enhanced the spread of the urge for the MW by
publishing education booklets and holding press conferences.
Cardinal Joseph Zen Ze-Kiun, S.D.B. (陳日君) of the Catholic Church, avowed in 2006
that the government has an ineluctable responsibility to set up the MW to protect
the low income workers. As the outspoken religious leader, his avowal helped form a
pressing demand in the general public.56 In the period between 2006 and 2008, the
media also played a role in unveiling the plights of the low income workers and this
enhanced the public demand for the MW.57 Eventually in 2008, the government
decided to enact the law.
In this section we will discuss the key regulations of legal framework and the
mechanism of deciding the MW rate.
4.1. Key regulations of the MW Ordinance
The government and the trade unions have very diverse views on the aim of MW
legislation. The former has considered the ordinance “aimed at striking an
appropriate balance between forestalling excessively low wages and minimizing the
loss of low-paid jobs while sustaining Hong Kong’s economic growth and
competitiveness.”58 The latter, on the other hand, have requested that the MW
should be enough for the basic living standard. Owing to the legislative aim, many
55
Refer to the interviews with Mr. Mong Siu Tat (Appendix 1) 56
Refer to the interviews with Mr. Mong Siu Tat (Appendix 1) 57
Refer to the interviews with Mr. Au Yeung Tat Chor (Appendix 1) 58
Statutory MW: Reference Guidelines for Employers and Employees,
http://www.labour.gov.hk/eng/news/pdf/SMW_Guidelines.pdf

36
regulations in the ordinance are set to favour employers. For example, although the
cleaning workers have an increment in their salaries over HK$5000 per month thanks
to the MW, they necessarily fall into the system of Mandatory Provident Fund (MPF).
In this case, they were exempted from paying the premium previously and now are
not.59 This results in a reduced increment of their salaries. The minimum level of
income for MPF contribution was amended to HK$6,500 on 1st November 2011, six
months after the implementation of the MW.
The following summary of the MW Ordinance is based on the booklet, “Statutory
MW: Reference Guidelines for Employers and Employees”,60 which is published by
the Labour Department of the HKSAR government.
Coverage of the ordinance
The MW applies to all employees, regardless of whether they are employed under a
continuous contract. The exemption applies to the foreign domestic workers. Student
interns and work experience students are exempted in certain conditions. HKCTU is
highly concerned about the unjust situation of foreign domestic workers in Hong
Kong. For example, there are cases showing that they merely get a salary unlawfully
reduced by the employers and that they are maltreated by their employers. The fact
that they are excluded from the MW due to their race is susceptible of being
discriminative towards foreigners.
In addition, the contractors and the self-employed persons are not covered by the
ordinance. Employees with disabilities are also covered by the MW Ordinance, but
they can choose a productivity assessment to determine whether they should get the
MW or at a rate correspondent with their productivity.
Definition of hours worked
According to the ordinance, hours worked include any time when the employee is, in
accordance with the contract or with the agreement or at the direction of the
employer:
• In attendance at the place of employment, irrespective of whether he is
provided with work or training at that time; or
• Travelling in connection with his employment, excluding travelling between
his place and residence and his place of employment, other than the
place of employment that is outside Hong Kong.
59
Refer to the interviews with Ms. G (Appendix 1) 60
http://www.labour.gov.hk/eng/news/pdf/SMW_Guidelines.pdf

37
The definition is not quite clear. The government tried to let the employers and
employees decide themselves. It caused the debate on whether meal breaks and rest
day should be included in the MW. Unions have stressed that the meal break and rest
day is part of the working time. Employers’ groups have emphasized both should not
be counted and paid. In fact, many employers, in order to reduce the wage costs, cut
the paid meal break and rest days. The employers generally complained that if the
MW includes all the rest days, this would result in an unbearable rise of cost and
produce a heavy burden for the employers. A number of conflicts between the low
income workers and their employers were observed in the first few months of the
implementation of the MW. HKCTU intervened promoting the solidarity of the
workers and demanding reasonable returns for the workers.61 The collective actions
won the general support via the reports of the media. In the case of Café de Carol,
the general public and a few political parties helped exert pressure on the
corporation and played a role in the supervision of the MW.
Definition of “wages” and “wages payable to an employee in respect of wage
period”
The MW Ordinance follows the definition of wages in Employment Ordinance. The
“wages” means all remunerations, earnings, allowances including attendance
allowances, commission, overtime pay, tips.
However, not all the wages are counted for the calculation of MW. Payment made to
the employee for any time that is not hours worked (e.g. rest day pay and holiday pay)
and advance or over-payment of wages should not be counted. As the same time,
deductions from wages, for example, recovery of the loan to an employee or
employee’s contributions to the pension, must be counted as part of the wages
payable to an employee.
How to determine whether the wages meet the MW
Two factors should be considered:
1) What is the MW: total number of hours worked X MW rate (i.e. HK$28)
2) What is the wages payable to the employee in respect of the wage period
If 2) is not less than 1), then the MW requirement is met. Otherwise, if 2) is less than
1), the employer has to pay additional remuneration.
61
Refer to the interviews with Mr. Mong Siu Tat (Appendix 1)

38
We should stress that there are many loopholes and deficiencies in the existing
regulations. First of all, more than 260,000 foreign domestic workers are excluded
from the ordinance. The government appeals to the excuse that the working time of
live-in domestic workers is difficult to count. But it is not the sufficient reason to
exempt them because the working time of many workers like drivers is also hard to
count. Second, the government has left too much “white spaces” in the ordinance,
like meal break and rest day pay. It provides more opportunities for the employers to
cut the wages and benefits. Third, travelling times between employee’s residence
and the placement of work are not counted as working time.
4.2. Minimum Wage Commission (MWC)
According to the MW Ordinance, the Minimum Wage Commission (MWC) is
responsible to recommend the statutory MW rate to the Chief Executive. The
composition of the MWC must be complied with the law. We quote the clause
Section 11(2) of the MW Ordinance below:62
(2) The Commission consists of—
(a) a person, who is not a public officer, appointed as the
chairperson;
(b) not more than 9 other members who are not public officers
of whom—
(i) not more than 3 must be persons who, in the
opinion of the Chief Executive, have knowledge of, or
experience in, matters relating to the labour sector;
(ii) not more than 3 must be persons who, in the
opinion of the Chief Executive, have knowledge of, or
experience in, matters relating to the business sector;
and
(iii) not more than 3 must be persons who, in the
opinion of the Chief Executive, have knowledge of, or
experience in, a relevant academic field; and
(c) not more than 3 other members who are public officers.
The composition, to a large extent, imitates the British Low Pay Commission63. But
the major difference is that Hong Kong has 3 more government officials in the MWC.
62
http://www.hklii.org/eng/hk/legis/ord/608/s11.html 63
This point has been repeatedly emphasized by the labour bureau official to be interviewed. Refer to
the interview with Mr. Charles Hui and Ms. Queenie Y S Tang (Appendix 1)

39
This arrangement provides a stronger influence of the administrative on the decision
making process. We will examine the whole process of MW setting mechanism later
to illustrate how the government dominates the mechanism.
Also, the members as well as the chairperson are appointed by the Chief Executive.
That means the government has an absolute power to choose the members.
Moreover, all the members are appointed on a personal basis. According to Chief
Labour Officer (Statutory MW), this arrangement can ensure that all the members
are responsible for the Commission instead of their corporations or interest groups.
But trade unions believe that there is lack of accountability of the members and the
MWC. Even the representatives of the business sector, like the convenor of the
Environmental Services Contractors Alliance, a group of government sub-contractors
are members of the commission who do not represent the opinions of the business
sector and their interest.64
The MW Ordinance states that the MWC should review the MW at least once in
every two years. Trade unions and the NGOs requested review once per year but the
motion was rejected by the Legislative Council. This is because half of the councillors
who got elected in functional constituencies stood more by the side of the
employers.
The HKCTU criticizes the long interval of review. The first statutory MW rate was set
according to the data in 2009 and has been implemented in 2011. Due to the
inflation, the purchasing power of HK$28 at present is only equal to around HK$25.5
in 2009. It will be devalued further in 2012 and 2013 if the inflation rate goes up.
That means the income of the workers who earn the MW can never catch up with
the inflation. Moreover, for every review, the rate must definitely take a greater leap
forward with the projection of potential inflation during 2 years’ interval.
In the following we will illustrate how the first MW rate was determined. In February
2009, the government appointed all the members of the provisional MW commission,
or PMWC (At that time the MW Ordinance has not been passed). The census and
statistics department collected relevant data, such as hourly wage distribution,
working time distribution and the wage costs of different industries. The government
also projected the influence on employment, wages and business costs by different
wage rates. The statistics was shared with the public in Feb 2010.
64
Refer to the interview with Ms. Catherine Yan (Appendix 1)

40
Then the PMWC held several meetings to discuss the statistics. The commissions
consulted the public and met various groups representing employees and employers
from March to June 2010. There were totally 42 meetings with the organizations and
PMWC received more than 7,500 submissions of views.65
In August 2010, the PMWC announced that all members had the consensus on the
first MW rate. The report was then submitted to the chief executive in October.
Although the PMWC repeatedly stressed that the decision was based on the statistics
and indicators, there was no clear explanation on the weights of different indicators.
So the decision was more based on the political negotiation rather than a pure
“evidence-based” approach., as the government claimed.66
In November 2010, the government published the statutory MW as HK$28 and
would be implemented on 1st of May 2011. According to the law, the Legislative
Council can only accept or reject the MW rate suggested by the chief executive.
Although trade unions including the HKCTU were not satisfied with the rate, they did
not veto the recommendation because it would then imply an overthrow of the MW
altogether.
Under the existing circumstances, the chief executive can easily dominate the whole
process. First, she appoints the members of MWC. Second, there are three public
officers, who represent the interest of the government and the chief executive, in the
MWC. Third, the MWC only “recommends” the rate whereas the final decision maker
is the chief executive. Fourth, the Legislative Council cannot amend the rate. The
member of the PWMC, Professor Cheng Kwok Hon, contends that the government
has a strong political stance in the commission.
4.3. The involvement of the HKCTU in the consultation
As we mentioned, the administrative lead the whole process of setting the MW rate,
Most of the works done by the HKCTU and other organizations were beyond the
mechanism.
Within the mechanism, the HKCTU met the PMWC three times. The first meeting was
held in December 2009. The HKCTU mainly emphasized the MW rate should not be
lower than the average amount of CSSA and the negative impact of the MW should
not be exaggerated. The second meeting was held in April 2010 after the publication
65
Report of the Provisional MW Commission http://www.labour.gov.hk/eng/rbo/PMWC_Report.pdf 66
Refer to the interview with Mr. Charles Hui and Ms. Queenie Y S Tang (Appendix 1)

41
of the statistics. The HKCTU studied the data and suggested that if the hourly rate
was set as HK$33, there would be very moderate influence on the economy. Table
5.1 shows the calculation of the HKCTU to the PMWC.67 The first column is the
percentage increase of wage costs if the MW rate is set as HK$33. For example, the
wage costs of retail industry will increase 3.9 per cent. The second column is the
wage costs as per cent of total revenue. For instance, in retail industry, the wage cost
is only 9.1 per cent of the total revenue. The third column shows if the businesses
want to shift the burden of the wage increase to the customers, what is the
percentage of increase the price of goods or services. For example, the prices in retail
industry will only increase 0.4 per cent (3.9 per cent X 9.1 per cent). For security and
cleaning services, as they are only parts of the estate management services, the
HKCTU estimated that median estate management fee will increase by around HK$40
to HK$45 per household per month only. In May 2010, the PMWC again met with the
HKCTU to share ideas and to discuss the ripple effect on the pay hierarchy.
Table 5.1: Impact on wage costs and surplus if the rate is set as HK$33
Increase of wage
costs(A)
Wage as per cent
of total revenue
(B)
Change of the prices of goods
and services(AX B)
RetailRetailRetailRetail 3.93.93.93.9 per centper centper centper cent 9.19.19.19.1 per centper centper centper cent 0.40.40.40.4 per centper centper centper cent
Supermarkets and convenience store 8.5 per cent 7.2 per cent 0.6 per cent
Other retail stores 3.3 per cent 9.4 per cent 0.3 per cent
RestaurantsRestaurantsRestaurantsRestaurants 7.97.97.97.9 per centper centper centper cent 28.428.428.428.4 per centper centper centper cent 2.22.22.22.2 per centper centper centper cent
Chinese restaurants 4.8 per cent 32.0 per cent 1.5 per cent
Non-Chinese restaurants 5.4 per cent 26.3 per cent 1.4 per cent
Fast food cafes 17.8 per cent 22.9 per cent 4.1 per cent
Hong Kong style tea cafes 10.7 per cent 30.3 per cent 3.2 per cent
Estate management, security and Estate management, security and Estate management, security and Estate management, security and
cleaningcleaningcleaningcleaning 15.215.215.215.2 per centper centper centper cent 46.446.446.446.4 per centper centper centper cent 7.17.17.17.1 per centper centper centper cent
Real estate maintenance management 12.0 per cent 31.3 per cent 3.8 per cent
Security services 19.9 per cent 82.7 per cent 16.5 per cent
Cleaning services 25.6 per cent 75.6 per cent 19.4 per cent
Other low paying sectorsOther low paying sectorsOther low paying sectorsOther low paying sectors 8.88.88.88.8 per centper centper centper cent 22.922.922.922.9 per centper centper centper cent 2.02.02.02.0 per centper centper centper cent
Elderly homes 10.2 per cent 55.5 per cent 5.7 per cent
Laundry and dry cleaning services 7.7 per cent 33.3 per cent 2.6 per cent
Hairdressing and other personal 11.2 per cent 39.3 per cent 4.4 per cent
67
The submission of the HKCTU to the PMWC, 20 April 2010

42
services
Local courier services 6.4 per cent 36.7 per cent 2.3 per cent
Food processing & production 4.5 per cent 16.0 per cent 0.7 per cent
Nevertheless, the PMWC did not take the views of the HKCTU. Lee Cheuk Yan,
general secretary of the HCKTU, commented that the PMWC was nothing more than
black-room deals.68 In view of this, it was more efficient to press the government by
social actions instead of lobbying. During the consultation period, some
representatives from business sector suggested the low wage rate. The most famous
one was the Catering Functional Constituency Legislative Councillor Tommy Cheung.
He proposed the MW rate should be HK$20 for not harming the catering industry.
The HKCTU plus other organizations protested against him and made the public
aware of his relentless view. Moreover, the HKCTU organized several protests and
surveys to explain the unions’ stance. The social actions which kept the attention of
the mass media were essential to negotiate on the MW with the government and
also the employers.
4.4. Argument before the implementation of the MW
The argument did not stop after the confirmation of the first MW rate as HK$28.
Employers and employees turned their battle on the implementation of the MW
Ordinance. As said before, many employers planned to cut paid meal breaks and rest
day pay to minimize the increase of wage costs. Under the existing employment law,
if both employer and employee agree, they can change the contract terms. But it is
obvious that many employers force their workers to sign the agreements to cancel
the meal break and rest day pays. The trade unions urge that employers should have
social responsibility to fulfil ordinary contract terms, which include meal break and
rest day pay. What trade unions and social organizations could do is to reveal those
immoral behaviours of “unscrupulous employers”.
The most serious case was the fast food chain Café de Coral, which hires more than
15,000 employees. Its chairman Mr. Michael Chan was, ironically, the member of
PMWC. In November 2010, just after the announcement of the MW rate, the giant
enterprise increased the wages to HK$28 per hour. But on the other hand, they
decided to cut the meal break pay. As a result, the workers have no wage increase at
all. The catering union launched a protest and boycotted the Café de Coral. This
action gained tremendous support from the general public. Under the social pressure,
68
Refer to the interviews with Mr. Lee Cheuk Yan and Mr. Mong Siu Tat (Appendix 1)

43
the fast food chain eventually kept the meal break payment.69
But more and more cases broke out before the enforcement of the MW. The HKCTU
has called for legislation to protect the meal break and rest day pay. The social
movement has successful raised the public awareness. Many employers have agreed
to keep the meal break and rest day pay to avoid being stigmatized as “unscrupulous
employers”. However, as there are no collective bargaining regulations, the
employers are still easy to change the contract terms.
4.5. Current debates on the MW
We explained in the previous figures that the existing MW Ordinance and the
mechanism have a lot of deficiencies. The current debates are still related to those
deficiencies. The major argument is whether the MW rate should be reviewed
annually. Trade unions stress that the annual review can help the wage keep up with
the price indices. But the government announced that they will only comply with the
law by submitting the report within two years. The social pressure is not high right
now so the government seems to have more advantages.
Another hot debate is the accountability and the transparency of the MWC. The
unionists and even the employers describe the MWC as black-room deal. Although
the members of MWC are from the labour and business sector, they are appointed
on personal basis, but not on organizational basis. Also, the discussions in the MWC
are not open to the public. There is even no announcement on when the next
meeting will be.
Besides, the HKCTU urges the amendment of the Ordinance for including live-in
domestic workers. Disabled concern groups request the cancellation of the
assessment test on disabled employees, because the test is the discrimination to the
employees. But all the government has turned a deaf ear to all those requests.
4.6. Impact of the MW
The popular fear for the MW has evaporated after the implementation of the law.
Before, many business groups and scholars warned that the MW would deteriorate
unemployment rate, especially in the middle-aged and the youth group. Some
threatened that many small businesses would be closed. But all the statistics show
that there are no negative impacts on the labour market and business at present.
Figure 5.1 presents the decline of the unemployment rates of different age groups
69
Refer to the interviews with Mr. Mong Siu Tat (Appendix 1)

44
after May 2011.70 Also, about the business, there is no evidence that the MW has
caused any major deficits. So, all the tripartite constituents agree that it was right
time to introduce the MW.
Figure 5.1: Unemployement rate by age group
0
5
10
15
20
un
em
plo
ym
en
t ra
te
15-19 18.3 17.1 16.7 18.6 19 17.9 16.6
50-59 3 3.3 3.4 3.6 3.5 3 2.9
>60 2.2 2 2.2 1.9 1.8 1.5 1.9
Overall 3.6 3.4 3.5 3.5 3.4 3.2 3.2
1-3/11 2-4/11 3-5/11 4-6/11 5-7/11 6-8/11 7-9/11
Even the employers acknowledge that the greatest increment of production cost
comes from the ascension of rent, which might reach 50 per cent of the original rent
in some cases.71 It is generally acknowledged that the MW has not led to obvious
bankruptcies of small and medium sized companies. Thus, the worries of
bankruptcies and loss of jobs, that numerous employers held and even the low
income workers believed in, turn out to be ungrounded.
On the contrary, more and more positive effects of the MW have emerged. The very
first is the wage increase, according to the government officials, 10 per cent of the
employees belonging to the lowest income group had an increase of 12.5 per cent in
salaries. On average, all employees enjoy an income rise of 7.6 per cent only.
According to the government statistics, the number of workers who earn less than 50
per cent of the median income has dropped from 328,600 in 2010 to 248,600 in
201172, nearly 25 per cent reduction.
Also, the MW encourages the middle aged and women for working. Secretary for
70
http://www.censtatd.gov.hk/hong_kong_statistics/statistics_by_subject/index.jsp?subjectID=6&chars
etID=2&displayMode=T 71
Refer to the interviews with Mr. Lau Tat Pong (Appendix 1) 72
Quarterly Report on General Household Survey, July to September 2011,
http://www.statistics.gov.hk/publication/stat_report/labour/B10500012011QQ03B0100.pdf

45
Labour and Welfare, Mr. Matthews Cheung, announced that more than 30,000
middle aged persons have joined the labour market after the implementation of MW.
Moreover, the increase of the women labour participation rate is higher than the
male one, showing that the MW attracts more women to work. Many housewives,
who did not work before the implementation of the MW, are willing to find jobs as
the wage is more attractive. Moreover, as there is shortage of labour supply, male
workers are already scarce. Employers could only hire female workers to fill the new
jobs.
The HKCTU conducted a survey in August and September in 2011 to look into the
impacts of the MW. The survey successfully interviewed 519 workers and compared
their wages and benefits before and after the implementation of the MW. The result
discloses that those who earned less than HK$28 before enjoyed a pay rise by 14.5
per cent. Among them, cleaners have the highest pay rise to 23.7 per cent. The
salaries of security guards and restaurant workers have also increased 7.8 and 7.7 per
cent. People who earned more than HK$28 hourly before the first of May, have also
enjoyed 1.7 per cent pay rise. Among the interviewees, only 1.6 per cent reported
that they have lost their jobs in connection with the MW.
This study shows that low income workers, both earned below or near the MW rate
before its implementation, are the main beneficiaries. As we mentioned before, this
group is estimated as around 270,000 workers, most than 10 per cent of total
employed persons.
To conclude this section, the government dominates the existing mechanism by
controlling the appointment of the members of the PWC and the final decision of the
rate. The so called “tripartite” commission exists only in name. In order to negotiate
with the government and the employers, the HKCTU has the following strategies:
First, analysing the statistics to convince the public that the relatively higher MW rate
is acceptable. Second, using press conference and social actions to raise the
awareness of the public, to create social pressure to the government and the PMWC.
According to a former member of the Provisional MW Commission, it is obvious that
the government makes use of the MW as a means to achieve social stability.73 The
government keeps insisting on the importance of consensus between employers and
employees in determining the level of MW.74 What is essential for the government is
to render the employers and the employees to arrive at a compromise rather than a
73
Refer to the interviews with Mr. Cheng Kwok Hon (Appendix 1) 74
Refer to the interviews with Mr. Charles Hui and Ms. Queenie Y S Tang (Appendix 1)

46
confrontation. It is well discernable that the government maintains a neutral role
apparently and weakens the power of collective bargaining of the workers in deed.
5. Collective bargaining in Hong Kong
In this section, we turn our focus to the collective bargaining. A bill of collective
bargaining which was put forward by Legislation Council member and HKCTU General
Secretary Lee Cheuk Yan was passed before the handover in 1997. However, the
provisional legislative council after the handover abolished this law. For many years,
it has been one of the major targets of HKCTU and its affiliated trade unions. But the
government ignored their requests.
5.1. The unionization rate and the collective bargaining rates
If we read the government report, it shows that Hong Kong has a relatively good
unionization rate. The rate has increased for the past few years. The rate has climbed
from 20.88 per cent in 2006 to 23.19 per cent in 2010. But it is widely believe that
many workers join the union only for welfare benefits. For instance, one of the union
federations, the Federation of Trade Unions (FTU) organizes many training courses for
workers and members of public. Workers who join their unions can enjoy a
discounted rate for enrolling the courses. Most of these so called “union members”
do not participate in union affairs.
By sector, transportation, manufacturing and social and personal services have the
highest unionization rates. On the contrary, financial and business sectors have very
low rates. Transportation sector has contributed 11,290, or 25 per cent out of total
40,208 new memberships. 75
Figure 6.1: Unionization rate
20.88 21.0921.51
22.48
23.19
19
20
21
22
23
24
2006 2007 2008 2009 2010
Table 6.1 Unionization rate by sector in 2010
75
Trade Union Annual Statistical Report 2010,
http://www.labour.gov.hk/tc/public/pdf/rtu/ASR2010.pdf; Quarterly Report of Employment and
Vacancies Statistics, December 2010,
http://www.statistics.gov.hk/publication/stat_report/labour/B10500032010QQ04B0100.pdf

47
Industry section Declared
membership
Employed
persons
Unionization
rate
Transportation 132,860 161,544 82.2 per
cent
Manufacturing 60,457 117,590 51.4 per
cent
Social and personal services 181,185 432,812 41.9 per
cent
Professional and business services 44,955 314,344 14.3 per
cent
Accommodation and food services 24,989 255,288 9.8 per cent
Import/export, wholesale and retail trades 67,286 813,230 8.3 per cent
Information and Communication 6,458 88,894 7.3 per cent
Real estate 7,410 112,542 6.6 per cent
Financing and insurance 9,599 196,413 4.9 per cent
Total ------ ------
But we should stress that the unionization rate may be a bit over-valued, because the
declared membership may include some duplication, i.e., a person may join two
unions at the same time. Nevertheless, the figures, to some extent, reflect the
participation of the workers in unions.
However, the collective bargaining rates are not in line with the unionization rate.
Even though there is no official statistics on the collective bargaining rate, several
unions enjoy the collective bargaining right. So it is widely believed that the collective
bargaining rates are around 1 per cent or even less of the unionised enterprises.
As there are no regulations on collective bargaining, all the existing agreements are
not binding. Employers could easily ignore the agreements and the request of the
unions. For example, Cathy Pacific Airways, the largest air company in Hong Kong,
signed the agreements with the unions in 1980s. The agreements include the annual
wage negotiation. But from 1998 to 2009, no negotiations were carried out. It was
eventually established in 2010 under the great pressure from the unions.
Nonetheless, the negotiation in that year was terminated by the sole announcement
of the wage increase by the company.
According to the chairperson of the Cathay Pacific Airways Flight Attendants Union,
they face a lot of difficulties. On the one hand, due to a lack of Collective Bargaining

48
Ordinance, the corporation always has a stronger initiative than the union in taking
certain issues to the table. The corporation insists that any industrial action and
exposure to the media unfavourable to the corporation would lead to an interruption
of the regular meetings between the union and the corporation because it uses every
means to maintain its good image for the public. The corporation hopes the union
not to unveil the proceedings of the regular meeting. On the contrary, the members
intend to know more about the proceedings of the meeting. The corporation made
its attempts to form a committee of consultation composed of the flight attendants
so as to override the union.76
Other unions, which are mainly transportation unions, enjoy a few aspects of the
collective bargaining right. The Watsons Union holds a regular meeting with the
representatives of the senior management every 3 months since 2008. This is
exemplary for the practice of collective bargaining in HK. However, nearly all the
rights they obtained are not guaranteed with legal power by a written regulation. The
managements could easily change their attitude. Once they find the unions are weak,
they assault the unions. In addition, due to a lack of collective bargaining ordinance,
the female workers are more reluctant to join the union owing to their worries of
possible dismissals.77
5.2. Labour dispute cases and the negotiation of wage
If we compare figure 4.2 with table 6.1, we discover a very strange condition that
industries with higher unionization rate do not mean they have higher wage increase.
For example, transportation section has the highest unionization rate, but its real
wage has not increased for more than 10 years. On the other hand, financing and
insurance has the lowest union participation rate, but its wage skyrocketed. There
are several reasons to explain this strange condition. First, as we mentioned before,
many workers join the unions only for the welfare benefits, like enjoying the
discounted rate of buying goods and services. Those members do not participate in
the union action for pay rise. Second, we should not forget the fact that the collective
bargaining rates are low. Therefore the unionization rates have no relevance to the
wage negotiation. The wages are more determined by the nature of industries rather
than the collective bargaining.
So the importance is not the unionization rate, but is whether the unions eager to
mobilize their members to negotiate with the employers. Several labour dispute
76
Refer to the interviews with Ms. Dora Lai (Appendix 1) 77
Refer to the interviews with Mr. Leung Wai Yam (Appendix 1)

49
cases mentioned in section 4.5 show that organized fight are very crucial for getting
the better wages. For instance, bar benders, who have the strike in 2007, got the
greatest pay rise among the different sectors in construction works.
More and more unions have realized the wage rises and more benefits can only be
obtained by union struggles. For example, after the strike in 2008, Hong Kong
A.S. Watson & Company Limited Employees Union organizes their members every
year to fight for a better pay rise. They collect the opinions of the members and send
the results to the company. They hold a lot of meeting informing the progress of the
negotiation to the members. The more organization the bigger chance to win. In
2011, they successfully got the medical cards for every member and the notice board
in every region of transportation of bottled waters.
Nevertheless, we should also notice the difficulty of organizing industrial actions in
Hong Kong. As we mentioned before, the labour laws in Hong Kong provide very few
protection to the workers. Employers can easily lay off “trouble makers” without
giving much compensation. So many workers are afraid to lose their jobs if they join
the industrial actions. Hong Kong even does not have the regulation of reinstatement
if the employer dismisses a worker improperly. In view of this, HKCTU and other
labour organizations are also fighting for the rights to organize unions.
6. Conclusion
In the past ten years, the economy went up and down. Starting from 2000, the
economy has declined and 2003 was the worst year. It has gone up again since 2004
and has reached the new record high in 2010. Overall, the performance was well. The
annual GDP growth rate is 4 per cent and the per capita GDP has also increased by
2.5 per cent annually.
But the wages and the living standard have a very different story. We have seen the
income gap growing wider. The financing and professional sections have enjoyed the
prosperity; their wages have increased by 50 per cent for the past decade. But all
other industries lagged behind. Some occupations’ wages, such as catering, have
been cut more than 10 per cent for the last ten years. In term of the ranking,
Grassroots workers have faced the most severe condition. Workers in fast food chain,
sanitary, security have extremely low paid. The condition is deteriorating as the
inflation rate is soaring, meaning that the real wage is threat to be decreased.
All the evidences show that the wages, especially the wages of low income workers,

50
are undervalued. The wage has not increased simultaneously with the growth of GDP
and productivity. It shows that the share of the compensation of employees on the
total production costs has dropped
We observe that there are structural problems causing the wide income gap. First,
the disappearance of the manufacturing led to the polarization of the labour market.
We have seen the growing of both high and low skilled services jobs. The wages of
low skilled jobs have been suppressed especially in the economic recession.
Second, due to the poor labour rights, more and more employers have preferred
informal employment. Contracted, part-time or even self-employed have
deteriorated the wages and working conditions.
Third, the government cut the social welfare which is the safety net of the low
income workers. Without the safety net, low income workers needed to accept the
worse wages and working conditions reluctantly. It then strengthened the bargaining
power of the employers who could suppress the wages more.
Forth, the government has ignored workers’ collective bargaining rights and
organization rights by refusing setting up legislations. Workers and unions have no
means to discuss pay rise with the employers except taking industrial actions. But
because of the high risk of losing job, it is not easy to mobilize workers to fight for
better wage.
Therefore, the introduction of the MW is the immediately measure to alleviate the
poverty, to help the working poor and to narrow the income gap. Under the existing
mechanism, the MW rate is recommended by the MWC, which all the members are
appointed by the chief executive. Although the commission consisted of the
representatives from employers, employees and academic, all the members were
appointed in individual basis. Many people criticize that the MWC lack accountability.
It seems that the MWC is responsible to decide the MW rate. But in fact the chief
executive is the real controller. She can appoint the members, accept or amend the
recommendation of the MWC. The existing MWC is still a black-room deal. We argue
that the decision was the result of the political negotiation, because the rate
depended very much on the indicators which the MWC concerned more. Also,
members of the public and mass media have no idea about the work of the MWC.
Thus, we stress that the existing mechanism cannot guarantee a thorough dialogue

51
among employer groups, employee groups and other parties. The administration
manipulatea the mechanism and can easily influence the decision of the MWC.
In view of this, the existing MW rate has not been decided merely by the PMWC or
the government. Trade unions and labour organizations have mobilized several
actions to raise the public awareness and support. Pressure from the outside of the
PMWC has played an important role in the process of decision making. However, it is
not an ideal way to discuss the MW rate. Because the (P)MWC cannot solve the
divergence of the employers and the employees within the committee. We believe
that only a transparent and accountable mechanism can ensure a reasonable rate.
Nonetheless, the existing statistics seem prove the function of the MW. Grassroots
workers get the higher pay rise than general workers. Although there is still no official
figures of the MW beneficiaries, it is believed that nearly 10 per cent of the
employed persons have got the pay rise in connection with the MW. At the same
time, employees who have higher salary level, seem not to encounter any change.
That means that the income gap between the lowest ranks and the lower middle
ranks is getting closer upon the implementation of the MW.
But we should not see the legislation as an ultimate victory of the workers, because
the MW Ordinance is merely a baseline and there is a lot room for improvement.
HK$28 per hour is not enough for the basic living, and the coverage is yet to be
satisfied.
We believe that the increase of the MW would more or less contribute to the overall
economy. According to the government figures, if the MW rate is increased to HK$33,
the overall wage bill will increase HK$5.5 billion. It is only equivalent to 1 per cent of
total wage bill, or 0.5 per cent of the total private consumption expenditure. It has
not much impact but at least a positive implication.
As we discussed in section 5, the MW is attracting more people to join the workforce.
In view of this, if the MW is increased, the supply of the labour will go up too.
At last, we would compare the statistics in Cambodia with Hong Kong. Table 7.1
compares the MW and the poverty line of both places. Although Hong Kong has
higher MW rate in absolute terms, it is only equivalent to 28 per cent of per capita
GDP. In contrast, the MW rate in Cambodia is equal to per capita GDP. It shows that
the MW in Hong Kong is still insignificant to the total wealth. If we look into the

52
comparison of the poverty line, Hong Kong seems to have a less poor population. But
we should not forget the GDP per capita of Hong Kong is 20 times of Cambodia’s. A
wealthy city still has nearly one fifth of the people who live in the poverty. Hong Kong
has a lot of rooms to increase the MW rate to alleviate the poverty.
Table 7.1: MW and the poverty line in Cambodia and Hong Kong
Cambodia Hong Kong
The MW rate US$61 per month (2010) Around US$746* per month
MW/GDP per capita 103.8 per cent (2007) 28.2 per cent
Poverty line 31 per cent (2007) 18 per cent
* Assuming eight hour work per day, 26 days per month
Source: CIA the World Factbook, https://www.cia.gov/library/publications/the-world-factbook/geos/cb.html; ILO, Global Wage
Report, 2008-2009,
http://www.ilo.org/wcmsp5/groups/public/---dgreports/---dcomm/documents/publication/wcms_100786.pdf
HKCTU and its affiliated unions have played a significant role in the MW campaign.
Similar strategies should be applied to bargain a higher level of MW for workers in
the future. In the context of Hong Kong, where the government is not fully
democratized and the right to collective bargaining is not enacted, a mixture of social
movement strategies and workplace organisation should be adopted in the wage
campaign. We would like to suggest the following points for the consideration of
trade union movement in Hong Kong.
Recommendations to trade unions in Hong Kong for wage increases
1) The MW setting mechanism states that the government should at least
review the rate for every two years. In other words, members of public need
to discuss the MW rate every time. Trade unions should prepare more
information, both local and international, for the wage discussion.
2) Besides argument and information, it is more important to organize and
mobilize workers and union members for better MW rate. Rallies, protests,
press conferences of revealing the low wage situation, etc. are common
strategies in Hong Kong in order to get public support and exert pressure to
the government. They are much more useful than solely lobbying the MWC.
3) The members of the CCR should be nominated by the concerned social
partners who represent the interest of workers and the employers.
4) Collective bargaining is the best way to protect workers wage
comprehensively. Therefore campaign for the regulations of the collective
bargaining should be the priority of the trade unions.
5) Similar to the MW campaign, it is impossible to get the legislation of the

53
collective bargaining from zero. Therefore, the campaign of the collective
bargaining should be first in corporation level. Organize more and more
corporate unions and mobilize union members in public campaign for
collective bargaining should be the first step. It is important to educate the
members how crucial the collective bargaining is. Thus, every member should
participate in the campaign.
6) One of important factors enabling the success of the MW campaign is
HKCTU’s alliance with the NGOs and civil society. Its strategy should be
maintained for both the campaigns for the legislation of collective bargaining
rights and the review of the MW.

54
Appendix 1 - List of interviewees
(in ascending order of date of interview)
Name of
interviewees
Background/ Organization Date of
interview
1. Mr. Lau Tat
Pong
Chairperson, Hong Kong Small and Medium
Enterprises Association
12 SEP 2011
2. Mr. Lee
Cheuk Yan
Elected member (Regional constituency) of
Legislative Council, Hong Kong Confederation of
Trade Unions
14 SEP 2011
3. Mr. Cheng
Kwok Hon
Dean of Business School, Hong Kong University of
Science and Technology, Former member of the
Provisional MW Commission
14 SEP 2011
4. Mr. Mong
Siu Tat
Chief Executive, Hong Kong Confederation of
Trade Unions
15 SEP 2011
5. Mr. Leung
Wai Yam
Union of Watsons’ Workers 19 SEP 2011
6. Mr. Au
Yeung Tat
Chor
Alliance for Reviewing Comprehensive Social
Security Assistance (CSSA) Scheme, People
Alliance for MW
28 SEP 2011
7. Ms. Chan
Suet King
and others
Cleaning workers in Hiu Lai Court, Sau Mau Ping 28 SEP 2011
8. Ms.
Catherine
Yan
Convenor of Environmental Services Contractors
Alliance (Hong Kong), President of Hong Kong Pest
Management Association, Managing Director of
Centuryan Environmental Services Group Ltd.
6 OCT 2011
9. Mr. Charles
Hui and
Ms.
Queenie Y
S Tang
Chief Labour Officer (Statutory MW) and Senior
Labour Officer (Statutory MW),
Labour Department, The Government of the Hong
Kong Administrative Region
7 OCT 2011
10. Ms. Leung
Tai Mui
Skilled Worker in a Chinese restaurant in Yuen
Long, responsible for making Dim Sum, Union of
Workers in Restaurants and Hotels, Hong Kong
Confederation of Trade Unions
12 OCT 2011
11. Ms. Dora
Lai
Chairperson of Cathay Pacific Airways Flight
Attendants Union (CPAFAU), Hong Kong
22 OCT 2011

55
Confederation of Trade Unions