a study to assess the effectiveness of informal
TRANSCRIPT

A COMPARATIVE STUDY TO ASSESS THE LIFE STYLE OF SCHOOL CHILDREN WITH NORMAL WEIGHT AND OVERWEIGHT IN A SELECTED
SCHOOL, AT COIMBATORE
M.Sc (NURSING) DEGREE EXAMINATION
BRANCH II– CHILD HEALTH NURSING
R.V.S COLLEGE OF NURSING
SULUR, COIMBATORE
THE TAMILNADU DR. M.G.R. MEDICAL UNIVERSITY
CHENNAI – 32
MASTER OF SCIENCE IN NURSING
(2008- 2010)
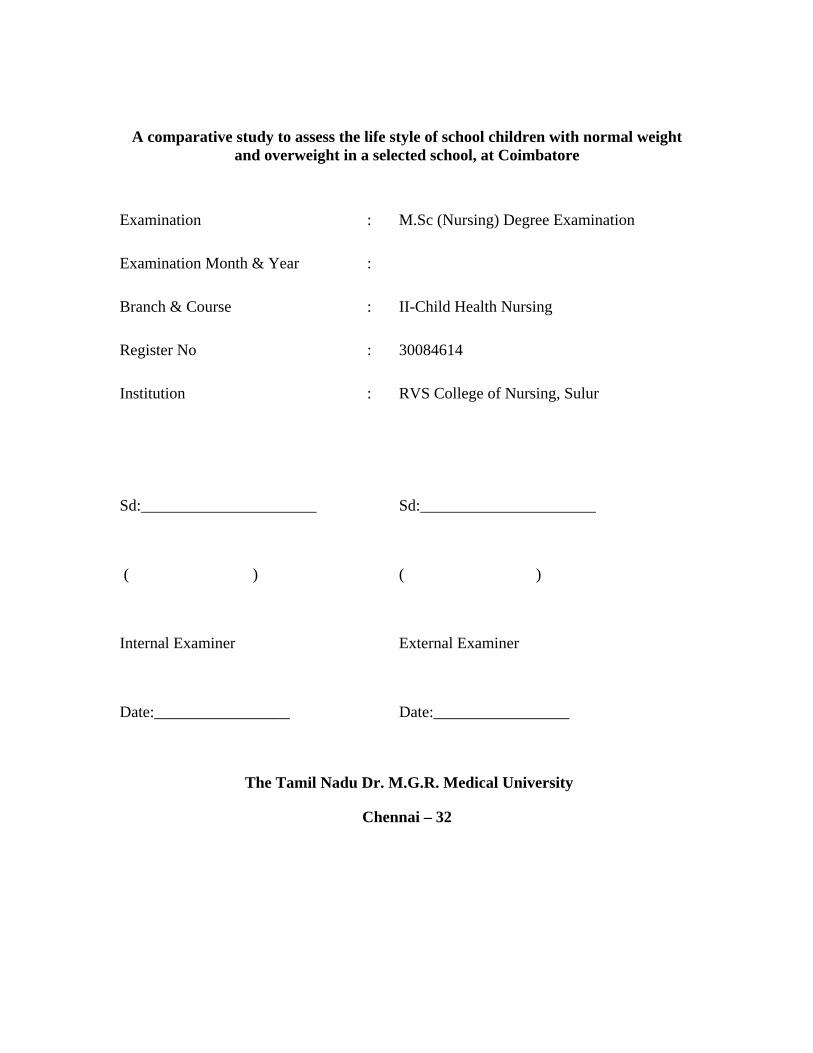
A comparative study to assess the life style of school children with normal weight and overweight in a selected school, at Coimbatore
Examination : M.Sc (Nursing) Degree Examination
Examination Month & Year :
Branch & Course : II-Child Health Nursing
Register No : 30084614
Institution : RVS College of Nursing, Sulur
Sd:______________________ Sd:______________________
( ) ( )
Internal Examiner External Examiner
Date:_________________ Date:_________________
The Tamil Nadu Dr. M.G.R. Medical University
Chennai – 32

ABSTRACT
A Comparative Study to assess the Lifestyle of School Children with
Normal Weight and Overweight in a Selected School at Coimbatore.
The aim of the study was to assess the physical activity/exercise of
normal weight and overweight children in and out of the school, their eating
pattern and to see whether there is any difference.
A descriptive comparative survey method was used in this study. The
study was conducted in R.V.S Matriculation School, Sulur. The study sample
were 50 children, 25 normal weight children and 25 overweight children studying
between 7th to 11th standard, selected by Convenience sampling method.
The tool consisted of 26 questionnaire regarding physical activity/exercise
and eating pattern. The study was based on “Health Belief Model”. The
questionnaire was handed over to both normal weight and overweight children
with adequate explanation with a request to fill and it return after filling the
questionnaire. The data was analyzed using descriptive and inferential statistics.
The findings of the study showed that majority of normal weight children
were engaged in physical activity/exercise compared to majority of overweight
children who were engaged in sedentary activities. 100% of normal weight
children scored good for eating habits where as 60% of overweight children
scored poor for eating habits. Mean score percentage of eating habits was higher
(92.5%) for normal weight children compared to only 75.63% for overweight
children.
ii
ACKNOWLEDGEMENT
I am immensely pleased to thank GOD ALMIGHTY, and everyone who
have been my source of inspiration and help throughout the course of
development of my dissertation.
First, I would like to appreciate the respondents who extended their co-
operation to conduct the study successfully.
With great privilege I extend my heart felt thanks and gratitude to
Prof. Dr. Annamma Prabhakar, M.Sc. (N), Ph.D, Visiting Professor, R.V.S
College of Nursing, Sulur for her innovative, constructive guidance, valuable
suggestions and continuous support given for completion of the study.
My sincere gratitude to Prof. Mrs. Mabel Shivakar, M.Sc. (N), Principal,
R.V.S College of Nursing, Sulur, Coimbatore, for extending her support to
conduct this study.
I extend my gratitude to Prof. Mrs. Saramma Samuel, M.Sc (N),
Vice Principal, for her guidance and valuable suggestions to conduct my study
successfully.
I express my special thanks to Mrs. Emerensia, M.Sc (N), Associate
Professor, Child Health Nursing Department, Coordinator and my guide R.V.S
College of Nursing, Sulur, Coimbatore for her valuable suggestions for
conducting my study in a successful way.
I extend my gratitude to Mrs. Nisha.S, M.Sc. (N), lectures, R.V.S
College of Nursing, for extending her support and valuable suggestions for
conducting my study in successful way.
I would like to take this opportunity to convey my sincere, whole hearted
gratitude to Mrs. Suba. G, M.Phil (Food and Nutrition) lecturer, for her
iii
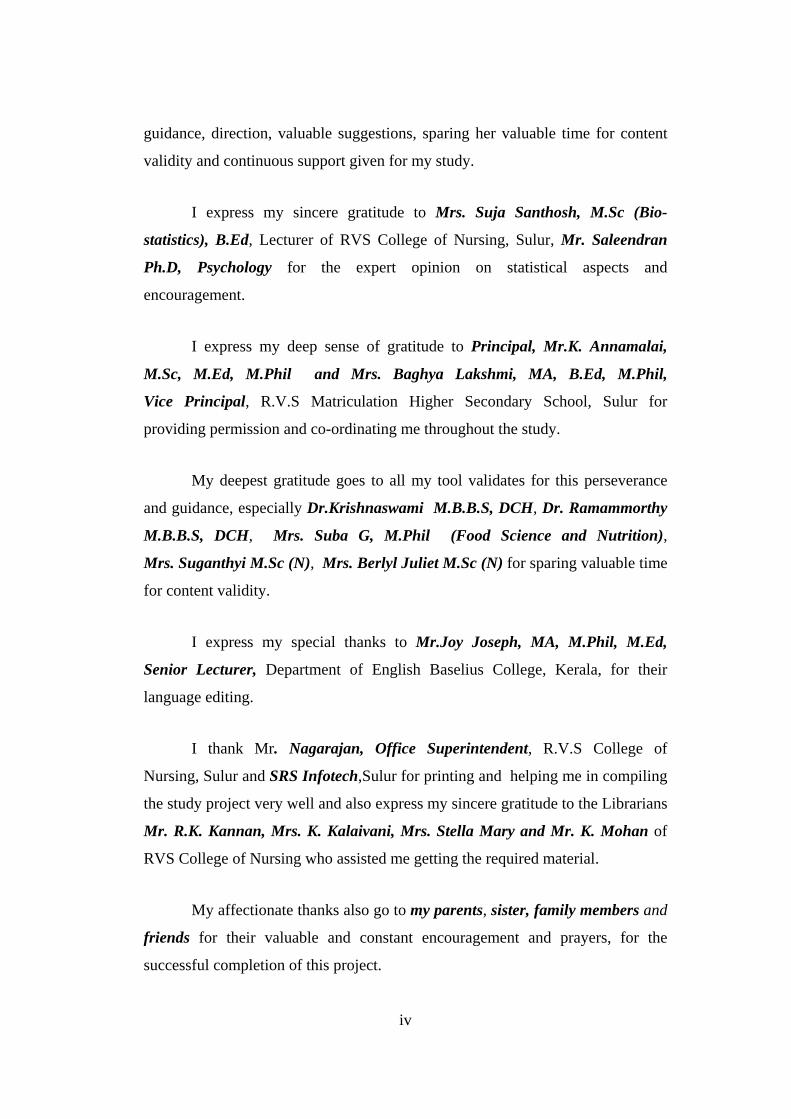
guidance, direction, valuable suggestions, sparing her valuable time for content
validity and continuous support given for my study.
I express my sincere gratitude to Mrs. Suja Santhosh, M.Sc (Bio-
statistics), B.Ed, Lecturer of RVS College of Nursing, Sulur, Mr. Saleendran
Ph.D, Psychology for the expert opinion on statistical aspects and
encouragement.
I express my deep sense of gratitude to Principal, Mr.K. Annamalai,
M.Sc, M.Ed, M.Phil and Mrs. Baghya Lakshmi, MA, B.Ed, M.Phil,
Vice Principal, R.V.S Matriculation Higher Secondary School, Sulur for
providing permission and co-ordinating me throughout the study.
My deepest gratitude goes to all my tool validates for this perseverance
and guidance, especially Dr.Krishnaswami M.B.B.S, DCH, Dr. Ramammorthy
M.B.B.S, DCH, Mrs. Suba G, M.Phil (Food Science and Nutrition),
Mrs. Suganthyi M.Sc (N), Mrs. Berlyl Juliet M.Sc (N) for sparing valuable time
for content validity.
I express my special thanks to Mr.Joy Joseph, MA, M.Phil, M.Ed,
Senior Lecturer, Department of English Baselius College, Kerala, for their
language editing.
I thank Mr. Nagarajan, Office Superintendent, R.V.S College of
Nursing, Sulur and SRS Infotech,Sulur for printing and helping me in compiling
the study project very well and also express my sincere gratitude to the Librarians
Mr. R.K. Kannan, Mrs. K. Kalaivani, Mrs. Stella Mary and Mr. K. Mohan of
RVS College of Nursing who assisted me getting the required material.
My affectionate thanks also go to my parents, sister, family members and
friends for their valuable and constant encouragement and prayers, for the
successful completion of this project.
iv
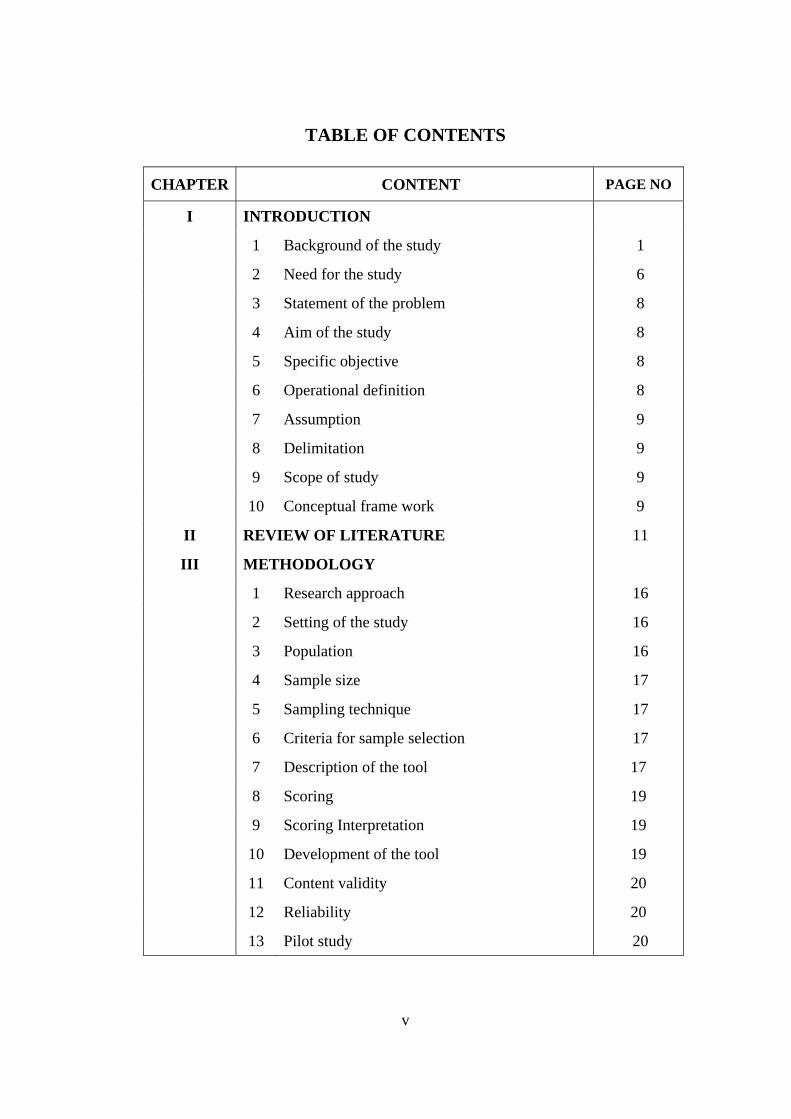
TABLE OF CONTENTS
CHAPTER CONTENT PAGE NO
I INTRODUCTION
1 Background of the study 1
2 Need for the study 6
3 Statement of the problem 8
4 Aim of the study 8
5 Specific objective 8
6 Operational definition 8
7 Assumption 9
8 Delimitation 9
9 Scope of study 9
10 Conceptual frame work 9
II REVIEW OF LITERATURE 11
III METHODOLOGY
1 Research approach 16
2 Setting of the study 16
3 Population 16
4 Sample size 17
5 Sampling technique 17
6 Criteria for sample selection 17
7 Description of the tool 17
8 Scoring 19
9 Scoring Interpretation 19
10 Development of the tool 19
11 Content validity 20
12 Reliability 20
13 Pilot study 20
v

CHAPTER CONTENT PAGE NO
14 Data collection procedure 21
15 Plan for data analysis 21
IV ANALYSIS AND INTERPRETATION 23
V DISCUSSION 55
VI SUMMARY, FINDINGS, CONCLUSION, IMPLICATION AND RECOMMENDATION 61
BIBLIOGRAPHY AND REFERENCES 66
APPENDICES 69
vi

LIST OF TABLES
S. NO TITLE PAGE NO
I Frequency and percentage distribution of normal weight and overweight children based on demographic characteristics
24
II Frequency and percentage distribution of samples based on Body Mass Index 30
III Frequency and percentage distribution of normal weight and overweight children in 3 categories of physical activity during games period at school
31
IV Frequency and percentage distribution of normal weight and overweight children in 3 categories of physical activity while at school
32
V
Frequency and percentage distribution of normal weight and overweight children according to category of physical activity after returning from school
34
VI
Frequency and percentage distribution of normal weight and over weight children according to categories of physical activity during weekend and holidays
35
VII Frequency and percentage distribution of normal weight and overweight children according to types of physical exercises
37
VIII Frequency and percentage distribution of normal weight and over weight children according to sedentary activities after returning from school
39
IX Frequency and percentage distribution of normal weight and over weight children according to mode of travel
41
X
Average duration of moderate and vigorous activity of normal weight and overweight children in and out of school and during weekend and holidays in hour per day.
43
XI Frequency and percentage distribution of normal weight and overweight children based on eating pattern at home
44
vii

S. NO TITLE PAGE NO
XII Frequency and percentage distribution of normal weight and overweight children based on number of meals per day
45
XIII Frequency and percentage distribution of normal weight and overweight children based on packed lunch
46
XIV Frequency and percentage distribution of normal weight and overweight children based on taking snacks while watching television
47
XV Frequency and percentage distribution of normal weight and overweight children based on items preferred to buy
48
XVI Frequency and percentage distribution of normal weight and overweight children based on purchase of soft drinks beverages from outside
49
XVII Frequency and percentage distribution of normal weight and overweight children based on frequency of food item purchased and intake of beverages
50
XVIII Mean score of eating habits and level of significance of normal weight and over weight children
52
XIX Frequency and percentage distribution of normal weight and overweight children based on level of eating habits
54
viii

LIST OF FIGURES
S. NO TITLE PAGE NO
I Conceptual frame work 10
II Frequency and percentage of samples based on Body Mass Index 30
III Three categories of physical activities of normal weight and over weight children 31
IV Percentage of normal weight and overweight children in three categories of physical activity while at school
33
V Percentage of normal weight and over weight children in three categories of physical activity during weekend and holidays
36
VII Percentage of normal weight and over weight children according to types of physical exercises 38
VIII Percentage of normal weight and overweight children according to sedentary activities after returning from school
40
IX (a) Percentage of normal weight and over weight children according to mode of travel to school 42
IX (b) Percentage of normal weight and over weight children according to mode of travel for other purpose
42
X
Average duration of moderate and vigorous activity of normal weight and over weight children in and out of school and during weekend and holidays in hour per day
43
XI Percentage of normal weight and over weight children based on eating pattern at home 44
XII Percentage of normal weight and over weight children based on items preferred to buy 48
XIII Percentage of normal weight and over weight children based on purchase of soft drinks beverages from outside
49
XIV Percentage of mean score of normal weight and over weight children 53
XV Percentage of normal weight and over weight children based on level of eating habits 54
ix

x


1
CHAPTER I
INTRODUCTION
BACKGROUND OF THE STUDY
“Prevention is better than Cure”
The most important thing in life is a good health. It is widely recognized that a
healthy childhood is the foundation for a healthy adult life. Infants and children
obviously need extra nutrition and proper physical activity and exercise for their growth
and they consume the best within the family set up for their growth. Good dietary
pattern is essential for building up bones. Habits formed in childhood have a long term
impact on health and wellbeing. In this present climate, it is important that children are
encouraged to engage in some form of physical activity on a regular basis. Nutrition and
activity levels have a key impact on children’s health and wellbeing. Children who
partake in regular physical exercise remain mentally alert and have enhanced level of
concentration, are more likely to be active adults, have a reduced risk of heart disease
and experience a boost in confidence and self-esteem. A normal weight is referred as
child is between 90 to 110% and above 110% referred as obesity (Gomez’
classification). Normal weight also indicated in terms of Body Mass Index. People with
Body Mass Index value between 18.5 to 25 are considered as having normal weight and
between 25 to 29 are considered as having obesity (World Health Organization 2004).
Strong bones, good muscle tone, and lower risk of developing chronic diseases
are some of the key benefits derived from regular physical activity. Further more, being
physically active promotes psychological wellbeing and reduces feelings of depression
and anxiety. Participation in physical activity tends to decline as children get older. To
maintain good health status, the “Dietary guidelines and Mypyramid” recommend that
children and adolescents engage in atleast 60 minutes of physical activity on most,
preferably all, days of the week (Foundation media Guide on Food Safety and
Nutrition 2007-2009).

2
Increased consumption of more energy dense nutrient, poor foods with high
levels of sugar and saturated fats, combined with reduced physical activity, have led to
an increase in obesity rates in some areas of North America, United Kingdom, Eastern
Europe, Middle East, and China. The obesity epidemic is not restricted to industrialized
societies, this increase is often faster in developing countries than in the developed
world.
Globally, there are more than 1 billion overweight adults, at least 300 million of
them obese and is a major contributor to the global burden of chronic disease and
disability. The prevalent rates of overweight and obesity among U.S children and
adolescents aged 6-11 and 12-19 years, respectively, were 15.3 and 15.5% in 1999-2000.
Overweight is arguably one of, if not the singly, most important problem affecting the
health and well being of many countries including India (World Health Organization
2009).
For most people, overweight and obesity are caused by not having the right
energy balance. Weight is balanced by the amount of energy or calories got from food
and drinks( this is called energy IN) equaling the energy, your body uses for things like
breathing, digesting, and being physically active (this is called energy OUT). To
maintain a healthy weight, energy IN and OUT don’t have to balance exactly every day.
It’s the balance over a period of time that helps you maintain a healthy weight. Over
weight and obesity happen over time when you take in more calories than use. There are
many factors that influencing overweight and obesity (National Institute of Health,
2000) and they are as follows:
Many Americans are not very physically active as compared to Indians. One of
the reasons is that many people spend hours in front of Television and Computers, doing
school work. In fact more than 2 hours a day of regular TV watching time has been
linked to overweight and obesity.
Other reasons for not being active are relying on cars instead of walking to
places, fewer physical demands at work or at home. Because of modern technology and

3
conveniences reduce the need to burn calories, and lack of physical education classes in
schools for children. Inactive lifestyle also raises risk for heart disease, high blood
pressure, diabetes, colon cancer and other health problems.
Environment does not always help with healthy lifestyle habits; in fact, it
encourages obesity and overweight. Some reasons are lack of neighborhood sidewalks
and safe places for recreation (not having area parks, trails, sidewalks and affordable
gyms make it hard for people to be physically active), work schedules (people often say
that they don’t have time to be physically active given the long hours at work), oversized
food portions (Americans are surrounded by huge food portions in restaurants, fast food
places, movie theaters, supermarkets and even home. Eating large portions means too
much energy IN. Over time, this will cause weight gain if it isn’t balanced with physical
activity), lack of access to healthy foods (some people don’t live in neighborhoods that
have supermarkets that shell healthy foods such as fresh fruits and vegetables), Food
advertising (Americans are surrounded by ads form food companies. Often children are
the targets of advertising for high – calorie, high fat snacks and sugary drinks).
Studies of identical twins that have been liaised apart show that genes have a
strong influence on one’s weight. Overweight and obesity tend to run in families. The
change of being overweight is greater if one or both of parents are overweight or obese.
On the other hand, if a family adopts healthy food and physical activity, obesity
reduces.
Sometimes hormonal problems cause overweight and obesity. Hypothyroidism is
a condition in which the thyroid gland does not make enough thyroid hormone. Lack of
thyroid hormone will slow down your metabolism and cause weight gain. Cushing
syndrome is a condition in which the body’s adrenal glands make too much of the
hormone cortical. People which Cushing’s syndrome gain weight, have upper body
obesity, a rounded face, fat around neck, and thin arms and legs.
Some people eat more than usual when they are bored, angry or stressed. Over
time, over eating will lead to weight gain and may cause overweight or obesity.

4
As get older, tend to lose muscle, especially if you are less active. Muscle loss
can slow down the rate at which body burns calories. It does not reduce calorie intake
that may gain weight in later ages. Many women gain around 5 pounds during
menopause and have more fat around the waist.
Lack of sleep is another factor. Studies find that the less people sleep, the more
likely they are to be overweight or obese. People who report 5 hours a night, for
example, are much more likely to become obese compared to people who sleep 7-8
hours a night. People who sleep fewer hours also seem to prefer eating foods that are
higher in calories and carbohydrates, which can lead to over eating, weight gain and
obesity over time. Hormones that are released during sleep will control the appetite and
the body’s use for energy. People who do not get enough sleep on a regular basis seem
to have high levels of a hormone called Ghrelin (which cause hunger) and low levels of
a hormone called Leptin (which normally helps to curb hunger).
Certain medicines such as corticosteroids (for example prednisone),
antidepressants (for example Elavil), and medicine for seizures (for example Neurontin)
may cause to gain weight. These medicines can slow the rate at which the body burns
calories, increase appetite or cause body to hold on to extra water – all of which can lead
to weight gain.
Some people gain weight when they stop smoking. The reason is nicotine raises
the rate at which the body burns calories, so burn fewer calories when they stop
smoking. Smoking is a serious health risk, and quitting is more important than possible
weight gain.
Epidemiological studies have shown a progressive increase in the incidence of
hypertension, diabetes mellitus, and coronary heart disease, sleep apnea syndrome, and
certain cancers in obese persons. Epidemiological and metabolic studies conducted over
the last 15 years have confirmed that a high proportion of abdominal fat is a major risk
factor for coronary heart disease, type 2 diabetes mellitus and related mortality.

5
The major reason for overweight during childhood are over consumption of junk
food, because most of these items are high on calories. It is postulated that consumption
of extra 100 calories per day will result in 5 kg weight gain in one year time. Another
important reason for overweight includes social lifestyle, lifestyle of family, no control
over watching television and using computers and lack of physical activity (World
Health Organization, 2000). A high degree of parental control of diet is linked to a
child’s inability to regulate food intake and to the amount of body fat. Hours of
television watching is associated with overweight in children over one fourth of children
report watching four or more hours of television per day. Children who ate more times
per day were less likely to be heavy than children who ate fewer times per day.
Being overweight or obese is not a cosmetic problem. It greatly raises the risk in
health consequences in adult. Some consequences (US Department of Health and
Human Services, 2007) are:-
An estimated of 300,000 premature deaths per year may be attributable to
obesity. Individuals who are obese (BMI ≥ 30), have a 50 – 100% increased risk of
premature death from all cause, compared to individuals with a healthy weight.
Heart problems such as heart attack, congestive heart failure, sudden cardiac
death, angina or chest pain and abnormal heart rhythm is increased in persons who are
overweight or obese BMI ≥ 25.
Weight gain of 11-18 pounds increases a person’s risk of developing type II
diabetes to twice that of individuals who have not gained weight. Over 80% of people
with diabetes are overweight or obese.
Overweight and obesity are associable with an increased risk for some types of
cancer including endometrial (cancer of the lining at the uterus) colon, gallbladder,
prostate, kidney and postmenopausal breast cancer. Women gaining more than 20
pounds from age 18 to midlife double their risk of post menopausal breast cancer,
compared to women whose weight remains stable. Overweight and obesity are

6
associated with increased risk of gall bladder disease, incontinence, increased surgical
risk and depression.
Sleep apnea is more common in obese persons. Obesity is associated with a
higher prevalence of asthma. For every 2 pound increase in weight, the risk of
developing arthritis is increased by 9-13% symptoms of arthritis can improve with
weight loss.
Risk factors for heart disease such as high cholesterol and high blood pressure
occur with increased frequency in overweight children and adolescents compared to
those with a healthy weight. Overweight adolescents have a 70% chance of becoming
overweight or obese adults. The most immediate Consequences of overweight, as
perceived by themselves, is social discrimination.
Being overweight and obesity are largely preventable. The key to success is to
achieve an energy balance between calories consumed and used. Effective weight
management for individuals and groups includes prevention, weight maintenance,
management of co-morbidities and weight loss.
Research over the past four decades suggests that childhood is a period when
dietary and lifestyle patterns are initiated, that has implications for coronary heart
disease and other morbidity risks in later adult life. Incidence of childhood obesity and
overweight is on the rise since last few decades and is still continuing to rise.
NEED FOR THE STUDY
Childhood is a period that markedly known for more of play and lot of fun. But
in the past few decades it was noted that children sit along hours in school, tuition, in
front of television or videogame or in travel and spend very little time for active physical
activity.
Parents and teachers also focused more on their academic activities and pay very
little attention towards their physical activity. Most of the time they forget that regular
7
physical activity is a good way to strengthen the bone, tone up their muscles and reduce
the risk for chronic degenerative diseases. It is important for their physical and mental
wellbeing, with heavy syllabus children struggle to cope up with their studies, hence
restrict their play time and spend more hours in studies which makes them sedentary and
it may predispose to overweight and obesity.
Whatever extra time they have always focusing on videogames and other indoor
games, sitting comfortably at home which makes them obese.
Prevalence of overweight and obesity among school children is gradually
increasing and hence action at right time is very essential. The problem is global and
increasingly expends into the developing world; for example in Thailand the prevalence
of obesity in 5 - 12 years old children rise from 12.2% - 15.6% in just two years.
Nurse, here is a guide to the family in treatment regimen such as behavioral
management especially decrease sedentary habits, watching TV for a longer time, adjust
child in family food pattern, never allow junk food for main food and incorporate
behavioral process slowly and gradually, preferably one at a time, restricting extreme
calorie is never suggested as it adversely effects/ growth and development and the
concept of normal eating (Sumitha Chakraborty, 2009).
The practice of school nursing began in the United States on October 1, 1902
when the initial role of the school nurse was to reduce absenteeism by intervening with
students and families regarding healthcare needs related to diseases. While the nurses
role has expanded gauntly form its original focus. Several roles of the school nurse are,
nurse can provide direct health care to students and staff, leadership for the provision of
health services, screening and referral far health conditions, promotes a healthy school
environment, promotes health, serves in a leadership role for health policies, serve as a
liaison school personnel, family, community, and health care, provide complete
information regarding behavioral management, family involvement and dietary
management and serve as a leadership role for school health program (National
Association of School Nurses, 2009).
8
Healthy children are successful learners. The nurse has a multi- faceted role
within the school selling, one that supports the physical, mental, social, emotional health
of students and their success in the learning process.
In view of the above magnitude of the problem, the Investigator realize that need
to know the lifestyle of children with normal weight and overweight are same or there
exists any difference. This motivates me to conduct a comparative study to assess the
lifestyle of school children with normal weight and overweight children in a selected
school at Coimbatore.
STATEMENT OF THE PROBLEM
A Comparative Study to assess the Lifestyle of School Children with Normal
Weight and Overweight in a Selected School at Coimbatore.
AIM OF THE STUDY
The aim of the study was to assess the physical activity / exercise of normal
weight and overweight children in and outside of school and their eating pattern at home
and outside in order to understand the similarities and differences of the two groups.
SPECIFIC OBJECTIVES
1. To assess the Body Mass Index of normal weight and overweight children.
2. To assess and compare the physical activity of normal weight and overweight
children in and out of school.
3. To assess and compare the eating pattern of normal weight and overweight children.
4. To compare the eating habits of normal weight and overweight children.
OPERATIONAL DEFINITION
Lifestyle:
It refers to the way a person or group of people live, including the place they live
in, the things they own, the kind of job they do, and the activities they enjoy. The current
study refers to the way of life especially physical activity, exercise and food habits.

9
Overweight:
It refers to the calculated body mass index for age which lies between 26-30
Normal weight:
It refers to the calculated body mass index for age which lies between 18 - 25.99
ASSUMPTION
• The children will have different / various lifestyle practices.
• Childhood overweight is a major contributing factor for cardio vascular problem,
endocrine disorders in adult life.
• The lifestyle of children is influenced by socio economic and cultural factors.
• Diet and exercise will have an impact on obesity.
DELIMITATION
The study is delimited to
School children in the age group of 12-16 years.
Studying in one school
Studying in standard between 7th to 11th
SCOPE OF THE STUDY
The study will highlight the physical activity, exercise pattern, dietary pattern
and sedentary activities among normal weight and overweight children. It will show
similarities and dissimilarities among normal weight and overweight children with
regard to physical activity in and out of school environment. By knowing this we can
identify the problems and helps take necessary action to prevent the present strategy.
CONCEPTUAL FRAMEWORK
Conceptual framework refers to interrelated concepts or abstraction that are
assembled together in some rational scheme by virtue of this relevance to a common
theme (Polit and Hunger-1999). The conceptual framework of this study is based on
Rosenstoch’s and Becker and Maimans’s (1975) “Health Belief Model”. Address the
relationship between a person’s belief and behavior. It provides a way of understanding
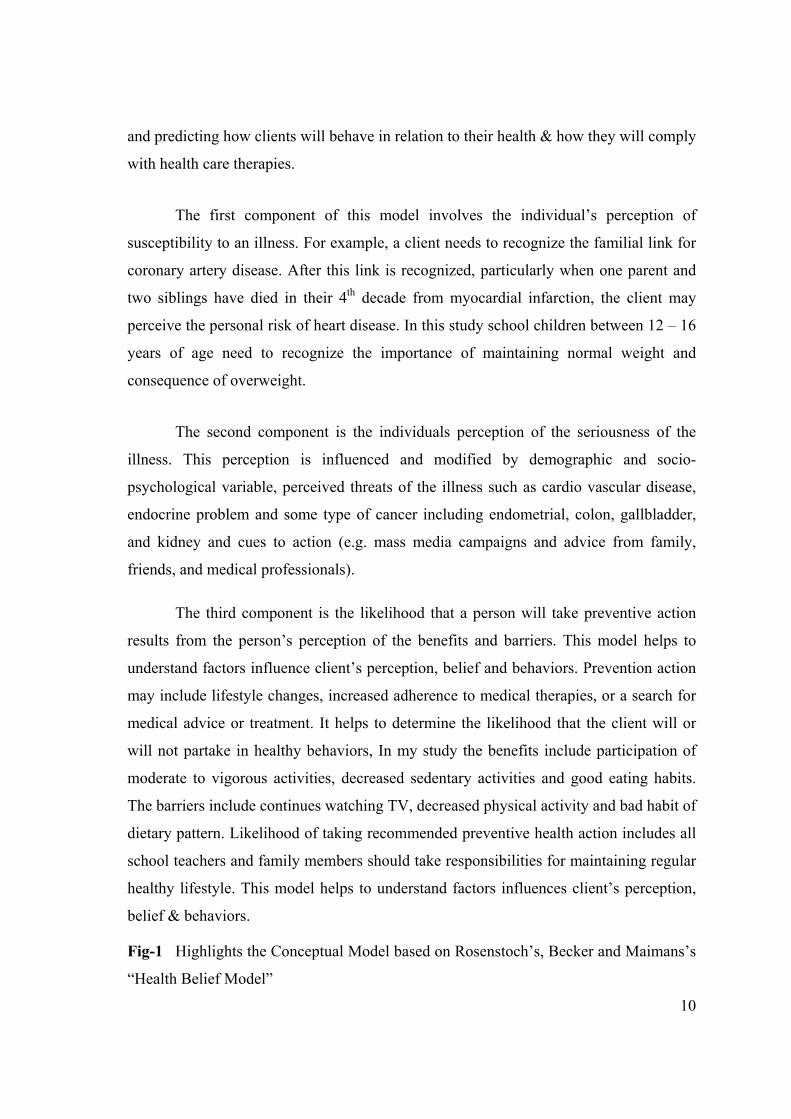
10
and predicting how clients will behave in relation to their health & how they will comply
with health care therapies.
The first component of this model involves the individual’s perception of
susceptibility to an illness. For example, a client needs to recognize the familial link for
coronary artery disease. After this link is recognized, particularly when one parent and
two siblings have died in their 4th decade from myocardial infarction, the client may
perceive the personal risk of heart disease. In this study school children between 12 – 16
years of age need to recognize the importance of maintaining normal weight and
consequence of overweight.
The second component is the individuals perception of the seriousness of the
illness. This perception is influenced and modified by demographic and socio-
psychological variable, perceived threats of the illness such as cardio vascular disease,
endocrine problem and some type of cancer including endometrial, colon, gallbladder,
and kidney and cues to action (e.g. mass media campaigns and advice from family,
friends, and medical professionals).
The third component is the likelihood that a person will take preventive action
results from the person’s perception of the benefits and barriers. This model helps to
understand factors influence client’s perception, belief and behaviors. Prevention action
may include lifestyle changes, increased adherence to medical therapies, or a search for
medical advice or treatment. It helps to determine the likelihood that the client will or
will not partake in healthy behaviors, In my study the benefits include participation of
moderate to vigorous activities, decreased sedentary activities and good eating habits.
The barriers include continues watching TV, decreased physical activity and bad habit of
dietary pattern. Likelihood of taking recommended preventive health action includes all
school teachers and family members should take responsibilities for maintaining regular
healthy lifestyle. This model helps to understand factors influences client’s perception,
belief & behaviors.
Fig-1 Highlights the Conceptual Model based on Rosenstoch’s, Becker and Maimans’s
“Health Belief Model”

Fig-1 Conceptual Model based on Rosenstoch’s, Becker and Maimans’s “Health Belief Model”
• Normal weight and overweight
• School age children between the age group of 12 – 16 years
• Lifestyle practices
Physical activity/ exercise.
Eating pattern
• Age • Sex • Educational
qualification of father and mother
• Occupation of father and mother
• Family income • Items at home • Food habits
a. *Perceived benefits of normal life style are participation of moderate to vigorous activities, decreased sedentary activities and good eating habits
b. * Perceived barriers are continues watching TV, decreased physical activity and bad habit of dietary
* Perceived threat of disease such as cardiovascular, endocrine problem etc
*Cues to action • Mass media • Newspaper • Magazines
Likelihood of taking recommended preventive health action include all school teachers and family members should take responsibilities for maintaining regular healthy lifestyle
INDIVIDUAL PERCEPTION MODIFIED FACTORS LIKELIHOOD OF ACTION
* excluded from the study

11
CHAPTER II
REVIEW OF LITERATURE
Review of literature is a systematic identification or scrutiny and summary of
written materials that contain information on research problems. This chapter presents
the related literature relevant to the problem under study.
Literature regarding lifestyle practice and overweight.
S Kumar et al. (2007) conducted a study to assess the prevalence of obesity and
its influencing factor among school children. A Cross sectional study followed by a case
control study was conducted in two schools of Davangere city India. A total of 1496,
school children studying between 5th and 10th standard aged between 10 and 15 years
were enrolled. Data on family history of obesity, diet, snacking habits and physical
activity was collected. The result shows that prevalence of obesity was more in girls
(8.82%) than boys (4.42%). Family history of obesity, snacking of high energy foods
and lack of physical activity were the important influencing factors of obesity.
Ashlesha Datar, Rolond Sturm and Jennifer L. Magnabosco (1998)
conducted a longitudinal study in California U.S on childhood overweight and academic
performance, a national study of kindergartners and first graders. The data analyzed
consisted of 11,192 first time kindergartners from early childhood. Multivariate
regression technique were used to estimate the independent association of overweight
status with childrens math and reading standardized test scores. The result showed
overweight children had significantly lower math and reading test scores compared with
non overweight children.
12
Annemarie Koster, Brenda W.J.H et al. (2001) conducted a study on “lifestyle
factors and incident mobility limitation in obese and non-obese older adults”. This study
examined the association between incident mobility limitation and 4 lifestyle factors:
smoking, alcohol intake, physical activity and diet. Random method was used in this
study. The data were collected from men and women of 70 to 79 years of age from
Pittsburgh, PA, and Memphis, participating in the Health, Aging and Body Composition
study. The results showed obese/overweight persons had a significantly higher risk of
mobility limitation compared with non obese persons, independent of lifestyle factors.
Marion. F. Zabinski, Brian & Saelens A.K (2003) conducted a study on
overweight children’s barriers to and support for physical activity compared with non
overweight children. Barriers and support for physical activity were examined among 84
overweight children attending a summer fitness camp. Random method was used in this
study. Barriers and support levels were compared with those of 80 non overweight
children. The results showed that overweight children, particularly girls, reported
significantly higher body related resource and social barriers to physical activity
compared with non overweight children and lower levels of adult support for physical
activity.
The National Health and Nutrition Examination Survey (1999-2002) used, a
stratified multistage probability sample and collected a broad array of data from a
nationally representative sample of US citizens. All children 3 – 17 years old were
included in this sample and they were categorized as at risk for overweight or greater
(>85%) or overweight (>95%) and household & childhood security/insecurity using the
US food security scale. The results showed when compared with children from food-
secure households, children from food insecure households were more likely to
demonstrate significant associations with being at risk for overweight. Gender, age &
family poverty index level, childhood food insecurity is associated with a child being at
risk for overweight status as greater.
Avula Laxmaiah et al. (1997) conducted a study on factors affecting prevalence
of overweight among schoolchildren in Hyderabad, India. The objective of the study
13
was to assess the prevalence of overweight and obesity. A cross-sectional and
institutional study, adopted a multistage stratified cluster sampling procedure was
carried out in this study on adolescents 12 to 17 years of age of both sexes. The findings
emphasized that regular physical exercise, doing household activities, regular physical
exercise and healthy eating behavior could contribute to controlling overweight. The
major conclusion drawn from this study is that physical inactivity, regular TV watching,
and overeating contributes to overweight. Low level of physical activity, watching TV &
consuming junk foods are associated with a high prevalence of overweight.
Diane berry, Marry Saroye et al (2007) conducted an experimental study on
“Multiethnic obese parents and overweight children at a middle school in United States.
A total sample of 80 parent child dyads were inducted into the study. The purpose of this
study was to determine the effects of the addition of copying skills training for obese
multiethnic parents whose overweight children were attending a weight management
program. All children and parents received the nutrition and exercise program (NEEP).
All children received formal exercise and behavior modification, and all parents were
encouraged to do exercise. Only the parents in the experimental group received
communication skills training (CST). At 6 months, parents in the experimental group
had significantly low BM1 and body fat percentage (BFP) and high number of
pedometer steps compared with those in the control group. Parents in the experimental
group also demonstrated significant improvement in interpersonal relationship, behavior
control and stress management. Children in the experimental group demonstrated trends
towards decreased Body Mass Index and Body fat percentage and used pedometer steps.
Raman K Marwaha et al (2006) conducted a study on Growth Parameters an
prevalence of overweight and obesity in school children from Delhi. A cross sectional
approach was used in this study in Government and private schools in Delhi. A total of
8840 (3566 boys, 5274 girls) from Government school and 12645 (6197 boys, 6448
girls) from private school formed the sample for this study. The subjects underwent
assessment of height and weight calculation of Body Mass Index. Prevalence of
overweight and obesity was assessed and compared between the two socio economic
groups. The results showed that a significant difference was noted in height, weight, and

14
Body Mass Index between low socio economic groups and upper socio economic
groups. The prevalence of overweight and obesity in upper socio economic status was
16.75% and 5.59% in boys and 19.01% and 5.03% in girls.
Gary S. Goldfield, Risa Mallory et.al (2007) conducted a study on effects of
modifying physical and sedentary behavior on psychosocial adjustment in
overweight/obese children. Thirty samples (13 boys, 17 girls) between 8-12 years of
overweight/obesity children participated in this study A randomized controlled trail
design was used. Results showed that, increases in Physical activity were associated
with increases in perceived physical conditioning, body satisfaction, overall physical
self-worth independent of changes in body mass index. Reductions in TV viewing were
also related to increased physical activity.
Gareth Stratton, Nicola D Ridgers (2007) conducted a study on physical
activity levels of normal weight and overweight girls and boys during primary school
recess. This study aimed to compare moderate to vigorous activity (MVPA) and
vigorous physical activity (VPA) in normal weight & overweight boys & girls during
recess. Four hundred twenty children, age 6-10 years were randomly selected from 25
schools in England. Three hundred seventy-seven children completed the study. Body
Mass Index was calculated from height and weight measurements, and heart rate reserve
threshold of 50% and 75% reflected children’s engagement in moderate vigorous
physical activity and vigorous physical activity, respectively. Results showed that,
normal weight girls were the less active group, compared with overweight boys and girls
who were equally active. Fifty one boys and 24 girls of normal weight achieved the 40%
threshold; of these, 30 boys and 10 girls exceeded 50% of recess time in moderate
vigorous physical activity. Eighteen overweight boys and 22 overweight girls exceeded
the 50% threshold.
Tebb, S.A and M.S. Moore (1999) conducted a study to assess the contribution
of a sedentary lifestyle and inactivity to the etiology of overweight and obesity; current
evidence and research issue. The data from etiological, cross sectional and prospective
studies that had assessed physical activity and dietary intake and their relationship to

15
bodyweight were reviewed. The results imply that the increase in the prevalence of
obesity is more strongly related to lower levels of physical activity than high energy
intakes. There is some evidence that both a high proportion of dietary fat and low levels
of physical activity may increase the likelihood of weight gain.
Rebecca Kuriyan et al (2007) conducted a study to associate television viewing
and sleep pattern with overweight children among urban and semi urban South Indian
children. A cross sectional Questionnaire based on 598 children aged 6-16 years (male
and female) recruited from children visiting St. Johns Medical College Bangalore for
vaccination and minor complaints. These children were studied for their physical
activity pattern, sleep duration, sedentary habits and eating behavior. The results showed
that decreased duration of sleep and increased TV viewing were significantly associated
with overweight children. Among the eating behavior, increased consumption of fried
foods was significantly associated with overweight children.
CONCLUSION
From the literature review it is quite evident that normal weight children were
engaged in more physical activity and normal eating pattern as compared to overweight
children. The literature review supported to organize the present study and construct the
tool appropriately to compare the lifestyle of normal weight and overweight children.

16
CHAPTER III
METHODOLOGY
Research methodology is a way to systematically solve the research problem.
This chapter explain the methodology adopted by the researcher to access the lifestyle of
school children with overweight and normal weight. It deals with research design
variables under study, settings of the study, population, sample size, sampling technique,
criteria for selection of sample, development of tool, pilot study and data collection
procedure.
RESEARCH APPROACH
A descriptive study is to observe, describe and document aspects of a situation as
it naturally occurs. The comparative study explain the difference in two groups.
(Polit & Hungler).
A descriptive and comparative survey approach was considered the best to assess
the physical activity/exercise and eating pattern of normal weight and overweight school
going children.
RESEARCH SETTING
The study was conducted in RVS Matriculation School which is located in Sulur,
Coimbatore, which has adequate facilities to provide education upto 12th standard. The
total strength of the school was 1306. Students are motivated to do all curricular and
extra curricular activities in the school. There are two physical educators working in this
institution. Students are getting games period 1to 3 times in a week. Those who are
studying in this institution come from middle to high class family. Nearby the school
fast food shops are available.
POPULATION
The population for this study included 514 school children from 7th to 11th
standard of RVS Matriculation School at Coimbatore. It included normal weight and
overweight children.

17
SAMPLE SIZE
The sample size for the present study was 50 children, 25 children with
overweight and 25 children with normal weight from 7th to 11th standard of the selected
Matriculation school.
SAMPLING METHOD/ TECHNIQUE
A non-probability convenience sampling technique was used to select the
samples. According to Body Mass Index classification the samples are classified into
Normal weight and Overweight children.
SAMPLING CRITERIA
The following were the criteria for selection of samples in the study.
Inclusion Criteria
School children of both sex.
Overweight and normal weight school children who were studying in 7th to 11th
standard.
Those who are willing to participate.
Exclusion Criteria
Children aged more than 16 years
Children who were physically handicapped.
DESCRIPTION OF TOOL
The tool used for this study was a structured questionnaire with 2 parts.
( Refer Appendix vi)
Part I: Consisted of selected demographic variables such as age, educational
qualification of father and mother, occupation of father and mother, family
income, items at home, family food type and items.

18
Part II: This part was developed to assess the lifestyle of samples in relation to physical
activities and eating pattern.
A) Physical activity/exercise:
This part of the tool were consisted of 15 multiple response questions.
All questions were used to know the type, frequency and duration of physical activities
in and out of school and mode of travel to school and for other purposes (visiting
friends, shopping)
The 1-3 questions were used to determine the type, frequency and duration of
physical activity during games period at school, 4th and 5th question were focused at
school, 6th-10th question were used to assess the type, frequency and duration of physical
activities at home. The 11th and 12th questions were used to know the type, frequency
and duration of physical exercises. The mode of travel to school and for other purposes
(visiting friends and shopping) were determined by question number 13 to 15.
B) Eating pattern.
This part consisted of 11 multiple response questions to know the eating pattern
of samples.
Question number 16 to 18 were used to found the skipping of food and to know
the pattern of meal question number 19 were used. Question number 20 and 21 were
used to know the types of snacks taken by the samples while watching television.
Question number 22 to 26 were giving information regarding pocket money, type and
frequency of taking fried items, fast food, sweets and soft drinks beverages.
19
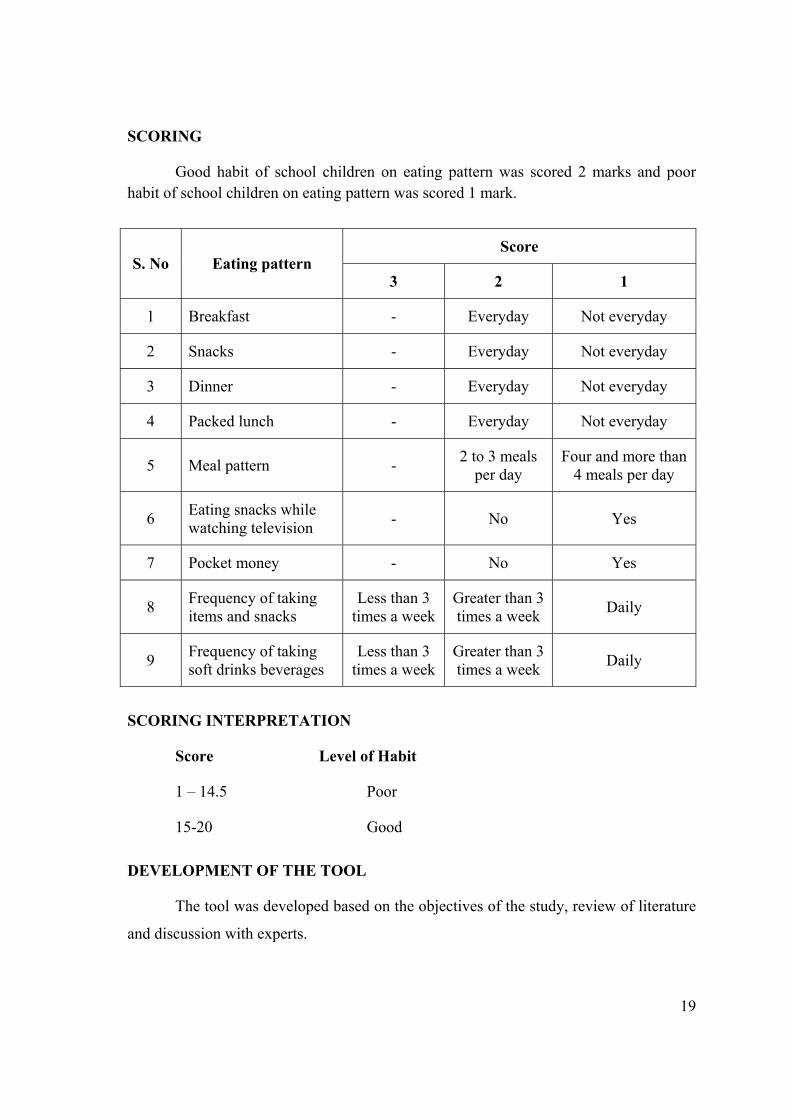
SCORING
Good habit of school children on eating pattern was scored 2 marks and poor habit of school children on eating pattern was scored 1 mark.
Score S. No Eating pattern
3 2 1
1 Breakfast - Everyday Not everyday
2 Snacks - Everyday Not everyday
3 Dinner - Everyday Not everyday
4 Packed lunch - Everyday Not everyday
5 Meal pattern - 2 to 3 meals per day
Four and more than 4 meals per day
6 Eating snacks while watching television - No Yes
7 Pocket money - No Yes
8 Frequency of taking items and snacks
Less than 3 times a week
Greater than 3 times a week Daily
9 Frequency of taking soft drinks beverages
Less than 3 times a week
Greater than 3 times a week Daily
SCORING INTERPRETATION
Score Level of Habit
1 – 14.5 Poor
15-20 Good
DEVELOPMENT OF THE TOOL
The tool was developed based on the objectives of the study, review of literature
and discussion with experts.

20
CONTENT VALIDITY
Content validity refers to the degree to which an instrument measures what it is
intended to measure (Polit and Hungler-1999).
In order to establish the content validity, the tool was given to 2 nursing experts,
1 nutritionist and two medical experts.
The two nursing experts were Masters in Nursing with Child Health Nursing
Specialization and with 5-6 years of experience, one working as the Head of the Child
Health Nursing Department and the other as Associate Professor in a college of nursing
at Coimbatore. The nutritionist was a M.Phil in Food and Nutrition, with 12 years of
experience working as a Head of Nutrition Department in R.V.S College of Nursing, at
Coimbatore.
The medical experts were a Consultant Pediatricians with 15 years of experience
and holding Charge of Masonic Children Hospital and RVS Multi-Specialty hospital in
Coimbatore.
RELIABILITY
The reliability of the tool was established by the test retest method. The tool was
administered to ten samples. The retest was given after a gap of 7 days. The reliability
was checked by Karl Pearson’s correlation coefficient method. The ‘r’ value was 0.89
which suggested a high reliability and stability of the instrument.
PILOT STUDY
In order to find out the practicability and feasibility of the tool, pilot study was
carried out by obtaining prior permission from the Principal and class teacher of 7th
standard which was selected for the main study, R.V.S Matriculation School. For the
pilot study 5 normal weight and 5 overweight school children were selected based on
their Body Mass Index value (World Health Organization 2004) and who met the
inclusion criteria. Samples were selected by convenience sampling method.
21
The class teacher arranged one room for filling the questionnaire. The purpose of
the study was individually explained to the samples by the investigator and
questionnaire was given with a request to fill and it return after filling the questionnaire
and not to share the information’s with any other. The investigator personally collected
the filled questionnaire. Both groups of children found it easy to fill the questionnaire.
Hence no modification was required in the tool & technique.
DATA COLLECTION PROCEDURE
Before commencing the data collection permission was obtained from the
Principal and class teachers from 7th to 11th standard of R.V.S Matriculation School,
Coimbatore for conducting the main study.
The investigator selected 25 normal weight and 25 overweight children on the
basis of Body Mass Index value (World Health Organization 2004) and who met the
inclusion criteria. All sample were selected by convenient sample method.
The investigator contacted the children both overweight & normal weight school
children personally and established support by engaging in informal talk. The purpose of
the study was explained and obtained their willingness. The class teacher arranged one
room for filling the questionnaire according to the free time and the class teachers
convenience they have allowed time for the investigator for conducting the study and the
investigator personally given the questionnaire to the samples with the request to fill and
return after filling the questionnaire and given the instruction that not to share the
information with any other. The investigator personally collected the filled
questionnaire. The study was done from 29.06.2009 to 29.07.2009. During this period
the investigator stayed in the school from 9am to 4pm.
DATA ANALYSIS
The responses collected from the respondents were edited and tabulated.
The data was analyzed using descriptive statistics and inferential statistics.

22
Descriptive Statistics (Frequency, Percentage)
The data was analyzed by using frequency and percentage to describe
Demographic variables. It was used to assess the physical activities in and out of school,
physical exercises and eating pattern adopted by both normal weight and overweight
children.
Inferential Statistics
Chi square was used to assess the association of physical activities/exercise with
normal weight and overweight children and ‘t’ test was used to assess the level of
significant difference of eating habits.


23
CHAPTER IV
ANALYSIS AND INTERPRETATION OF DATA
James A Fain (2003) defines data analysis as the systematic organization and
synthesis of research data and the listing of research hypothesis using those data.
Abdullah and Levin (1979) have stated that interpretation of tabulated data can
bring to light the real meaning of the findings of a study.
This chapter deals with the analysis and interpretation of data collected from 25
normal weight and 25 overweight children from R.V.S Matriculation Higher Secondary
School.
The data have been analyzed and presented comparatively for normal weight and
overweight children under the following headings.
1. Demographic characteristics of normal weight and overweight children.
Demographic characteristics such as age of the child, sex, education and occupation
of father and mother, family income, items at home and food habits of family.
2. Distribution of samples based on Body Mass Index
3. Lifestyle among normal weight and overweight children.
Lifestyle has been analyzed in two categories. Analysis of physical activity/ exercise
for the normal weight and overweight children in frequency and percentage and
analysis of dietary pattern for the normal weight and overweight children in
frequency and percentage.
4. Data on comparison between normal weight and overweight children on physical
activity / exercise and dietary pattern.
24
TABLE – I (a)
FREQUENCY AND PERCENTAGE DISTRIBUTION OF NORMAL WEIGHT
AND OVERWEIGHT CHILDREN BASED ON DEMOGRAPHIC
CHARACTERISTICS
N=50
Normal weight N = 25
Over weight N = 25 S. No Demographic characteristics
F % F % 1 Age
12 – 13 13 – 14 14 – 15 15 – 16
5 12 5 3
20.0 48.0 20.0 12.0
6 10 5 4
24.0 40.0 20.0 16.0
2 Sex Male Female
14 11
56.0 44.0
17 8
68.0 32.0
3 Items at home 1. Computer 2. Television 3. Car 4. Bike 5. Cycle 6. Exercising equipments
7 25 5 18 24 1
28.0 100.0 20.0 72.0 96.0 4.0
15 25 6 23 24 8
60.0 100.0 25.0 92.0 96.0 32.0
4 Food habits 1. Vegetation 2. Occasionally non-vegetarian 3. Mostly non-vegetarian 4. Ovo vegetarian
2 21 1 1
8.0 84.0 4.0 4.0
1 19 2 3
4.0 76.0 8.0 12.0
5 Food intake of family 1. Cereals 2. Pulses 3. Vegetables 4. Milk and milk products 5. Sweets 6. Non vegetarian
25 25 25 25 25 23
100.0 100.0 100.0 100.0 100.0 92.0
25 25 25 25 25 25
100.0 100.0 100.0 100.0 100.0 100.0
Table I (a) presents the demographic characteristics of both normal weight and
overweight.
25
Age
Distribution of samples based on age was similar for both the categories. Twenty
percentage of the normal weight children and 24% of the overweight children were
between 12-13 years of age. Forty eight percentage of the normal weight children as
well as 40% of overweight children were in the group of 13-14 years. Twenty
percentage of normal weight and 20% of overweight children were from 14-15years of
age and 12% of normal weight and 16% of overweight children were between 15-16%.
Sex
Based on sex majority of samples (56% of normal weight and 68% of
overweight) were male and only 44% of normal weight and 32% of overweight children
were female.
Items at home
Both normal weight and over weight (100%) children were having television at
home. Majority (96%) of normal weight and overweight children were having cycle,
72% of normal weight children and 92% of over weight children were having bike. Sixty
percentage of overweight and 28% of normal weight children were having computer at
home. Twenty five percentage of overweight and 20% of normal weight children were
having car. Only 32% of overweight children and 4% of normal weight children were
having exercise equipments at home.
Food habits
Majority of normal weight (84%) and overweight children (76%) were
occasionally non vegetarian. Very few normal weight (8%) and overweight children
(4%) were vegetarian. Eight percentage of normal weight and 20% of overweight
children were non vegetarian and ovo vegetarian.
26
Food intake of the family
All the normal weight and overweight children were taking cereals, pulses,
vegetables, milk and milk products and sweets. Majority of normal weight (92%) and
overweight children (100%) were taking non vegetarian foods.

27
TABLE – I (b)
FREQUENCY AND PERCENTAGE DISTRIBUTION OF NORMAL WEIGHT
AND OVERWEIGHT CHILDREN BASED ON DEMOGRAPHIC
CHARACTERISTICS
N = 50
Normal weight N = 25
Over weight N = 25 S. No Demographic
characteristics F % F %
1 Educational qualification Father Primary Middle Secondary Graduate Mother Illiterate Primary Middle Secondary Graduate
1 6 7 11 1 3 7 11 3
4.0 24.0 28.0 44.0
4.0 12.0 28.0 44.0 12.0
0 5 4 16 0 2 6 3 14
0
20.0 16.0 64.0
0
8.0 24.0 12.0 56.0
2 Occupation Father Professionals Self employers Govt. employers Private sector employers Other Mother Working Nonworking
9 12 3 1 0 3 22
36.0 48.0 12.0 4.0
0
12.0 88.0
11 9 2 2 1 16 9
44.0 36.0 8.0 8.0
4.0 64.0 36.0
3 Family income 5001 – 10,000 Above 10,000
9 16
36.0 64.0
3 22
12.0 88.0
Table I (b) presents the demographic characteristics of both normal weight and
overweight.

28
Educational qualification
Father
Majority of fathers of normal weight children (44%) and over weight children
(64%) were graduate. Twenty eight percentage fathers of normal weight children and
16% overweight children had secondary education. Twenty four percentage fathers of
normal weight and 20% fathers of overweight children had middle school education.
Four percentage fathers of normal weight children had primary education.
Mother
Only 12% of mothers of normal weight children and 8% of mothers of
overweight children had primary education. Twenty eight percentage of mothers of
normal weight and 24% mothers of overweight children had middle school education.
Majority of mothers of normal weight children (44 %) and only 12% of mothers of
overweight children had completed secondary school education. Majority (56%)
mothers of overweight children had graduate and 12% in normal weight children.
Occupation
Father
Forty eight percentage fathers of normal weight and 36% of fathers of
overweight children were self employers. Majority (44%) of fathers of overweight
children and 36% of fathers of normal weight children were professionals. Twelve
percentage fathers of normal weight and 8% of fathers of overweight children were
Government employees. Four percentage fathers of normal weight and 12% fathers of
overweight children were working in private sector.
Mother
Majority (64%) of mothers of overweight children were working and only 12%
of them of normal weight children. In the normal weight children majority (88%) of
mothers were nonworking compared to only 32% of mothers in overweight categories
29
Family income
Majority of the families (88 %) of overweight children and 64 % normal weight
children had income level above Rs.10, 000. Only 36 % of families of normal weight
children and 12 % of overweight children had income level between Rs.5, 000 to
10,000.
30
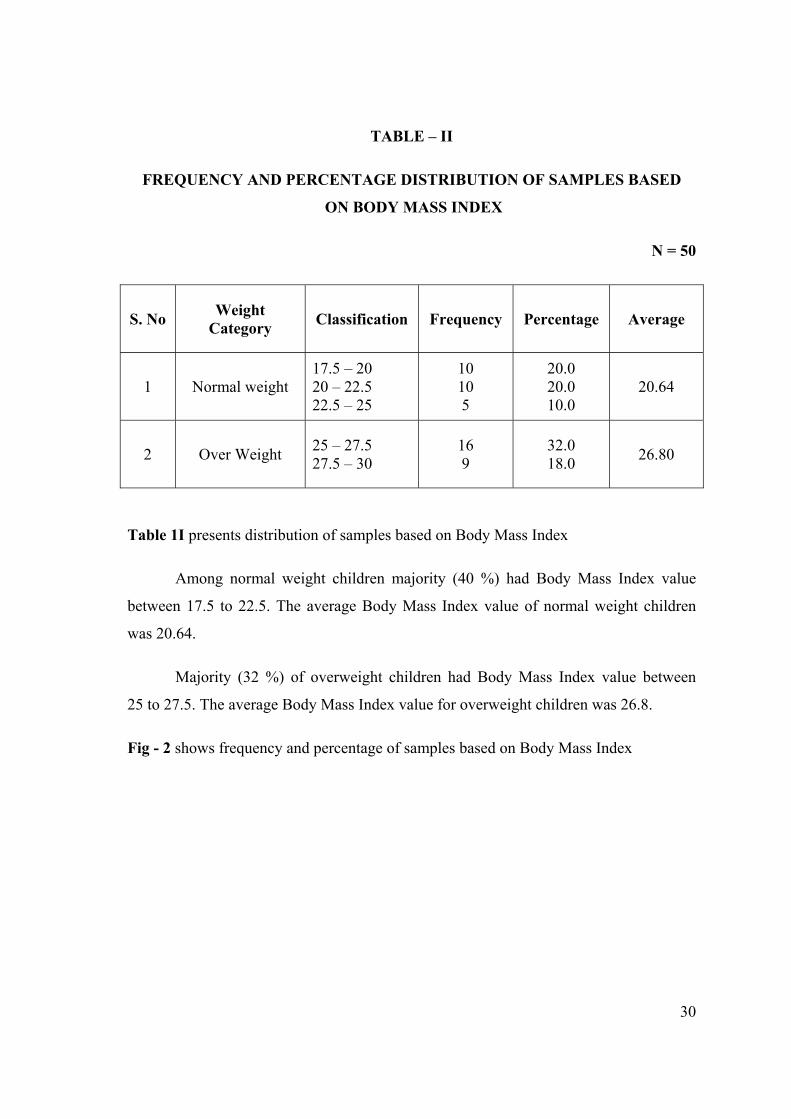
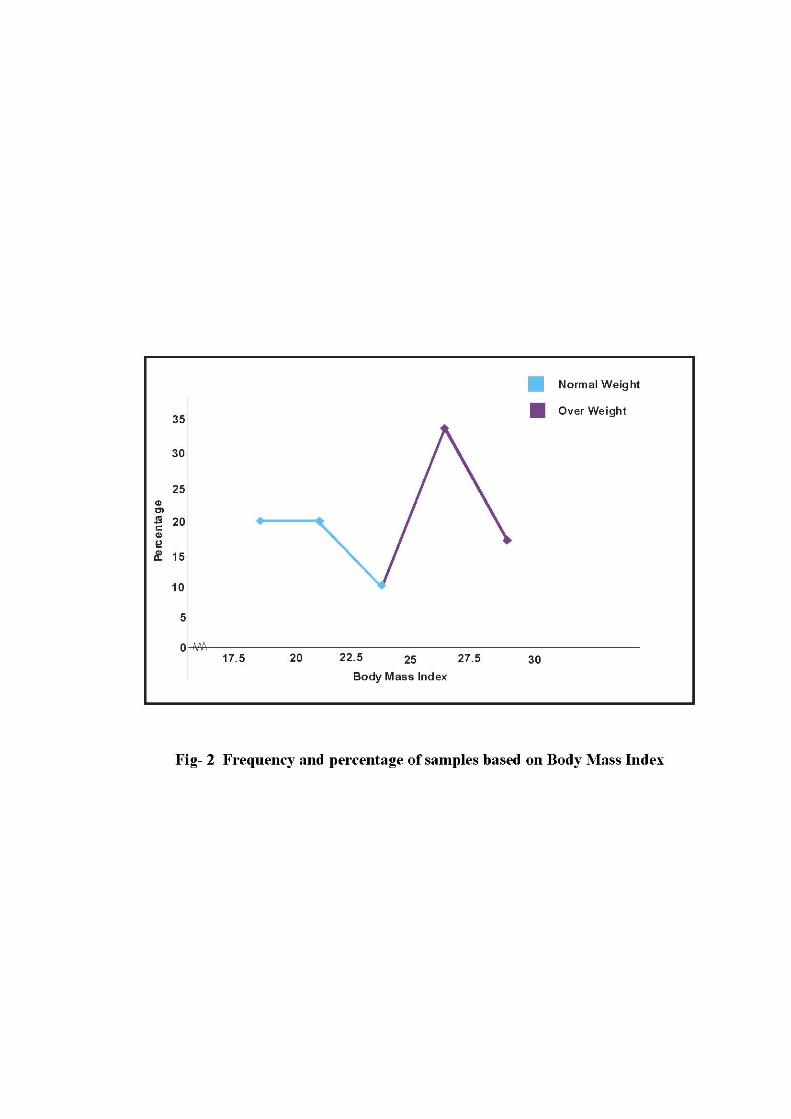
TABLE – II
FREQUENCY AND PERCENTAGE DISTRIBUTION OF SAMPLES BASED
ON BODY MASS INDEX
N = 50
S. No Weight Category Classification Frequency Percentage Average
1 Normal weight 17.5 – 20 20 – 22.5 22.5 – 25
10 10 5
20.0 20.0 10.0
20.64
2 Over Weight 25 – 27.5 27.5 – 30
16 9
32.0 18.0 26.80
Table 1I presents distribution of samples based on Body Mass Index
Among normal weight children majority (40 %) had Body Mass Index value
between 17.5 to 22.5. The average Body Mass Index value of normal weight children
was 20.64.
Majority (32 %) of overweight children had Body Mass Index value between
25 to 27.5. The average Body Mass Index value for overweight children was 26.8.
Fig - 2 shows frequency and percentage of samples based on Body Mass Index
31
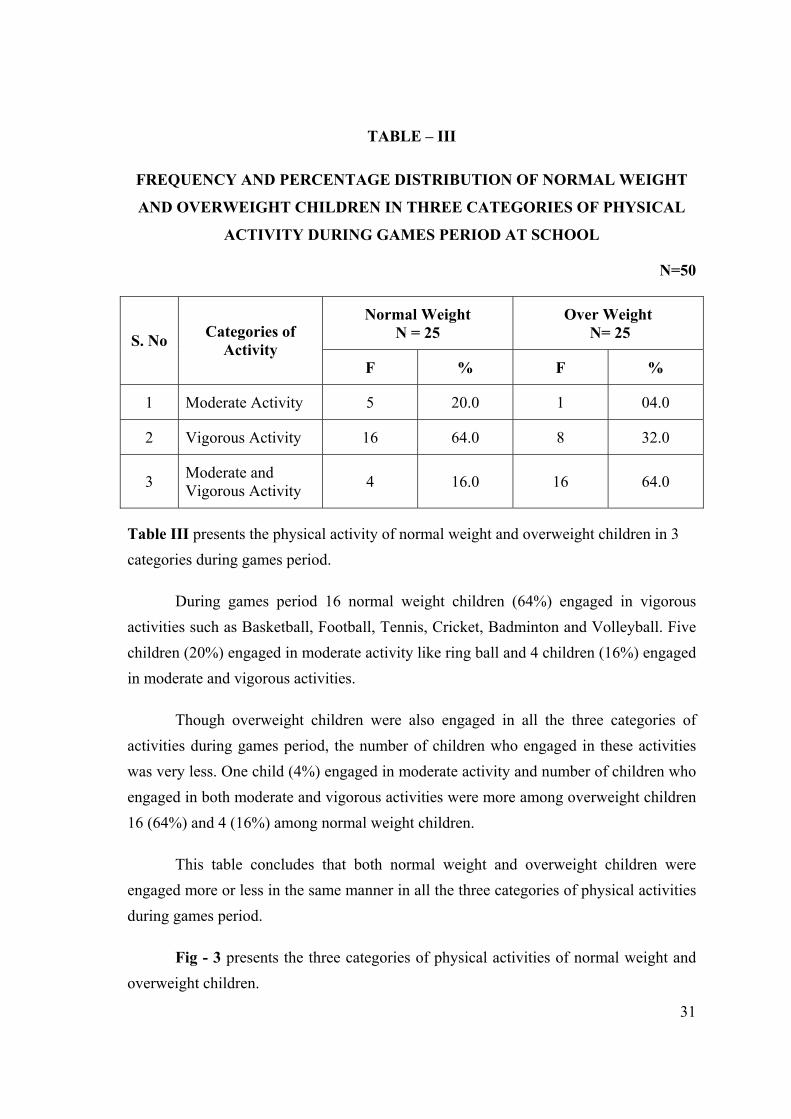
TABLE – III
FREQUENCY AND PERCENTAGE DISTRIBUTION OF NORMAL WEIGHT
AND OVERWEIGHT CHILDREN IN THREE CATEGORIES OF PHYSICAL
ACTIVITY DURING GAMES PERIOD AT SCHOOL
N=50
Normal Weight N = 25
Over Weight N= 25 S. No Categories of
Activity F % F %
1 Moderate Activity 5 20.0 1 04.0
2 Vigorous Activity 16 64.0 8 32.0
3 Moderate and Vigorous Activity 4 16.0 16 64.0
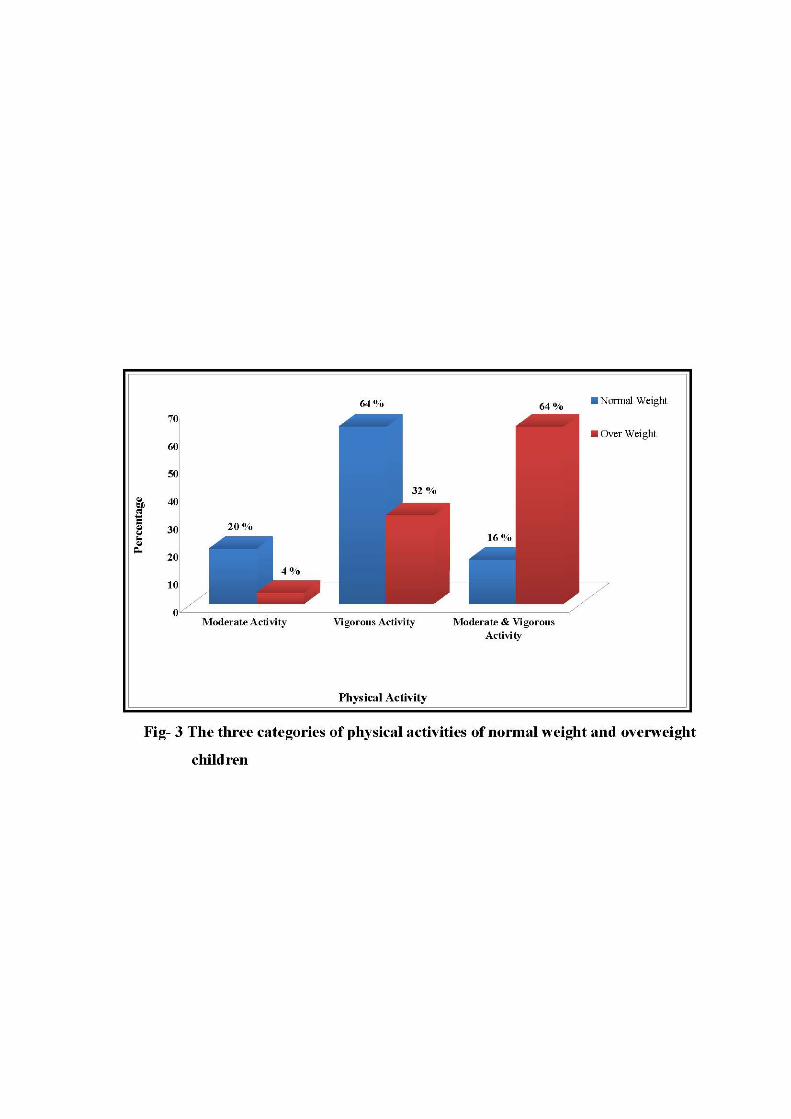
Table III presents the physical activity of normal weight and overweight children in 3 categories during games period.
During games period 16 normal weight children (64%) engaged in vigorous activities such as Basketball, Football, Tennis, Cricket, Badminton and Volleyball. Five children (20%) engaged in moderate activity like ring ball and 4 children (16%) engaged in moderate and vigorous activities.
Though overweight children were also engaged in all the three categories of activities during games period, the number of children who engaged in these activities was very less. One child (4%) engaged in moderate activity and number of children who engaged in both moderate and vigorous activities were more among overweight children 16 (64%) and 4 (16%) among normal weight children.
This table concludes that both normal weight and overweight children were engaged more or less in the same manner in all the three categories of physical activities during games period.
Fig - 3 presents the three categories of physical activities of normal weight and overweight children.
32
TABLE – IV
FREQUENCY AND PERCENTAGE DISTRIBUTION OF NORMAL WEIGHT
AND OVERWEIGHT CHILDREN IN THREE CATEGORIES OF PHYSICAL
ACTIVITY WHILE AT SCHOOL
N=50
Normal Weight N = 25
Over Weight N= 25 S. No At School Categories
of Activity F % F %
χ² P 0.05 df 1
1 Before school begins
Vigorous Activity 11 44.0 - -
2 During lunch
Moderate Activity Vigorous Activity
1 9
4.0 36.0
2 6
8.0 24.0
3 After school is over
Moderate Activity Vigorous Activity
1 18
4.0 72.0
1 4
4.0 16.0
2.65ns
ns – not significance df- degree of freedom Table value 3.84
Table IV presents the physical activities of normal weight and overweight children
while at school.
Physical activity is seen among school children before school begins, during
lunch and after school is over. Eleven (44%) normal weight children were engaged in
vigorous activities such as football, tennis, throw ball, basketball and badminton before
school begins.
Vigorous activities were seen among 9 (36%) and 18 (72%) of normal weight
children during lunch and after school was over. Comparatively vigorous activity during

33
lunch hour and after school was over was seen only among 6 and 4 overweight children
(24-16%). Moderate activity during lunch and after school was seen only among 1-2
children of both the groups.
It appears that normal weight children engage more in vigorous activities than
overweight children while at school.
From the table it was noted that there was no significant difference between the
two categories of physical activity during lunch and after school is over among normal
weight and over weight children.
Fig - 4 presents the percentage of normal and overweight children in 3 categories
of physical activity while at school

34
TABLE – V
FREQUENCY AND PERCENTAGE DISTRIBUTION OF NORMAL WEIGHT
AND OVERWEIGHT CHILDREN ACCORDING TO THE CATEGORIES OF
PHYSICAL ACTIVITY AFTER RETURNING FROM SCHOOL
N = 50
Normal Weight N = 25
Over Weight N= 25 S. No At Home
F % F %
1 Indoor Games Light Activities 3 12.0 3 12.0
2
Outdoor Games Moderate Activities Vigorous Activities Moderate and vigorous activity
2 2 2
8.0 8.0 8.0
2 2 2
8.0 8.0 8.0
3 Indoor and Outdoor Games 11 44.0 5 20.0
Table V presents the categories of physical activity while at home.
After returning from school 6 normal weight children (24%) engaged in outdoor
games such as basketball, cricket, football, kho-kho, volleyball and ring ball, 3 children
(12%) engaged in Indoor games such as chess, caroms, cards and videogames and 11
children (44%) engaged in indoor and outdoor games.
Similarly overweight children engaged in all these three categories of activities
after returning from school. Four children (16%) engaged in outdoor games such as
cricket, football, basketball and shuttle, 3 children (12%) engaged in indoor games such
as videogames, chess, cards and caroms and 5 children (20%) were engaged in indoor
and outdoor games.
This table concludes that majority of normal weight children were engaged in
outdoor and indoor and outdoor games as compared to overweight children. More or less
both normal weight and overweight children were engaged in indoor games.

35
TABLE – VI
FREQUENCY AND PERCENTAGE DISTRIBUTION OF NORMAL WEIGHT
AND OVER WEIGHT CHILDREN ACCORDING TO CATEGORIES OF
PHYSICAL ACTIVITY DURING WEEKEND AND HOLIDAYS
N = 50 Normal Weight
N = 25 Over Weight
N= 25 S. No Activity
F % F %
χ² P 0.05 df 3
1 Vigorous activity 8 32 1 4
2 Moderate activity 3 12 5 20
3 Light activity 6 24 16 64
4 Vigorous and Moderate activity 8 32 3 12
9.24ns
ns – not significance df-degree of freedom Table value 7.82
Table VI presents the categories of games played during weekend and holidays
During weekend and holidays 8 normal weight children (32%) were engaged in
vigorous activities such as basketball, football, tennis, cricket and volleyball. Three
children (12%) engaged in moderate activities such as ring ball and hide and seek. Six
children (24%) engaged in light activities such as caroms, chess and videogames and 8
children (32%) engaged in vigorous and moderate activities.
Comparatively vigorous activity, vigorous and moderate activity were seen only
among 4 (16 %) overweight children as against 16 normal weight children. Moderate
activity was seen more among over weight children (20%) where as it was seen only
upto 12% normal weight children. Interestingly light activity was seen more among over
weight children 16 (64 %).

36
There was a significant difference noted between the types of physical activity
among normal weight and over weight children during weekend and holidays.
(df 3, CV 9.24, TV 7.82)
Fig - 5 shows percentage of normal and over weight children in categories of
physical activity during weekend and holidays


37
TABLE – VII
FREQUENCY AND PERCENTAGE DISTRIBUTION OF NORMAL WEIGHT
AND OVERWEIGHT CHILDREN ACCORDING TO
TYPES OF PHYSICAL EXERCISES
N = 50
Normal Weight N = 25
Over Weight N= 25 S. No Activities
F % F %
χ² P 0.05 df 6
1 Walking 21 84.0 9 36.0
2 Swimming 4 16.0 1 4.0
3 Jogging 7 28.0 5 20.0
4 Gymnastic 3 12.0 0 0.0
5 Yoga 5 20.0 1 4.0
6 Bicycle 24 96.0 17 68.0
7 Dancing 7 28.0 2 8.0
8 Karate 4 16.0 3 12.0
1.17ns
ns – not significance df-degree of freedom Table value 14.07
Table VII presents the type of physical exercises.
Physical exercises such as walking and bicycling were seen among 21-24
(84 – 96%) normal weight children. In all other activities which was moderate, vigorous
type such as Swimming, Jogging Gymnastic Dancing and Karate 3-7 normal
weight (12-28 %) children were engaged.
In contrast, in walking 9(36 %) and bicycling 17(68 %), of the overweight
children participated. Only 1-5 overweight children (4-20 %) engaged in all other
activities.

38
This table clearly shows that normal weight children engaged more in all forms
of physical exercise compared to over weight children
There was no significant difference noted between the types of physical exercise
among normal weight and over weight children
Fig - 6 shows percentage of normal weight and overweight children according to
types of physical exercises


39
TABLE – VIII
FREQUENCY AND PERCENTAGE DISTRIBUTION OF NORMAL WEIGHT
AND OVER WEIGHT CHILDREN ACCORDING TO SEDENTARY
ACTIVITIES AFTER RETURNING FROM SCHOOL
N = 50
Normal Weight N = 25
Over Weight N= 25 S. No Activities
F % F %
χ² P 0.05 df 7
1 Watching TV 5 20.0 16 64.0
2 Using Computer 2 4.0 8 32.0
3 Listening Music 5 20.0 16 64.0
4 Doing Home Work 5 20.0 16 64.0
5 Reading Book 5 20.0 13 52.0
6 Going for Tuition 3 12.0 9 36.0
7 Chitchatting with Family Members 3 12.0 14 56.0
8 Chitchatting with Friends 2 8.0 12 48.0
0.67ns
ns – not significance df-degree of freedom Table value 14.07
Table VIII presents the sedentary activities after returning from school
After returning from school 5 normal weight children (20%) engaged in
sedentary activities such as watching TV, listening music, doing homework and reading
books. Only 2-3 normal weight children (4-12 %) engaged in activities such as going for
tuition, chitchatting with family members and friends and using computers.
In contrast 16(64%) overweight children were engaged in watching TV, listening
music and doing home work. Reading books, chitchatting with family members and
friends, was seen more among overweight children (56% and 48%). Going for tuition,

40
using computers also were seen more among overweight children (36and32%
respectively).
This table concludes that overweight children engage more in sedentary activities
compared to normal weight children.
There was no significant difference noted between the type of sedentary
activities after returning from school among normal weight and over weight children.
Fig - 7 shows percentage of normal and overweight children according to
sedentary activities after returning from school

TABLE – IX
FREQUENCY AND PERCENTAGE DISTRIBUTION OF NORMAL WEIGHT
AND OVERWEIGHT CHILDREN ACCORDING TO MODE OF TRAVEL
N =50
Normal Weight N = 25
Over Weight N= 25
S. No Mode of travel
F % F %
χ² P 0.05 df 3
1 To school
Walk
Auto/ car/ school bus/ bike
Private bus
Bicycle
10
7
2
6
40.0
28.0
8.0
24.0
2
7
2
14
8.0
28.0
8.0
56.0
6.852ns
2 Other purpose
Walk
Auto/ car/ school bus/ bike
Private bus
Bicycle
17
1
3
5
68.0
4.0
8.0
20.0
1
9
2
13
4.0
36.0
8.0
52.0
20.372*
Table value 7.82
* - significance , df-degree of freedom ns – not significance
Table IX presents the mode of travel to school and for other purpose.
41

42
Majority of the normal weight children (40 %) were going to school by walking,
24% by bicycling and rest by auto/ car/ school bus/ bike and private bus. For other
purposes such as shopping and visiting friends, majority (68%) of normal weight
children preferred walking, 20 % children went by bicycling and only 4 - 8 % of
children went by auto/ car/ school bus/ bike and private bus.
Whereas majority (56%) of overweight children went to school by bicycle.
Thirty six percentage of overweight children went to school by auto/ car/ school
bus/ bike and private bus and only 8% went by walking.
This table concludes that for school or for other purposes, walking was common
mode of transport for majority of normal weight children compared to overweight
children.
There was no significant difference noted between the mode of travel to school
among normal weight and over weight children.
There was a significant difference noted between the mode of travel for other
purposes among normal weight and over weight children (df 3, CV 20.372, TV 7.82).
Fig - 8a shows percentage of normal and overweight children according to mode
of travel to school.
Fig - 8b shows percentage of normal and overweight children according to mode
of travel for other purposes.


43
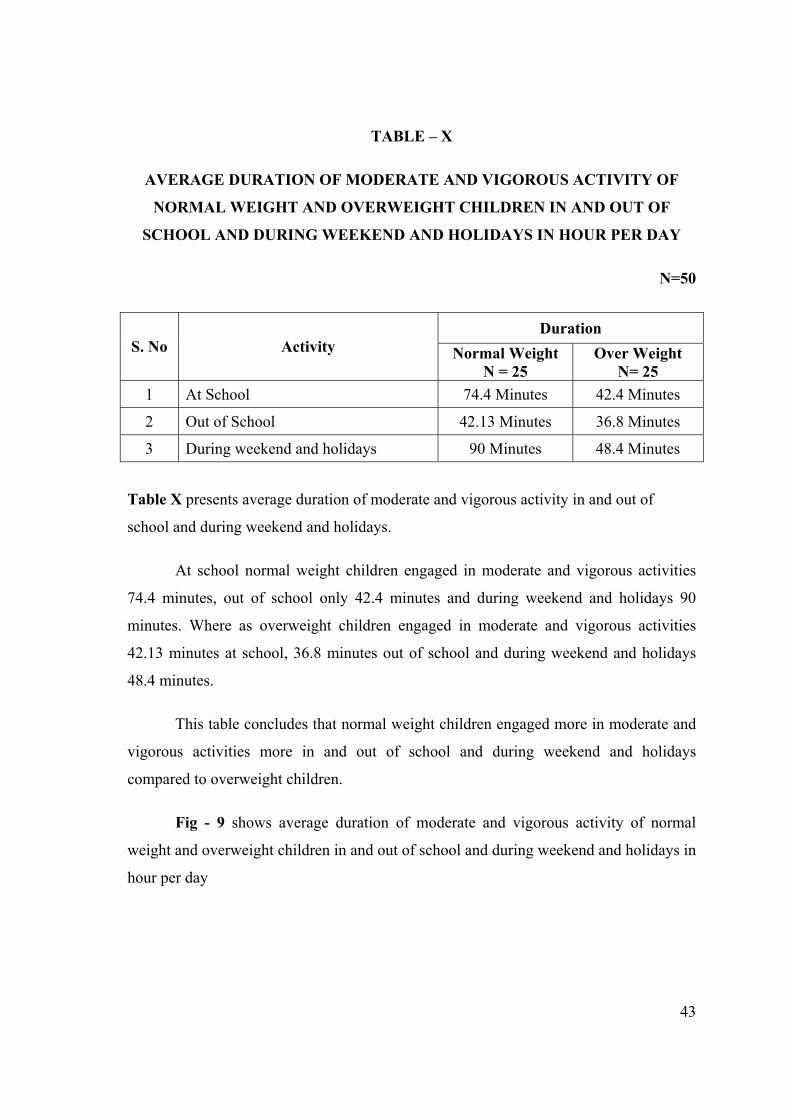
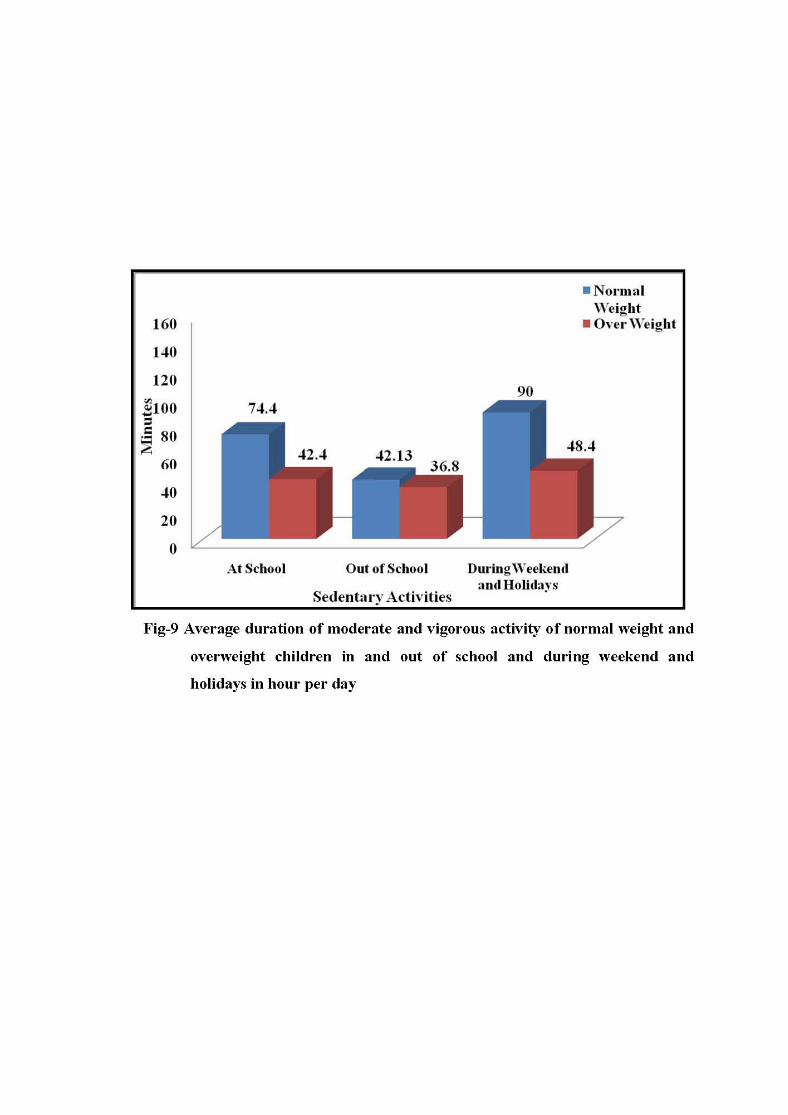
TABLE – X
AVERAGE DURATION OF MODERATE AND VIGOROUS ACTIVITY OF
NORMAL WEIGHT AND OVERWEIGHT CHILDREN IN AND OUT OF
SCHOOL AND DURING WEEKEND AND HOLIDAYS IN HOUR PER DAY
N=50
Duration S. No Activity Normal Weight
N = 25 Over Weight
N= 25 1 At School 74.4 Minutes 42.4 Minutes
2 Out of School 42.13 Minutes 36.8 Minutes
3 During weekend and holidays 90 Minutes 48.4 Minutes
Table X presents average duration of moderate and vigorous activity in and out of
school and during weekend and holidays.
At school normal weight children engaged in moderate and vigorous activities
74.4 minutes, out of school only 42.4 minutes and during weekend and holidays 90
minutes. Where as overweight children engaged in moderate and vigorous activities
42.13 minutes at school, 36.8 minutes out of school and during weekend and holidays
48.4 minutes.
This table concludes that normal weight children engaged more in moderate and
vigorous activities more in and out of school and during weekend and holidays
compared to overweight children.
Fig - 9 shows average duration of moderate and vigorous activity of normal
weight and overweight children in and out of school and during weekend and holidays in
hour per day

44
TABLE XI
FREQUENCY AND PERCENTAGE DISTRIBUTION OF NORMAL WEIGHT
AND OVERWEIGHT CHILDREN BASED ON EATING PATTERN AT HOME
N=50
Normal Weight N = 25
Over Weight N= 25 S. No Eating pattern
F % F %
1 Breakfast
Every day 25 100 21 84.0
Not everyday 0 4 16.0
2 Evening Snacks
Every day 25 100 20 80.0
Not everyday 0 5 20.0
3 Dinner
Every day 25 100 50 80.0
Not everyday 0 5 20.0
Table XI presents the pattern of normal weight and overweight weigh children in three
categories.
Among normal weight children, all (100 %) were taking breakfast, evening
snacks and dinner everyday. Where as in the overweight children only 84 % took
breakfast, 80% took snacks and dinner every day. The eating pattern of 16-25 % of
overweight children was irregular.
This table concludes that the normal weight children had regular eating pattern
(taking breakfast, evening snacks and dinner) compared to overweight children.
Fig - 10 shows percentage of normal weight and overweight children based on
their eating pattern at home.


45
TABLE XII
FREQUENCY AND PERCENTAGE DISTRIBUTION OF OVERWEIGHT
AND NORMAL WEIGHT CHILDREN BASED ON
NUMBER OF MEALS PER DAY
N=50
Normal Weight (N=25) Over Weight (N=25) S. No Number of meals
F % F %
1 2 Meals 19 76.0 1 4.0
2 3 Meals 6 24.0 15 60.0
3 4 Meals 0 0 8 32.0
4 Above 4 Meals 0 0 1 4.0
Table XII presents the number of meal pattern of normal weight and overweight
children in four categories.
Among normal weight children majority (76%) had two meals pattern and 24%
had three meal pattern per day. Majority (60%) of overweight children had three meals,
more than three meals (4-32 %) per day.
From the table was noted that the number of meals per day may have some
connection with the body weight of the sample.

46
TABLE XIII
FREQUENCY AND PERCENTAGE DISTRIBUTION OF NORMAL WEIGHT
AND OVERWEIGHT CHILDREN BASED ON PACKED LUNCH
N=50
Normal Weight (N=25)
Over Weight (N=25) S. No Pattern
F % F %
1 Taking packed lunch to school
Everyday 21 84.0 22 88.0
Not everyday 4 16.0 3 12.0
2 Eating packed lunch
Everyday 20 80.0 21 84.0
Not everyday 5 20.0 4 16.0
Table XIII presents taking and eating packed lunch among normal weight and
overweight children.
Majority of the normal weight children took packed lunch (84%) and ate those
packed lunch (80%). Under overweight category also majority (88%) of the samples
took packed lunch and ate the packed lunch (84%).
From the data it was noted that similarity exists between two groups based on
packed lunch.
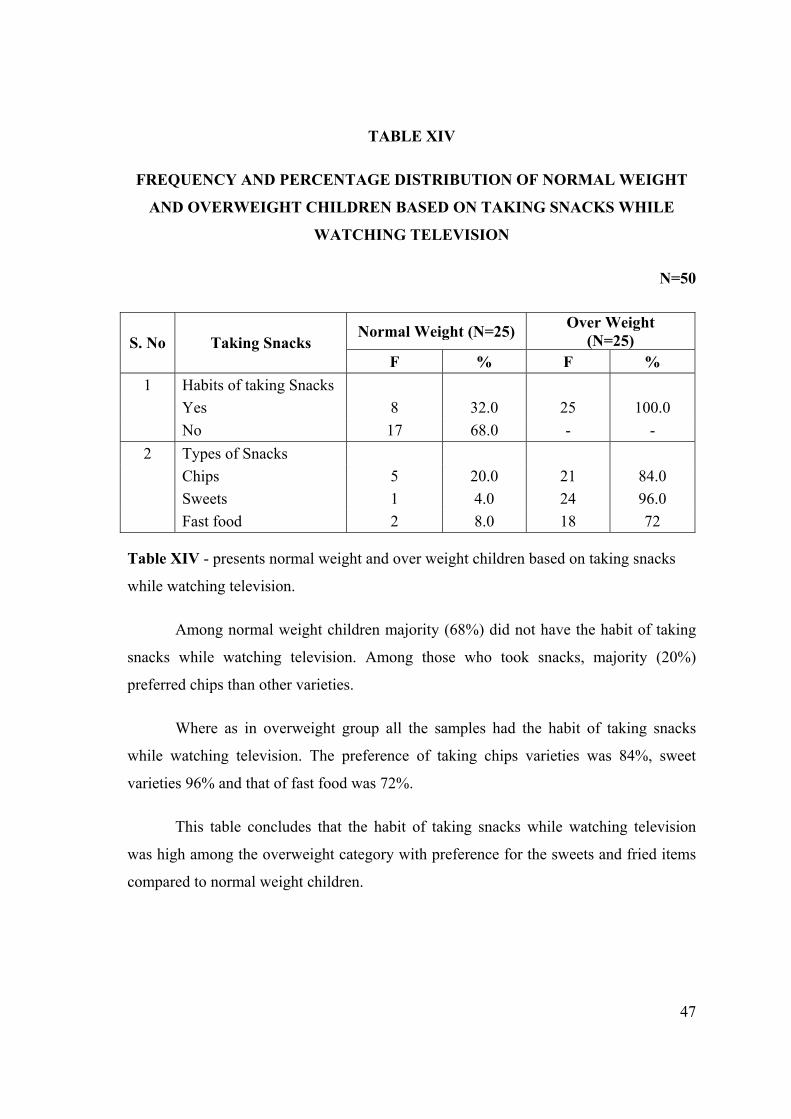
47
TABLE XIV
FREQUENCY AND PERCENTAGE DISTRIBUTION OF NORMAL WEIGHT
AND OVERWEIGHT CHILDREN BASED ON TAKING SNACKS WHILE
WATCHING TELEVISION
N=50
Normal Weight (N=25) Over Weight (N=25) S. No Taking Snacks
F % F % 1 Habits of taking Snacks Yes 8 32.0 25 100.0 No 17 68.0 - - 2 Types of Snacks Chips 5 20.0 21 84.0 Sweets 1 4.0 24 96.0 Fast food 2 8.0 18 72
Table XIV - presents normal weight and over weight children based on taking snacks
while watching television.
Among normal weight children majority (68%) did not have the habit of taking
snacks while watching television. Among those who took snacks, majority (20%)
preferred chips than other varieties.
Where as in overweight group all the samples had the habit of taking snacks
while watching television. The preference of taking chips varieties was 84%, sweet
varieties 96% and that of fast food was 72%.
This table concludes that the habit of taking snacks while watching television
was high among the overweight category with preference for the sweets and fried items
compared to normal weight children.

48
TABLE XV
FREQUENCY AND PERCENTAGE DISTRIBUTION OF NORMAL WEIGHT AND OVERWEIGHT CHILDREN BASED ON ITEMS PREFERRED TO BUY
N=50
Normal Weight (N=25) Over Weight (N=25) S. No Items
F % F %
1 Berger - - 8 32.0
2 Noodles 3 12.0 15 60.0
3 Chips 20 80.0 16 64.0
4 Balepoori 5 20.0 6 24.0
5 Ice Creams 3 12.0 24 96.0
6 Chocolates 4 16.0 24 96.0
7 Halva 0 - 2 8.0
8 Cakes 0 - 17 68.0
9 Pizza 0 - 10 40.0
Others
10 Biscuits 1 4 - - Table XV Presents normal weight and over weight children based on items preferred to buy
Among the normal weight samples 80% preferred chips, 20% balepoori, 16%
chocolates, 12% Ice creams or Noodles and 1% biscuits.
Among overweight samples majority (96%) preferred Ice Creams and
chocolates, 68% preferred cakes, 64% chips, 60% noodles, 40% Pizza, 32% burger, 24%
balepoori and 8% Halva.
From this table it was noted that the preference shown by the overweight
children for the fried items, fast food items and sweets were very high compared to
normal weight children.
Fig - 11 shows percentage of normal weight and overweight children based on
items preferred to buy
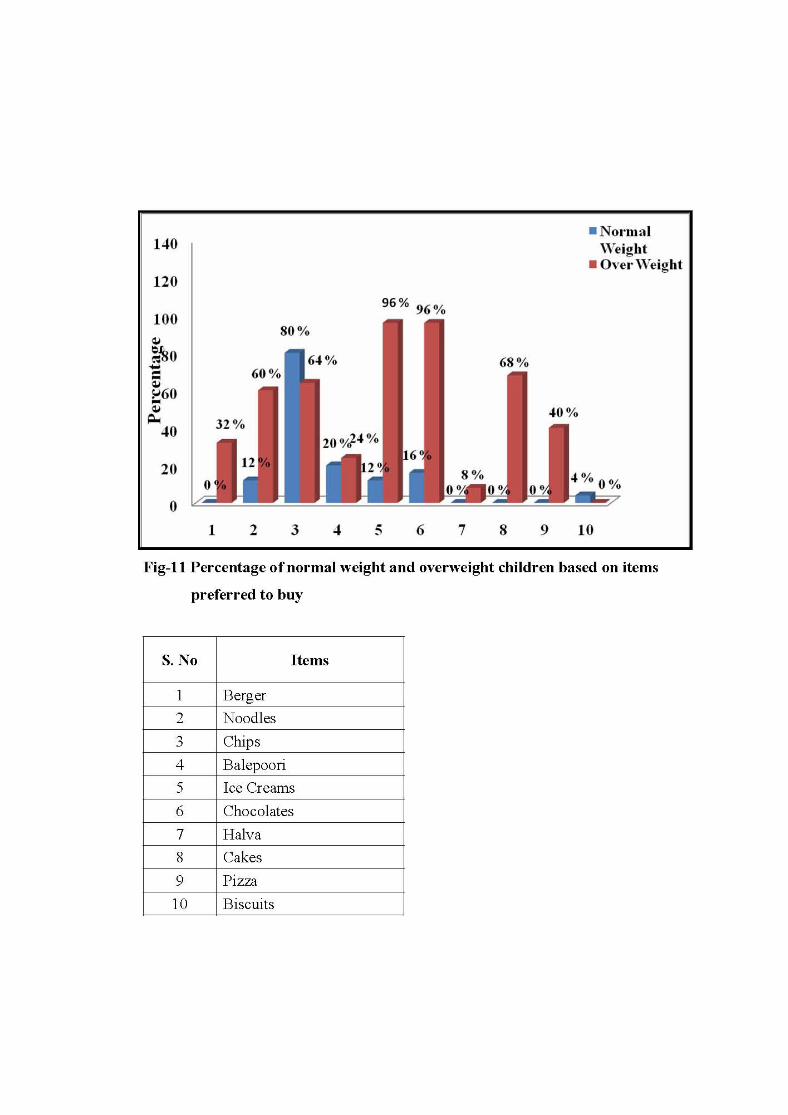

49
TABLE XVI
FREQUENCY AND PERCENTAGE DISTRIBUTION OF NORMAL WEIGHT
AND OVERWEIGHT CHILDREN BASED ON PURCHASE OF SOFT DRINKS
BEVERAGES FROM OUTSIDE
N=50
Normal Weight (N=25) Over Weight (N=25) S. No Items
F % F % Food Items Purchased
1 Milkshakes 4 16.0 19 76.0
2 Soft drinks 6 24.0 13 52.0
3 Fresh juice 6 24.0 21 84.0
4 Buttermilk 0 0.0 15 60.0
5 Sugar cane juice 3 12.0 14 56.0
6 Tender coconut 11 44.0 10 40.0
Table XVI presents normal weight and overweight children based on item preferred to
buy
Overall purchase of soft drinks among normal weight children ranged between
12% to 44%
Among over weight children majority (44%) preferred tender coconut water,
intake of soft drinks range from 40% to 84%. Majority (94%) preferred to have fresh
fruit juice followed by milk shake (76%).
This table concludes that the habit of taking beverages from outside was higher
among the overweight category compared to normal weight children.
Fig - 12 shows percentage of normal weight and overweight children based on
purchase of soft drinks and beverages from outside.
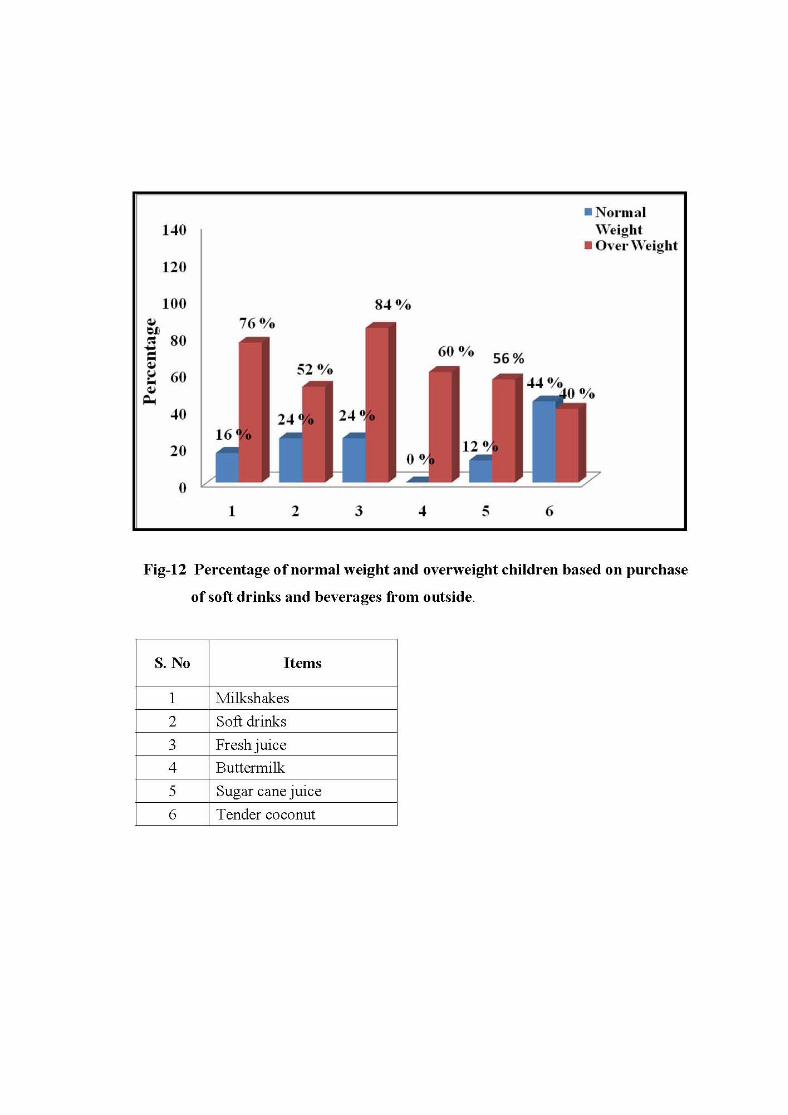

50
TABLE XVII
FREQUENCY AND PERCENTAGE DISTRIBUTION OF NORMAL WEIGHT
AND OVERWEIGHT CHILDREN BASED ON FREQUENCY OF
FOOD ITEM PURCHASED AND IN TAKE OF BEVERAGES
N=50
Normal Weight (N=25)
Over Weight (N=25) S. No Items
F % F % 1 Frequency : Daily 0 0 2 8.0 > 3 Times a week 0 0 20 80.0 < 3 Times a week 25 100.0 3 12.0
2 Frequency of intake of beverages :
Daily 0 0 3 12.0
> 3 Times a week 2 8.0 22 88.0
< 3 Times a week 23 92.0 0 0
Table XVII presents normal weight and over weight children based on frequency of
food item purchased and in take of beverages
All (100%) the normal weight children preferred to buy noodles, chips,
balepoori, ice creams, chocolates, halva, cakes, pizza and biscuits in the frequency of
less than 3 times a week. Frequency of taking beverages like milkshake, soft drinks,
fresh juice, buttermilk, sugarcane juice and tender coconut by majority (92%) of the
samples was less than 3 times in a week and only for 8% of the children it was more
than 3 times a week.
Among Overweight children majority (80%)of them bought food items like
noodles, chips, balepoori, ice creams, chocolates, halva, cakes, pizza more than 3 times a
week, 8 - 12% purchased those foods daily. Frequency of taking beverages like
milkshake, soft drinks, fresh juice, buttermilk, sugarcane juice and tender coconut in

51
more than 3 times a week was 88% and 12% of over weight children bought the soft
drink beverages more than three times a day.
This table concludes that the frequency of intake of fried food/ soft drinks was
more among overweight children compared to normal weight children.

52
TABLE XVIII
MEAN SCORE OF EATING HABITS AND LEVEL OF SIGNIFICANT OF
NORMAL WEIGHT AND OVER WEIGHT CHILDREN
N= 50
Normal Weight (N=25)
Over Weight (N=25) S. No Dietary
Pattern Max Score Mean
Score
Mean Score
%
Mean Score
Mean Score
%
t P 0.05 df 48
1 Eating pattern 6 6 100.0 5.44 90.66 4.78*
2 Packed lunch 2 1.84 92.0 1.88 94.0 0.398ns
3 Meal pattern 2 2 100.0 1.64 82.0 3.71*
4 Eating snacks while watching TV
2 1.68 84.0 1 50.0 7.12*
5
Pocket Money and Frequency of Taking Snacks and Beverages
8 6.92 86.5 4.92 61.5 1.47 ns
Overall 20 18.44 92.5 14.88 75.63
Table Value 2.01
* significant df- degree of freedom ns - not significant
Table XVIII Presents eating habits of normal weight and over weight children
The mean score percentage of normal weight children was 6 (100%) for eating
pattern, 1.84 (92 %) for packed lunch, 2 (100 %) for meal pattern, 1.68 (84 %) for eating
snacks while watching TV and 6.92 (86.5 %) for Pocket Money and Frequency of
Taking Snacks and Beverages.

53
Among overweight children mean score for packed lunch was 1.88 (94 %), for
eating pattern was 5.44 (90.66 %) and for eating meal pattern 1.64 (82 %). The mean
score for pocket money and frequency of taking snacks and beverages was 4.92 (61.5%).
The mean score for eating snacks while watching TV was 50%.
From the table it was noted that the normal weight children scored well for the
eating habits compared to overweight.
The ‘t’ value showed statistical difference, indicating that there was a
significant difference between eating pattern (df 48, CV 4.78, TV 2.01), meal
pattern(df 4, CV 3.71, TV 2.01), eating snacks while watching television
(df 48, CV 7.12, TV 2.01) among normal weight and overweight children.
Fig - 13 shows percentage mean score of eating habits of normal weight and over
weight children.

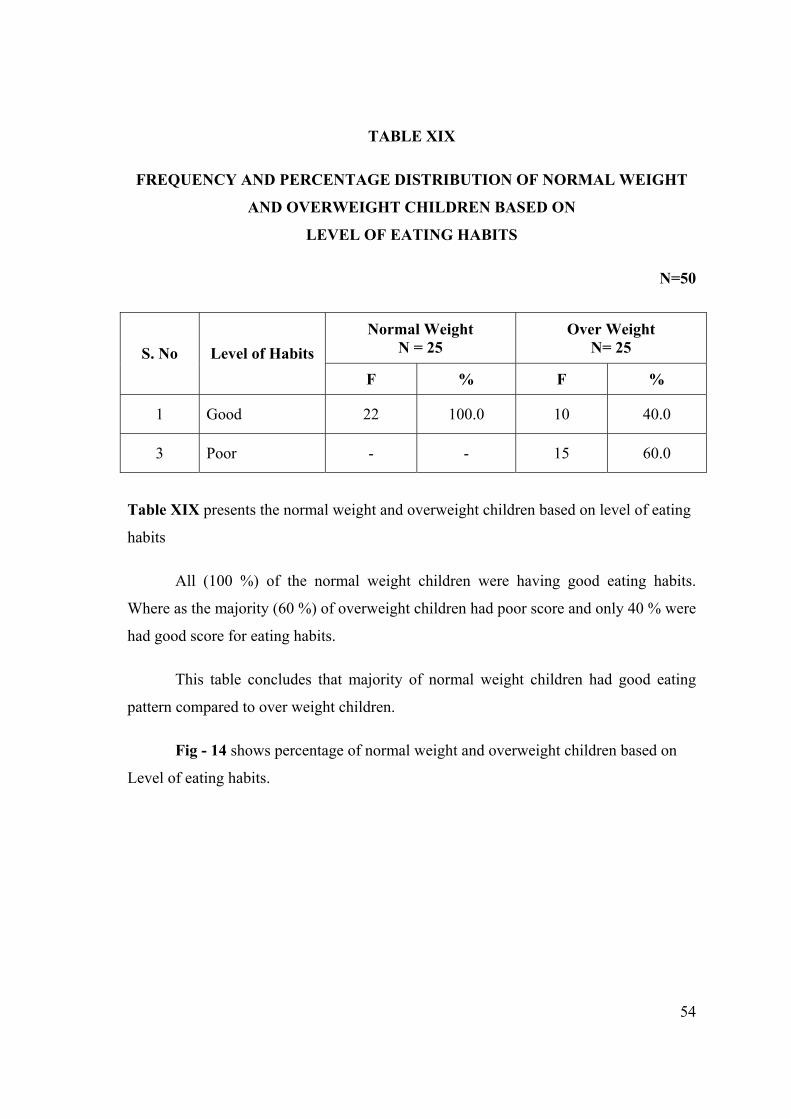
54
TABLE XIX
FREQUENCY AND PERCENTAGE DISTRIBUTION OF NORMAL WEIGHT
AND OVERWEIGHT CHILDREN BASED ON
LEVEL OF EATING HABITS
N=50
Normal Weight N = 25
Over Weight N= 25 S. No Level of Habits
F % F %
1 Good 22 100.0 10 40.0
3 Poor - - 15 60.0
Table XIX presents the normal weight and overweight children based on level of eating
habits
All (100 %) of the normal weight children were having good eating habits.
Where as the majority (60 %) of overweight children had poor score and only 40 % were
had good score for eating habits.
This table concludes that majority of normal weight children had good eating
pattern compared to over weight children.
Fig - 14 shows percentage of normal weight and overweight children based on
Level of eating habits.

55
CHAPTER V
DISCUSSION
This study focused on assessing the life style of normal weight and overweight
children in terms of physical activity and dietary pattern. This chapter presents
discussion of the main findings.
Distribution of samples based on Body Mass Index
Table I presents frequency and percentage distribution of samples based on
Body Mass Index. Majority 20 % of normal weight children lies between the Body Mass
Index of 17.5 – 20, where as 32 % of overweight children lies between the body mass
index of 25 – 27.5. Average Body Mass Index of normal weight children was 20.64
whereas overweight children 26.80.
Demographic characteristics of the normal weight and overweight children
Table II(a)and(b) present the frequency and percentage distribution of
demographic variables among normal weight and overweight children. Majority
(40 and 48 %) of both normal weight and overweight children were under the age group
of 13-14 years. Most of the families of overweight children monthly income was above
10,000 and most of them had comfort items like computers, television, car, bike, cycle
and exercising equipments in their home compared to normal weight children. The table
also reveals that most of the overweight children’s parents were graduate and majority
(44 %) of fathers were professionals compared to normal weight children. Majority of
overweight children mothers (64%) were working women compared to only (12 %) of
normal weight children.
Categories of physical activity during games period and while at school
Table III and IV presents frequency and percentage categories of physical
activities among normal weight and overweight children during games period and while
at school. In the present study majority of normal weight children (64 %) engaged in
vigorous activities during games period and 36-72% were engaged in vigorous activities
56
before school begins, during lunch and after school is over. Whereas among overweight
children (64 %) were engaged in both moderate and vigorous activity during games
period at school, and 16-24% were engaged in vigorous activities before school begins,
during lunch and after school is over.
This table reveals that more or less both normal weight and overweight children
engaged in similar manner in physical activities during games period and normal weight
children engaged more in vigorous activities compared to overweight children during
school begins, lunch time and after school is over.
Based on the study done by Stratton G, Ridgers N D(2007) on physical activity
among normal weight and overweight children, it was noted that moderate to vigorous
physical activity was double among normal weight children compared to overweight
children during break time at school.
Categories of physical activities after returning from school and during weekend
and holidays
Tables V and VI show frequency and percentage distribution of physical
activities after returning from school and during weekend and holidays. It was noted that
44% of normal weight children engaged in indoor and outdoor games after returning
from school, 32% were engaged in vigorous activities and other 32% engaged in
moderate and vigorous activity after returning from school and during weekend and
holidays.
Among overweight children only 20% were engaged in indoor and outdoor
games after returning from school and 64% were engaged in light activities during
weekend and holidays.
This table reveals that normal weight children were engaged more in moderate to
vigorous activities compared to overweight children. And during weekend and holidays
most of the overweight children were engaged in light activities compared to normal
weight children.

57
The present study findings was supported by a study done by S.A Tebb and
Moore M.S (1997) ,there is some evidence that both a high proportion of dietary fat and
low level of physical activity may increase the likelihood of weight gain.
Types of physical exercises among normal weight and overweight children
Table VII shows frequency and percentage distribution according to type of
physical exercise carried out among normal weight and overweight children. Around 84-
96 % of normal weight children were doing physical exercise such as walking and
bicycling whereas physical exercises among overweight children was between 36-68 %
only.
This table clearly reveals that normal weight children engaged in all forms of
physical exercises compared to overweight children.
The χ2 value did not show any statistical significance, indicating that there was
no significant association between the two categories of physical exercise among normal
weight and overweight children.
The present study findings was supported by a study done by Laxmaiah Avula
et.al (2007) study emphasizes that regular physical exercise, doing household activities,
regular television viewing, and healthy eating behaviors could contribute to controlling
overweight and obesity.
Types of sedentary activity among normal weight and overweight children
Table VIII presents frequency and percentage distribution of sedentary activities
after returning from school. This table reveals that majority of overweight children
(32-64 %) were engaged in sedentary activities compared to (4-20 %) of normal weight
children
The χ2 value did not show any statistical significance it indicate that there was no
significant association between sedentary activities among normal weight and
overweight children.

58
Mode of travel among normal weight and overweight children
Table IX presents frequency and percentage distribution according to overall
response of mode of travel to school and for other purpose such as visiting friends and
shopping. Among normal weight 10-17 children (40-68 %) were going to school and for
other purposes by walking. Where as in overweight children most of them 52 %
travelled by bicycling.
This table reveals that in majority of normal weight children the mode of travel
was by walking when compared to overweight children who travelled through bicycle
and bike.
The χ2 value did not show any statistical significance, indicating that there was
no significant association between the mode of travel to school among normal weight
and overweight children. And there was a significant association noted between the
mode of travel for other purposes among normal weight and overweight children.
From the Table X it was noted that average duration of physical activity per day
at school was 74.4 minutes for normal weight children and only 42.4 minutes for
overweight children, 42.13 minutes and 36.8 minutes at home for normal weight and
overweight children. Average duration of physical exercise during weekend and
holidays for normal weight children 90 minutes and for overweight children 48.4
minutes per day.
From the table it was noted that normal weight children engaged more duration
in physical activities and exercises compared to overweight children.
The present study findings was supported by a study done by Strong W et.al
(2009) it reveals that school age children should participate daily in 60 minutes or more
of moderate to vigorous physical activity.
59
Eating pattern, meal pattern and packed lunch among normal weight and
overweight children
Table XI, XII and XIII shows frequency and percentage distribution of eating
pattern, meal pattern and packed lunch among normal weight and overweight children.
This table reveals that 76-100% normal weight children had good eating pattern, meal
pattern, took packed lunch and ate those packed lunch compared to 60-88% of
overweight children.
Distribution of samples based on taking snacks while watching television
Table XIV shows frequency and percentage distribution of taking snacks while
watching television. This table shows that majority (68%) of normal weight children did
not have the habit of taking snacks while watching television and 20% took chips than
other varieties. Whereas 100% of overweight children had the habit of taking snacks
while watching television and 96% preferred sweet varieties.
This table reveals that the habit of taking snacks while watching television was
high among overweight children compared to normal weight children.
The present study findings was supported by a study done by M. Deanna
et al. (2009), the findings of the study shows that both snacking and television watching
have been associated with childhood overweight.
Distribution of samples based on the items preferred to buy, purchase of soft
drinks beverages and its frequency
Table XV, XVI and XVII reveals frequency and percentage distribution of
normal weight and overweight children. It shows that majority (80%) of normal weight
children preferred to buy chips, 12-44% preferred soft drinks beverages and frequency
of taking these items was less than three times a week. Where as 60-90% of overweight
children were preferred noodles, chips, ice creams and chocolates, 40-84% were
preferred soft drinks beverages and frequency of intake was more than three times a
week.
60
From this table it was noted that preference shown by the overweight children for
fried items, fast foods, sweet varieties and soft drinks beverages from outside was very
high compared to normal weight children.
Similar result was obtained in the study done by Kuriyan Rebecca et.al (2007),
among overweight children. The result showed that eating behavior and increased
consumption of fried foods was significantly associated with overweight children.
Mean score and level of eating habits among normal weight and overweight
children
Table XVIII and XIX reveals that the mean score percentage for various
activities (eating pattern, packed lunch, mean pattern, eating snacks while watching
television and pocket money and frequency of taking snacks and beverages) was higher
for normal weight children compared to overweight children. The table also reveals that
majority (88%) of normal weight children had good eating habits compared to
overweight children.

61
CHAPTER VI
SUMMARY, FINDINGS, CONCLUSION, IMPLICATIONS AND
RECOMMENDATION
INTRODUCTION
This chapter presents the Summary, Findings, Conclusion, Implications and
Recommendation.
SUMMARY OF THE STUDY
Life style is considered to be an important determinant of health and sickness.
Historically, a fat child means a healthy child, one who is free from infection. Today
obesity or overweight in children, very often related to degenerative diseases is mainly
due to improper lifestyle and dietary pattern. According to World Health Organization
(2004), Body Mass Index between 18.5 to 24.99 is considered as normal weight and
between 25 to 29.99 is considered as overweight.
Overweight is associated with the onset of major chronic diseases leading to
complications and problems in children and adult. Childhood obesity/overweight is very
often a risk factor for obesity in adulthood, compared to adult onset obesity. Hence close
monitoring of overweight and taking timely preventive measures will be an effective
approach in dealing with the problems. Incidence of childhood overweight is on the rise
since last few decades and is still continuing to rise. Since the 1970s, the prevalence of
overweight children has more than doubled for preschoolers ages 2-5 and adolescents
ages 12-19 and it has more than tripled for children 6-11 years. Nearly one third of
children and adolescents of both sexes, aged 6-19 years (30%) are considered to be
either at risk for overweight (The Center for Health and Healthcare in Schools 2005).
The transition in nutrition, sedentary life style, lack of exercise, increased television
watching, computer addiction, improper dietary pattern adopted by children today are
the major causes of overweight seen in children. The World Health Organization has
62
identified school as important settings for promotion of physical activity among
children. Physical education, provided at school, is an ideal way to encourage activity
and develop fitness among children. For this reason, the Centers for Disease Control and
Prevention (CDC), the National Association for Sports and Physical Education
(NASPE), and the American Heart Association all recommended comprehensive daily
physical education for children Kindergarten to 12th standard.
The aim of the study was to assess the physical activity / exercise of normal
weight and overweight children in and outside of school, their eating pattern and to see
whether there is any difference.
The conceptual frame work used for this study was based on Rosenstoch’s and
Becker and Maiman’s ‘Health Belief Model’.
A descriptive and comparative survey approach was used. The study was
conducted in a selected school with a sample of 25 normal weight and 25 overweight
children studying in 7th to 11th standard, samples were selected by convenience sampling
method.
The tool consisted of a self administered structured questionnaire with 26 items
with two groups to assess the life pattern of school children.
FINDINGS OF THE STUDY
Demographic characteristics
In demographic characteristics presents that most of the overweight children are
male, under the age group of 13-14 years, who has family income above 10,000 and
facilities like computer, car, television, bike, cycle, exercise equipments. And most of
the parents of overweight children are professionals and mothers are working compared
to normal weight children.
63
Life Style
Life style of both normal weight and overweight children were grouped in to two
headings, Physical activity/exercise and eating pattern. It was noted that normal weight
children were engaged more in physical activity/exercise at school, home, and during
weekend and holidays and had good eating pattern compared to overweight children.
Majority of overweight children like to engaged in sedentary activities compared to
normal weight children.
Significant Finding
There was a significant association found in between mode of travel for other
purposes other than going to school among normal weight and overweight children
(df-3, TV-7.82, CV-20.87).
There was a significant association noted between eating pattern
(df 48, TV-2.01, CV-4.78), meal pattern (df-48, TV-2.01, CV-3.71), and eating snacks
while watching television (df-48, TV-2.01, CV-7.12) among normal weight and
overweight children.
CONCLUSION
Physical activity of each individual and eating pattern are inter linked. This study
results shows that majority of normal weight children were engaged in physical activity
at school and during weekend and holidays and followed a good eating pattern compared
to overweight children. And most of the overweight children were engaged in sedentary
activities at home.
LIMITATIONS
Exact response cannot be expected from the children.
64
IMPLICATIONS
The study has its implication in nursing practice, nursing education, nursing
administration, nursing research, social pediatrics and community.
Nursing Practice
Nursing professionals can provide a better frame work for healthy life style and
school based programs. Nurses understand the biologic, psychological, causative and
social aspects of being an overweight and their impact on health. The nurse can render
awareness through education of the parents and children at the school, hospital and
community level.
The nurse can also improve the knowledge of parents, children and school
teachers by conducting education program and by counseling. A healthy life style is
important for the proper growth and development. Guidance and Counseling services
should be arranged timely and provided with adequate knowledge, positive support and
make the child as a healthy member of society in future.
Nursing Education
Findings of the study have some implication for nursing education. The health
care system pay more attention on the training of nursing students and school teachers.
So that, they will acquire more knowledge and will be able to help oneself in knowing
the importance of healthy lifestyle. Motivation to change and psychological counseling
technique is key to any lifestyle intervention. Teaching about healthy diet and the
importance of maintaining moderate physical activity in young children is important as
obesity is more easily prevented than treated. It is important to begin preventive efforts
early in childhood.
Nursing Administration
Nursing administrators should be necessarily involved in formulating policies for
health education program in the school, hospital as well as community settings. All the

65
heath education and school based program should integrate education on healthy
lifestyle changes in children.
Nursing Research
There is a need for extensive research in this area. The findings of the study help
to expand the scientific body of knowledge upon which further research can be
conducted.
In the Community
The community health nurse has an important role as health educator, health
promoter and health protector in the community. During home visits the nurse can
identify the vulnerable overweight children and observe different lifestyle adopted by
the family and children. Nursing personal working in the community health department
should be given in service education to update and improve their knowledge regarding
overweight and life style practices. Within the healthcare community, the
multidisciplinary team might include a primary physician, an obesity specialist, a
diabetic educator, a nurse, a dietitian, a fitness counselor and a social worker as well as
the patient and family. Education and counseling families of obese children through
media use is vital. Healthcare professionals should also become involved in setting up
new community programs to promote healthy lifestyle.
RECOMMENDATIONS
Based on the findings of the study, the investigator proposed the following
recommendations.
• A replication of present study can be done with large sample.
• A comparative study can be conducted between the rural and urban areas.

66
BIBLIOGRAPHY AND REFERENCES
BOOK REFERENCES
Ball, Blinder, (1995) Pediatric Nursing- Caring for Children, (6th ed),
Nerwalk: Appleton and lange Company, 62-65.
Basavanthappa, (2005) Paediatric Nursing, (1st ed), New Delhi: Ahuja
Publishing house, 488-489.
Behrman, Kliegman, Jenson, (2004) Nelson text book of Pediatrics, (17th ed),
Jaypee brothers medical publishers, 173-177.
Mahajan BK, (1997) Methods In Biostatistics, (6th ed), Bangalore: JayPee
Brothers Medical publishers, 104-112.
Marlow. R. Dorothy, Redding A Barbara, (1988) Text book of Paediatric
Nursing, (6th ed). Tokyo: W.B Saunders Company, 1184-1185
Parul Datta, (2007) A text book of Pediatric Nursing, (1st ed), New Delhi:
JayPee Brothers Medical Publishers, 424.
Piyush Gupte, (2005) Ghai Essential Pediatric, (6th ed), New Delhi: CBS
publishers and distributors, 116-117,481.
Polit,D.F, Hungler, (1999) Nursing Research Principles and Methods (6th ed),
Philadelphia: Lippincott Company, 341-345.
Suraj Gupte, (2004) The short text book of Pediatric, (10th ed), Philadelphia:
J.B. Lippincott company,569,54,59.
Waechter Philps, (1985) Nursing care Of Children, (10th ed), Philadelphia:
608.
Whaley & Wongs, (2005) Nursing Care of Infant and Children, (5th ed), New
Delhi: Mosby Publishers, 897-898.

67
Wood Labrondo, Haberb Judith, (1997) Nursing Research Methods-Critical
Appraisal and Utilization (3rd ed), Philadelphia: Mosby Company, 108-124.
JOURNAL REFERENCES
Ambily G Unnithan,S Syamakumari, (2008) Prevalence of overweight, obesity
among school going children, Journal of Nutrition and Wellness, Vol. 3, No:6.
Baby Nayak, (2007) Factors associated with prevalence of obesity among school
children, Journal of Nursing Research Society Of India, Vol. 30, No: 12, 10.
Cynthia L.Ogden, (2002) Prevalence and Trends In Overweight Among US
Children and Adolescents, The Journal Of The American Medical Association, Vol.
288 No.14 3,4.
Jose, (2007) Schooling for Health, Health Action, Vol:14, No:20,3.
Katharina Zehle, (2007) Childhood Obesity, The American Journal of
Maternal Child Nursing, Vol:32 No:18,21.
S Kumar, (2007) Prevalence of obesity and its influencing factor among school
children, Indian Journal Of Community Medicine, Vol.32 No.1,15-17.
Sumitha Chakraboty, (2008) Grant parental and parental obesity influences on
childhood overweight:implication for primary care practice, The Journal of the
American Board Of family Medicine, Vol:21, No:6, 549-554.
Swarnarekha Bhat, (2007) Television viewing and sleep among school children,
Nutrition Journal, Vol.6 No.2, 10
68
WEB REFERENCE
Dinand Webbink, (2000) Does education reduce the probability of being
overweight, www.pubmed.com.
Liane M. Summmerfield, (1996) Promoting physical activity and exercise
among children, www.concern.com.
Mindy Herzog, (2001) Modearate Intensity Physical Activity,
www.suite101.com
Mishra G,(1997) Children as a part of health, www.worldcat.com.
Sharlin Krull, (2008) Moderate to Vigorous Physical Activity,
www.health.gov/paguidelines.com.

APPENDIX - I
LETTER REQUESTING PERMISSION TO CONDUCT THE STUDY
To,
The Principal
R.V.S Matriculation Higher Secondary School,
Sulur, Coimbatore.
Respected Sir/ Madam,
Sub: - Letter requesting permission for conducting the study
Miss. Sreeja Mohan is a Post Graduate Nursing student of our
institution. She has selected below mentioned topic for her Research Project to
be submitted to The TamilNadu Dr. MGR Medical University of Health
Sciences as a partial fulfillment of this Master of Nursing Degree.
“A comparative study to assess the life style of school children with
normal weight and overweight in a selected school, at Coimbatore.”
Regarding this project, she in need of your esteemed help and co-
operation as she is interested in conducting a study of her project in your
institution. I request you to kindly permit her to conduct the proposed study
and provide her the necessary facilities.
The student will furnish further details of the study if required personally. Please do the needful and oblige.
Thanking you,
Place : Coimbatore Yours faithfully,
PRINCIPAL
APPENDIX - II
PERMISSION LETTER FOR CONTENT VALIDITY
From, Miss. Sreeja Mohan M.Sc. (N) Student, R.V.S College of Nursing, Sulur, Coimbatore. To,
Through the Principal, Respected Sir/ Madam, Sub: - Letter requesting opinion and suggestion of experts for establishing
content validity of the tool.
I am a M.Sc (N) student in RVS College of Nursing, Sulur,
Coimbatore in the speciality of Child Health Nursing. As per requirement for
the partial fulfillment of this nursing degree under The TamilNadu Dr. MGR
Medical University. I have selected the following topic for dissertation.
“A comparative study to assess the life style of school children with normal weight and overweight in a selected school, at Coimbatore.”
I kindly request you to go through the research tool and validate against criteria given in the sheet.
Thanking you,
Yours faithfully,
(Sreeja Mohan)
Enclosure:- 1. Objectives of the study 2. Description of the tool 3. Research Tool 4. Criteria rating for validation 5. Content validation certificate.
APPENDIX - III
CERTIFICATE OF CONTENT VALIDITY
This is to certify that the tool developed by Miss. Sreeja Mohan, M.Sc.
(N)
Student, R.V.S College of Nursing , Sulur, Coimbatore to collect data on
the problem.
“A comparative study to assess the life style of school children with
normal weight and overweight in a selected school, at Coimbatore.”
Is validated by the undersigned and she can proceed with this tool to
conduct the main study.
Name :
Address :
Signature :
Seal :
Date :

APPENDIX - IV
CRITERIA FOR VALIDATION
Kindly go through this tool and please give your views regarding clarity,
relevance, adequacy of the tool and remarks if any.
Clarity Relevancy Adequacy S. No Item
Yes No Yes No Yes No Remarks
Part – I Demographic Data
1
2
3
4
5
6
7

PART – II QUESTIONNAIRE
Clarity Relevancy Adequacy S. No Item
Yes No Yes No Yes No Remarks
Physical Activities/Exercise
1
2
3
4
5
6
7
8
9
10
11
12
13
14
15

Clarity Relevancy Adequacy S. No Item
Yes No Yes No Yes No Remarks
Eating Pattern
1
2
3
4
5
6
7
8
9
10
11
APPENDIX - V
REQUISITION LETTER FOR CO-GUIDE
From
Miss. Sreeja Mohan M.Sc, (N) Student, R.V.S College of Nursing, Sulur, Coimbatore.
To
Dr. D. Ramamoorthy, M.B.B.S, DCH Medical Officer, Pediatrician, R.V.S Multi Specialty Hospital , Coimbatore.
Through the Principal
Sub: - Request for Co-Guide
I wish to state that I am Miss. Sreeja Mohan II Year M.Sc Nursing
Student, R.V.S College of Nursing have selected the below mentioned topic
for dissertation as a As per requirement for the partial fulfillment for the
Master of nursing degree to The TamilNadu Dr. MGR Medical University.
“A comparative study to assess the life style of school children with
normal weight and overweight in a selected school at Coimbatore.”
Regarding this I am in need of your valuable help and co-operation by
providing services to be a co-guide for my study.
I humbly request your highness to consider the same and do the
needful.
Thanking you,
Yours Sincerely,
(Sreeja Mohan)

APPENDIX - VI
QUESTIONNAIRE
INTRODUCTION:
Overweight in children is a common issue that causes great health concern. The
socio cultural changes has resulted a change in the lifestyle of children & adults all
over the world. Today everybody is concerned about the bodyweight & tryout various
measures to keep the body weight under control.
PURPOSE:
The purpose of this questionnaire is to find out your lifestyle particularly with
regard to eating, physical activities and exercises.
INSTRUCTIONS:
Kindly go through each question and mark your answers in appropriate boxes.
There is no right and wrong answers. Tick all that is applicable to you in the boxes
given. Your answers will be kept confidential.
PART – 1 DEMOGRAPHIC DATA
Kindly give the following personal information by marking in the appropriate boxes.
1. Personal Information:
a) Your Age : 12-13 13-14 14-15 15-16
b) Your Sex : Male Female
2. Educational Qualification:
a) Father : illiterate Primary Middle Secondary Graduate
b) Mother : illiterate Primary Middle Secondary Graduate
3. Occupation of :
a) Father : __________________
b) Mother : __________________

4. Family Income :
a) Below 5000 b) 5001 - 10000
c) Above 10000
5. If you have the following at home, kindly tick ( ) in the box?
a) Computer b) Television
c) Car d) Bike
e) Cycle f) exercising equipments
6. What type of food do you take at home?
a) Pure vegetarian b) Occasionally Non Vegetarian
c) Mostly non Vegetarian d) Vegetarian who takes eggs
7. Your family diet contains the following:
Sl. No Items Daily Once a
week Twice a
week Trice a week
a. Cereals : (Eg. wheat, rice etc)
b. Pulses : (Eg. Dhal varieties)
c. Vegetables : (Eg. Green leafy vegetables, Non leafy vegetables)
d. Milk and Milk products : (Eg. Ghee, butter, cheese, creams, curds etc.)
e. Sweets : (Eg. Pastries, icecreams, chocolates, etc)
f. Non Veg. foods : (Eg.Meat, Fish, Chicken, Mutton, Egg etc)
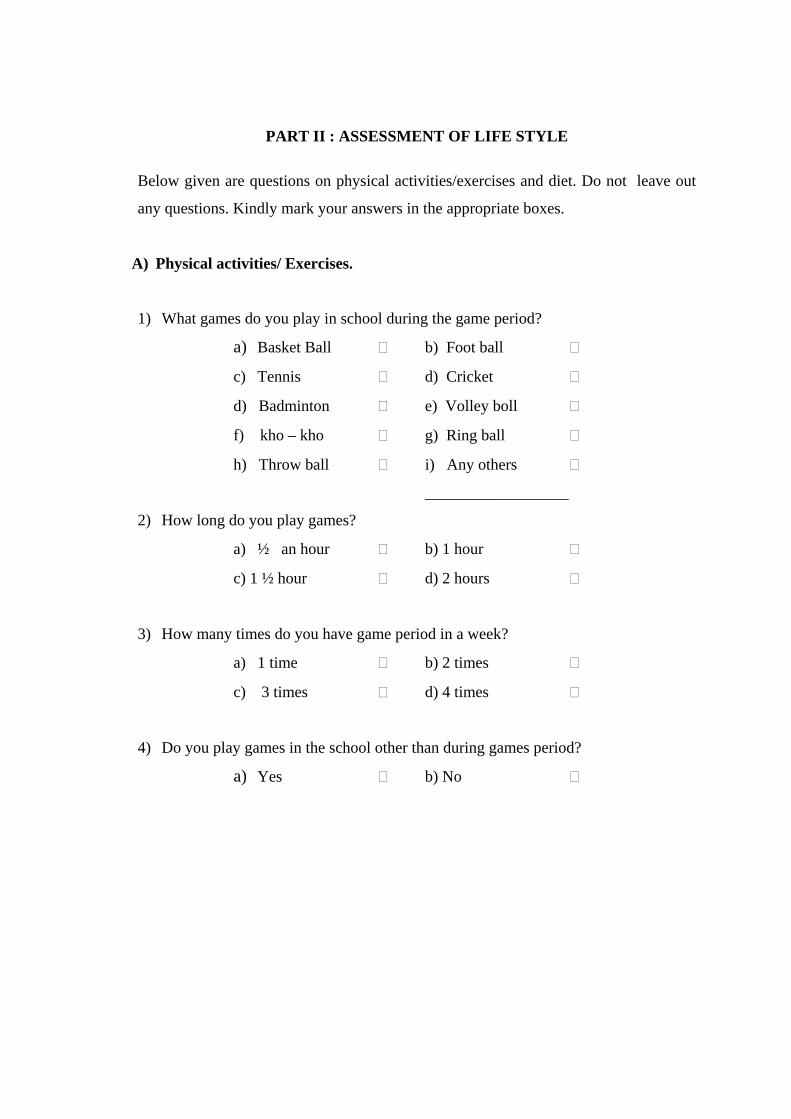
PART II : ASSESSMENT OF LIFE STYLE Below given are questions on physical activities/exercises and diet. Do not leave out
any questions. Kindly mark your answers in the appropriate boxes.
A) Physical activities/ Exercises.
1) What games do you play in school during the game period?
a) Basket Ball b) Foot ball
c) Tennis d) Cricket
d) Badminton e) Volley boll
f) kho – kho g) Ring ball
h) Throw ball i) Any others
__________________
2) How long do you play games?
a) ½ an hour b) 1 hour
c) 1 ½ hour d) 2 hours
3) How many times do you have game period in a week?
a) 1 time b) 2 times
c) 3 times d) 4 times
4) Do you play games in the school other than during games period?
a) Yes b) No
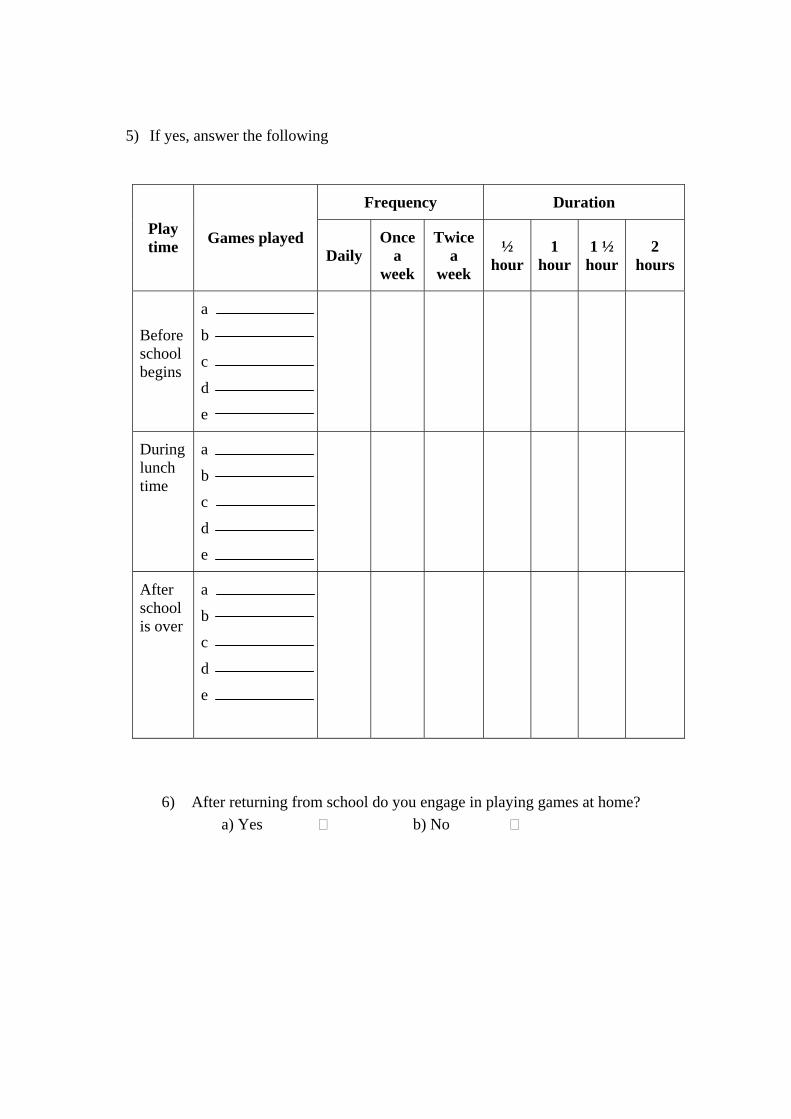
5) If yes, answer the following
Frequency Duration
Play time Games played
Daily Once
a week
Twice a
week
½ hour
1 hour
1 ½ hour
2 hours
Before school begins
a
b
c
d
e
During lunch time
a
b
c
d
e
After school is over
a
b
c
d
e
6) After returning from school do you engage in playing games at home? a) Yes b) No

7) If yes, answer the following?
Frequency Duration
Types of games played Daily
Once a
week
Twice a
week
½ hour
1 hour
1 ½ hour
2 hours
Playing indoor games
a
b
c
d
e
Playing outdoor games
a
b
c
d
e
8) If you do not play any games after coming from school in which of the following activities do you engage?
Frequency
Activities Daily Once a
week Twice a
week Trice a week
a) Watching TV
b) Using computer
c) Listening music
d) Doing home work
e) Reading books
f) Going for tuition
g) Chitchatting with family members
h) Chitchatting with friends
i) Any other ____________

9) Do you play games during weekends and holidays? a) Yes b) No
10) If yes, answer the following
Duration
Game played ½ hour 1 hour 1 ½
hour 2 hour
a. b. c. d. e.
11) Do you engage in the following activities?
a) Walking b) Swimming c) Jogging d) Gymnastic e) Yoga f) Bicycling g) Dancing h) Karate i) Any other ______
12) How often do you go for these activities?
Frequency Duration
a b c d e f g h S. No Activities
Daily Once a week
Twice a week
Trice a week
½ hour
1 hour
1 ½ hour
2 hour
1 Walking
2 Jogging
3 Yoga
4 Swimming
5 Gymnastic
6 Bicycling
7 Dancing
8 Karate
9 Any other ________

13) What is your mode of travel to go to school? a) By walk b) By auto/Car/School bus/Bike
c) By Private bus d) By bicycle
14) What is the distance between your home & school? a) Less than 1 km. b) 1 km.
c) More than 1 km.
15) What is your usual mode of travel for other purpose (shopping, visiting friends etc.)
a) By walk b) By auto/car/bike c) By bus d) By bicycle
B) Eating Pattern :
16) Do you eat
Yes No Everyday Not everyday a) Break fast b) Evening snacks c) Dinner
17) Do you take packed lunch to school?
a) Everyday b) Not every day
18) Do you eat the packed lunch taken from your home?
a) Yes b) No
19) What is your usual meal pattern per day?
a) 2 meals b) 3 meals
c) 4 meals d) above 4 meals
20) Do you take snacks when you watch television?
a) Yes b) No
21) If yes, what type food you take?
a) Chips b) Sweets
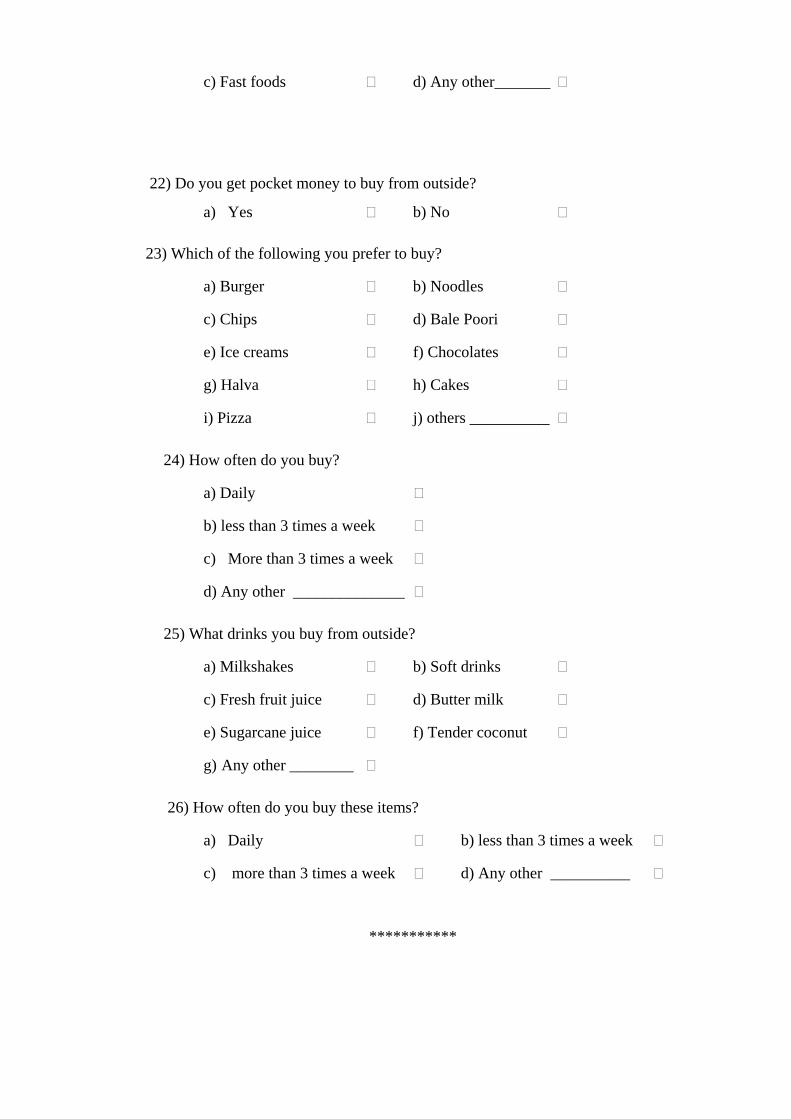
c) Fast foods d) Any other_______
22) Do you get pocket money to buy from outside?
a) Yes b) No
23) Which of the following you prefer to buy?
a) Burger b) Noodles
c) Chips d) Bale Poori
e) Ice creams f) Chocolates
g) Halva h) Cakes
i) Pizza j) others __________
24) How often do you buy?
a) Daily
b) less than 3 times a week
c) More than 3 times a week
d) Any other ______________
25) What drinks you buy from outside?
a) Milkshakes b) Soft drinks
c) Fresh fruit juice d) Butter milk
e) Sugarcane juice f) Tender coconut
g) Any other ________
26) How often do you buy these items?
a) Daily b) less than 3 times a week
c) more than 3 times a week d) Any other __________
***********
Édh¡f´
K¬Diu :
m½fkhd vilí´s FHªijfˬ cl± Mnuh¡»a« g¦¿a xU bghJthd fU¤J¡fis¥ g¦¿
Muh-nth«. ,ªj cyf« KGt½Y« c´s bgÇat®f´ k¦W« FHªijfˬ fyh¢rhu« k¦W«
ehfßf§fˬ mo¥gilƱ mt®fˬ th³¡if Kiw K¦¿Ykhf kh¿í´sJ. j¦bghGJ x²bthUtǬ
cl± vil g¦¿a Étu« g±ntW fhuÂfËdh± m¿ªJ mt®fˬ cl± vil j§fˬ f£L¥gh£o¦F´
it¤½U¡»¬wd®.
bghU´ :
ѳ¡f©l Édh¡fˬ ‚ykhf j§fˬ th³¡if Kiw k¦W« czî gH¡ftH¡f§f§f´/ cl¦gƦ¿f´
g¦¿ xU M-î cl±g¦¿a fU¤Jf´ :
ѳ¡f©l x²bthU Édh¡f´ k¦W« mj¦FÇa g½±f´ ѳ c´s f£l¤½± F¿¡f¥g£L´sJ.
m½± rÇahdit k¦W« jtwhd g½±f´ bfhL¡f¥g£L´sd. ѳ¡f©lt¦¿± c´s f£l§f˱ rÇahd
g½±fis F¿¥¾lî«.
gF½ - I
ѳ¡f©lt¦¿± bfhL¡f¥g£L´s jft±fS¡F f£l¤½± g½± mË¡fî«.
1. jft±
m. taJ : 12-13 13-14 14-15 15-16 M. ghÈd« : M© bg©
2. f±É¤jF½
m«kh: go¡fhjt® bjhl¡f¡f±É
,ilÃiy¡f±É KJÃiy¡f±É
KJfiy¥g£l«
Tamil Font: APT-Sangam 11
m¥gh : go¡fhjt® bjhl¡f¡f±É
,ilÃiy¡f±É KJÃiy¡f±É
KJfiy¥g£l«
3. bjhʱ
m¥gh : _________________
m«kh : _________________
4. tUkhd«
m) 5000 ¡F Fiwthf M) 5001 - 10,000
,) 10,000 m½fkhf
5. ѳ¡f©lt¦¿± c´s bghU£f´ c§f´ å£o± c´sdth v¬W f£l¤½± F¿¥¾lî«>
m) fÂÅ M) bjhiy¡fh£¼
,) fh® <) ,U r¡fu thfd«
<) Ľt©o c) cl¦gƦ¼ rhjd«
6. c§f´ å£o± vªj tifahd czîf´ c©Šå®f´>
m) fh-f¿f´ k£L«
M) v¥gthtJ mirt czîf´ k£L«
,) K¦¿Y« mirt czîf´
<) irt czîf´ k£L« K£il
Tamil Font: APT-Sangam 11

7. c§f´ FL«g¤½± c´s eg®fˬ czî¡ f£L¥ghLf´ g¦¿
¾¬tUkhW
t. v©. czî tiff´ ½d« thu« xU
Kiw thu« ,U
Kiw thu« ‚¬W
Kiw
m) jhÅa§f´ : (v.fh. nfhJik/ mǼ)
M) gU¥ò tiff´
,) fh-f¿f´ : Ñiuf´/ fh-f¿f´
<) gh± k¦W« ghȱ ,UªJ »il¡F« bghU£f´ (be-/ bt©bz-/ ¡ß« jÆ®/ ghyhil¡f£o)
c) ,Å¥ò tiff´ : Iµ»ß«/ rh¡ny£
C) mirt czîf´ : khL/ Û¬/ nfhÊ/ ML/ K£il/ ,iw¢¼
Tamil Font: APT-Sangam 11

gF½ II
th³¡if Kiw
ѳ¡f©ldt¦¿± bfhL¡f¥g£L´s czî¡ f£L¥ghLf´ k¦W« cl¦gƦ¼f´ g¦¿a nf´Éf´
bfhL¡f¥g£L´sd. rÇahdt¦iw nj®ªbjL¤J f£l¤½± Ãu¥òf.
1. cl¦gƦ¼f´:
1. c§f´ g´Ë¡Tl§f˱ »il¡F« Éisah£L neu§f˱ v¬d tifahd Éisah£Lf´ ÉisahLå®f´>
m) Til¥gªJ M) fh±gªJ
,) ó¥gªJ <) k£il¥gªJ
c) ,wF¥gªJ C) if¥gªJ
v) nfh-nfh V) tisa¥gªJ
I) gªJ åRj± x) k¦wit ________
2. v²tsî k neu« Ú§f´ ,ªj Éisah£il ÉisahLå®f´>
m) 1/2 k M) 1 kÂ
,) 1 1/2 k <) 2 kÂ
3. c§f´ g´Ë¡ Tl§f˱ xU thu¤½± v²tsî Éisah£L tF¥ò »il¡F«
m) 1 Kiw M) ,U Kiw
,) ‚¬W Kiw <) eh¬F Kiw
4. Ú§f´ c§f´ g´Ë¡Tl§f˱ Éisah£L tF¥ò m±yhj neu§f˱ ÉisahLå®fsh>
m) M« M) ,±iy
Tamil Font: APT-Sangam 11
5. rÇahd Éilia nj®ªbjL¤J ѳ¡f©lt¦¿± F¿¥¾lî« :
fhy« fhy« ÉisahL«
neu« Éisah£L
tF¥ò ½dK« thu« xU Kiw
thu« ,U
Kiw 1/2 k 1 k 1 1/2
k 2 kÂ
g´Ë
bjhl§Ftj¦F K¬
m M , < c
k½a czî ntis
m M , < c
g´Ë Koªj
¾wF
m M , < c
6. g´Ë KoªJ åL ½U«¾aîl¬ å£o± tªJ ntW Éisah£L
ÉisahLå®fsh>
m) M« M) ,±iy
Tamil Font: APT-Sangam 11
7. rÇahdt¦iw vGjî«
fhy« fhy«
Éisah£L
tiff´ ½dK« thu« xU Kiw
thu« ,U
Kiw 1/2 k 1 k 1 1/2
k 2 kÂ
å£oD´ ÉisahL« Éisah£Lf´
m M , < c
å£o¦F btËna ÉisahL« Éisah£Lf´
m M , < c
8. g´Ë KoªJ å£o¦F tªjîl¬ Éisah£L m±yhk± ntW bghGJngh¡Ff´ c´sdth>
fhy« ,a¬Kiw
½d« thu« xU Kiw
thu« ,U Kiw
thu« ‚¬W Kiw
m . oÉ gh®¤j±
M. fÂÅ ,a¡Fj±
,. ,ir nf£l±
<. ò¤jf« go¥gJ
c . oôr¬ br±Yj±
C . FL«g¤Jl¬ ciuahLtJ
v. e©g®fSl¬ ÉisahLtJ
V. ntW VjhtJ
Tamil Font: APT-Sangam 11
9. c§f´ ÉLKiw eh£f˱ m±yJ thu¤½¬ ,W½ eh£f˱ VjhtJ
Éisah£L ÉisahLå®fsh>
m) M« M) ,±iy
10. ѳ¡f©lt¦¿± rÇahditfis vGjî«
fhy« ÉisahL« neu«
½ k 1 k 1 ½ k 2 kÂ
m M , < c
11. ѳ¡fhŠ« bra±fis br-tJ©lh>
m. el¤j± M. ÚªJj±
,. XLj± <. Í«dhµo¡(cl¦ gƦ¼)
c. nahfh C. ir¡»´ X£l«
x. eldkhLj± X. fuh¤nj
Xs. jÉu
Tamil Font: APT-Sangam 11
12. Ú§f´ v²tsî ,ilbtËƱ ,ªj bra±fis br-»Ö®f´>
fhy« neu« t.
v© bra±f´ ½d«
thu« xU Kiw
thu« ,U
Kiw
thu« ‚¬W Kiw
½ k 1 k 1 ½
k 2 kÂ
1 el¤j±
2 XLj±
3 nahfh
4 ÚªJj±
5 Í«ndµo¡
6 ir¡»´ X£l«
7 eldkhLj±
8 fuh¤nj
9 mJ jÉu
13. Ú§f´ g´Ë¡F v¥go br±å®f´> m. M£nlh/ fh®/ngUªJ/ ,U r¡fu thfd« M. elªJ ,. jÅah® ngUªJ <. ir¡»´ 14. c§f´ T£o¦F« c§f´ g´Ë¡F« ,il¥g£l öu«v¬d> m. 1 »nyh Û£lU¡F Fiwthf M. 1 »nyh Û£l® ,. 1 »nyh Û£lU¡F m½fkhf 15. Ú§f´ fil¡F m±yJ e©g®fˬ å£o¦F¢ br±Y«nghJ vªj tifahd thfd¤ij cgnah»¥Õ®> m. elªJ M. M£nlh/fh®/,U r¡fu thfd« ,. ngUª½± <. ir¡»´ (,U r¡fu t©o)
Tamil Font: APT-Sangam 11
16. czî Kiw M« ,±iy ½dK« v¥bghGjhtJ m. fhiy czî
M. khiy ¼¦W©o
,. ,uî czî
17. Ú§f´ g´Ë br±Y«bghGJ k½a czî vL¤J¢ br±å®fsh>
m. ½dK« M v¥bghGjhtJ
18. Ú§f´ å£oÈUªJ jahÇ¡f¥g£l czîfis rh¥¾Lå®fsh>
m. ½dK« M. v¥bghGjhtJ
19. c§fˬ jrhrÇ czî gH¡fKiw xU ehis¡F v²tsî
m. ,u©L ntis
M. ‚¬W ntis
,. 4 ntis
<. eh¬F ntis¡F nk¦g£l
20. Ú§f´ bjhiy¡fh£¼ gh®¡FnghJ ½©g©l« rh¥¾L« gH¡f«
c©lh>
m. M« M. ,±iy
21. M« v¬wh± fªj tifahd ½©g©l§f´ c£bfh´å®f´>
m. ¼¥µ M. ,Å¥ò tiff´
,. ghµ£ ò£ <. ntW VjhtJ
22. Ú§f´ btËƱ bghU´ th§Ftj¦F gz« vL¤J¢ br±å®fsh>
m. M« M. ,±iy
Tamil Font: APT-Sangam 11

23. ѳf©lt¦W´ Ú§f´ KjÈl« bfhL¤J fij th§Få®f´>
m. g®f® M. üL±µ
,. ¼¥µ <. nk±óÇ
c. Iµ»ß« C. rh¡ny£
v. m±th V. nf¡
I. Õ!h x. k¦wit
24. v¤jid Kiw Ú§f´ th§Få®f´>
m. ½dK«
M. thu¤½± 3 eh£fS¡F Fiwthf
,. thu¤½± 3 eh£fS¡F m½fkhf
<. k¦wit
25. Ú§f´ btËÆÈUªj FË®ghd§f´ th§» Fo¥Õ®fsh>
m. ghȱ br-j FË®ghd§f´
M. FË®ghd§f´
,. gH¢rhWf´
<. nkh®
<. fU«ò¢rhW
c. ,sÚ®
C. k¦wit
26. v¤jid Kiw Ú§f´ th§Få®f´>
m. ½dK«
M. thu¤½± 3 eh£fS¡F Fiwthf
,. thu¤½y 3 eh£fS¡F m½fkhf
<. k¦wit
*********************
Tamil Font: APT-Sangam 11