the earscorecard an instrument to assess the effectiveness .../media/sharepoint/lectoraat...
TRANSCRIPT
1 Authors’ final version – Published in: Journal of Enterprise Architecture, May 2013 - www.globalaea.org
The EARScorecard – An Instrument to Assess the Effectiveness of the EA Realization Process
By Leo Pruijt, Raymond Slot, Henk Plessius, and Sjaak Brinkkemper Abstract To add value to the organization, an Enterprise Architecture Management (EAM) function should be able to realize its goals in line with the corporate strategy. In this paper *, we propose the Enterprise Architecture Realization Scorecard (EARS) and an accompanying method to discover the strengths and weaknesses in the realization process of an EAM function. During an assessment, representative EA goals are selected, and for each goal, the results, delivered during the different stages of the realization process, are identified, examined and scored. The outcome of an assessment is a numerical EARScorecard, supplemented with a description of the strengths and weaknesses of the EA realization process, and recommendations. To evaluate and improve the assessment instrument, the EARScorecard was used in various organizations. An assessment case is discussed in depth to illustrate the use of the instrument. Keywords Enterprise Architecture, Enterprise Architecture Management, realization process, effectiveness, assessment, scorecard, TOGAF * This is a revised version of the article “The Enterprise Architecture Realization Scorecard: A Result Oriented Assessment Instrument”, originally published in the conference proceedings of the 7th Trends in Enterprise Architecture Research (TEAR 2012) workshop (Pruijt et al. 2012). In this paper we focus less on the design and more on the practical use of the instrument. Furthermore, to enable the application of the instrument, we present all the indicators instead of a sample set of indicators.
1 Introduction Enterprise Architecture Management (EAM) forms a means to enhance the alignment of business and IT and to support the managed evolution of the enterprise (Buckl et al. 2009). Over the last decades, EAM is introduced in many organizations, but the introduction and elaboration often do not proceed without problems, and most practices are still in the early stages of maturity (Bucher et al. 2006; Van Steenbergen et al. 2010). Moreover, the performance of the EA management function typically is not measured (Winter et al. 2010). Therefore, research on the evaluation of EAM (e.g., Luftman 2000; Morganwalp and Sage 2004; Van der Raadt et al. 2007; Van Steenbergen et al. 2007) and improvement of the effectiveness (e.g., Foorthuis et al. 2010; Lankhorst 2009) is useful, since it may contribute to the further development of the professional practice.
Our study was initiated as part of a larger study on the value of Enterprise Architecture (EA), sponsored by the Dutch Government and three profit organizations. We started from the notion, that to add value to the organization, an EAM function should be able to realize its goals. Based on this idea, we developed and evaluated an instrument to assess the effectiveness of the EA realization process: the Enterprise Architecture Realization Scorecard (EARS). Applying the instrument includes consecutively: a) selecting some representative EA goals; b) identifying and examining the results produced in the context of an EA goal; c) scoring the results on the basis of indicators; and d) describing the strengths and weaknesses of the EA realization process. An EARS assessment is primarily used for awareness and improvement

2 Authors’ final version – Published in: Journal of Enterprise Architecture, May 2013 - www.globalaea.org
regarding the effectiveness of the EAM function, but may also be used for governance with respect to the progress and quality regarding the realization of an EA goal.
The effectiveness of EAM can be viewed, defined and measured in many different ways (Morganwalp and Sage 2004). The EARS approach focuses on the EA realization process, and states that this process is effective, when the EAM function is able to transform a given baseline situation into a target situation, as specified by one or more goals set out to the EAM function; see Figure 1. These EA goals, or in terms of TOGAF (The Open Group 2009) “requests for architecture work”, should be aligned with the corporate strategy. There is a large variety in type and scope of goals set to different EAM functions. The EARS instrument is not designed for specific types of EA goals, but is intended to be applicable for all types of EA goals. Some examples of EA goals are as follows: "The organization should be able to implement a change in legislation within three months", and “The application portfolio has to be rationalized to reduce costs”.
Figure 1: The EA realization process of an EAM in context The research approach applied to develop the EARS is that of design-science research (Hevner et al. 2004, Peffers and Tuunanen 2008), since our research was intended to deliver artifacts relevant to the professional practice. The applied approach conformed to the seven guidelines of Hevner et al. For instance, the design of the EARS was discussed and evaluated in two meetings with ten experts from the professional field, and in four meeting with participants from four different academic institutions. Furthermore, EARS assessments were conducted at large organizations to evaluate the applicability.
1.1 Related Work A number of instruments with similar objectives is developed and proposed, like EA balanced scorecard (Schelp and Stutz 2007), EA maturity models (Luftman 2000, Ross 2003, Van Steenbergen et al. 2010), and EA analysis approaches (Buckl et al. 2009, Johnson et al. 2007). The main difference between the balanced scorecard approach and the EARS approach is that the balanced scorecard approach is concerned only with the outcome (added value) of EAM, while the EARS approach is also concerned with how the outcome is achieved.
The main difference with the maturity approach is that this approach measures the effectiveness of the EA realization process indirectly (assuming that when a certain maturity level is reached for each key area, the EAM function will operate effectively), while the EARS approach aims to measure the effectiveness of each step in the EA realization process directly, by assessing the results.
The main difference with the EA analysis approaches is that, expressed in terms of Buckl's classification schema (Buckl et al. 2009), most of them have a specific Analysis Concern, often a specific quality attribute, and have a related specific Body of Analysis, while in the EARS approach the Analysis Concern and the Body of Analysis will vary per EA goal. Furthermore, the EARS approach does not only focus on EA artifacts, but on all results of the EA realization process, including acceptance of architectural decisions, outcomes of architecture conformance checks, et cetera.
3 Authors’ final version – Published in: Journal of Enterprise Architecture, May 2013 - www.globalaea.org
Another line of research, interesting to our study, attempts to relate benefits of EAM to applied techniques/mechanisms (e.g., Foorthuis et al. 2010, Lange et al. 2012, Tamm et al. 2011, Van der Raadt et al. 2010). The focus of this line of research is on general benefits of EAM, like reduced resource duplication, or improved agility. In contrast, the EARS approach focuses on goals set to a specific EAM function. Though, a general benefit can be included in the set of EA goals of an EAM function, and then its realization can be measured within an EARS assessment, especially when the EA goal is defined specific and measurable.
The next section of this paper presents the EARS instrument, while the two following sections successively describe the method to apply the instrument and illustrate the application by means of a case study. The section thereafter discusses the research so far and its limitations. The last section concludes the article and provides an outlook to future work.
2 The EARS Instrument The objective of the EARS approach is to measure the actual achievement of the EAM function regarding the realization of one or more EA goals. During an assessment, the focus is on the results of the EA realization process, because results show the actual effect of the EAM’s work. Since measuring the organizational and IT performance is a well-established practice within the body of knowledge of (IT) governance, the principles of the CobiT framework (IT Governance Institute 2007a) were used as a base of the EARS concept. One proposition, based on CobiT, is that to realize an EA goal, the EAM function should execute a repeatable EA realization process, composed of a logical sequence of EA activities. Also in line with CobiT, metrics were specified to enable the measurement of the results of the EA activities.
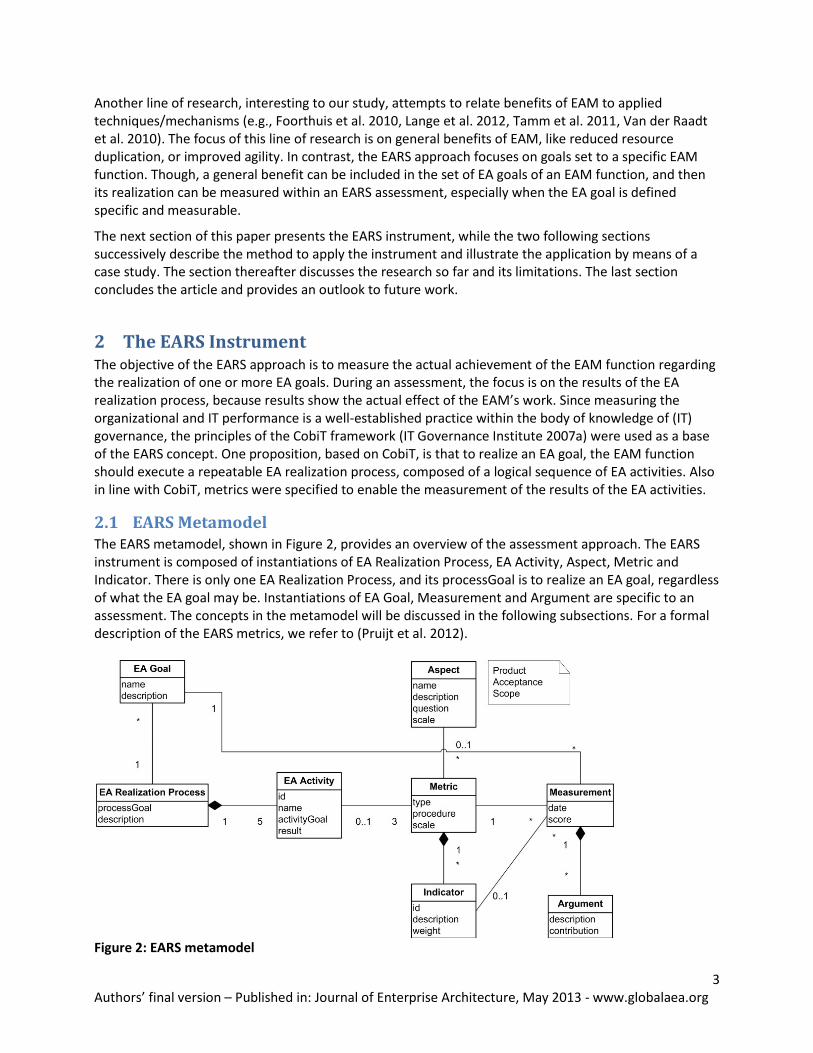
2.1 EARS Metamodel The EARS metamodel, shown in Figure 2, provides an overview of the assessment approach. The EARS instrument is composed of instantiations of EA Realization Process, EA Activity, Aspect, Metric and Indicator. There is only one EA Realization Process, and its processGoal is to realize an EA goal, regardless of what the EA goal may be. Instantiations of EA Goal, Measurement and Argument are specific to an assessment. The concepts in the metamodel will be discussed in the following subsections. For a formal description of the EARS metrics, we refer to (Pruijt et al. 2012).
Figure 2: EARS metamodel

4 Authors’ final version – Published in: Journal of Enterprise Architecture, May 2013 - www.globalaea.org
2.2 EA Realization Process In the EARS, the EA realization process is decomposed into five EA activities, each with a distinctive, assessable result. Examination of these five results provides sufficient insight into the realization process to discover its strengths and weaknesses, and to identify case specific point for improvements. Figure 3 shows the EA activities (depicted by rectangles) with their results, and Table 1 describes their characteristics.
Figure 3: The five EA activities with their results
The five EA activities were derived from the Architecture Development Method (ADM) of TOGAF 9 (The Open Group 2009), because ADM offers an architecture development cycle that covers all life cycle aspect as required by GERAM (Saha 2004). To ensure completeness of the set of EA activities and results, other sources (e.g., Wagter et al. 2005, Winter and Fischer 2007) were also studied, and we used expert meetings to validate our proposals. Although EARS is based on TOGAF, its EA realization process differs from TOGAF's ADM. EARS distinguishes five EA activities, while ADM recognizes nine phases, so the mapping (shown in Table 1) is not one to one. The first two EA activities of EARS can be linked plainly to four ADM phases. For the last three EA activities, coupling is more complex. For instance, within ADM Phase G, Implementation Governance, the architecture is implemented within the solution under development, but the solution also is implemented in the operational environment within phase G. These two results are considered as very different within the EARS and consequently they are measured separately. Table 1: Characteristics of the five activities
Id EA Activity EA Activity Goal Result ADM Phase
#1 Define Vision Determine the EA goals within scope of the architecture iteration, develop a high level, integrated and approved solution direction towards matching these goals and create a concise realization plan.
Architecture Vision
A
#2 Develop Sub Architectures
Develop the required subsets of architectures to support the agreed architecture vision.
Architecture Design
B, C, D
#3 Plan Migration Search for opportunities to implement the architecture and plan the migration.
Migration Plan
E, F
#4 Supervise Implementation Projects
Ensure conformance to the architecture during the development and implementation projects.
Project Result
F, G
#5 Exploit the Architecture in Operation
Assess the performance of the architecture in operation, ensure optimal use of the architecture, and ensure continuous fit for purpose.
Operational Result
G, H

5 Authors’ final version – Published in: Journal of Enterprise Architecture, May 2013 - www.globalaea.org
2.3 Aspects During an EARS assessment the five results are identified, examined and valued. To enable a balanced way of measuring, for each result three aspects are scored separately: product, acceptance, and scope. Separate scoring of these aspect is practical, since an architect can design a top quality solution (product aspect), but if it is not accepted (acceptance aspect), nothing is gained. On the other hand, if the top quality solution is limited to one architectural domain, like technology, while other domains are affected as well (scope aspect), the goal may never be realized. The three aspects, with their focus, question and scale, are defined in Table 2.
Table 2: The aspects to be valued per result
Result Aspect Focus/Question Scale
Product Focus: The accuracy of the outputs and the completeness, in terms of depth. Question: To which extent will the EA-goal be realized with it?
1-10
Acceptance Focus: The acceptance and commitment of the stakeholders. Question: To which extent do they know, understand and agree with the product, and do they act committed?
1-10
Scope Focus: The completeness, in terms of width, of the outputs. Question: Is the output width sufficient to realize the goal?
1-10
2.4 EARScorecard For each EA activity result, the three aspects are scored separately, and these scores are recorded at the EARScorecard, which summarizes the assessment outcome. An example of a scorecard is shown in Table 3; the outcome of an assessment at a large government organization. Most scores in an EARScorecard are at a scale of 1-10, where 1 stands for a minimal contribution of an aspect or result to the realization of the EA-goal (10 percent or less of what might be achieved), and 10 for an optimal contribution (100 percent). The intermediate values allow differentiation, where 5 (just insufficient) and 6 (just sufficient) mark boundary values. Since the scores represent substantiated opinions and not exactly measured data, the numbers are rounded off to integers. The well-known scales for the scores and totals enhance the easy interpretation of the outcomes.
Table 3: EARScorecard of the EA goal “Provide clarity to customers more quickly”
Id Result Aspect Aspect
score
Scope
score
Aspect
total
Result
total
#1 Architecture Vision
Product 9 10
9 10
Acceptance 10 10
#2 Architecture Design Product 4 10
4 4
Acceptance 4 4
#3 Migration Plan Product 10 10
10 10
Acceptance 10 10
#4 Project Result Product 4 10
4 5
Acceptance 6 6
#5 Operational Result Product 1 5
1 1
Acceptance 1 1
Goal total 59
The aspect scores of product, acceptance and scope are specified by the assessor(s), whereas the totals in the scorecard are calculated, based on the aspect scores. The aspect total is calculated as the multiplication of the aspect score (product or acceptance) with the scope score for a result of a goal, divided by 10. The result total is calculated as the average of the two aspect totals for a result of a goal.

6 Authors’ final version – Published in: Journal of Enterprise Architecture, May 2013 - www.globalaea.org
Finally, the sum of the aspect totals constitutes the goal total, expressed on a scale from one to hundred. The general question during an EARI assessment is: To which extent is an EA goal realized and can this be related to the effort of the EA function? A satisfying answer to this question should lead to high scores for the result totals and consequently for the goal total. The value of the goal total can be used to mark progress regarding the EA goal, but it will not show the underlying reasons for the score, which can be very diverse. Generally, more interesting are the other totals and scores of an assessment, as they show the strengths and weaknesses of the EAM function in achieving its goals.
2.5 Indicators To support the assessors and to standardize the rating, indicators were developed for each combination of result and aspect. TOGAF's ADM (The Open Group 2009) was used as main source, since it provides elaborate descriptions of objectives, intent, approach, activities, artifacts, inputs and outputs for each phase (Saha 2004). As additional source, (Wagter et al. 2005) was used. The sets of indicators for result #1 - #5 are shown respectively in Table 4 - 8. They are also utilizable in cases where TOGAF ADM is not used. The technique of scaled coverage percentage (Van Zeist et al. 1996) was used to classify the indicators and prioritize them with relative weights (W). The relative weights total to 1.0 per aspect.
Table 4: Set of indicators of result #1, Architecture Vision
Aspect Id Indicator W
Product 1 The EA-goal is related to the business strategy and included in the vision. 0.2
2 The EA-goal is SMART and (if needed) decomposed into high level stakeholder requirements. 0.2
3 A high level solution direction is described and the solution direction to the goal is accurate. 0.2
4 The solution direction to the goal is integrated with the solution directions of other goals. 0.3
5 A comprehensive plan exists to realize the solution direction. 0.1
Acceptance 1 The architecture vision is well-known by the stakeholders. 0.2
2 The stakeholders understand the vision, the solution direction to the goal and its implication. 0.2
3 The stakeholders agree with the solution direction to the goal and its implications. 0.3
4 The stakeholders feel committed to (this part of) the vision. 0.3
Scope 1 The architecture vision covers all aspects relevant to the goal: business, data, application, and/or technology.
1.0
Table 5: Set of indicators of result #2, Architecture Design
Aspect Id Indicator W
Product 1 The baseline architecture is described. 0.2
2 The parts affected by the goal, are identified. 0.1
3 The target architecture is described and the solution to the goal is accurate. 0.2
4 The solution to the goal is integrated with the solutions of other goals. 0.2
5 The architectural artefacts are specific enough to substantiate architectural decisions. 0.2
6 A gap analysis (impact analysis) is included. 0.1
Acceptance 1 The architecture design is well-known by the stakeholder. 0.2
2 The stakeholders understand the solution to the goal and its implication. 0.2
3 The stakeholders agree with the solution to the goal and its implications. 0.3
4 The stakeholders feel committed to the architectural solution. 0.3
Scope 1 The architecture design covers all aspects relevant to the goal: business, data, application, and/or technology.
1.0

7 Authors’ final version – Published in: Journal of Enterprise Architecture, May 2013 - www.globalaea.org
Table 6: Set of indicators of result #3, Migration Plan
Aspect Id Indicator W
Product 1 An architecture roadmap to realize the goal is defined, and, if needed, the transition architecture
is described.
0.3
2 The work packages needed to realize the goal are assigned to projects in the project portfolio, and,
if needed, specified in an implementation and migration plan.
0.7
Acceptance 1 The decision makers agree with the architecture roadmap and related plans. 0.3
2 The decision makers include the required work packages into the project portfolio. 0.7
Scope 1 All the work (work packages, projects) needed to realize the goal is included in the migration plan.
If not, consider the ratio between: a) work included, and b) all the work needed for the goal.
1.0
Table 7: Set of indicators of result #4, Project Result
Aspect Id Indicator W
Product 1 The architecture definition and architecture requirements relevant for the goal are provided to the
project(s), and are specific enough to direct decisions of the project architects.
0.3
2 The architectures needed for the goal are realized in conformance to the architecture definition
and the architecture requirement. Exceptions or changes are approved by the EA function.
0.7
Acceptance 1 The goal and architectural solution is well-known by the project architects. 0.2
2 The project architects understand the architectural solution to the goal and its implication. 0.2
3 The project architects agree with the architectural solution to the goal and its implications. 0.3
4 The project architects feel and act committed to implement the architectural solution. 0.3
Scope 1 All the work (work packages, projects) needed to realize the goal is completed by the projects.
If not, consider the ratio between: a) work completed, and b) all the work needed for the goal.
1.0
Table 8: Set of indicators of result #5, Operational Result
Aspect Id Indicator W
Product 1 Improvements related to the goal are achieved in the operational environment, in conformance to
the target performance indicators.
0.8
2 The performance is still conform goal after x years of operation. Work needed to reach this result
is organized and executed.
0.2
Acceptance 1 The stakeholders are satisfied with the realized operational environment. 1.0
Scope 1 All intended improvements related to the goal are achieved in the operational environment.
If not, consider the ratio between: a) achieved improvements, and b) all the improvements related
to the goal.
1.0
2.6 Arguments Indicators aid the assessor, but have a high level of abstraction, since they have to be useful for very
different types of EA goals. Consequently, an indicator score needs substantiation as well, which is
included in the EARS approach by means of arguments. Arguments represent case specific evidence,
assembled during interviews and examinations of architectural artifacts. Arguments are sorted per
indicator and recorded in tables. Per argument a contribution (positive, negative, neutral) is
documented, and preferably also a reference to its source (interviewee or document). A set of
arguments is shown in Table 10.

8 Authors’ final version – Published in: Journal of Enterprise Architecture, May 2013 - www.globalaea.org
3 Method The process to execute an EARS assessment is summarized below. The main line of this process corresponds with the “overall process of enterprise architecture analysis” (Johnson et al. 2007).
1. Prepare the assessment with the responsible manager. a. Determine the objective of the assessment. b. Determine the position of the EAM function within the organization. c. Select one or two EA goals of the EAM function.
Opt for representative goals, where the organization has been working on in recent years. d. Select the architect(s) and stakeholders, suitable to the selected goal(s).
Include at least one relevant stakeholder per EA activity. A typical set interviewees consists of a business manager, information manager, enterprise architect, portfolio manager, solution architect, software engineer, business operations expert.
e. Plan the assessment; the interviews and progress meetings. 2. Collect evidence.
a. Assemble and study relevant documents (strategy, goals, architecture, roadmaps, project portfolios ...).
b. Interview the stakeholders and architects. c. Describe the findings as arguments per indicator.
3. Interpret the evidence and set up a report. a. Process the arguments into indicator scores and scorecard scores. b. Interpret the scores and describe the strengths and weaknesses of the EA realization
process. c. Set up an assessment report with the scorecard and graphics, strengths and weaknesses, and
recommendations for improvement. 4. Present the outcomes of the assessment.
a. Discuss the report and the findings with the responsible manager. b. Present the results to the architects and stakeholders.
3.1 Scoring An EARS assessment is a retrospective examination of an EA goal’s realization process, which may have spanned several years. To value the results and determine the effectiveness of the EA realization process, information is gathered by means of interviews and document study. The scores within the EARScorecard will often represent substantiated opinions; opinions of the assessor about the observed strengths and weaknesses of the EAM function, substantiated by arguments and indicator scores. To score the results, the assessor should be able to determine and value the artifacts (depth and width) required to realize a specific goal. Questionnaires and indicators are available to support assessors, but since the indicators have a high level of abstraction, other sources should be used as well. The EARS-indicators are derived from the TOGAF ADM input and output descriptions per phase (The Open Group 2009), so knowledge of ADM and the "Enterprise Content Metamodel" is desirable. Furthermore, many other sources are useful, like 'Essential layers, artifacts, and dependencies of EA' (Winter and Fischer 2007) and 'An engineering approach to EA design' (Aier et al. 2008).

9 Authors’ final version – Published in: Journal of Enterprise Architecture, May 2013 - www.globalaea.org
4 Case Study To evaluate and improve EARS, the instrument was used in four organizations, located in the Netherlands; two full assessments and two brief assessments were conducted. The EARScorecard of an assessment case at a large governmental organization is shown in Table 3, and the case is described in more detail in (Pruijt et al. 2012). Another assessment case, at a large financial service provider, will be discussed below. The company in this case is in transition from a decentralized organization, composed of more than ten companies and brands, to one centralized company, striving for one way of working and for operational excellence. For this assessment, the following EA goal was selected, "Implement a corporate data warehouse". A plan which included the goal was approved about three years before the assessment, and the organization had worked on its realization, since then. The EA goal was ambitious, since sub goals included not only corporate wide business intelligence (BI), including the replacement of many local BI-applications, but also the provision of integrated production data to portal and output services.
4.1 Strengths, Weaknesses and Recommendations The assessment’s evidence collection included a total of two days of document study and ten interviews, which mostly lasted 30-60 minutes. The EARS scores in Figure 4 and 5 provide an overview of the assessment’s outcome, and show some strengths and weaknesses. In the assessment report, twelve strengths and sixteen weaknesses were described, based on indicator scores and arguments. Some of them will be explained below.
Figure 4: Result total per EA activity result
Figure 5: Product, Acceptance and Scope score per EA activity result
8
5
8
32
65 5
2
76
1
43
1
0
2
4
6
8
10
Product Acceptance Scope
Architecture Vision Architecture Design Migration Plan Project Result Operational Result

10 Authors’ final version – Published in: Journal of Enterprise Architecture, May 2013 - www.globalaea.org
#1 Architecture Vision scores relatively high on the aspects product and scope, since the goal was part of a proper and quite complete architecture master plan, which provided an integrated solution to several goals, in line with the business strategy. However, a weakness of the plan was the absence of SMART sub-goals. Acceptance scores moderate, because the vision was mainly developed on the ICT-side and was not well communicated with the business side. #2 Architecture Design scores low, because nearly no architecture design was done before the implementation projects started. Only the baseline application architecture was described, but little more. This is probably one of the reasons why the first projects in the roadmap encountered huge problems. For instance, complexity turned out much higher than anticipated. #3 Migration Plan scores low. The initial projects were approved by business management, but trust disappeared when these projects ran out of time and budget. Consequently, follow-up projects were not approved; reason for the remarkable decrease in scope score. At the time of the assessment, only a small part of the roadmap was realized: a few sub-goals have survived; the others have vanished with time. #4 Project Result scores low, mainly because of the influence of the low scope score. Product and acceptance score much higher, since the architects guided the projects actively (product aspect) and their contribution was appreciated (acceptance aspect). Because of the lack of Architecture Design, no architectural definitions and requirements were provided by the EAM function at the initiation stage of the projects, but principles and architectural artifacts were developed over the years. #5 Operational Result scores very low. Once more because of the low scope score, but product and acceptance score low as well. A positive result is that one minor application was successfully implemented enterprise-wide, and it is well accepted by the business. However, the major BI-application was used by only a small part of the company, and the business users were dissatisfied. Some recommendations provided in this case are the following:
Identify explicit goals to the EAM function in collaboration with the stakeholders. Set realistic and SMART (sub) goals and work from these goals.
Develop architectural artifacts to substantiate and verify the accuracy, impact and feasibility of the goals and solution directions. Do this for both the baseline and target situation and use these as a base for roadmaps.
Do not combine major goals and complex projects with a bottom-up strategy regarding the development of the EAM function and EA artifacts.
4.2 Indicator Scores The product scores, acceptance scores and scope scores were each constituted by the weighted average of the related indicator scores. As an illustration, Table 9 shows how the scores of result #1 Architecture Vision are composed of the indicator scores. Per indicator, the indicator score (S), valued by the assessor on a scale of 1-10, is multiplied with the indicator’s weight (W) to the indicator total (T).

11 Authors’ final version – Published in: Journal of Enterprise Architecture, May 2013 - www.globalaea.org
Table 9: Aspect and indicator scores of result #1, Architecture Vision
Aspect Id Indicator W S T
Product 1 The EA-goal is related to the business strategy and included in the vision. 0.2 10 2.0
2 The EA-goal is SMART and, if needed, decomposed into high level stakeholder requirements. 0.2 6 1.2
3 A high level solution direction is described and the solution direction to the goal is accurate. 0.2 7 1.4
4 The solution direction to the goal is integrated with the solution directions of the other goals. 0.3 8 2.4
5 A comprehensive plan exists to realize the solution direction. 0.1 7 0.7
Product score 7.7
Accep-tance
1 The architecture vision is well-known by the stakeholder. 0.2 8 1.6
2 The stakeholders understand the vision, the solution direction to the goal and its implication. 0.2 4 0.8
3 The stakeholders agree with the solution direction to the goal and its implications. 0.3 5 1.5
4 The stakeholders feel committed to (this part of) the vision. 0.3 4 1.2
Acceptance score 5.1
Scope 1 The architecture vision covers all aspects relevant to the goal: business, data, application, and/or technology.
1.0 8 8.0
Scope score 8.0
4.3 Arguments The indicator values were substantiated by means of arguments collected during the assessment. For instance, with regard to result #1 Architecture Vision, twenty five arguments were gathered, varying from two to seven arguments per indicator. Approximately 60% of these arguments originated from the study of architectural artifacts, while the remaining 40% did arise during the interviews. Arguments are described in case specific terms, so to ensure anonymity; Table 10 shows only a few, condensed examples.
Table 10: Arguments regarding two indicators of the product aspect of result #1
Aspect Indicator Contribution Argument description
Product 1 + +
The EA goal is based on the corporation’s strategy and target operating model. Conformance is confirmed by several interviewees.
2 - + + -
The goal is not formulated explicitly, it is not SMART and no sub-goals were specified. Sub-goals can be derived from the architecture master plan. Stakeholder requirements are described in the master plan as business and ICT issues. No objectives were set for the EAM function, when the function was initiated.
5 Discussion The EARS assessments, described above, proceeded without problems and provided interesting outcomes and recommendations to the organizations involved. The two full assessments show large differences in the EAM's goals and approaches, and the assessments delivered very different outcomes. However, some similarities were identified as well. Both EA functions scored low on Architecture Design, especially the target architecture. This was partly compensated, by a shared effort to draw up solution architectures within the projects. Another similarity is that both EA functions failed to check on conformance during the implementation. These findings match with research on the maturity level of 56 EAM cases (Van Steenbergen et al. 2010), where the focus areas 'Development of architecture' and 'Monitoring' scored respectively low and very low on the maturity scale.

12 Authors’ final version – Published in: Journal of Enterprise Architecture, May 2013 - www.globalaea.org
The case studies were also focused on the evaluation of the EARS approach itself. During the interviews and meetings of the case studies, additional information was gathered to gain insight in the applicability, effectiveness and efficiency of the instrument. The EARS approach appeared to be effective, since the scorecard, indicator values and assembled arguments proved to be an adequate base to identify the strengths and weaknesses of the realization process and to provide recommendations. Moreover, the responsible managers and key stakeholders approved the outcome of the assessments, and interviewees who were asked whether the main aspects of the architecture function were covered during the interview, responded positively. As additional revenue, a responsible manager observed that the assessment stimulated the internal discussion regarding the focus, method and effectiveness of the architecture function. During the case studies, the EARS instrument proved to be an applicable instrument. Some examples of findings during the case studies which substantiate this statement are the following:
The EA goals were well identifiable and selecting representative goals did not cause problems.
EA activities and the results were sufficiently distinctive and recognizable and could be found in practice.
The result aspects “product”, “acceptance” and “scope” were generally well identifiable. However for some activities, two result aspects are closely linked. Such as in # 3 Migration Plan, where “product” and “acceptance” are not well distinguishable and thus are given the same value.
5.1 Limitations The outcomes of the case studies give us reasons to believe that the EARS can be applied conveniently and is effective as an assessment instrument for awareness and improvement purposes. However, there are some limitations to our research so far. Although several assessments in different types of organizations were conducted in the Netherlands, our research findings are not inevitably valid for other companies, sectors or countries. Another limitation of our study is that we could not provide a valid conclusion regarding the efficiency of the assessment method, since no comparison with other were possible. A third limitation concerns the indicators and their relative weights. Since there was no sound scientific base available, we used professional literature and common sense. So the indicators and their relative weights will likely evolve with advancements in research and practice.
6 Conclusions and Future Work In this paper, we presented a novel instrument to assess and rate how well an EAM function is able to realize its goals: the Enterprise Architecture Realization Scorecard (EARS). The instrument decomposes the EA realization process into five EA activities, each with a distinct result. For each result, three aspects are examined and scored separately: product, acceptance and scope. During the assessment of an organization specific EA goal, the results of the EA realization process are identified and examined by means of interviews and document study. The results are examined to assemble arguments, which are translated to numerical scores, by means of indicators. The outcome of an assessment is a report, with an EARScorecard, diagrams, strengths and weaknesses of the EA realization process, and recommendations.
We used a case study to illustrate how the EARS instrument is used in practice. The EARS approach appeared to be effective in practice. The scorecard, indicator values and assembled arguments proved to be an adequate base to identify the strengths and weaknesses of the realization process and to provide recommendations. Furthermore, the assessment stimulated the internal discussion regarding the focus, method and effectiveness of the architecture function.

13 Authors’ final version – Published in: Journal of Enterprise Architecture, May 2013 - www.globalaea.org
Our study contributes to the professional practice, by adding an assessment instrument that can be used to evaluate the effectiveness of an EAM function's realization process. To strengthen the link to the professional practice, the instrument is based on two well-accepted open standards: CobiT (IT Governance Institute 2007b), and TOGAF (The Open Group 2009). The EARS instrument contributes to the research on architecture effectiveness by focusing on the EA realization process and its results. Distinctive characteristics of the EARS assessment approach are:
Focus on EA goals which are specific to the organization;
Focus on the EA realization process, its activities and results;
Numerical scores in the EARScorecard to support reasoning about the strengths and weaknesses of the EA realization process;
Aspects and indicators to aid the evaluations of results.
6.1 Future Work
Interesting topics for future work emerged during this study. Research is needed to determine whether the assessment results of one or two representative goals can be generalized to general statements about the EA function. Furthermore, comparative research on EARS and other EA assessments approaches could be interesting. It could contribute to the further development of the set of indicators. In addition, it might reveal and explain correlations between focus areas of maturity models and high scores in the EARScorecard.
6.2 Acknowledgement. This paper results from the ArchiValue project, a collaboration between Novay, APG, the Dutch Tax and Customs Administration, BiZZdesign, University of Twente, and HU University of Applied Sciences Utrecht.
6.3 About the Authors Leo Pruijt ([email protected]) is lecturer and researcher at the Information Systems Architecture Research Group of the HU University of Applied Sciences, Utrecht, The Netherlands, and PhD candidate at the University of Utrecht, Utrecht, The Netherlands.
Raymond Slot ([email protected]) is professor of the Information Systems Architecture Research Group at the HU University of Applied Sciences, Utrecht, The Netherlands.
Henk Plessius ([email protected]) is lecturer and researcher at the Information Systems Architecture Research Group of the HU University of Applied Sciences, Utrecht, The Netherlands.
Sjaak Brinkkemper ([email protected]) is professor of Organization and Information at the Institute of Information and Computing Sciences of Utrecht University, Utrecht, The Netherlands.
7 References Aier, S., Kurpjuweit, S., Schmitz, O., Schulz, J., Thomas, A., and Winter, R. 2008. “An Engineering Approach to
Enterprise Architecture Design and its Application at a Financial Service Provider,” In Proceedings of Modellierung betrieblicher Informationssysteme, P. Looos, M. Nüttgens, K. Turowski, and D. Werth (eds.), Gesellschaft für Informatik, pp. 115 – 130.
Bucher, T., Fischer, R., Kurpjuweit, S., and Winter, R. 2006. “Enterprise Architecture Analysis and Application – An Exploratory Study,” In Proceedings of Trends in Enterprise Architecture Research (Vol. Hong Kong), pp. 28.

14 Authors’ final version – Published in: Journal of Enterprise Architecture, May 2013 - www.globalaea.org
Buckl, S., Matthes, F., and Schweda, C. M. 2009. “Classifying Enterprise Architecture Analysis Approaches,” Enterprise InteroperabilitySpringer, pp. 66–79.
Foorthuis, R., Steenbergen, M. Van, Mushkudiani, N., Bruls, W., Brinkkemper, S., and Bos, R. 2010. “On course, but not there yet: Enterprise Architecture conformance and benefits in systems development,” In Proceedings of the International Conference on Information Systems.
Hevner, A., March, S., Park, J., and Ram, S. 2004. “Design science in information systems research,” MIS quarterly (28:1), pp. 75–105.
IT Governance Institute. 2007a. CobiT 4.1 Excerpt, Executive Summary. IT Governance Institute. 2007b. CobiT 4.1. Johnson, P., Johansson, E., Sommestad, T., and Ullberg, J. 2007. “A Tool for Enterprise Architecture Analysis,”
Proceedings of the International Enterprise Distributed Object Computing ConferenceIeee, pp. 142–142. Lange, M., Mendling, J., and Recker, J. C. 2012. “Measuring the realization of benefits from enterprise architecture
management,” Journal of Enterprise Architecture (8:2)Association of Enterprise Architects, pp. 30–44. Lankhorst, M. 2009. Enterprise Architecture at Work, Springer, Berlin. Luftman, J. 2000. “Assessing business-IT alignment maturity,” Communications of AIS (4). Morganwalp, J., and Sage, A. 2004. “Enterprise architecture measures of effectiveness,” International Journal of
Technology, Policy and Management (4:1), pp. 81–94. Peffers, K., and Tuunanen, T. 2008. “A design science research methodology for information systems research,”
Journal of Management Information Systems (4), pp. 45–78. Pruijt, L., Slot, R., Plessius, H., Bos, R., and Brinkkemper, S. 2012. “The Enterprise Architecture Realization
Scorecard: A Result Oriented Assessment Instrument,” In Trends in Enterprise Architecture Research, S. Aier, M. Ekstedt, F. Matthes, E. Proper, and J. L. Sanz (eds.), (Vol. LNBIP 131)Springer Berlin Heidelberg, pp. 300–318.
Van der Raadt, B., Bonnet, M., Schouten, S., and Van Vliet, H. 2010. “The relation between EA effectiveness and stakeholder satisfaction,” Journal of Systems and Software (83:10)Elsevier Inc., pp. 1954–1969.
Van der Raadt, B., Slot, R., and Vliet, H. 2007. “Experience Report: Assessing a Global Financial Services Company on its Enterprise Architecture Effectiveness Using NAOMI,” In 2007 40th Annual Hawaii International Conference on System Sciences (HICSS’07)IEEE, pp. 218b–218b.
Ross, J. 2003. “Creating a strategic IT architecture competency: Learning in stages,” MIS quarterly (2:2). Saha, P. 2004. Analyzing the open group architecture framework from the geram perspective The Open Group, Tech.
Rep, pp. 1–27. Schelp, J., and Stutz, M. 2007. “A balanced scorecard approach to measure the value of enterprise architecture,”
Journal of Enterprise Architecture (3:4), pp. 8–14. Van Steenbergen, M., Van den Berg, M., and Brinkkemper, S. 2007. “A Balanced Approach to Developing the
Enterprise Architecture Practice,” In Proceedings of the International Conference on Enterprise Information Systems, J. Filipe, J. Cordeiro, and J. Cardoso (eds.), Springer, pp. 240–253.
Van Steenbergen, M., Schipper, J., Bos, R., and Brinkkemper, S. 2010. “The Dynamic Architecture Maturity Matrix: Instrument Analysis and Refinement,” In Proceedings of Trends in Enterprise Architecture Research, A. Dan, F. Gittler, and F. Toumani (eds.), (Vol. 6275)Springer Berlin Heidelberg, pp. 48–61.
Tamm, T., Seddon, P., Shanks, G., and Reynolds, P. 2011. “How Does Enterprise Architecture Add Value to Organisations?,” Communications of the AIS (28:1).
The Open Group. 2009. “The Open Group Architecture Framework: Version 9, Enterprise Edition.,”. Wagter, R., Berg, M. van den, Luijpers, J., and Steenbergen, M. van. 2005. Dynamic Enterprise Architecture: How to
Make It Work, John Wiley & Sons, New York. Winter, K., Buckl, S., Matthes, F., and Schweda, C. M. 2010. “Investigating the state-of-the-art in enterprise
architecture management method in literature and practice,” In Proceedings of the Mediterranean Conference on Information Systems.
Winter, R., and Fischer, R. 2007. “Essential layers, artifacts, and dependencies of enterprise architecture,” Journal of Enterprise Architecture (May), pp. 1–12.
Van Zeist, B., Hendriks, P., Paulussen, R., and Trienekens, J. 1996. Kwaliteit van software producten, Kluwer, Dventer, Netherlands.