a study undertaken on behalf of interpharma the … companies in ... the importance of the...
TRANSCRIPT
PolynomicsDr. Stephan Vaterlaus, Dr. Stephan Suter, Barbara Fischer
In cooperation with BAK Basel Economics
A study undertaken on behalf of Interpharma
The Importance of the Pharmaceutical Industry for Switzerland

Published by:
Interpharma, Association of research-basedpharmaceutical companies in Switzerland, Basel
© Interpharma /Polynomics, September 2011
Ordering address: InterpharmaPetersgraben 35, P.O. BoxCH-4003 BaselE-mail: [email protected]: www.interpharma.ch
Layout:Continue AG, Basel
Printing:Effingerhof, Brugg

Table of contents
Preface by the client . . . . . . . . . . . . . . . . . . . . . . . . . . . . . . . . . . 2
1 In brief . . . . . . . . . . . . . . . . . . . . . . . . . . . . . . . . . . . . . . . . . . . . . 4 2 The pharmaceutical industry as an employer . . . . . . . . . . . . . 6 2.1 Numbers of persons employed . . . . . . . . . . . . . . . . . . . . . . . . . . . . 6 2.2 Hours worked . . . . . . . . . . . . . . . . . . . . . . . . . . . . . . . . . . . . . . . . . 7 2.3 Importance for other sectors. . . . . . . . . . . . . . . . . . . . . . . . . . . . . 10 3 The pharmaceutical industry’s added value contribution . . . . . . . . . . . . . . . . . . . . . . . . . . . . . . . . . . . 14 3.1 The pharmaceutical industry’s direct contribution to growth . . . . . 14 3.2 Importance for other sectors. . . . . . . . . . . . . . . . . . . . . . . . . . . . . 17 4 Productivity of the pharmaceutical industry . . . . . . . . . . . . . 20 4.1 Productivity per job . . . . . . . . . . . . . . . . . . . . . . . . . . . . . . . . . . . . 20 4.2 Added value per hour worked . . . . . . . . . . . . . . . . . . . . . . . . . . . . 21
5 The pharmaceutical industry as an export sector . . . . . . . . . 24
6 Estimate of tax revenue and consumer spending . . . . . . . . . 26 7 Summary . . . . . . . . . . . . . . . . . . . . . . . . . . . . . . . . . . . . . . . . . . 28
8 Annex 1: Demarcation of sectors . . . . . . . . . . . . . . . . . . . . . . 34
9 Annex 2: Methods . . . . . . . . . . . . . . . . . . . . . . . . . . . . . . . . . . . 36 9.1 Input-output table . . . . . . . . . . . . . . . . . . . . . . . . . . . . . . . . . . . . . 36 9.2 Calculation of multipliers . . . . . . . . . . . . . . . . . . . . . . . . . . . . . . . . 37 10 List of sources . . . . . . . . . . . . . . . . . . . . . . . . . . . . . . . . . . . . . . 42

2 Polynomics / BAK Basel Economics
Preface by the client
The global macroeconomic environment is currently characterized by turmoil of various types. To take an example, the banking crisis in the wake of the collapse of Lehman Brothers (the US investment bank) was followed by the debt crisis in various European countries. This was accompanied by a significant strengthen-ing of the Swiss franc, against which (in particular) Switzerland’s export-oriented sectors increasingly have to battle on the basis of their international competitive capabilities. Finally, the regulatory environment has become even stricter. The trend toward more intensive sector-specific regulation appears to be continuing unabated. In recent months, for instance, political discussions focused on regu-latory measures to overcome the banking crisis, or the regulation of energy mar-kets. Another constant topic as regards sector regulation is the healthcare sec-tor. Catchphrases such as the planned introduction of “Diagnosis Related Groups (DRG)”, the renewed discussions about a single health insurance scheme and measures to cut healthcare expenditure have featured in political debates for a number of years.
Thomas B . Cueni, Secretary General of Interpharma

The importance of the pharmaceutical industry for Switzerland 3
The pharmaceutical industry is a key player in the healthcare sector. Its core characteristics are its dependency on research and development, its interna-tional nature and its ability to adapt to constant changes in prevailing conditions. This adaptability can best be demonstrated by taking a look at the changes in the chemical-pharmaceutical industry since the start of the 1990s. At that time, for example, the chemical industry’s share of the total number of persons em-ployed in life sciences in the metropolitan region of Basel was 84 %; the figure for the pharmaceutical industry was 10 %, and agrotech/medtech accounted for 6 %. Barely 20 years later, the weightings have shifted significantly in favour of the pharmaceutical industry (56 %) and the agrotech and medtech sectors (24 %). The classical chemical industry now accounts for a mere 20 % of jobs.
The subsectors of the chemical-pharmaceutical industry differ in many respects. Despite the pharmaceutical industry’s strong growth over recent decades, the sector’s effective importance in terms of the national economy cannot be deter-mined on the basis of official statistics. The chemical-pharmaceutical industry continues to be reported in production and added value statistics as one joint sector, and in some cases it is even combined with mineral oil processing.
For the reasons outlined above, Interpharma has again commissioned Poly-nomics, in cooperation with BAK Basel Economics, to determine the importance of the pharmaceutical industry for Switzerland, for the fourth time following the studies in 2005, 2007 and 2009.
Interpharma Thomas B. Cueni, Secretary General

4 Polynomics / BAK Basel Economics
1 In brief
The pharmaceutical industry, as a key driving force of the Swiss economy, was unfazed by the recent economic crisis . Growth in real gross added value during the crisis years of 2008 and 2009 was approximately 7 %, with a slowdown to about 4 % in 2010 . Forecasts continue to be optimistic for the current year, so the pharmaceutical industry can again expect stronger growth than the overall economy . Although the growth in the number of persons employed in the overall economy was an average of 1 .5 % per year from 2005 to 2010, growth in the pharmaceutical industry was twice as high, namely at 3 % . When including jobs in the supplier industries, more than 135,000 jobs were dependent on the pharmaceutical industry in 2010 . This sector delivers above-average productivity and is directly and indirectly re-sponsible for added value of almost CHF 30 billion, equivalent to a share of 5 .7 % of nominal gross domestic product . Moreover, since 1990, the pharma-ceutical sector increased its exports by a factor of seven (in terms of value), and it now contributes more than 30 % of Switzerland’s total exports .
The chemical-pharmaceutical industry has ranked as a key driving force of the Swiss economy for many years. However, official data sources do not make it possible to report the importance of the Swiss pharmaceutical industry in isol-ation. This gap is closed by the present publication, commissioned by Inter-pharma and now appearing for the fourth time. In addition to the latest statistical data, this study also includes a new input-output table dating from 2008, which is used as the basis for calculating the indirect effects. The key results are briefly summarized below and are set out in table 1.
The last decade was characterized by a phase of impressive growth for the pharmaceutical industry, which was ushered in by international structural changes of the 1990s. The restructuring of the sector led to increased efficiency which, up to the present time, is apparent not merely in the high growth of added value, but also on the labour market. The pharmaceutical industry is a major em-ployer in Switzerland. If account is taken of the interdependencies with upstream and downstream enterprises, over 135,000 jobs in Switzerland were dependent on this sector in 2010, including 36,700 that can be attributed directly to the pharmaceutical industry. The sector also delivers above-average productivity, amounting in 2010 to CHF 232 per hour worked, or more than CHF 400,000 per person employed per year, equivalent to more than three times the average productivity in the overall economy.

The importance of the pharmaceutical industry for Switzerland 5
Countries outside Switzerland represent a key sales market for the pharmaceut-ical industry. Accordingly, exports rose from CHF 8 billion in 1990 to CHF 60.6 billion in 2010. Moreover, the development of added value in the pharmaceutical industry was always positive in recent years. In 2010, the sector generated about CHF 29.2 billion in added value (including CHF 14.8 billion directly in the pharma ceutical industry), equivalent to a share of 5.7 % of the nominal gross domestic product. Nominal added value was increasingly burdened by rising price pressure and the development of exchange rates, i.e. the strengthening of the franc, so the very high growth rates of the past are at present no longer equaled; real growth nevertheless remains robust and high at over 4 %.
Finally, thanks to its employees, the pharmaceutical industry delivers a key con-tribution to the Swiss economy above and beyond the achievements already mentioned. This is because tax payments and consumer expenditure by employ-ees in the pharmaceutical sector are significantly higher than the national average.
Table 1 | Direct and indirect impact of the pharmaceutical industry, 2010
Direct importance
Indirectimportance Total
Multi-plier
Gross added value CHF million 14,800 14,400 29,200 2.0As % of total for Switzerland 2.9 % 2.8 % 5.7 %
Persons employed Number of employees 36,700 98,600 135,300 3.7As % of total for Switzerland 0.8 % 2.2 % 3.0 %
Hours worked Million hours 63.5 166.2 229.8 3.6As % of total for Switzerland 0.9 % 2.2 % 3.1 %
Exports CHF million 60,638 — — —As % of total for Switzerland 31.4 % — —
Sources: Polynomics, BAK Basel Economics, Swiss Federal Institute of Technology, Zurich, Swiss Federal Statistical Office (SFSO), General Directorate for Customs (GDC).

6 Polynomics / BAK Basel Economics
2 The pharmaceutical industry as an employer
2 .1 Numbers of persons employedThe importance of the pharmaceutical industry as an employer has continued to grow in recent years. Whereas fewer than 20,000 persons were employed in the pharmaceutical industry in 1990, the number of pharmaceutical jobs has in-creased continuously since then, to reach the highest ever level of 36,680 per-sons employed in 2010 (cf. figure 1). This development is especially impressive when viewed in the overall economic context. At the macroeconomic level, a decline in the number of employed persons had to be overcome in seven out of the last 20 years. The years between 1992 and 1997, in particular, were typified by ongoing downturns. The development of jobs in the pharmaceutical industry presents a very different picture. 2003 was the only year when the number of persons employed was below the prior year’s level.
This difference in development as regards job development is also reflected in the annual growth trend. Since 1990, 3.2 % additional jobs were created in the pharmaceutical industry each year. By way of comparison, the annual growth trend for the overall economy was 0.6 %.
However, the discrepancy in growth between development rates in the pharma-ceutical industry and the overall economy has diminished somewhat in recent years, not least because a good 1.5 % additional jobs were created per year across all sectors in Switzerland during the period from 2005 and 2010.
Excursus 1 | The international character of employees in the pharmaceutical sectorThe pharmaceutical industry in Switzerland is confronted not only with a shortage of basic chemical products, but also with a lack of specialist manpower. Because the sector is geared to specialized products with high added value, there is a major demand for experts which cannot be met solely by Swiss employees. As a conse-quence, large and small pharmaceutical enterprises report high percentages of foreign employees. Since the search for talents is not restricted to Europe, the quota of persons employed from outside Europe is also higher than in other sectors.
The international composition of the workforce can, for example, be illustrated with the help of corporate data from Actelion, Novartis and Roche. The break-down of employees by nationality for the respective Swiss divisions of these

The importance of the pharmaceutical industry for Switzerland 7
companies at the start of 2011 indicates that a good 60 % of the employees are of foreign nationality. Employees from about 84 countries work at Roche, and as many as 95 countries are represented in the workforce at Novartis.
A detailed consideration of the employee structure based on origin produces the following picture: At Roche, there are different quotas of foreign employees for males and females. Whereas the quota of foreign male employees is 57 %, the figure for foreign female employees is significantly higher, at 64 %.
As regards the countries of origin of these employees, a heavy concentration of European countries outside Switzerland is evident at Actelion and Novartis: At Novartis, almost 56 % of employees have an EU passport, and a further percent-age originates from other European countries. The highest numbers of foreign employees come from Germany (23 %), France (19 %), the UK (5 %) and Italy (4 %). The largest percentages of non-European nationals at Novartis consist of US citi-zens (2.3 %) and Indians (0.8 %). Viewed by continents, the quota of North Ameri-cans (2.8 %) is the second largest following the Europeans, who account for 57 %. As regards the other continents, the quotas are 2.5 % for Asia, 0.8 % for South America, 0.5 % for Africa, and 0.3 % for Australia and New Zealand. A similar pic-ture emerges at Actelion, where 32 % of the employees are Swiss. Most of the foreign employees have French passports (31 %), giving them almost the same representation as the Swiss employees. Other significant groups of employees at Actelion originate from Germany (18 %), the UK (5 %), Italy (3 %) and the US (1 %).Sources: Actelion Pharmaceuticals Ltd, Novartis International AG, F. Hoffmann-La Roche Ltd
Figure 2 illustrates the reduction of growth momentum in recent years. The quota of persons employed in the pharmaceutical industry in relation to persons em-ployed in the overall economy remained constant at about 0.77 % between 2006 and 2009. In 2010, however, a new increase of about 3 % of the number of employes was evident. This meant that the quota of persons employed in the pharmaceutical sector in relation to those employed in the overall economy reached 0.8 % for the first time.
2 .2 Hours workedThe volume of work and the hours worked by employees in the pharmaceutical industry correlate with the growth in the number of employees. As shown in figure 3, employees in the pharmaceutical industry worked about 36 million hours in 1990. This value rose by 80 % to 64 million hours worked in 2010. It

8 Polynomics / BAK Basel Economics
Figure 2 | Erwerbstätige in der Pharmaindustrie und der GesamtwirtschaftFigure 2 | Number of persons employed in the pharmaceutical industry / overall economy
Sources: Polynomics, BAK Basel Economics, SFSO.
in %
0.1
0.2
0.3
0.4
0.5
0.6
0.7
0.8
0.9
201020092008200720062005200019951990
0.0
Figure 1 | Number of persons employed: pharmaceutical industry / overall economy
in 1,000s
National economy (left axis) Pharmaceutical industry (right axis)
Sources: Polynomics, BAK Basel Economics, SFSO.
0
5
10
15
20
25
30
35
40
1008 09070605040302010099989796959493929190
0
600
1,200
1,800
2,400
3,000
3,600
4,200
4,800

The importance of the pharmaceutical industry for Switzerland 9
should be noted here that the number of hours worked per person employed fell from 1,830 h in 1990 to 1,730 h in 2010. In the overall economy, the yearly work-ing hours per person employed also decreased, from 1,700 h to 1,625 h. The volume of work in the overall economy grew over this period from 6,900 million hours worked to 7,450 million hours worked, equivalent to an increase of 8 %.
At 2.9 %, the average growth in hours worked between 1990 and 2010 was higher in the pharmaceutical industry than in the overall economy, where the figure was 0.4 %. In accordance with this faster growth, the proportion of hours worked in the pharmaceutical industry increased in relation to the total number of hours worked. Mirroring the progression of the quota in relation to employee activity, the discrepancy in growth diminished in respect of the volume of work during recent years (cf. figure 4).
Based on an assumption of 220 working days in one year, in the pharmaceutical industry we obtain 39.4 hours worked per week in 2010, or 7.9 hours worked per day. The corresponding values for the overall economy are 36.9 h and 7.4 h re-spectively. In the pharmaceutical industry, an employee therefore works about
Figure 3 | Number of hours worked in the pharmaceutical industry / overall economy
0
1 000
2 000
3 000
4 000
5 000
6 000
7 000
8 000
0
10
20
30
40
50
60
70
80
1008 09070605040302010099989796959493929190
in million h
National economy (left axis) Pharmaceutical industry (right axis)
Sources: Polynomics, BAK Basel Economics, SFSO.

10 Polynomics / BAK Basel Economics
7 % more than the Swiss average. Reasons for this could include the extent of part-time employment. As table 2 shows, the quota of part-time employees dif-fers substantially between the pharmaceutical industry and the overall economy. Taking the Swiss average, about one third of employees have a workload of less than 90 % of normal industrial working hours; in the pharmaceutical industry, this quota is a mere 13 %. Among men, part-time working is fairly infrequent in the pharmaceutical industry. A total of 3 % of men work part time, and a mere 1 % of male employees have workloads of less than 50 %. Among women, the quota of part-time employment in the pharmaceutical industry is significantly higher than for men, namely at 27 %, but only half as high as the Swiss average. Like-wise, 4 % of female employees are employed for a workload of less than 50 %, a far lower figure than for the overall economy. Hence, part-time employment is far more frequent in Switzerland as a whole than in the pharmaceutical industry. This explains the longer working hours in the pharmaceutical industry as com-pared to the overall economy.
2 .3 Importance for other sectorsAlmost 37,000 employees earned their livelihood in the pharmaceutical industry in 2010. In order to manufacture the pharmaceutical industry’s products, input products and services are supplied by various other sectors and from abroad. The production of drugs, for instance, requires special machines, and new research or production buildings are erected by deploying technically expert manpower from the construction industry. Accordingly, it is possible to deter-mine how many employed persons in Switzerland have benefited from pharma-ceutical industry contracts in a given year in the past. For this purpose, recipro-cal dependencies are determined and appropriate multipliers are calculated on the basis of available tables showing the interdependencies among the various sectors, known as input-output tables (cf. section 9).
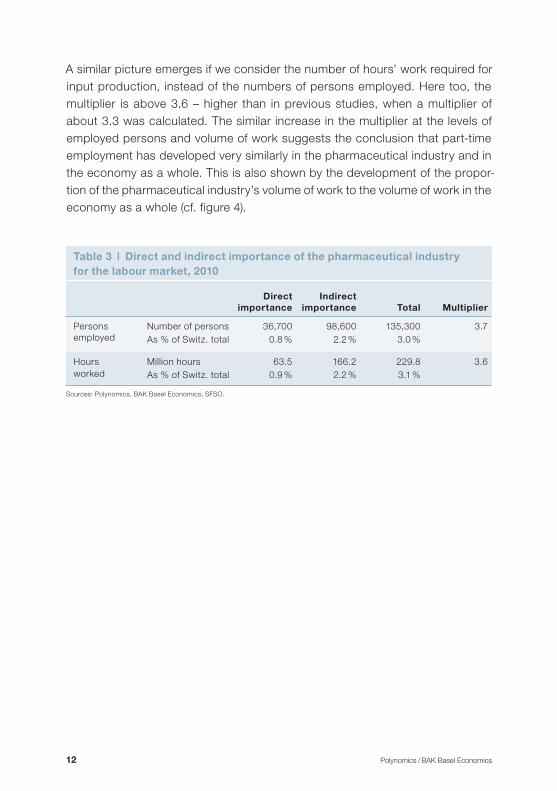
In 2010, this multiplier for the number of persons employed was 3.7 (cf. table 3). In other words, in addition to the 37,000 or so persons employed in the pharma-ceutical industry, almost a further 100,000 persons were employed in Switzer-land as providers of input products supporting the pharmaceutical industry with the manufacture of its products. As compared with previous calculations, the multiplier has therefore increased from 3.5 in the past to 3.7. This is mainly due to the fact that the growth in productivity in the pharmaceutical industry over past years was significantly stronger than that in the overall economy. In order to produce one unit of added value in the input sectors, substantially more work needs to be performed than is the case in the pharmaceutical industry itself.

The importance of the pharmaceutical industry for Switzerland 11
Figure 4 | Proportion of volume of work in the pharmaceutical industry to volume of work in the overall economy
Sources: Polynomics, BAK Basel Economics, SFSO.
in %
0.1
0.2
0.3
0.4
0.5
0.6
0.7
0.8
0.9
201020092008200720062005200019951990
0.0
Table 2 | Part-time employment in the pharmaceutical industry, 2010
Proportions of PT I and II Proportion of PT I Proportion of PT II
Total Men Women Total Men Women Total Men Women
Pharma industry 13 % 3 % 27 % 11 % 2 % 23 % 2 % 1 % 4 %
Overall economy 32 % 15 % 55 % 18 % 8 % 31 % 14 % 7 % 24 %
Notes Part-time (PT) I and II: employees working less than 90 % of normal industrial working hoursPart-time I: employees working 50 % to 89 % of normal industrial working hoursPart-time II: employees working less than 50 % of normal industrial working hours
Sources: Polynomics, Swiss Federal Statistical Office (SFSO, JOBSTAT).
12 Polynomics / BAK Basel Economics
A similar picture emerges if we consider the number of hours’ work required for input production, instead of the numbers of persons employed. Here too, the multiplier is above 3.6 – higher than in previous studies, when a multiplier of about 3.3 was calculated. The similar increase in the multiplier at the levels of employed persons and volume of work suggests the conclusion that part-time employment has developed very similarly in the pharmaceutical industry and in the economy as a whole. This is also shown by the development of the propor-tion of the pharmaceutical industry’s volume of work to the volume of work in the economy as a whole (cf. figure 4).
Table 3 | Direct and indirect importance of the pharmaceutical industry for the labour market, 2010
Direct importance
Indirect importance Total Multiplier
Persons employed
Number of persons 36,700 98,600 135,300 3.7As % of Switz. total 0.8 % 2.2 % 3.0 %
Hours worked
Million hours 63.5 166.2 229.8 3.6As % of Switz. total 0.9 % 2.2 % 3.1 %
Sources: Polynomics, BAK Basel Economics, SFSO.


14 Polynomics / BAK Basel Economics
3 The pharmaceutical industry’s added value contribution
3 .1 The pharmaceutical industry’s direct contribution to growthIt is possible to measure the role of a sector in terms of its contribution to growth, as well as its importance as an employer. In this case, the added value measures the income from economic activity as the difference between the overall produc-tion of an economic unit and the input products/services required in order to create the finished products/services. Hence, the added value consists of two components: work income (wages and salaries) and capital gain (profit and inter-est on loan capital). For the pharmaceutical industry, the gross added value therefore measures the production value of the output which it creates, after deduction of the necessary input products and services.
Figure 5 shows the nominal and real gross added value (GAV) for the pharmaceut-ical industry and the gross domestic product (GDP), respectively. The latter re-flects the total of gross added value for all sectors in Switzerland. Since 1990, the pharmaceutical industry has increased its added value (after corrections for price developments) from CHF 2.3 billion to CHF 14.9 billion. This indicates growth of almost 10 % per year. The pharmaceutical industry developed with significantly more dynamism than the overall economy, which was only able to achieve annual real growth of 1.3 % over the same period. In other words, the pharmaceutical industry was responsible for almost 12 % of macroeconomic real growth in the period from 1990 to 2010.
If we compare the development rates for nominal and real growth in the pharma-ceutical industry and in the overall economy since 2005, the different price pres-sure with which the pharmaceutical industry is confronted becomes clearly appar-ent. In the overall economy, growth in real gross domestic product was above the nominal figure only in 2010. In the pharmaceutical industry, however, this phenom-enon occurred three times in the last five years. Moreover, the remaining years were characterized by a very moderate price development. The reasons for this below-average price trend as compared to the overall economy are to be found in the strength of the Swiss franc and a trend seen in many countries toward a reduc-tion of national expenditure on healthcare.
However, figure 5 also makes it clear that the problem in the pharmaceutical in-dustry (if indeed there is one) relates to pricing, not growth. For instance, real growth in added value for the years from 2005 to 2010 was 9.1 % per year, placing

The importance of the pharmaceutical industry for Switzerland 15
Figure 5 | Nominal and real gross added value, pharmaceutical industry and overall economy
Overall economy, real GDP (left axis) Overall economy, nominal GDP (left axis) Pharma industry, real gross added value (right axis) Pharma industry, nominal gross added value (right axis)
Sources: Polynomics, BAK Basel Economics, BFS.
0
100
200
300
400
500
0
4
8
12
16
20
100907 080605040302010099989796959493929190
in billion CHF
Figure 6 | Proportion of added value by the pharmaceutical industry to gross domestic product
Proportion of real value added by the pharma industry in relation to real GDP in % Proportion of nominal value added by the pharma industry in relation to nominal GDP in %
Sources: Polynomics, BAK Basel Economics, SFSO.
in %
0.5
1.0
1.5
2.0
2.5
2008 2009 2010200720062005200019951990
0.0
3.5
3.0

16 Polynomics / BAK Basel Economics
it significantly above the corresponding growth trend for the overall economy, which reported 1.9 % growth per year. The differences in nominal and real devel-opment, and therefore the differences in price pressure, become evident when we consider the relevant shares of value added by the pharmaceutical industry in relation to the overall economy (figure 6).
Since 2006, the proportion of real added value to real gross domestic product has, therefore, been higher than the corresponding quota if the development of prices is taken into account. The discrepancy has increased continuously since then. At over 3 %, the quota of real added value in 2010 is one quarter of a per-centage point above the nominal quota.
Excursus 2 | Biotechnology in SwitzerlandThe implementation of findings from biology and biochemistry in the form of technical or technically utilizable elements is referred as biotechnology. In par-ticular, biotechnology includes the commercial use of findings in the fields of molecular biology, virology, microbiology and cell biology. Biotechnology is de-fined in two ways by the OECD (OECD Biotechnology Statistics 2009). The first definition is: “The application of science and technology to living organisms, parts thereof, their products or models, for the purpose of changing living or non-living materials in order to produce knowledge, goods and services.” This is a very comprehensive definition which also includes many traditional or con-ventional activities that do not figure in the current understanding of biotechnol-ogy. For this reason, there is a second definition that consists of a list of biotech-nological techniques, in order to amplify the existing definition. On the basis of this list, the modern biotechnology industry can be divided into three main areas. Green biotechnology deals in the broadest sense with plants, and is deployed for the production of food and feedstuffs. Red biotechnology deals with the development and production of drugs, for example by modifying bacteria genes so that they can produce basic pharmaceutical substances such as insulin. In white (or gray) genetic engineering, genetically modified micro-organisms are used to increase the profitability and cleanness of industrial production methods as compared to classical manufacturing processes. Biotechnology is a cross-section technology which is mainly deployed in certain sectors – agriculture, the pharmaceutical, chemical, agrarian and food industries, medical technology, research and development as well as disposal – although it cannot be directly assigned to any one of these sectors.

The importance of the pharmaceutical industry for Switzerland 17
The global financial crisis had a severe impact on the biotech industry in 2009. At first glance, turnover data did not suggest any major losses. This is due to the structure of the sector: A few large companies generate the turnover, and they were hardly affected at all by the crisis. However, the influence of the financial crisis is evident if we consider expenditure on research and development, which fell by 21 % as compared to the prior year, according to the 25th Biotech Report by Ernst & Young. The longer-term consequences of these cuts in research ex-penditure are uncertain, but they give cause for concern. In 2010, expenditure was increased slightly again, by 2 %. This means that the trend appears to have bottomed out. In 2010, turnover growth for listed biotech companies was 8 %, amounting to about USD 84.6 billion. It should be noted here that the acquisition of Genentech by Roche had a major impact on statistics for the sector, and they are only comparable on an adjusted basis. Companies domiciled in the US gen-erate USD 52.6 billion, or over 70 % of global biotech turnover, so they continue to be at the forefront of the worldwide biotech industry.
In Switzerland, stable turnover of CHF 9.3 billion was achieved in 2010, corres-ponding to an 11 % share of global biotech turnover. Against the backdrop of the strengthening Swiss franc, this is a very good result. Profit (of CHF 480 million in this case) was earned for the third year in succession, following 2008 and 2009. The number of persons employed in the Swiss biotech industry stagnated in 2010, following major increases in the two preceding years (by almost 16 % in 2009 and 6 % in 2008). Research and development expenditure in 2010 was almost CHF 2.1 billion, maintaining the level of prior years. There were 237 biotech companies in Switzerland as at the end of 2010, most of them located in the Lake Geneva region and in the regions of Zurich and Basel. The concentration of companies in these three clusters is mirrored in terms of financing. The “Swiss Venture Capital Database” kept by the University of Basel indicates capital flows in various sectors and regions. Between 1999 and 2009 about CHF 2.6 billion of venture capital flowed into biotechnology, accounting for about 45 % of the total volume of ven-ture capital.Sources: Ernst & Young, 2011a und 2011b.
3 .2 Importance for other sectorsIn the same way as for the pharmaceutical industry’s role as an employer, it is also possible to determine the added value triggered by orders from the pharma-ceutical industry to its input providers in the last year. The relevant multiplier, which is calculated on the basis of the input-output table (cf. section 9) was 2.0 for 2010, or about the same as for 2005 (2.1) or 2006 (2.0).

18 Polynomics / BAK Basel Economics
As table 4 illustrates, orders from the pharmaceutical industry relating to pur-chases of input products and services triggered an added value volume of al-most CHF 15 billion for the relevant sectors. The total direct and indirect added value contribution was, therefore, almost CHF 30 billion, or almost 6 % of Swit-zerland’s total gross domestic product.
Table 4 | Direct and indirect importance of the pharmaceutical industry in terms of added value, 2010
Direct importance
Indirect importance Total Multiplier
Gross added value Million CHF 14,800 14,400 29,200 2.0As % of Switz. total 2.9 % 2.8 % 5.7 %
Sources: Polynomics, BAK Basel Economics, SFSO.


20 Polynomics / BAK Basel Economics
4 Productivity of the pharmaceutical industry
4 .1 Productivity per jobProductivity is a key figure that indicates the ratio between the number of persons employed and the added value. For decades, the pharmaceutical industry has stood out due to its above-average productivity as compared to the overall econ-omy. As shown in figure 7, nominal productivity per job in the pharmaceutical industry in 2010 was about CHF 400,000, or higher than the value for the overall economy (CHF 112,000) by a factor of 3.6. Between 1990 and 2010, the average annual growth for productivity per job was running at 5.5 %, significantly in ex-cess of the annual increase in productivity for the overall economy (1.8 % p.a.).
Hence, the pharmaceutical industry was able to increase its added value earned per job from CHF 137,000 in 1990 to more than CHF 400,000 in 2010. The sharp increase occurred mainly from 2000 onwards. Between 2000 and 2010, the aver-age annual growth in nominal productivity per job was 6.5 %. This pleasing devel-opment is likely to be due in no small measure to the process of focusing on the core pharmaceutical business that was implemented toward the end of the 1990s.
Figure 7 | Nominal productivity per job, pharmaceutical industry / overall industry
in CHF per employed person
National economy Pharmaceutical industry
Sources: Polynomics, BAK Basel Economics, SFSO.
08070605040302010099989796959493929190 1009
0
50,000
100,000
150,000
200,000
250,000
300,000
350,000
400,000

The importance of the pharmaceutical industry for Switzerland 21
Last year, however, pharmaceutical industry had to accept a decline of 2 % in nominal productivity per job. This was due to the exceptionally heavy expansion of jobs in 2010 and severe price pressure that resulted in an increase in nominal added value of only 1 %. If we consider productivity per job after corrections for price development, the figure for 2010 was easily 1 % above the prior year’s value.
Excursus 3 | Productivity as a central measurement of competitivenessCompanies produce goods and provide services which they endeavour to sell at home or abroad. In order to manufacture these goods and services, the com-panies require capital and labor as the key factors in production. Competitive ability, or competitive edge, among companies is evidenced, not least, by the minimum possible use of these production factors to create a product or service unit as compared to the competitors. The more productive a company is, the more competitive ability it will have.
However, productivity is not only a way of measuring a company’s competitive-ness; it also sets out the framework for payment of the production factors that are utilized. In the long term, for instance, pay increases in a sector are geared to the growth rates for productivity per job or per hour. The central function of prod-uctivity as an indicator of competitiveness is also shown in another way: In sectors where competition does not perform the disciplinary function in terms of pricing, the regulators specify increases in efficiency or productivity in order to simulate an “as if competition” situation. This can be observed, for example, when power markets are opened up. In order to appraise the importance of a company or sector, productivity per job in the pharmaceutical industry is analyzed as part of this study in addition to the job situation and the evolution of added value.
4 .2 Added value per hour workedThe pharmaceutical industry’s productivity per hour is very high in Switzerland. As table 5 illustrates, added value generated per hour in 2010 was CHF 232. This means that the pharmaceutical industry again outstripped the financial sector in terms of hourly productivity last year. The banking sector appears to have stabil ized last year after losses of productivity in the wake of the financial crisis. Between 1995 and 2010, the pharmaceutical industry more than doubled its productivity per hour, from CHF 106 to over CHF 230. In addition to its concen-tration on the core business towards the end of the 1990s, as already mentioned, the sector was able to increase productivity per hour on a constant basis in re-

22 Polynomics / BAK Basel Economics
cent years. This is likely, not least, to be a reaction to the globally evident trend towards reductions in healthcare expenditure and, therefore, cuts in drug prices. Due to the strict regulation of the pharmaceutical market, an increase in labour productivity is a key instrument in order to secure international competitive edge.
Like productivity per job, productivity per hour in 2010 was also below the prior year’s level. However, the decline of 1.6 % was less sharp than for product ivity per job (-2.0 %).
Table 5 | Nominal productivity per hour in selected sectors
1995 2000 2005 2006 2007 2008 2009 2010
Pharma 106 118 169 191 210 222 236 232
Insurance 98 121 130 157 191 199 197 194
Banking 77 163 150 156 163 145 135 137
Precision mechanics, optical, watchmaking
66 69 85 89 92 93 91 95
(Tele)communications 69 53 99 100 103 108 109 113
Industrial sector 55 60 71 76 81 84 81 82
Overall economy 53 57 62 65 68 70 69 69
Sources: Swiss Federal Statistical Office, BAK Basel Economics, SFSO.
in CHF per hour worked


24 Polynomics / BAK Basel Economics
5 The pharmaceutical industry as an export sector
The pharmaceutical industry is a sector with a very strong international orientation. A glance at the evolution of exports makes this clear. In 2010, the volume of ex-ports reached a new high of CHF 60.6 billion. Measured as a proportion of total exports, pharmaceutical exports therefore account for 31.4 %, or almost one third. It is particularly pleasing to note that the pharmaceutical industry has dealt very well with the challenge posed by the strong Swiss franc in the last two years, as compared to the overall economy. In 2009, overall exports sustained a real col-lapse and were almost 13 % below the prior year’s level. Pharmaceutical exports, on the other hand, managed to increase by over 5 % despite the unfavourable circumstances. This development yet again makes it clear that the pharmaceut-ical industry is significantly less susceptible to cyclical economic phenomena than other export sectors. On the other hand, the various healthcare policy reform projects and general political conditions in export countries play a key part.
The importance that pharmaceutical exports have acquired for the Swiss econ-omy can be seen from the average annual growth figures. In 1990, for example,
08070605009590 1009
0
50
100
150
200
250
Figure 8 | Switzerland’s pharmaceutical exports and total exports (excluding precious metals)
in billion CHF
National economy Pharmaceutical industry
Sources: Polynomics, BAK Basel Economics, General Directorate for Customs (GDC).

The importance of the pharmaceutical industry for Switzerland 25
pharmaceutical exports totalled CHF 8 billion, and they increased by an average of 10.6 % each year to reach their present level of CHF 60 billion. This growth trend has been well above the trend for overall exports (4.4 % p.a.) for at least the last 20 years.
Excursus 4 | The strong Swiss franc and the pharmaceutical industryThe pharmaceutical industry is an extremely export-oriented sector. Conse-quently, the value of the Swiss franc plays an important part for the Swiss com-panies. Since the start of 2009, the franc has appreciated by between 15 % and 20 %, especially in relation to Europe and the USA, the two most important re-gions for pharmaceutical exports. As for all export-oriented sectors, the strength of the franc poses a major challenge for the pharmaceutical companies. As a direct consequence, income from exported pharmaceutical products falls when converted into Swiss francs. On the other hand, research and production costs incurred in Switzerland change only by the proportion of input goods and services that are imported, and which can now be obtained from abroad more cheaply thanks to the high franc. Other production costs, such as wages, remain un-changed. The consequence of this development is pressure on margins. This pressure can essentially be countered in two ways: by raising prices or by increas-ing productivity. As a general rule, there is no leeway for pricing in the pharma-ceutical industry, as compared to other export sectors. In fact, increasing health-care expenditure is leading to stricter regulation and decreasing drug prices, developments which step up the pressure on margins even further. The main recourse left to the pharmaceutical industry as a result of the high franc is, there-fore, a continuous increase in productivity in order to combat the losses of income due to the currency’s strength.
The sustained strength of the franc against the US dollar and the euro had a strong impact on foreign trade in the first months of 2011. Nominal cumulative exports from January 2011 until May 2011 showed a growth rate of barely 1 %, placing them slightly ahead of the previous year’s level; in real terms, however, a sharp increase of 10 % was measured. The prices calculated by the General Directorate for Customs for the export of pharmaceutical products fell by about 8.5 %. Nevertheless, the monthly progression appears to suggest a recovery of prices, and the decline in May (2.6 %) was no longer as severe as in the first months of the year. These results suggest that the pharmaceutical industry will again achieve an excellent export result in the current year.
26 Polynomics / BAK Basel Economics
6 Estimate of tax revenue and consumer spending
In addition to the economic interdependencies at company level, other parties also benefit from the economic strength of the pharmaceutical industry: the state, as the recipient of tax, the employees, as recipients of wages and salaries, and the manufacturers of consumer goods and providers of personal services. One pos-sible way of calculating these effects would be to form comprehensive multipliers. However, such multipliers tend to overestimate the importance of a sector because
– in the case of wages and salaries, for example – the social security system ensures that replacement income is available if a job is lost. A “failure” of the pharma ceutical industry would therefore have less drastic effects on the income of employees than on the companies. By way of example, we shall examine wages and how they are used. Total payroll expenditure by the pharmaceutical industry in 2008 was about CHF 3.8 billion, corresponding to almost 30 % of the added value earned. Measured as a proportion of wages and salaries in the overall econ-omy, pharmaceutical pay accounts for 1 %. If this figure is compared with the quota of employees, which is 0.8 %, it can be seen that the pharmaceutical industry pays above-average wages and salaries. In actual fact, average pay in the Swiss pharma-ceutical industry in 2008 was CHF 9,000 per month, or over 30 % more than the average for the overall economy of CHF 6,900 per month. Two effects are respon-sible for these higher average pay rates. First, the pharmaceutical industry has proportionately more employees with a university or college education (26 % vs. 19 % in the overall economy) and fewer with basic secondary school education (16 % vs. 21 % in the overall economy). Second, the pharmaceutical industry pays higher wages within the respective educational categories.
Due to the higher wages and salaries paid on average by the pharmaceutical in-dustry, employees in the industry pay out more money for taxes and in terms of consumer spending. Of the pharmaceutical industry’s payroll total, about 10 % is transferred to the state. The equivalent amount for the overall economy is only about 7.5 %. In 2008, the revenue from tax and charges generated by persons employed in the pharmaceutical industry was about CHF 370 million, correspond-ing to about 1.3 % of the revenue from persons employed in the economy as a whole. A person employed in the pharmaceutical industry therefore transfers an average of some CHF 10,500 to the government in taxes and other charges. An average employee provides about CHF 6,200 in taxes and charges. The contribu-tion from an employee in the pharmaceutical industry is therefore about 70 % higher than the national average.

The importance of the pharmaceutical industry for Switzerland 27
Despite higher taxes, the higher salaries paid in the pharmaceutical industry mean that the average consumer spending of a person employed in the pharma ceutical industry is CHF 98,000, or still almost 30 % above the figure for an average em-ployed person, which is CHF 76,000. Accordingly, consumer spending by pharma-ceutical employees in 2008 totaled about CHF 3 billion, accounting for about 1 % of consumer spending by all persons in employment.
The heavy concentration of pharmaceutical companies in regions close to borders, e.g. within the Basel economic region, means that a relatively large number of cross-border commuters is included among the persons employed in this sector. It is estimated that about 20 % of employees have their place of residence in neigh-bouring countries. It follows that the figures for taxes and consumer spending should be regarded as upper limits, since cross-border commuters pay tax on and spend part of their income abroad.

28 Polynomics / BAK Basel Economics
7 Summary
This updated study of the macroeconomic importance of the pharmaceutical industry for Switzerland presents the latest results available on the basis of up-dated data sources. The main purpose of what is now the fourth edition of this study is to remedy the ongoing deficiency in official statistics, which means that virtually no data are available on the pharmaceutical industry. This study provides additional statistical data, and indicates both the direct and indirect importance of the pharmaceutical industry for the Swiss economy. The main results from the study are summarized in table 6.
Employment growth in the pharmaceutical industry continues to maintain a very high level. The average growth in the number of people employed in the pharma-ceutical industry is over 3 % per year, and there was almost no slowdown in this rate during the recent economic crisis. Some 36,700 persons were employed in the pharmaceutical industry in 2010. This means that the industry is developing into an ever more important employer for Switzerland. The pharmaceutical in-dustry’s proportion of employed persons in the overall economy rose from 0.5 % to 0.8 % between 1990 and 2010. The number of hours worked presents a simi-lar picture: Growth in the volume of work in the pharmaceutical industry between 1990 and 2010 was almost 3 %. In 2010, however, the industry’s proportion of hours worked in the overall economy was higher than the proportion of persons employed, at 0.85 %. This is because part-time working is not so widespread in the pharmaceutical industry (among men as well as women) as in the rest of the economy, and the number of hours worked per person employed is therefore higher. The structure of persons employed in the pharmaceutical industry shows a high level of full-time employees, and an above-average international compos-ition. Almost two thirds of the employees are of foreign nationality, and the major-ity of these originate from the countries bordering Switzerland, namely Germany, France and Italy. One of the reasons for this situation is the large number of cross-border commuters employed in the metropolitan region of Basel. Another significant portion of the employees, comprising about 10 % to 12 %, originate from countries that are not neighbours of Switzerland, with British and US citi-zens accounting for the largest shares.
In order to provide its products, the pharmaceutical industry needs not only labour and the capital that it makes available itself, but also other inputs in the form of goods and services from other sectors. These sector interdependencies can be shown in the form of an input-output table on the basis of which it is pos-

The importance of the pharmaceutical industry for Switzerland 29
sible to calculate the added value and employment impact of one sector on the rest of the economy. Effects calculated in this manner are known as “multipliers” (cf. table 7 on this aspect).
As regards jobs and volume of work, the multipliers are 3.7 and 3.6 respectively; these are higher than the added value multiplier on account of the pharmaceut-ical industry’s above-average productivity. In other words, alongside the 36,700 persons employed in the pharmaceutical industry, there are a further 98,600 persons in other sectors who benefited from demand created by the pharma-ceutical industry in 2010, corresponding to a quota of some 2.2 % of persons employed in the economy as a whole.
Another indicator that allows us to measure the importance of an economic sec-tor is added value. It is evident that the growth of nominal gross added value in the pharmaceutical industry is above the average. Whereas the pharmaceutical
Table 6 | Direct importance of the pharmaceutical industry
1995 2000 2005 2006 2007 2008 2009 2010
Persons
Employed 22,900 27,100 31,700 33,200 33,900 34,800 35,600 36,700
As % of the overall economy
0.6 % 0.7 % 0.7 % 0.8 % 0.8 % 0.8 % 0.8 % 0.8 %
Added value, nominal
In million CHF 4,200 5,800 9,600 11,300 12,600 13,700 14,600 14,800
As % of the overall economy
1.2 % 1.5 % 2.2 % 2.4 % 2.6 % 2.7 % 2.9 % 2.9 %
Productivity
In CHF per person employed
183,600 215,100 303,900 339,400 372,700 392,700 410,500 402,200
Overall economy 89,300 96,200 103,100 106,700 110,600 113,200 110,700 112,500
In CHF per hour worked
106 118 169 191 210 222 236 232
Overall economy 53 57 62 65 68 70 69 69
Exports
In million CHF 11,970 22,070 39,790 46,620 51,140 55,270 58,180 60,640
As % of total exports
13.0 % 17.4 % 26.3 % 26.3 % 25.9 % 26.8 % 32.2 % 31.4 %
Sources: Polynomics, BAK Basel Economics, SFSO, General Directorate for Customs (GDC).

30 Polynomics / BAK Basel Economics
industry’s nominal gross added value grew by a factor of almost six between 1990 and 2010 (with an increase from CHF 2.7 billion to CHF 14.8 billion), the nominal gross domestic product grew by only a factor of 1.63 %. There has been a particularly marked increase in the growth of nominal added value in the pharma-ceutical industry since the year 2000. Over the last ten years, this figure rose by a total of 150 %, or by an average of 10 % per year. Except in 2010, growth always exceeded the rate for the overall economy. However, high pressure on prices has now resulted in an increase in nominal added value of only 1 % as compared to the prior year, whereas the comparative value for the overall economy is 2 %. Nevertheless, viewed in real terms, the pharmaceutical industry (at 4.3 %) con-tinues to report higher growth than the overall economy (2.5 %).
A multiplier of about 2 is obtained for gross added value in the pharmaceutical industry. This means that the indirect effect of the pharmaceutical industry on Switzerland’s nominal gross domestic product in 2010 was about CHF 14.4 bil-lion. The total direct and indirect importance of the pharmaceutical industry for the national economy is, therefore, about CHF 29.2 billion, equating to a quota of 5.7 % of the country’s gross domestic product.
Another reason for the pressure on prices is that the pharmaceutical industry is an extremely export-oriented sector. The value of the Swiss franc therefore plays an especially important part in terms of nominal added value. The franc has gained between 15 % and 20 % in value against the currencies in the two key pharmaceutical export regions of Europe and the US since 2009, and this poses a major challenge for the pharmaceutical corporations. The direct consequence is that if prices in foreign currencies remain constant, there is a decrease in in-come after conversion into Swiss francs. On the other hand, production costs
Table 7 | Direct and indirect importance of the pharmaceutical industry, 2010
Direct importance
Indirect importance Total Multiplier
Gross added value Million CHF 14,800 14,400 29,200 2.0As % of Switz. total 2.9 % 2.8 % 5.7 %
Persons employed Number of persons 36,700 98,600 135,300 3.7As % of Switz. total 0.8 % 2.2 % 3.0 %
Hours worked Million hours 63.5 166.2 229.8 3.6As % of Switz. total 0.9 % 2.2 % 3.1 %
Sources: Polynomics, BAK Basel Economics, SFSO.

The importance of the pharmaceutical industry for Switzerland 31
incurred in Switzerland change only by that portion of the input goods and ser-vices that are imported and which – thanks to the high franc – can now be pur-chased more cheaply from other countries. Other production costs, such as wages, remain unchanged. The consequence of this development is pressure on margins, which is reflected over the short term in falling profits and therefore has a direct impact on nominal added value.
One key way of measuring a sector’s competitiveness is productivity. Productiv-ity measures the companies’ use of capital and labor to manufacture their prod-ucts. Efficient utilization of these production factors leads to high competitive ability, or competitive edge. In the long term, pay increases in a given sector are geared to the growth rates for productivity per job or per hour.
In terms of labour productivity, the pharmaceutical industry far outstrips the econ- omy as whole. The pharmaceutical industry reports significantly higher prod uct-ivity than the overall economy, as regards productivity per job and per hour. With added value in excess of CHF 400,000 per person employed, or CHF 232 per hour worked, the pharmaceutical industry was more than three times as product-ive as the overall Swiss average in 2010. Together with the banks and insurance companies, it ranks among Switzerland’s most productive sectors, leaving other productive sectors such as precision mechanics, optical and watch making or telecommunications far behind.
The Swiss pharmaceutical industry is a heavily export-oriented sector. The vast majority of goods manufactured in the Swiss pharmaceutical industry is ex-ported. Since 1990, the proportion of pharmaceutical exports to total exports by the overall Swiss economy grew from 10 % to 31 %. In 2010 alone, the value of goods exported by the Swiss pharmaceutical industry was CHF 60.6 billion.
Further significant ways in which the pharmaceutical industry influences Swit-zerland’s national economy become apparent if we consider wages and salaries, tax and consumer spending. The average salary in the pharmaceutical industry of CHF 9,000 per month (in 2008) was more than 30 % above the average for the economy as a whole (CHF 6,900 per month). Reasons for this include the higher level of qualifications among the industry’s employees. 26 % of pharmaceutical employees have a university or college education – a significantly higher level than the Swiss average (19 %). Tax expenditure and consumer spending by per-sons employed in the pharmaceutical industry are also higher, due to the sector’s above-average pay levels. Revenue from taxes and charges from persons em-

32 Polynomics / BAK Basel Economics
ployed in the pharmaceutical industry in 2008 was about CHF 370 million, cor-responding to about 1.3 % of the total revenue generated by employees in the overall economy. All in all, a person employed in the pharmaceutical industry transfers about 70 % more taxes and charges to the state than an average em-ployee.
Finally, due to the sector’s higher salaries, consumer spending by persons em-ployed in the pharmaceutical industry is more than 25 % above the figure for those employed in the overall economy. In 2008, consumer spending by pharma-ceutical employees totalled some CHF 3.0 billion, corresponding to about 1 % of consumer spending by employees in the economy as a whole.


34 Polynomics / BAK Basel Economics
8 Annex 1: Demarcation of sectors
This study has determined the direct and indirect importance of the pharmaceut-ical industry. The reason why a separate study is required in order to determine, in particular, the direct importance of the pharmaceutical industry in relation to the national economy is that in Switzerland the official production and added value statistics do not report the pharmaceutical industry separately. As a result of structural change and technological development, new economic activities are constantly coming into being, or weightings among existing economic sec-tors are shifted. Consequently, an existing statistical classification of the current economic structure often ceases to be adequate. The pharmaceutical industry offers one example of a shift of this sort. The molecular biology revolution after the World War 2 was a key factor in shaping the development of the modern pharmaceutical industry. Thanks to the change in the knowledge base, thera-peutic concepts were no longer created as a result of chance discoveries, but as the outcome of the rational development of pharmaceutical products. The basis for this transition was provided by new findings in molecular biochemistry, pharmacology and enzymology during the 1970s, when genetic engineering reached its first peak.
However, current official statistical evaluations in Switzerland do not (yet) take account of these developments. Consequently, the pharmaceutical industry con-tinues to be treated as part of the chemical-pharmaceutical industry in the eco-nomic classification systems maintained by official bodies. In Switzerland, in fact, it is merely reported as the “chemical industry” (cf. figure 9 on this point).
In Switzerland, unlike many other countries, the official statistics on added value and employment in the economic sectors do not report data on economic groups, and therefore do not include any data for the pharmaceutical industry. This state of affairs no longer gives any consideration whatsoever to the differ-ences in the development of individual economic groups within the chemical-pharmaceutical industry in Switzerland over recent years.
For the purposes of the present analysis of the pharmaceutical industry, BAK Basel Economics and Polynomics therefore created a body of statistical data which takes account of the aforementioned changes: In terms of economic statistics, the chemical-pharmaceutical industry (economic “division”) was split into its individual components so that the key economic indicators of added value, numbers of persons employed and hours worked are now available for

The importance of the pharmaceutical industry for Switzerland 35
the pharmaceutical industry (as an economic “group”). The underlying data were expanded in relation to the previous studies dated 2005, 2007 and 2009 by adding corresponding data up to the current (2010) status, with revisions as appropriate, so there may be some discrepancies in respect of individual indica-tors as compared with values in previous studies.
The Swiss Federal Statistical Office is reacting to structural developments in the Swiss economy by means of the NOGA (General Classification of Economic Activities) 2008 which has been in force since January 2008. This new classifica-tion offers distinct advantages for the pharmaceutical industry in particular. As figure 9 shows, the pharmaceutical industry was a subgroup of the “Manufacture of chemical products” division according to NOGA 2002. Since data for certain indicators are collected and published only at divisional level, this means that indicators for individual subgroups (such as the pharmaceutical industry) have to be estimated, which always entails uncertainties. In NOGA 2008, the pharma-ceutical industry has now been promoted to the level of “division”, in recognition of its economic importance. More up-to-date and accurate data on the pharma-ceutical industry will be available in the future as a result of this step.
Figure 9 | Sectoral demarcation of the pharmaceutical industry as per NOGA 2002
Demarcation of sectors in the official industrial classification system
Section D Manufacture of goods and products
Subsection DG Manufacture of chemical products
Division 24 Manufacture of chemical products
Group 24.1 Manufacture of basic chemical substances
Group 24.2 Manufacture of plant protection products and other agrochemical products
Group 24.3 Manufacture of paints and other coating materials, printing inks and putties
Group 24 .4 Manufacture of pharmaceutical products
Group 24.5 Manufacture of soaps, washing and cleaning products, odorants and bodycare/personal care products
Group 24.6 Manufacture of other chemical products
Group 24.7 Manufacture of chemical fibers
Sources: SFSO.

36 Polynomics / BAK Basel Economics
9 Annex 2: Methods
The identification of indirect effects is based on the determination of multipliers. This approach is suitable for indicating, within a past period, the influence that a given sector has exerted on other sectors due to its demand. The following sec-tions contain, first, a description of the concept of sectoral interdependencies (the input-output table) on which the calculations are based (section 9.1), fol-lowed by a presentation of the actual calculation of the multipliers in section 9.2.
9 .1 Input-output tableThe basis for the analyses that were undertaken is provided by a schematic representation of the Swiss national economy. Flows of goods within the overall economy can be portrayed with the help of an input-output table. On the one hand, such a table illustrates the supplies of goods flowing between the sectors. On the other, an interdependency matrix of this sort also makes it possible to represent the final consumption of the goods produced, including the associ-ated import quota. Figure 10 shows a schematic input-output table.
The horizontal axis shows the use of the goods manufactured in the sectors. These goods either flow into other sectors as input goods, or are consumed, invested or exported directly as final demand. From this perspective, the inter-dependency matrix shows what amounts of goods produced by one sector are supplied to other sectors. The sum of final demand and input goods/services gives the total volume of goods.
As well as the relationships between input goods/services and final demand already mentioned, the input-output table also allows a second type of analysis. Based on the interdependencies, it is possible in the vertical dimension to de-duce which and how many goods a sector requires as input goods for its pro-duction. If the added value for the sector is then added, the gross production value of a sector is obtained. The sum of the gross production value and the imports again gives the total volume of goods.
With the help of the interdependency matrix, it is possible to examine the influ-ence on the entire economy of an increase in demand for goods from a given sector. Due to the interdependency in connection with input goods, the add-itional demand for goods triggers further production increases in other sectors. The sum of all these effects can be calculated with the help of an input-output model, and it corresponds to the multiplier for the total volume of goods.

The importance of the pharmaceutical industry for Switzerland 37
Input goods and services
Input-output matrix
=Gross production
Sectors
+ = –
+
Imports=
Volume of goods
+
Added value
Volu
me
of g
oods
Gro
ss p
rodu
ctio
n
=
Final demand
Hou
seho
ld c
onsu
mpt
ion
Sta
te c
onsu
mpt
ion
Inve
stm
ents
Exp
orts
Inpu
ts
Impo
rts
Goo
ds /
Sec
tors
Gen
erat
ion
side
Utilization side
9 .2 Calculation of multipliersMultipliers can be calculated in several ways, and also for several economic variables. For example, there are goods-related multipliers for the total volume of goods in a national economy, the production value or the added value. How-ever, it is also possible to calculate multipliers based on labour market variables such as the number of employees, the hours worked or the payroll costs.
The level of a multiplier and hence the determination of the sector’s overall im-portance for the national economy are related, among other factors, to the choice of method for calculating the multiplier. In general terms, a distinction may be drawn between two different multipliers: multipliers of type I and type II. These multipliers differ as regards the demarcation of their effect. Whereas type I multi-pliers are restricted to the additional effects arising from the input goods, the type II multiplier reintegrates the income generated for private individuals and companies into the cycle. Hence, a type I multiplier includes the direct and indir-ect effects of a sector on the national economy, whereas the type II multiplier in addition includes what are known as the induced effects.
Sources: Polynomics.
Figure 10 | Structure of an input-output table

38 Polynomics / BAK Basel Economics
The common feature of both multipliers is that they reproduce the effects within the national economy at a specified point in time, and are therefore of a static nature. Dynamic adaptation processes due to changes in demand are only taken into account on a limited basis. This static analysis is particularly problematic in the case of type II multipliers. It is assumed here that consumers and employees do not adapt to a change in income or in the job situation. The accusation that adaptations are not taken into account can also be levelled at multipliers of type I, but because sectoral structures change much more sluggishly, this aspect is less important. For these reasons, the present study only makes use of the type I multiplier. The induced effects are analyzed separately on the basis of salary and consumption considerations (cf. section 6).
There are several methods of measuring the indirect importance of a sector in accord-ance with a type I multiplier; all of them are based on input-output tables, but they differ as regards their complexity. A specific distinction may be drawn between: input-output models, structural econometric models, and general equilibrium models.
Input-output modelsInput-output models are used most frequently to determine the indirect effects. The advantage of these models is that they can easily be understood and com-municated. Moreover, they are based on effective interdependencies among the sectors. However, these advantages are counterbalanced by some drawbacks: Input-output models are static models, so the time dimension is neglected. In particular, it is not possible to take account of reactions to changes in demand on the part of companies and consumers. Multipliers based on input-output models are able to measure the indirect importance of a sector at a specified point in time, but they do not permit any conclusions regarding the evolution of a sector’s importance over time.
Structural econometric modelsAs compared to simple input-output models, structural econometric models contain more information about the economic context, because they are not based on a reporting year but, instead, take account of historical changes in the interdependencies among the sectors. At least at the level of the national econ-omy, they are able to map productivity increases and the substitution between labour and capital because they take account of relative changes in salaries and prices. Structural models also make it possible to represent simple adaptations of sector structures after a change in demand, in which case the adaptations are based on historical behaviour patterns.

The importance of the pharmaceutical industry for Switzerland 39
General equilibrium models The third option for calculating the indirect importance of a sector is based on general equilibrium models. In this case, decisions by companies and consum-ers are modelled explicitly: they attempt to maximize their profit or benefit over time. Thanks to this comprehensive modelling approach, reactions by companies and consumers to increases in demand are more subtly differentiated than in a simple input-output model. The importance of a sector can be analyzed more accurately. As in the case of structural models, it is also possible in this case to track reactions over time. On the other hand, the modelling outlay is greater for this type. Moreover, it is very difficult to communicate the results from the mod-els because the complexity of general equilibrium models is high, and the neces-sary assumptions regarding maximization of benefit and profit can be of decisive significance.
Comparison of added value multipliersTable 8 reproduces the calculated multipliers for severals input-output and struc-tural economic models. The gross value added multiplier for the pharmaceutical industry of the BAK sector model is about 2.1 and therefore slighly higher than the input-output model multiplier of 2.0. The multiplier effect on gross added value in Germany during 2008 is 1.8, which is rather lower than in Switzerland and also lower than the 2006 value for Germany. In 2008, one euro earned in the pharmaceutical industry increased added value in Germany by an additional 80 cents.
International studies on the importance of the pharmaceutical industryThe influence of the pharmaceutical industry on the national economy as a whole is also analyzed in other countries. Several of these studies are summarized below.
Table 8 | Comparison of added value multipliers for the pharmaceutical industry
Calculation method Gross added value
2006 2008 2010
Switzerland: input-output model (2001 / 2006 / 2008) 2.1 2.0 2.0
Switzerland: BAK sector model 2.1 2.1 2.1
Germany: input-output model (2000 / 2005) 2.1 1.8 —
Sources: Polynomics, BAK Basel Economics, DESTATIS, Swiss Federal Institute of Technology, Zurich, SFSO.

40 Polynomics / BAK Basel Economics
For the United States, there is a current study by Archstone Consulting (2009): “The Biopharmaceutical Sector’s Impact on the U.S. Economy”, which follows on from work by the Milken Institute (2004). For 2006, these authors obtained mul-tipliers of 3.3 for gross added value and 4.7 for employment. These multipliers are comparatively high, because the study takes account of the induced effects in addition to direct and indirect effects. If the induced effects are disregarded, significantly lower multipliers are obtained. For real added value, the figure is still 2.0 and for the number of persons employed, it is 2.5. For 2003, the analysis by the Milken Institute (2004), “Biopharmaceutical Industry Contributions to State and U.S. Economics” produced multipliers with and without induced effects of 2.7 and 2.1 respectively for gross added value, and 4.5 and 3.0 respectively for employment. This suggests that the induced effects increased between the two reporting periods, for gross added value as well as employment, whereas the indirect effects remained virtually constant as regards added value but de-creased in respect of employment.
In Scotland, the study by Ewen Peters Associates (2006), “Contribution of Pharma-Related Business Activity to the Scottish Economy”, compiled on behalf of the Association of the British Pharmaceutical Industry (ABPI), also takes ac-count of direct, indirect and induced effects. This study is based on an input-output table for 2003 and it uses a type II multiplier of 1.6 for added value as well as employment.
According to our own calculations (cf. Polynomics, 2009), the values for the multipliers in Germany, including induced effects and on the basis of the input-output table published for 2005, amount to 2.1 for added value and 3.0 for em-ployment. The added value multiplier is still 1.5 if the induced effects are disre-garded. A figure of 1.8 is obtained for the employment multiplier in this case. The study by Weiss et al. (2004), “Die pharmazeutische Industrie im gesamtwirtschaftli-chen Kontext: Ausstrahlung auf Produktion und Beschäftigung in den Zuliefer-branchen” [“The pharmaceutical industry in the macroeconomic context: impact on production and employment in the supplier sectors”] focused only on the direct and indirect effects of the pharmaceutical industry. The updated version of this study in 2005 (Weiss et al., 2005), based on adjusted employment figures, identifies added value multipliers of 1.7 for 1995 and 1.8 for 2000 and 2002. For the employment multiplier, Weiss et al. (2004, 2005) obtain a value of 1.9 for 1995 and 2000, and a value of 2.0 for 2002. This means that the type I multipliers in Germany showed virtually no changes between 1995 and 2005. For the gross

The importance of the pharmaceutical industry for Switzerland 41
added value, the indirect effects declined somewhat after a slightly higher figure at the start of the new millennium, whereas they remained constant in respect of employment.
The referenced studies are based on input-output analyses. Weiss et al. (2004), like Ewen Peters Associates (2006), base themselves directly on the official input-output tables of the national statistical agencies. The Milken Institute (2004), on the other hand, uses a regional economic model (RIMS II: Regional Input/Output Modeling System) produced by the Bureau of Economic Analysis (BEA), a US governmental agency. The RIMS includes prestandardized multiplier analyses for all the American states. The multipliers calculated here are summarized in table 9.
Table 9 | Overview of international studies on the pharmaceutical industry
Type I Type II
US
Archstone Consulting (2009) 2006 Gross added value 2.0 3.3
Persons employed 2.5 4.7
Milken Institute (2004) 2003 Gross added value 2.1 2.7
Persons employed 3.0 4.5
Scotland
Ewen Peters Associates (2006) 2003 Gross added value — 1.6
Persons employed — 1.6
Germany
Weiss et al. (2004) 1995 Gross added value 1.7 —
Persons employed 1.9 —
2000 Gross added value 1.8 —
Persons employed 1.9 —
Weiss et al. (2005) 2002 Gross added value 1.8 —
Persons employed 2.0 —
Polynomics (2009) 2005 Gross added value 1.5 2.1
Persons employed 1.8 3.0

42 Polynomics / BAK Basel Economics
10 List of sources
Archstone Consulting (2009): The Biopharmaceutical Sectors Impact on the U.S. Economy, Archstone Consulting, Stamford, CT.
DESTATIS (2009): Volkswirtschaftliche Gesamtrechnungen: Input-Output-Rechnung 2005, Fachserie 18, Reihe 2, Statistisches Bundesamt Deutschland [“National accounts: input-output account 2005”, specialist series 18, line 2, Federal Statistical Office of Germany], Wiesbaden.
Ewen Peters Associates (2006): Contribution of Pharma-Related Business Activity to the Scottish Economy, Association of the British Pharmaceutical Industry (ABPI), Edinburgh.
Nathani, Carsten, Schmid, Christian, und van Nieuwkoop, Renger (2011): Schätzung einer Input-Output-Tabelle der Schweiz 2008, Schlussbericht an das Bundesamt für Statistik [Estimated input-output table for Switzerland, 2008, final report to the Swiss Federal Statistical Office], Rüschlikon, Berne.
Milken Institute (2004): Biopharmaceutical Industry Contributions to State and U.S. Economics, Milken Institute, Santa Monica, CA.
Ernst & Young (2011a): Beyond Borders: The Global Biotechnology Report 2011.
Ernst & Young (2011b): Swiss Biotech Report 2011.
Metrobasel (2011): metrobasel economic report, Basel.
OECD (2009): OECD Biotechnology Statistics 2009, OECD, Paris.
Polynomics (2009): Die Wirkung des Breitbandausbaus auf Arbeitsplätze und die deutsche Volkswirtschaft, New York, Olten.
Weiss, Jörg-Peter, Raab, Stephan, und Schintke, Joachim (2004): Die pharmazeutische Industrie im gesamtwirtschaftlichen Kontext: Ausstrahlung auf Produktion und Beschäftigung in den Zulieferbranchen, Politikberatung kompakt [“The pharmaceutical industry in the macroeconomic context: impact on production and employment in the supplier sectors, compact policy advisory”], in Weekly Report 6/2005, Deutsches Institut für Wirtschaftsforschung [German Institute for Economic Research] (DIW), Berlin.

The importance of the pharmaceutical industry for Switzerland 43
Weiss, Jörg-Peter, Raab, Stephan, und Schintke, Joachim (2005): Demand for Pharmaceuticals – Impact on Production and Employment in Nearly Every Sector of the Economy, Politikberatung kompakt [compact policy advisory] 4, Deutsches Institut für Wirtschaftsforschung [German Institute for Economic Research] (DIW), Berlin.


InterpharmaPetersgraben 35, P.O. BoxCH-4003 BaselPhone +41 (0)61 264 34 00Fax +41 (0)61 264 34 [email protected]