a substitution method for antenna calibration by the use ... substitution method for antenna...
TRANSCRIPT
A Substitution Method for Antenna Calibration by the Use of Broadband Antenna
(30 to 1000 MHz)
Mitsunobu Samoto1, Nobuhito Samoto1, Hiroyuki Shimanoe1, Ikuo Makino1
and Kazuo Shimada2,
(1)Liberty Labs Asia, Inc., Yokohama, Japan,
(2)ETS-Lindgren Japan, Tokyo, Japan
1 / 37

ABSTRACT
Calibration of Broadband antennas
• ANSI C63.5-2006 [1] provides calibration methodwith the Standard Site Method (SSM) at a StandardAntenna Calibration Site (SACS) and two annexes,Annex G and Annex H, for the use of antenna factorsfor NSA measurements. (47CFR FCC Part 15 Sec. 31)
• This paper proposes an alternative calibrationmethod to the Annex G and H, that is, a BroadbandAntenna Substitution Method (SUB) in 10-m semi-anechoic chambers (SAC).
2 / 37

I. INTRODUCTION-1
• Antenna calibration method in ANSI C63.5-2006:
Antenna calibration with SSM shall be performed at SACS
SACS: The site shall be void of buildings, electric lines, fences,trees, underground cable, pipelines, etc. as specified in ANSIC63.7 -2005
Characteristics of SACS: Ideal site for the Antenna calibrationas specified in CISPR 16-1-5 2012-06 Ed.1.1 CALTS
SSM: Most common Calibration Method for antennacalibration specified in ANSI C63.5 -2006 Paragraph 5, Detailprocedures are provided in Annex G and Annex H.
GSCF: Correction factors (in dB) that are calculated ormeasured for each frequency at a specific geometry.
3 / 37
I. INTRODUCTION-2
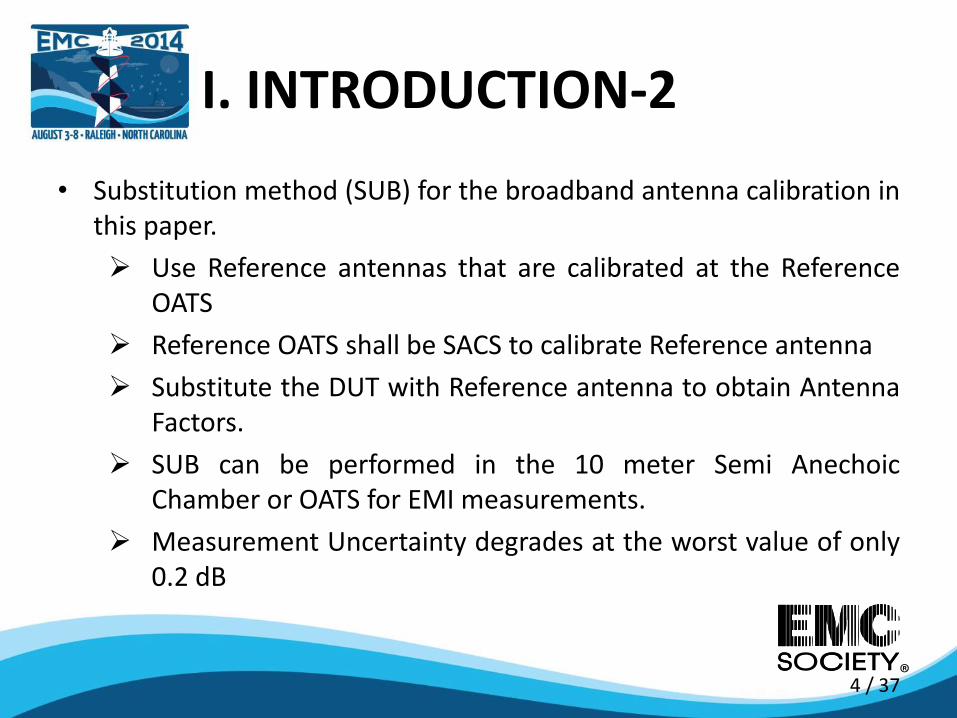
• Substitution method (SUB) for the broadband antenna calibration inthis paper.
Use Reference antennas that are calibrated at the ReferenceOATS
Reference OATS shall be SACS to calibrate Reference antenna
Substitute the DUT with Reference antenna to obtain AntennaFactors.
SUB can be performed in the 10 meter Semi AnechoicChamber or OATS for EMI measurements.
Measurement Uncertainty degrades at the worst value of only0.2 dB
4 / 37
II. MEASUREMENT CONDITIONsA. Using Broadband antennas
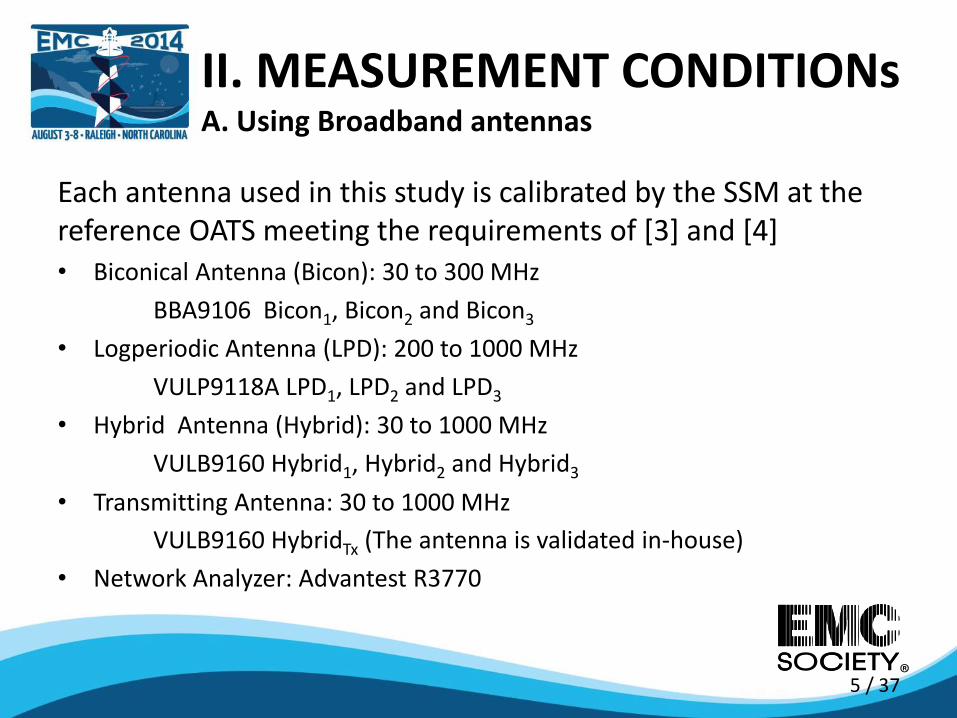
Each antenna used in this study is calibrated by the SSM at the reference OATS meeting the requirements of [3] and [4]• Biconical Antenna (Bicon): 30 to 300 MHz
BBA9106 Bicon1, Bicon2 and Bicon3
• Logperiodic Antenna (LPD): 200 to 1000 MHz
VULP9118A LPD1, LPD2 and LPD3
• Hybrid Antenna (Hybrid): 30 to 1000 MHz
VULB9160 Hybrid1, Hybrid2 and Hybrid3
• Transmitting Antenna: 30 to 1000 MHz
VULB9160 HybridTx (The antenna is validated in-house)
• Network Analyzer: Advantest R3770
5 / 37
II. MEASUREMENT CONDITIONsA. Using Broadband antennas
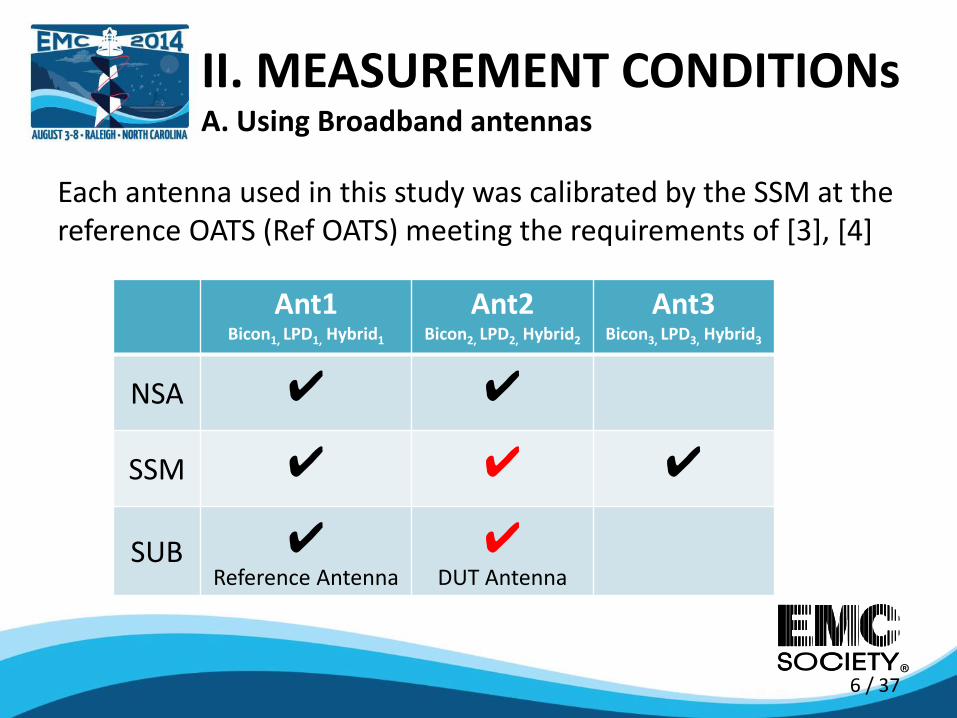
Each antenna used in this study was calibrated by the SSM at the reference OATS (Ref OATS) meeting the requirements of [3], [4]
Ant1Bicon1, LPD1, Hybrid1
Ant2Bicon2, LPD2, Hybrid2
Ant3Bicon3, LPD3, Hybrid3
NSA ✔ ✔
SSM ✔ ✔ ✔
SUB ✔Reference Antenna
✔DUT Antenna
6 / 37
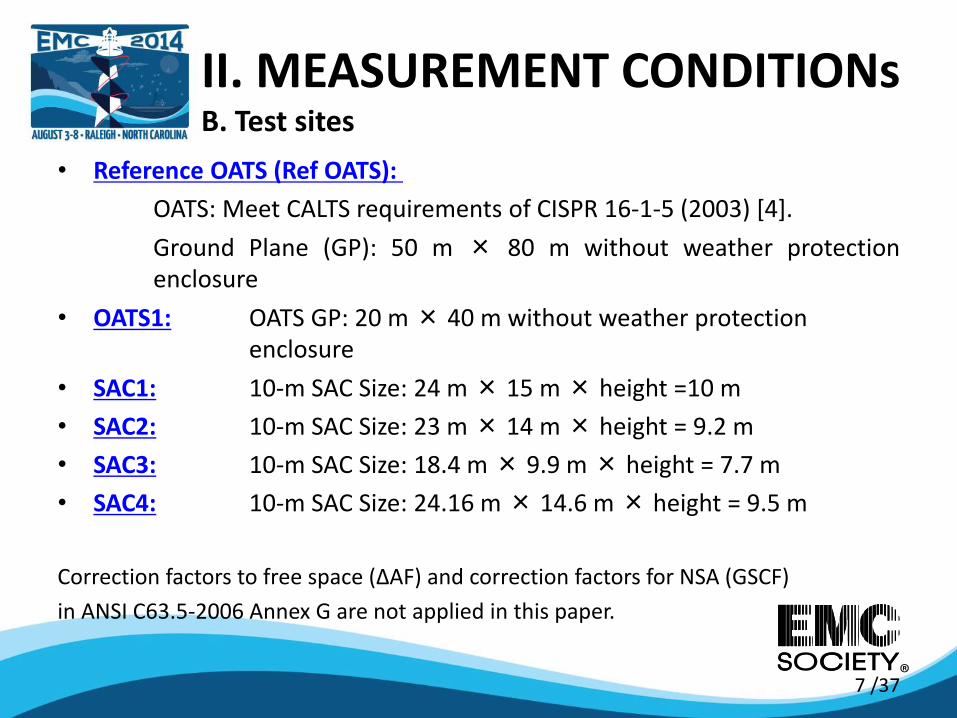
II. MEASUREMENT CONDITIONsB. Test sites
• Reference OATS (Ref OATS):
OATS: Meet CALTS requirements of CISPR 16-1-5 (2003) [4].
Ground Plane (GP): 50 m × 80 m without weather protectionenclosure
• OATS1: OATS GP: 20 m× 40 m without weather protectionenclosure
• SAC1: 10-m SAC Size: 24 m× 15 m× height =10 m
• SAC2: 10-m SAC Size: 23 m× 14 m× height = 9.2 m
• SAC3: 10-m SAC Size: 18.4 m× 9.9 m× height = 7.7 m
• SAC4: 10-m SAC Size: 24.16 m× 14.6 m× height = 9.5 m
Correction factors to free space (ΔAF) and correction factors for NSA (GSCF)
in ANSI C63.5-2006 Annex G are not applied in this paper.
7 /37

III. MEASUREMENT PROCEDUREsA. Broadband Antenna Substitution Method (SUB)
• The antenna factor, AFx, of the DUTantenna is calculated as follows;
• Set a Hybrid at the transmitting (Tx)side and the reference broadbandantenna at the receiving (Rx) side asshown in Fig. 1. Record the Rx levelas Lref.
• Replace the reference broadbandantenna at the Rx side to a DUT andrecord the Rx level as Lx.
• AFx = AFref + Lref – Lx (dB) (1)
• where, AFref are antenna factors ofreference broadband antennacalibrated by the SSM at the RefOATS.
Fig. 1. Antenna arrangement of SUB
8 / 37
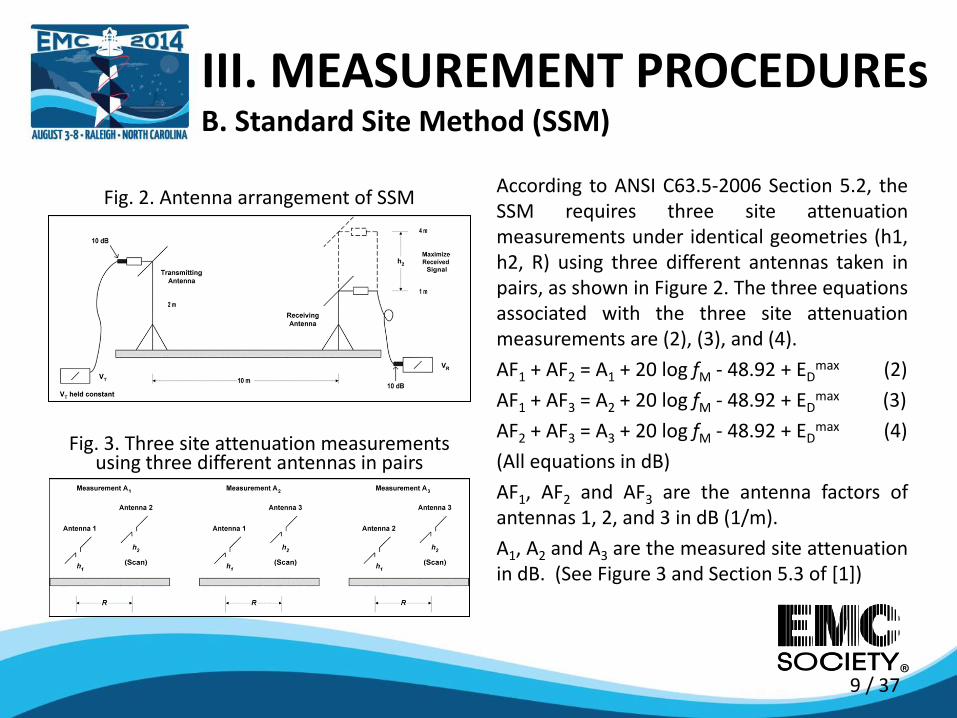
III. MEASUREMENT PROCEDUREsB. Standard Site Method (SSM)
According to ANSI C63.5-2006 Section 5.2, theSSM requires three site attenuationmeasurements under identical geometries (h1,h2, R) using three different antennas taken inpairs, as shown in Figure 2. The three equationsassociated with the three site attenuationmeasurements are (2), (3), and (4).
AF1 + AF2 = A1 + 20 log fM - 48.92 + EDmax (2)
AF1 + AF3 = A2 + 20 log fM - 48.92 + EDmax (3)
AF2 + AF3 = A3 + 20 log fM - 48.92 + EDmax (4)
(All equations in dB)
AF1, AF2 and AF3 are the antenna factors ofantennas 1, 2, and 3 in dB (1/m).
A1, A2 and A3 are the measured site attenuationin dB. (See Figure 3 and Section 5.3 of [1])
Fig. 2. Antenna arrangement of SSM
Fig. 3. Three site attenuation measurements using three different antennas in pairs
9 / 37
IV. COMPARISON BETWEEN ANTENNA FACTORs OF BROADBAND ANTENNAs MEASURED AT OATS AND SACs BY SSM
SSM measurement studies in OATS and SAC
AFx at the Ref OATS for 10-m distance, horizontal polarization and 2-m Txheight.AF differences at each site is calculated as follows and shown in Figs. 4, 6 and 8.
ΔdB1 = (AFx measured by SSM at each test site) – (AFref by SSM at Ref OATS) (8)
The NSA at each site for 10-m distance, 2-m Tx height and horizontalpolarization using antennas of Bicon1 and Bicon2, LPD1 and LPD2, and Hybrid1
and Hybrid2.ΔdB2 are calculated as follows and shown Figs. 5, 7 and 9.
ΔdB2 = (NSA measured at each test site) – (Theoretical NSA) (9)
10 / 37

IV. COMPARISON BETWEEN ANTENNA FACTORs OFBROADBAND ANTENNAs MEASURED AT OATS ANDSACs BY SSM (Bicon)
Fig. 4. AF Deviation: D10H2
ΔdB1 of Bicon2 measured at each site
Fig. 5. NSA Deviation: D10H2
ΔdB2: Pair of Bicon1 and Bicon2
Fig. 4 shows AF differences of ΔdB1 for Bicon2. Fig. 5 shows the differences of ΔdB2 each test site. Vertical
11 /37
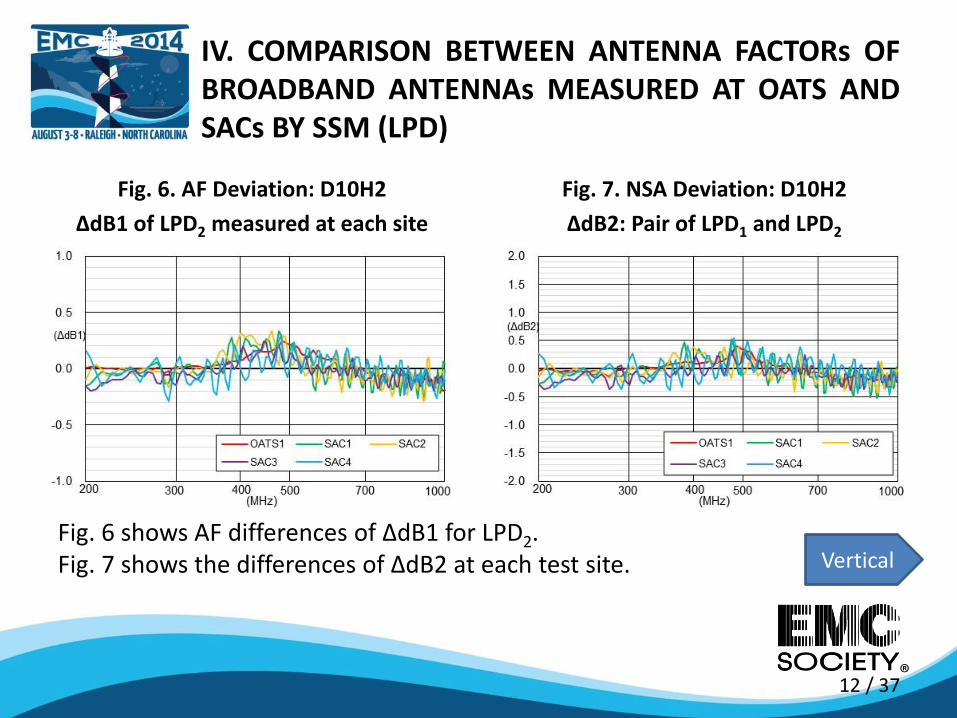
IV. COMPARISON BETWEEN ANTENNA FACTORs OFBROADBAND ANTENNAs MEASURED AT OATS ANDSACs BY SSM (LPD)
Fig. 6. AF Deviation: D10H2
ΔdB1 of LPD2 measured at each site
Fig. 7. NSA Deviation: D10H2
ΔdB2: Pair of LPD1 and LPD2
Fig. 6 shows AF differences of ΔdB1 for LPD2. Fig. 7 shows the differences of ΔdB2 at each test site. Vertical
12 / 37

IV. COMPARISON BETWEEN ANTENNA FACTORs OFBROADBAND ANTENNAs MEASURED AT OATS ANDSACs BY SSM (Hybrid)
Fig. 8. AF Deviation: D10H2
ΔdB1 of Hybrid2 measured at each site
Fig. 9. NSA Deviation: D10H2
ΔdB2: Pair of Hybrid1 and Hybrid2
Fig. 8 shows AF differences of ΔdB1 for Hybrid2. Fig. 9 shows the differences of ΔdB2 at each test site. Vertical
13 /37

IV. COMPARISON BETWEEN ANTENNA FACTORs OFBROADBAND ANTENNAs MEASURED AT OATS ANDSACs BY SSM
As can be seen from comparisons of Figs. 4 and 5, Figs. 6 and 7,and Figs. 8 and 9, ΔdB1 characteristics are similar to ΔdB2characteristics, and deviations of ΔdB1 are one-half of ΔdB2,approximately.
From these measurement results, it can be seen that theantenna calibration with SSM in SAC is significantly affected byNSA characteristics of the SAC used.
14 / 37
V. COMPARISON BETWEEN AFs MEASUREDAT BOTH OATS AND SACs BY SUB
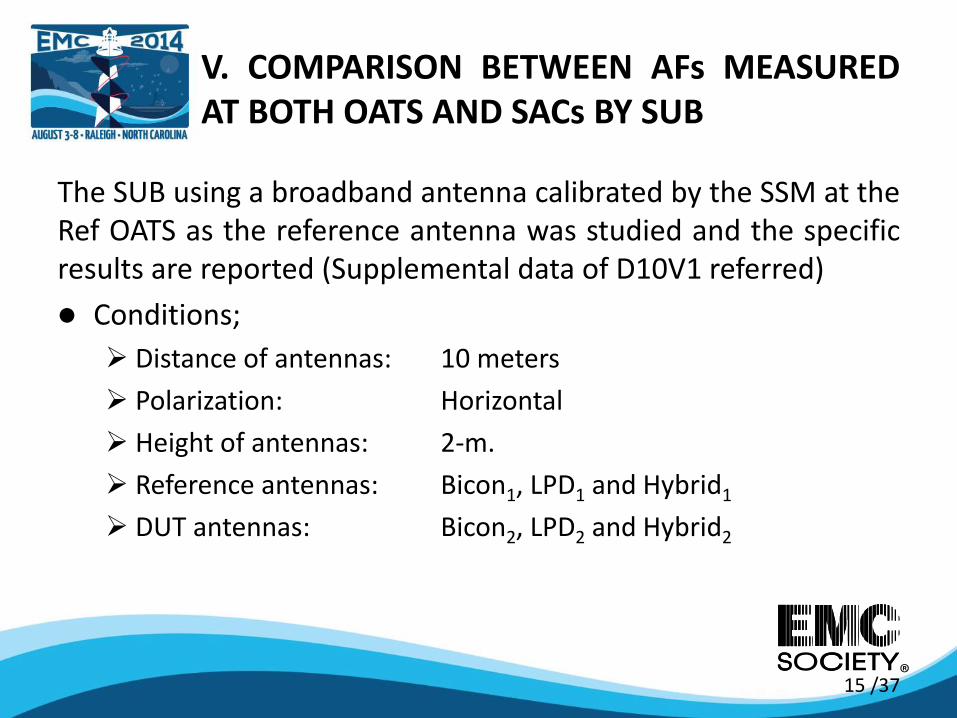
The SUB using a broadband antenna calibrated by the SSM at theRef OATS as the reference antenna was studied and the specificresults are reported (Supplemental data of D10V1 referred)
Conditions;
Distance of antennas: 10 meters
Polarization: Horizontal
Height of antennas: 2-m.
Reference antennas: Bicon1, LPD1 and Hybrid1
DUT antennas: Bicon2, LPD2 and Hybrid2
15 /37

V. COMPARISON BETWEEN AFs MEASUREDAT BOTH OATS AND SACs BY SUB
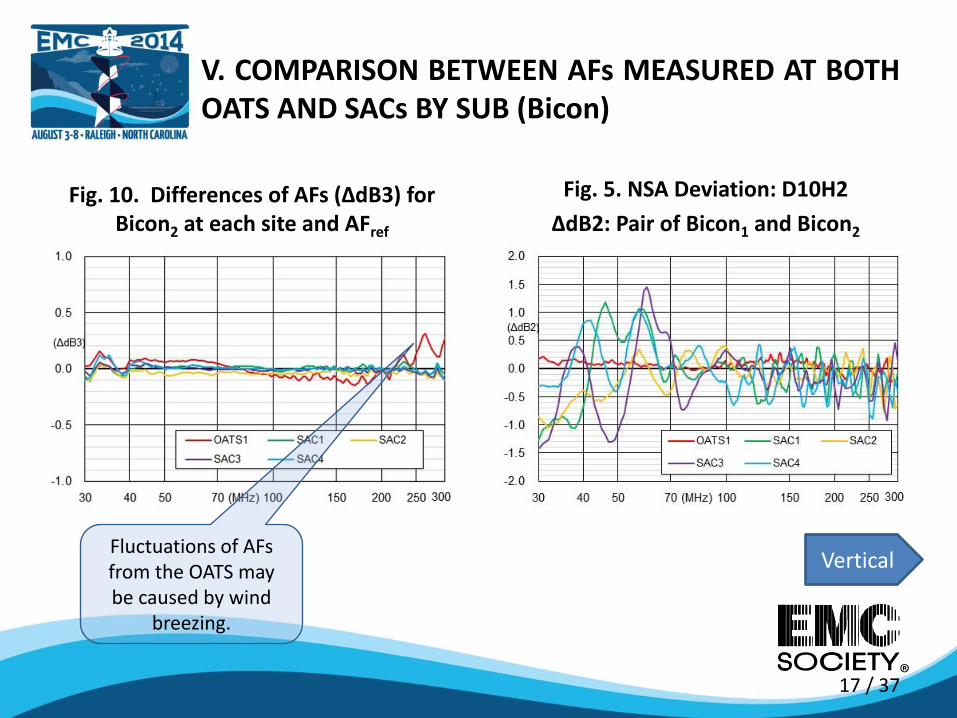
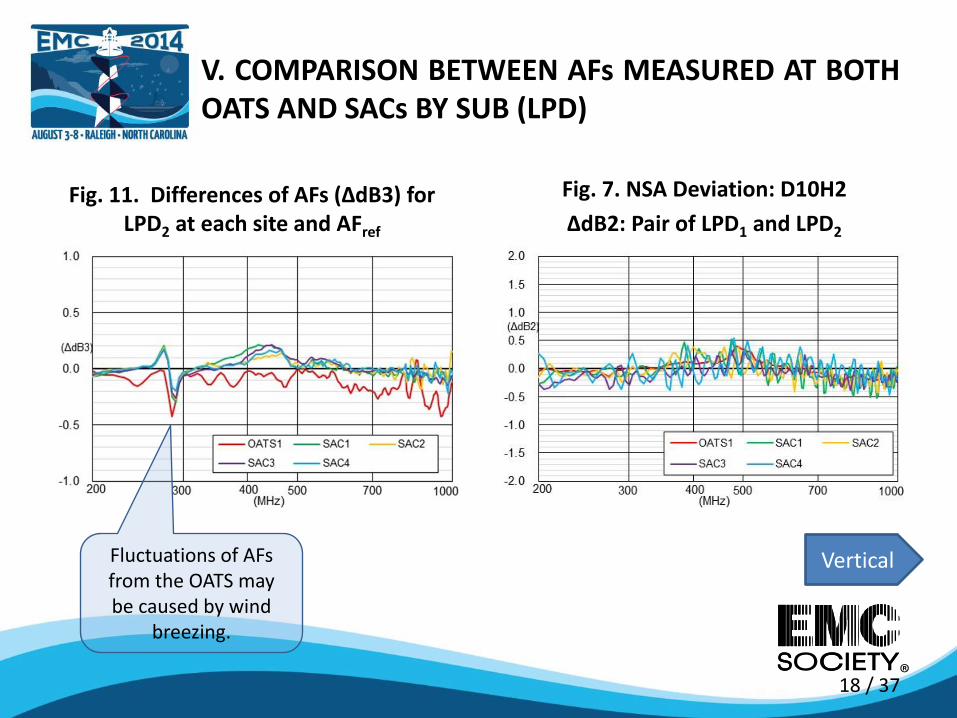
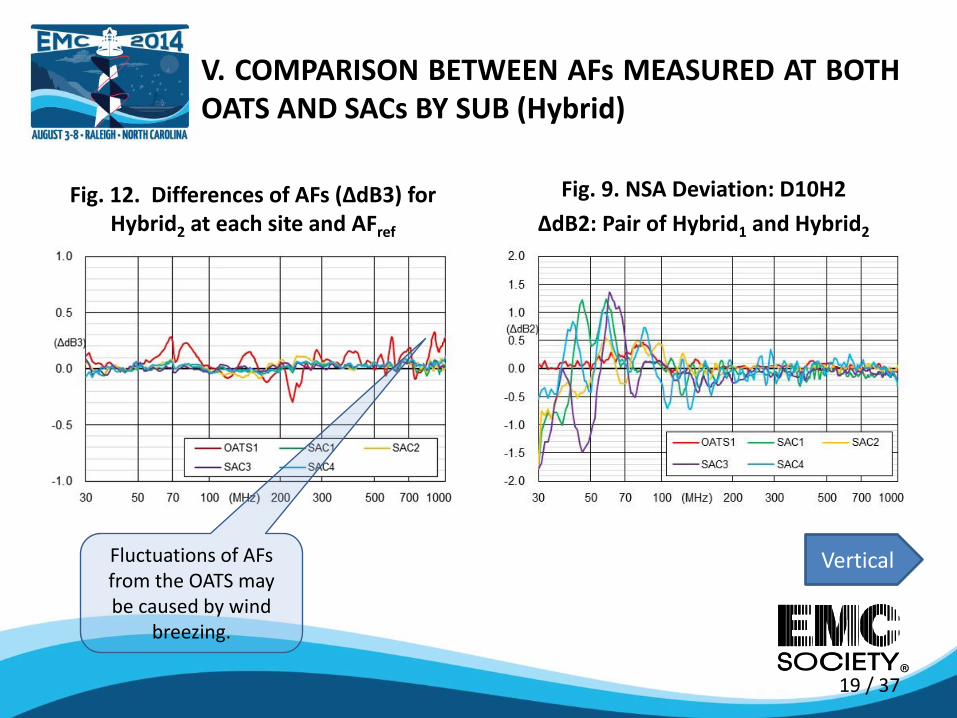
The differences between AFs measured by the SUB at each test site and AFref
are shown in Figs. 10 to 12 for each antenna of Bicon, LPD and Hybrid asΔdB3.
ΔdB3 = (AFx measured by SUB at each test site) – (AFref by SSM at Ref OATS) (10)
As can be seen from Figs. 10 to 12, AFs by this SUB coincide within 0.4 dB tothe AFref. AFs by the SUB at the OATS are worse than at SAC showingconsistent accuracy within + 0.2 / - 0.3 dB. Those AFs measured by the SUB atSACs would not be affected by NSA characteristics of test sites. The largedeviations at the OATS are caused by changes of the measurement conditionsuch as wind breezing and temperature changes.
16 / 37
V. COMPARISON BETWEEN AFs MEASURED AT BOTHOATS AND SACs BY SUB (Bicon)
Fig. 10. Differences of AFs (ΔdB3) for Bicon2 at each site and AFref
Fig. 5. NSA Deviation: D10H2
ΔdB2: Pair of Bicon1 and Bicon2
VerticalFluctuations of AFs from the OATS may be caused by wind
breezing.
17 / 37
V. COMPARISON BETWEEN AFs MEASURED AT BOTHOATS AND SACs BY SUB (LPD)
Fig. 11. Differences of AFs (ΔdB3) for LPD2 at each site and AFref
Fig. 7. NSA Deviation: D10H2
ΔdB2: Pair of LPD1 and LPD2
VerticalFluctuations of AFs from the OATS may be caused by wind
breezing.
18 / 37
V. COMPARISON BETWEEN AFs MEASURED AT BOTHOATS AND SACs BY SUB (Hybrid)
Fig. 12. Differences of AFs (ΔdB3) for Hybrid2 at each site and AFref
Fig. 9. NSA Deviation: D10H2
ΔdB2: Pair of Hybrid1 and Hybrid2
VerticalFluctuations of AFs from the OATS may be caused by wind
breezing.
19 / 37
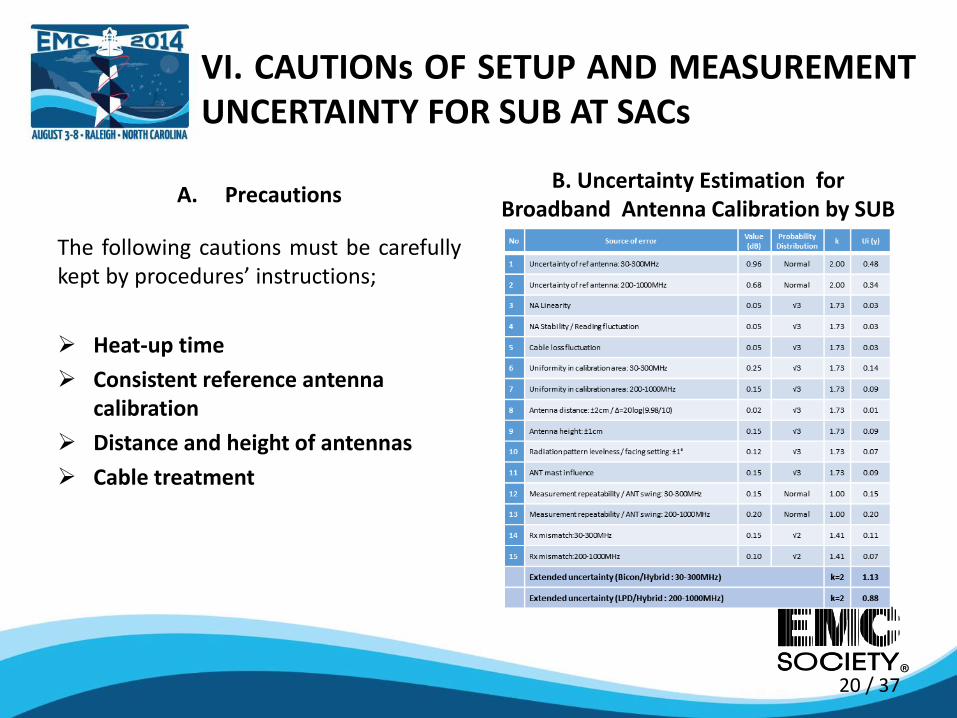
VI. CAUTIONs OF SETUP AND MEASUREMENTUNCERTAINTY FOR SUB AT SACs
The following cautions must be carefullykept by procedures’ instructions;
Heat-up time
Consistent reference antenna calibration
Distance and height of antennas
Cable treatment
B. Uncertainty Estimation for Broadband Antenna Calibration by SUB
A. Precautions
20 / 37
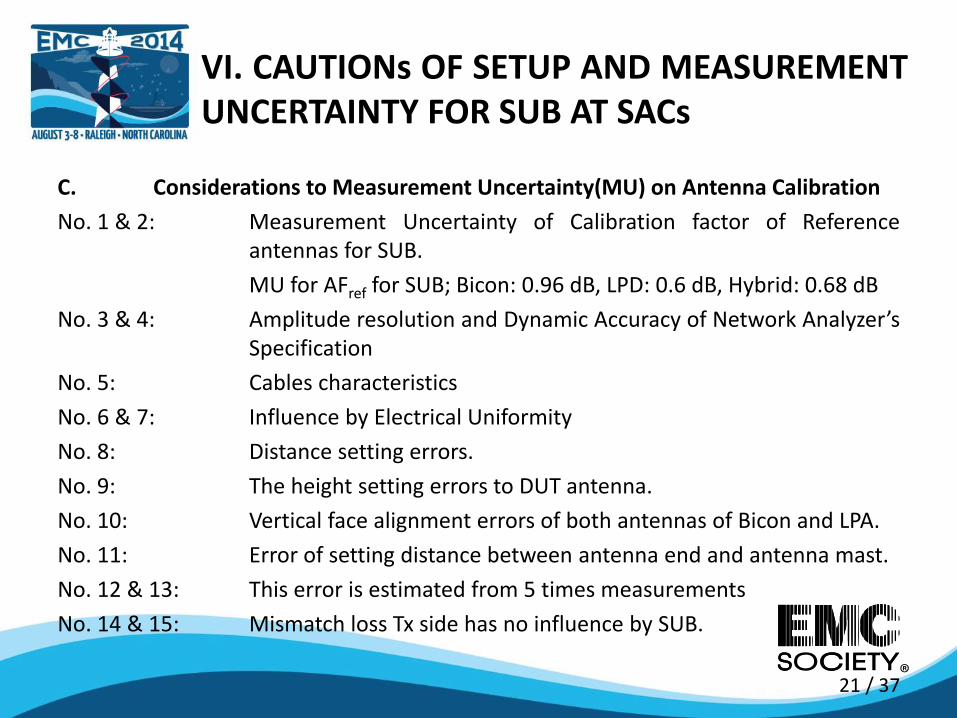
VI. CAUTIONs OF SETUP AND MEASUREMENTUNCERTAINTY FOR SUB AT SACs
C. Considerations to Measurement Uncertainty(MU) on Antenna Calibration
No. 1 & 2: Measurement Uncertainty of Calibration factor of Referenceantennas for SUB.
MU for AFref for SUB; Bicon: 0.96 dB, LPD: 0.6 dB, Hybrid: 0.68 dB
No. 3 & 4: Amplitude resolution and Dynamic Accuracy of Network Analyzer’sSpecification
No. 5: Cables characteristics
No. 6 & 7: Influence by Electrical Uniformity
No. 8: Distance setting errors.
No. 9: The height setting errors to DUT antenna.
No. 10: Vertical face alignment errors of both antennas of Bicon and LPA.
No. 11: Error of setting distance between antenna end and antenna mast.
No. 12 & 13: This error is estimated from 5 times measurements
No. 14 & 15: Mismatch loss Tx side has no influence by SUB.
21 / 37
VII. CONCLUSION
Antenna calibration with SSM shall use a Standard Antenna CalibrationSite (SACS)/ ANSI C63.5-2006_5.2 and should not be applied in the 10-msemi-anechoic chambers (SAC) especially for Bicon and Bilog antennas.
Advantage on antenna calibration with SUB:
Consistent Calibration: less affects from ambient conditions of wind,rain, radio noises and NSA characteristics.
Time saving: AF measurements by the SUB take about two-third lessthan that of SSM.
Disadvantage on antenna calibration with SUB:
Measurement Uncertainty will be degraded around 0.2dB to that of RefOATS at the worst case.
SUB will be acceptable for the broadband antenna calibration method.
22 / 37

REFERENCES
[1] ANSI C63.5-2006: American National Standard Electromagnetic Compatibility–Radiated Emission Measurements in Electromagnetic Interference (EMI) Control–Calibration of Antennas (9 kHz to 40 GHz)(Revision of ANSI C63.5-2004)
[2] ANSI C63.4-2009: American National Standard for Methods of Measurementof Radio- Noise Emissions from Low-Voltage Electrical and ElectronicEquipment in the Range of 9 kHz to 40 GHz (Revision of ANSI C63.4-2003)
[3] ANSI C63.7-2005: American National Standard Guide for Construction ofOpen-Area Test Sites for Performing Radiated Emission Measurements(Revision of ANSI C63.7-1992)
[4] CISPR 16-1-5(2003-11): Specification for radio disturbance and immunitymeasuring apparatus and methods – Part 1-5: Radio disturbance andimmunity measuring apparatus – Antenna calibration test sites for 30 MHzto 1 000 MHz
23 / 37

Thank you
24 / 37
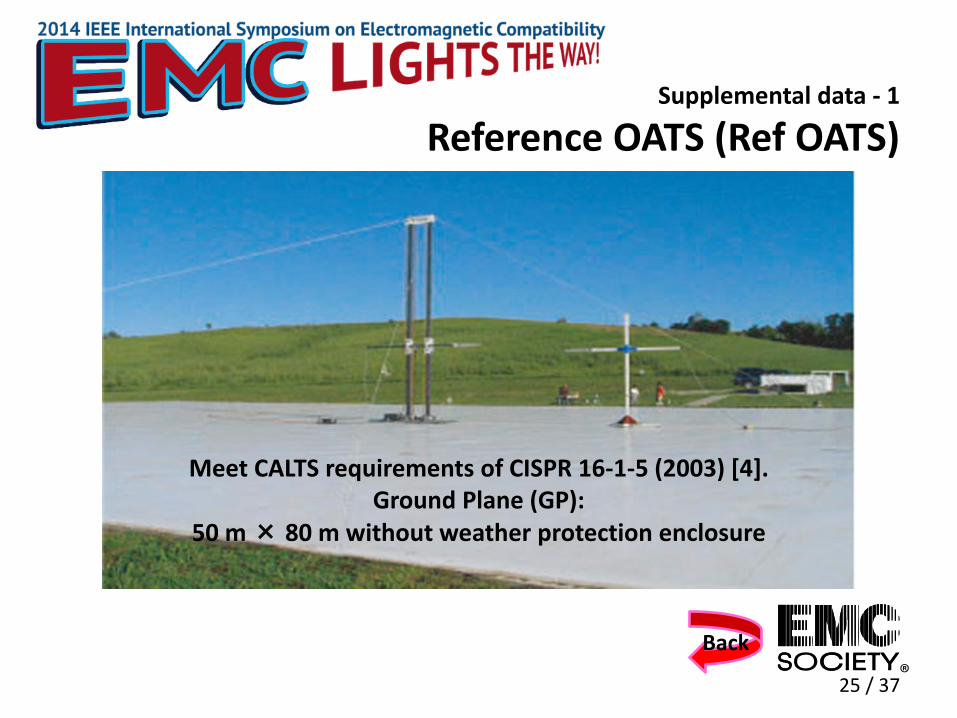
Supplemental data - 1
Reference OATS (Ref OATS)
Meet CALTS requirements of CISPR 16-1-5 (2003) [4].Ground Plane (GP):
50 m × 80 m without weather protection enclosure
Back
25 / 37
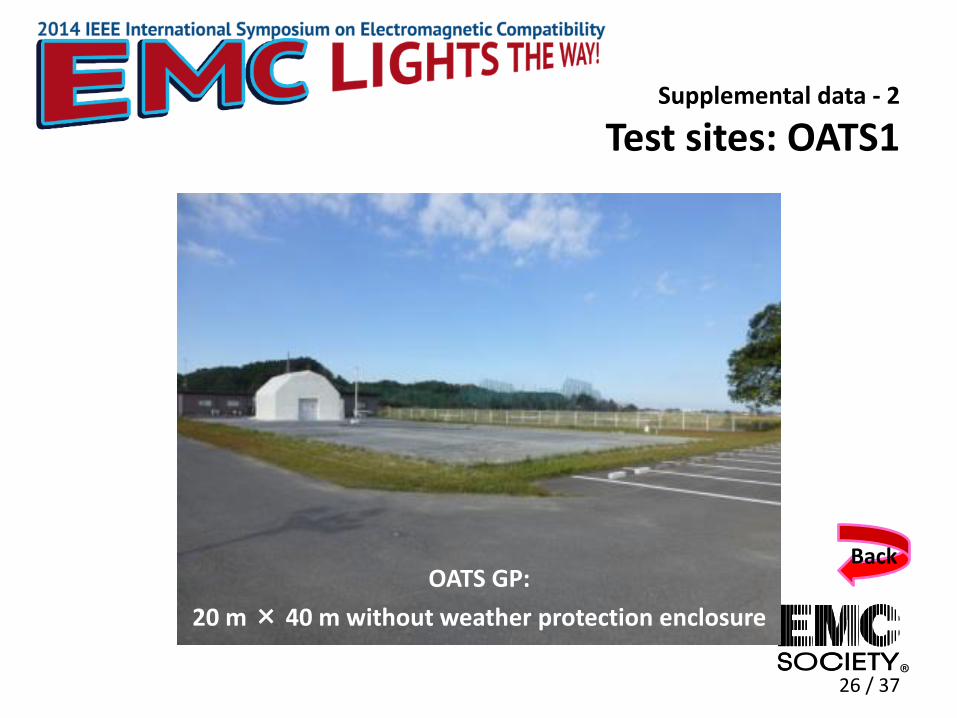
Supplemental data - 2
Test sites: OATS1
OATS GP:
20 m × 40 m without weather protection enclosure
Back
26 / 37
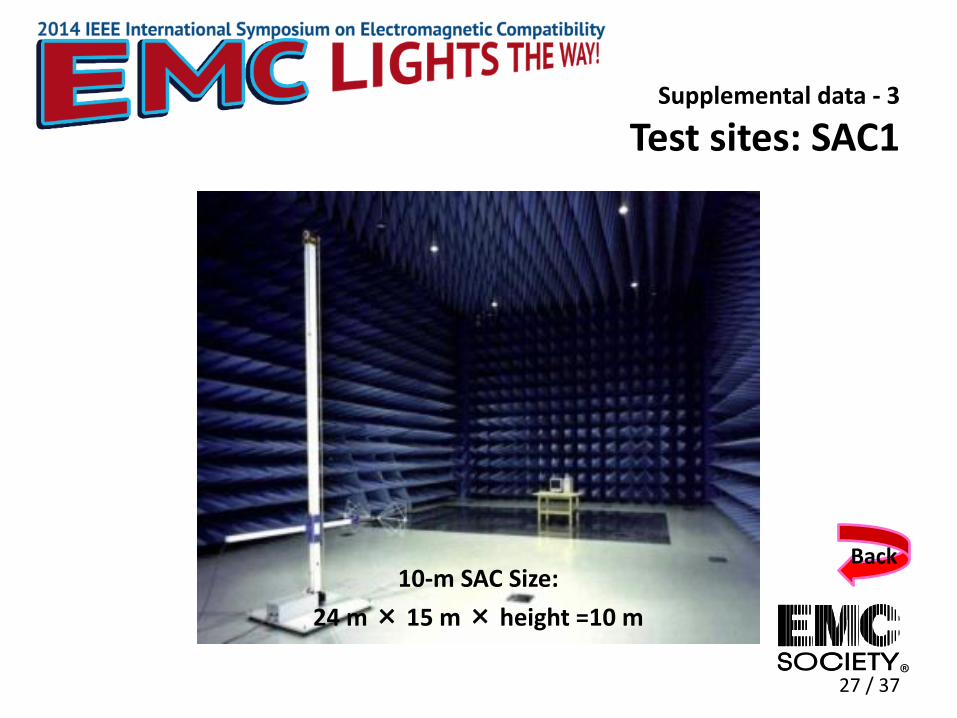
Supplemental data - 3
Test sites: SAC1
10-m SAC Size:
24 m × 15 m × height =10 m
Back
27 / 37
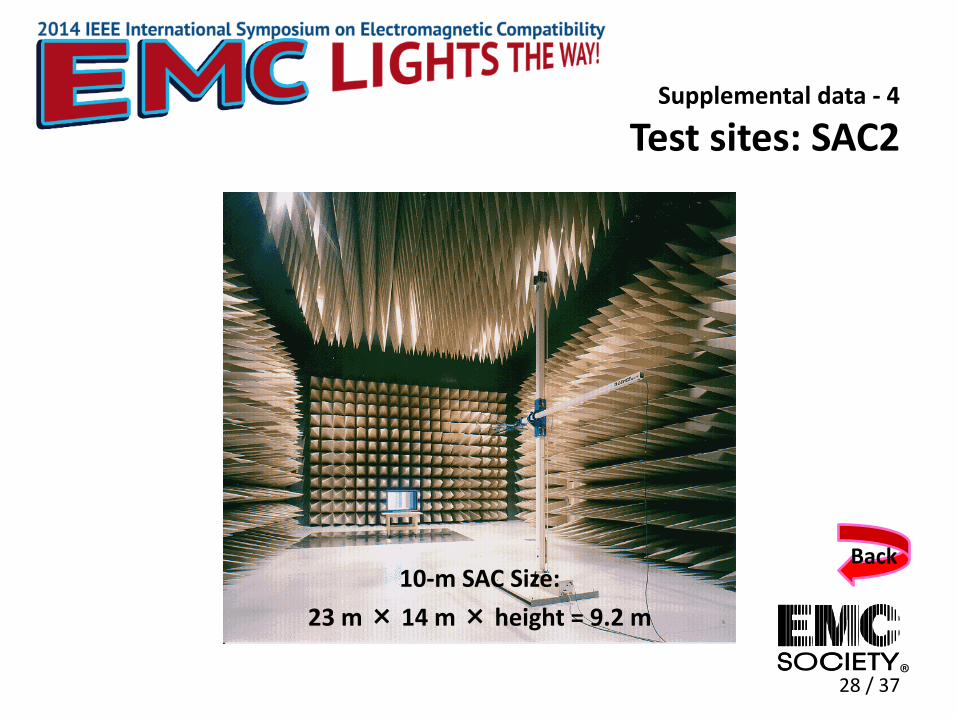
Supplemental data - 4
Test sites: SAC2
10-m SAC Size:
23 m × 14 m × height = 9.2 m
Back
28 / 37
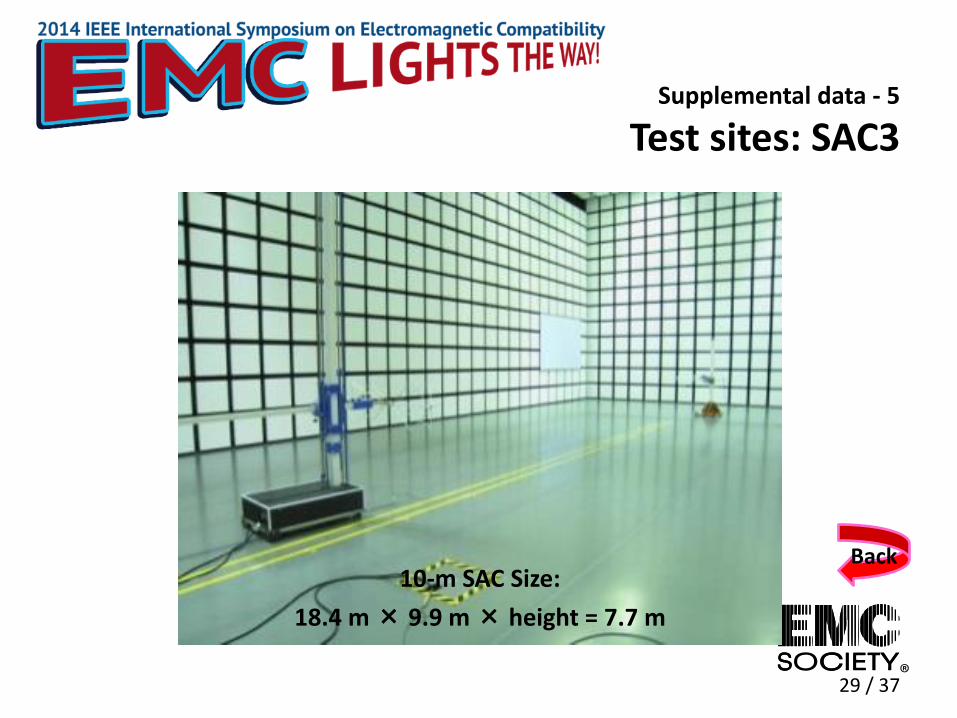
Supplemental data - 5
Test sites: SAC3
10-m SAC Size:
18.4 m × 9.9 m × height = 7.7 m
Back
29 / 37
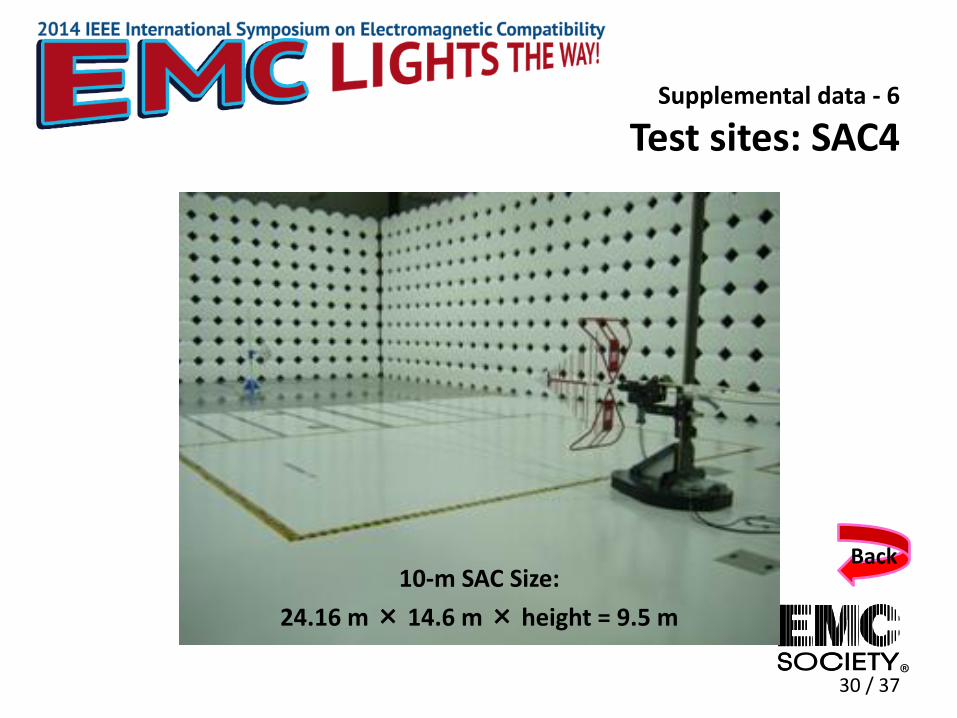
Supplemental data - 6
Test sites: SAC4
10-m SAC Size:
24.16 m × 14.6 m × height = 9.5 m
Back
30 / 37

Supplemental data - 7Uncertainty Estimation for Broadband Antenna Calibration by SUB
No Source of error Value (dB) Probability Distribution k Ui (y)
1 Uncertainty of ref antenna: 30-300MHz 0.96 Normal 2.00 0.48 2 Uncertainty of ref antenna: 200-1000MHz 0.68 Normal 2.00 0.34 3 NA Linearity 0.05 √3 1.73 0.03 4 NA Stability / Reading fluctuation 0.05 √3 1.73 0.03 5 Cable loss fluctuation 0.05 √3 1.73 0.03 6 Uniformity in calibration area: 30-300MHz 0.25 √3 1.73 0.14 7 Uniformity in calibration area: 200-1000MHz 0.15 √3 1.73 0.09 8 Antenna distance: ±2cm / Δ=20log(9.98/10) 0.02 √3 1.73 0.01 9 Antenna height: ±1cm 0.15 √3 1.73 0.09
10 Radiation pattern levelness / facing setting: ±1° 0.12 √3 1.73 0.07 11 ANT mast influence 0.15 √3 1.73 0.09 12 Measurement repeatability / ANT swing: 30-300MHz 0.15 Normal 1.00 0.15 13 Measurement repeatability / ANT swing: 200-1000MHz 0.20 Normal 1.00 0.20 14 Rx mismatch:30-300MHz 0.15 √2 1.41 0.11 15 Rx mismatch:200-1000MHz 0.10 √2 1.41 0.07
Extended uncertainty (Bicon/Hybrid : 30-300MHz) k=2 1.13 Extended uncertainty (LPD/Hybrid : 200-1000MHz) k=2 0.88
Back
31 / 37
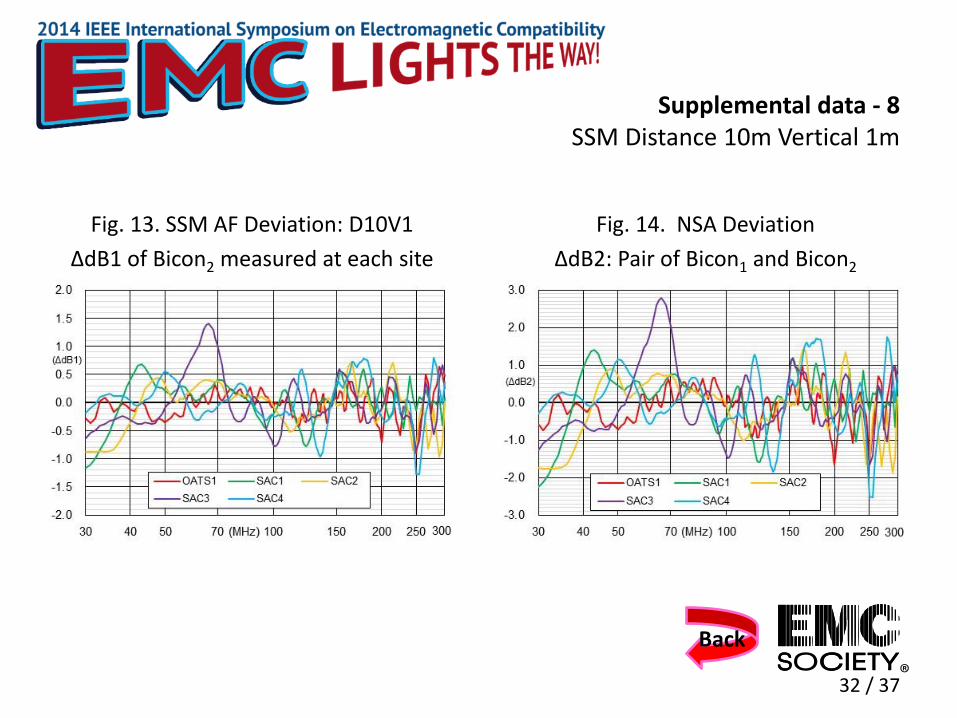
Supplemental data - 8SSM Distance 10m Vertical 1m
Fig. 13. SSM AF Deviation: D10V1
ΔdB1 of Bicon2 measured at each site
Fig. 14. NSA Deviation
ΔdB2: Pair of Bicon1 and Bicon2
Back
32 / 37
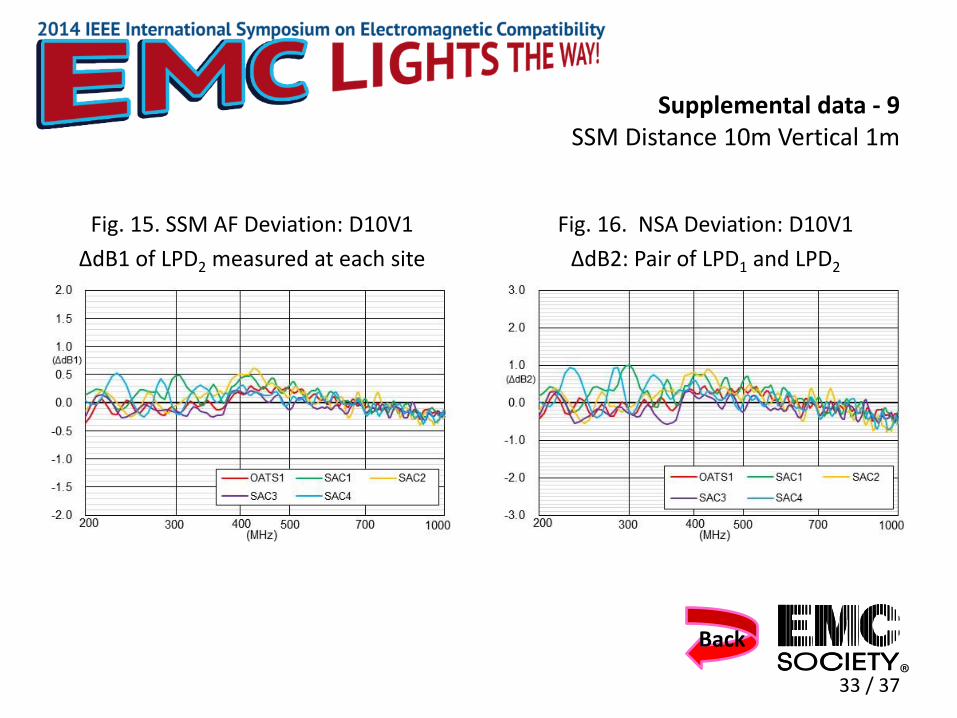
Supplemental data - 9SSM Distance 10m Vertical 1m
Fig. 15. SSM AF Deviation: D10V1
ΔdB1 of LPD2 measured at each site
Fig. 16. NSA Deviation: D10V1
ΔdB2: Pair of LPD1 and LPD2
Back
33 / 37
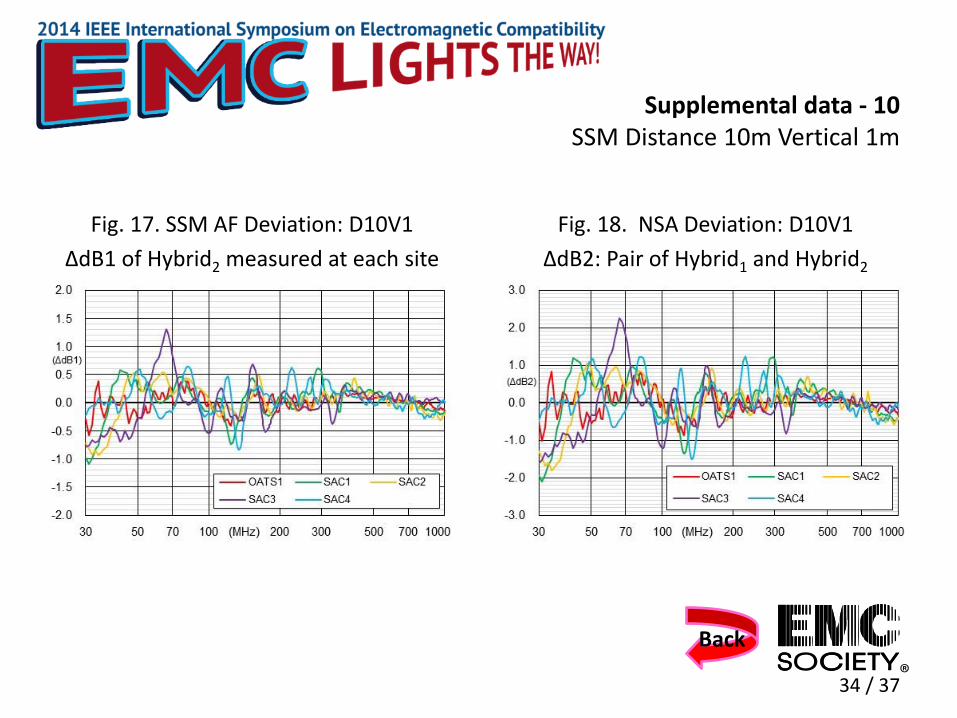
Supplemental data - 10SSM Distance 10m Vertical 1m
Fig. 17. SSM AF Deviation: D10V1
ΔdB1 of Hybrid2 measured at each site
Fig. 18. NSA Deviation: D10V1
ΔdB2: Pair of Hybrid1 and Hybrid2
Back
34 / 37
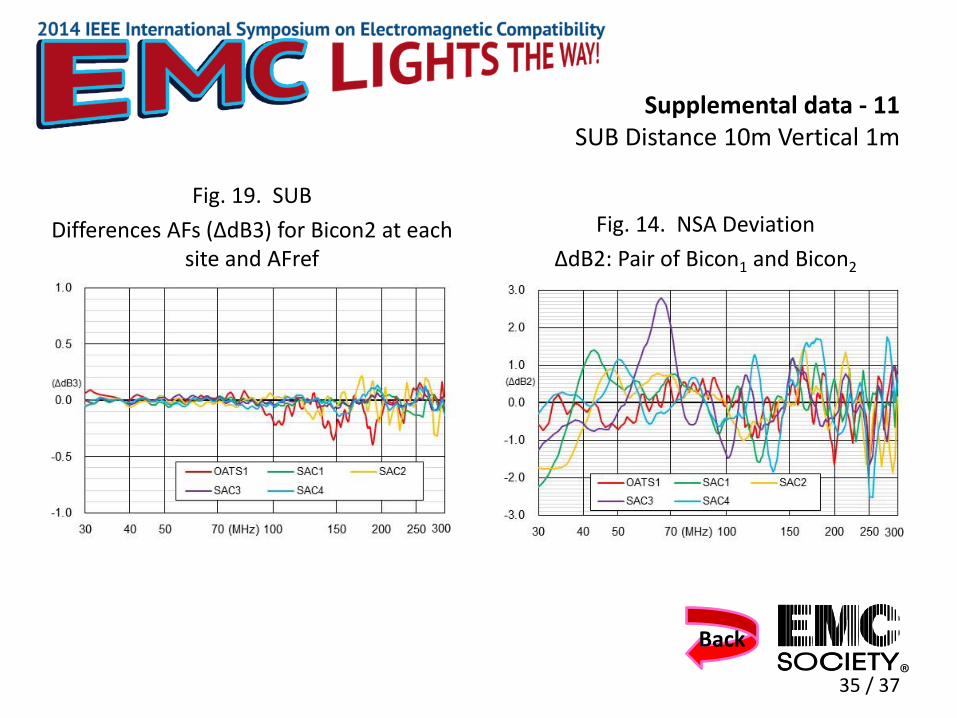
Supplemental data - 11SUB Distance 10m Vertical 1m
Fig. 19. SUB
Differences AFs (ΔdB3) for Bicon2 at each site and AFref
Fig. 14. NSA Deviation
ΔdB2: Pair of Bicon1 and Bicon2
Back
35 / 37

Supplemental data - 12SUB Distance 10m Vertical 1m
Fig. 20. SUB
Differences AFs (ΔdB3) for LPD2 at each site and AFref
Fig. 16. NSA Deviation: D10V1
ΔdB2: Pair of LPD1 and LPD2
Back
36 / 37
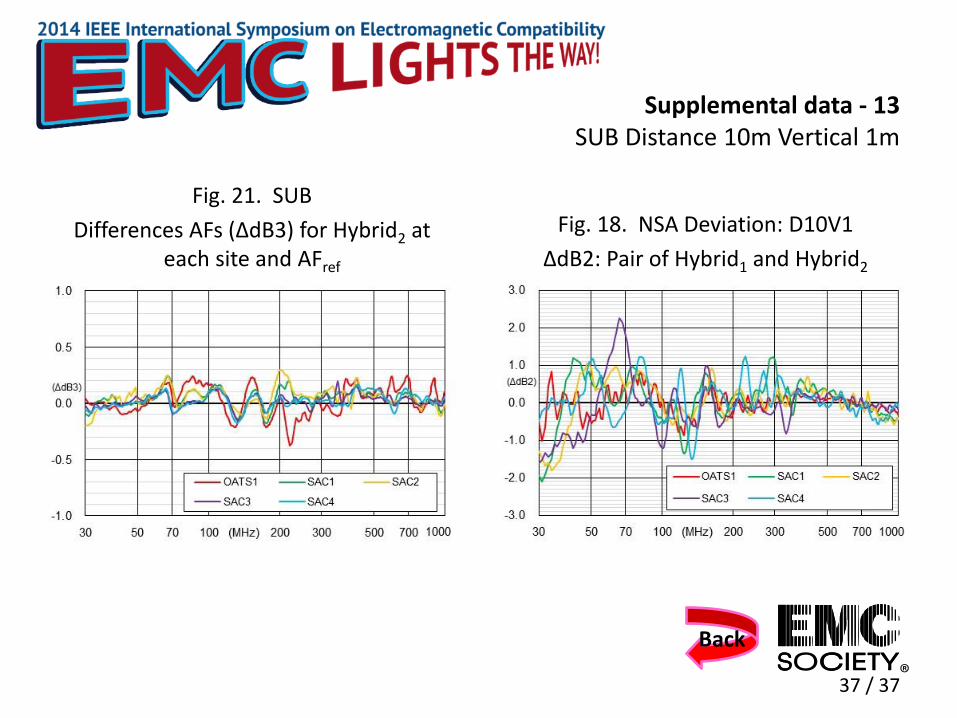
Supplemental data - 13SUB Distance 10m Vertical 1m
Fig. 21. SUB
Differences AFs (ΔdB3) for Hybrid2 at each site and AFref
Fig. 18. NSA Deviation: D10V1
ΔdB2: Pair of Hybrid1 and Hybrid2
Back
37 / 37