a survey of slope condition on motorway … · ground engineering division structures group...
TRANSCRIPT

TRANSPORT A N D ROAD RESEARCH LABORATORY Department of Transport
RESEARCH REPORT 199
A SURVEY OF SLOPE CONDITION ON M O T O R W A Y
EARTHWORKS IN ENGLAND AND WALES
by J PERRY
The views expressed in this Report are not necessarily those of the Department of Transport
Ground Engineering Division Structures Group Transport and Road Research Laboratory Crowthorne, Berkshire, RG11 6AU 1989
ISSN 0266-5247

CONTENTS
Abstract
1. Introduction
2. Survey description
2.1 Extent of survey
2.2 Preparatory work
2.3 The survey
2.4 Processing the data
2.5 Factors studied in the analysis of slopes
3. Drift deposits
3.1 Geology
3.2 Age of earthworks
3.3 Geometry of slope
3.4 Type of drainage
3.5 Orientation of slope
3.6 Design of side slopes in new construction
4. Eocene and Cretaceous deposits
4.1 Geology
4.2 Age of earthworks
4.3 Geometry of slope
4.4 Type of drainage
4.5 Orientation of slope
4.6 Design of side slopes in new construction
5. Jurassic and Triassic deposits
5.1 Geology
5.2 Age of earthworks
5.3 Geometry of slope
5.4 Type of drainage
5.5 Orientation of slope
Page
1
1
1
1
2
2
5
.
7.
7
7 8.
7 9.
10.
9 11.
17
17
17
17
17
19
20
25
25
25
25
25
27
5.6 Design of side slopes in new construction
Carboniferous and Old Red Sandstone deposits
6.1 Geology
6.2 Age of earthworks
6.3 Geometry of slope
6.4 Type of drainage and orientation of slope
6.5 Design of side slopes in new construction
General results for all the motorways surveyed
7.1 Description of slope failures
7.2 Variation of design parameters
Discussion
Conclusion
Acknowledgements
References
Appendix A--Glossary of terms
Appendix B--Details of the motorways surveyed
Page
27
33
33
33
33
33
33
40
40
41
42
44
44
45
46
47
© CROWN COPYRIGHT 1989 Extracts from the text may be reproduced,
except for commercial purposes, provided the source is acknowledged.

Ownership of the Transport Research Laboratory was transferred from the Department of Transport to a subsidiary of the Transport Research Foundation on I st April 1996.
This report has been reproduced by permission of the Controller of HMSO. Extracts from the text may be reproduced, except for commercial purposes, provided the source is acknowledged.

A SURVEY OF SLOPE CONDITION ON M O T O R W A Y EARTHWORKS IN ENGLAND AND WALES
ABSTRACT
The motorway system in England and Wales is of sufficient age to allow a useful study of the condition of its earthwork side slopes. This Report describes the most extensive slope survey ever to be undertaken of this motorway system. The survey, covering a total length of 570 kin, concentrated on selected lengths of motorway which included the principal geologies encountered on the motorway system, in particular, areas where over-consolidated clays predominate. It discusses the basic factors that have contributed to shallow failures on the side slopes of embankments and cuttings, and attempts to quantify any long-term problems. The results show a high incidence of failure associated with the major influences of geology, age of earthworks and geometry of slope. The slope angles recommended in this Report can be used in the design of new earthwork side slopes and to identify slopes at risk of failure in existing earthworks. An estimate has been made as to the extent of failures in the future which suggests that three times as many slopes are likely to fail than have failed so far.
1 INTRODUCTION
Failures on the slopes of highway earthworks are undesirable. They can undermine the road structure, damage drainage, cabling and crash barriers, and in some cases obstruct the motorway hard shoulder. Furthermore, reinstatement of failed slopes results in higher maintenance expenditure.
The construction of the motorway system in Great Britain began over twenty-five years ago and, over considerable lengths of the system, a sufficient time has elapsed to allow a useful study to be made of the performance of the earthwork side slopes. A survey has therefore been undertaken to determine the scale of deterioration of earthworks, attempt to quantify their long-term performance and, if possible, identify the factors observed during the survey, for example geology, geometry and associated soil properties, that have contributed to slope instability. Further slope failures are inevitably going to occur on the motorway system, and this Report describes the opening phases of this continuing process.
As geology is one of the major factors affecting stability, the survey covered the principal geologies encountered on motorways in England and Wales from the Old Red Sandstone Series to Recent deposits. Greater attention was paid to heavily over- consolidated clay soils where failures are likely to
occur more frequently. The survey included a variety of motorways with earthworks of differing age, geometries, orientations and types of drainage.
In this Report, terms are used which have specific meanings, and a list of definitions is given in Appendix A.
2 SURVEY DESCRIPTION
2.1 EXTENT OF SURVEY In 1987 there were over 2700 km of motorway in England and Wales (Department of Transport, 1988) of which the survey covered 570 kin, 21 per cent of the motorway system. Figure B1 of Appendix B, shows the extent of the survey with respect to the current motorway system. The survey was conducted between 1980 and 1988, and results of the initial stages were reported by Parsons and Perry (1985) and Perry (1985). Although some large earthworks occur on other major highways, motorways were chosen because of their high and extensive earthworks which are necessary to restrict the longitudinal gradient to an absolute maximum of 4 per cent (Department of Transport, 1981). The survey procedure described here may be used for studying any length of highway where information is required for a particular area with significant earthworks.
Table B1 of Appendix B, gives details of the motorways that were covered in the survey. Motorways were chosen, in seventeen counties of England and Wales, which would incorporate large lengths of a variety of geologies and would cover several ages. Although Drift deposits were of interest the choice of length of motorway was primarily governed by the Solid deposits present, in which more failures are likely to occur. (Consequently, motorways in Scotland were not included since most of these had been constructed in Drift deposits.) For convenience, the motorway lengths were bounded by the maintenance limits of a county or the interchanges between which the geology occurred. These lengths, in some cases, were subsequently split into construction contracts. The age of a motorway within a county can vary due to different opening dates for each construction contract. The ages of sections of motorway included in the survey ranged from 1 year to 25 years with about 75 per cent of the lengths surveyed being 10 years and older, and 6 per cent of the younger ages being improvements, such as earthwork widening on existing motorways, which were included as part of the main motorway survey.
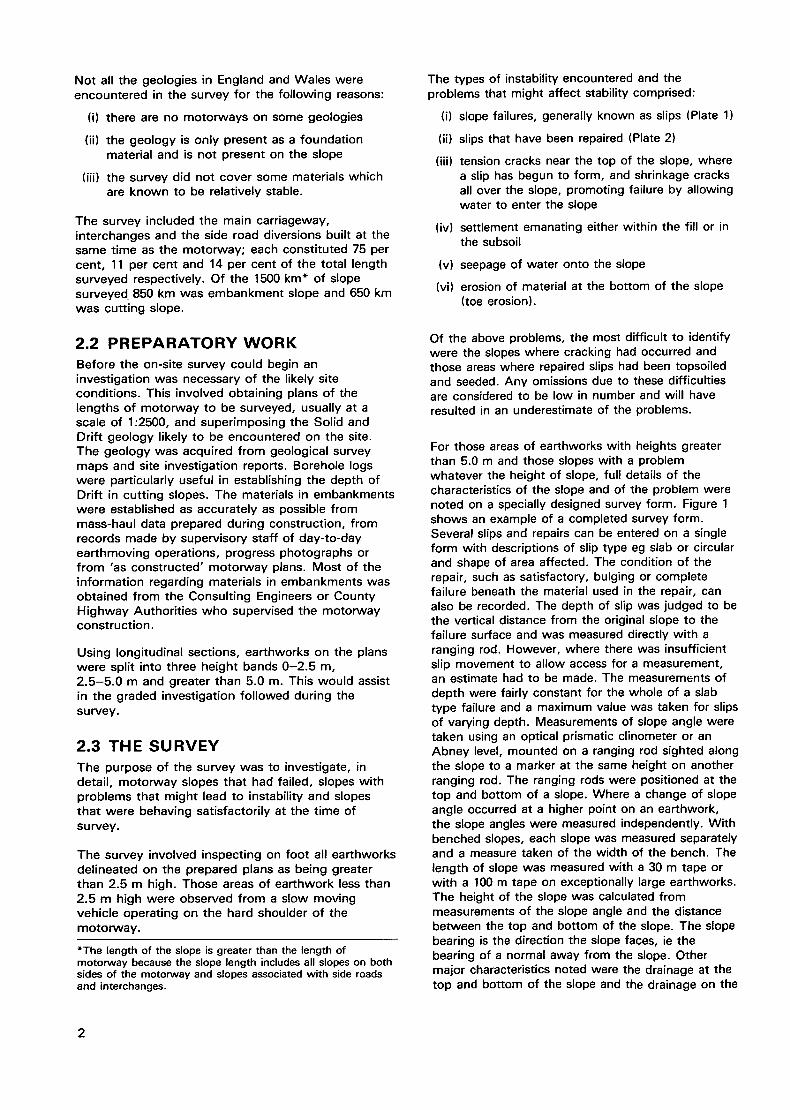
Not all the geologies in England and Wales were encountered in the survey for the fol lowing reasons:
(i) there are no motorways on some geologies
(ii) the geology is only present as a foundat ion material and is not present on the slope
(iii) the survey did not cover some materials which are known to be relatively stable.
The survey included the main carriageway, interchanges and the side road diversions built at the same time as the motorway; each consti tuted 75 per cent, 11 per cent and 14 per cent of the total length surveyed respectively. Of the 1500 kin* of slope surveyed 850 km was embankment slope and 650 km was cutt ing slope.
2.2 P R E P A R A T O R Y W O R K Before the on-site survey could begin an investigation was necessary of the likely site condit ions. This involved obtaining plans of the lengths of motorway to be surveyed, usually at a scale of 1:2500, and superimposing the Solid and Drif t geology likely to be encountered on the site. The geology was acquired from geological survey maps and site investigation reports. Borehole logs were particularly useful in establishing the depth of Drift in cutt ing slopes. The materials in embankments were established as accurately as possible from mass-haul data prepared during construction, from records made by supervisory staff of day-to-day earthmoving operations, progress photographs or f rom 'as constructed' motorway plans. Most of the information regarding materials in embankments was obtained from the Consult ing Engineers or County H ighway Authori t ies who supervised the motorway construct ion.
Using longitudinal sections, earthworks on the plans were split into three height bands 0 -2 .5 m, 2 .5 -5 .0 m and greater than 5.0 m. This would assist in the graded investigation fol lowed during the survey.
2.3 THE S U R V E Y The purpose of the survey was to investigate, in detail, motorway slopes that had failed, slopes with problems that might lead to instability and slopes that were behaving satisfactorily at the time of survey.
The survey involved inspecting on foot all earthworks delineated on the prepared plans as being greater than 2.5 m high. Those areas of earthwork less than 2.5 m high were observed from a slow moving vehicle operating on the hard shoulder of the motorway.
*The length of the slope is greater than the length of motorway because the slope length includes all slopes on both sides of the motorway and slopes associated with side roads and interchanges.
The types of instability encountered and the problems that might affect stability comprised:
(i) slope failures, generally known as slips (Plate 1)
(ii) slips that have been repaired (Plate 2)
(iii) tension cracks near the top of the slope, where a slip has begun to form, and shrinkage cracks all over the slope, promoting failure by allowing water to enter the slope
(iv) settlement emanating either within the fill or in the subsoil
(v) seepage of water onto the slope
(vi) erosion of material at the bottom of the slope (toe erosion).
Of the above problems, the most difficult to identify were the slopes where cracking had occurred and those areas where repaired slips had been topsoiled and seeded. Any omissions due to these difficulties are considered to be low in number and will have resulted in an underestimate of the problems.
For those areas of earthworks with heights greater than 5.0 m and those slopes with a problem whatever the height of slope, full details of the characteristics of the slope and of the problem were noted on a specially designed survey form. Figure 1 shows an example of a completed survey form. Several slips and repairs can be entered on a single form with descriptions of slip type eg slab or circular and shape of area affected. The condition of the repair, such as satisfactory, bulging or complete failure beneath the material used in the repair, can also be recorded. The depth of slip was judged to be the vertical distance from the original slope to the failure surface and was measured directly with a ranging rod. However, where there was insufficient slip movement to allow access for a measurement, an estimate had to be made. The measurements of depth were fairly constant for the whole of a slab type failure and a maximum value was taken for slips of varying depth. Measurements of slope angle were taken using an optical prismatic clinometer or an Abney level, mounted on a ranging rod sighted along the slope to a marker at the same height on another ranging rod. The ranging rods were positioned at the top and bottom of a slope. Where a change of slope angle occurred at a higher point on an earthwork, the slope angles were measured independently. With benched slopes, each slope was measured separately and a measure taken of the width of the bench. The length of slope was measured with a 30 m tape or wi th a 100 m tape on excePtionally large earthworks. The height of the slope was calculated from measurements of the slope angle and the distance between the top and bottom of the slope. The slope bearing is the direction the slope faces, ie the bearing of a normal away from the slope. Other major characteristics noted were the drainage at the top and bottom of the slope and the drainage on the
2

Neg. No. CR309/87~3
Plate 1 A typical slip on an embankment slope
I
: - . ~ } , " < & i " -. , . ~ ~ • ' ~ . • ' ~ , ' L~ .~ ' . , " " .
Neg. No. CR302/87/6
Plate 2 An embankment slope which has been repaired over most of its length
slope itself. A photographic record was also kept of failures and problems of interest.
Generally one survey form would cover the length of slope of a single earthwork unless the earthwork was split by bridges, contract demarcations or retaining walls, when a corresponding number of sheets would be completed.
A description of the soil or rock was made from any exposed material, for example on a failure surface,
and using a simple probe made from 6 mm steel reinforcing rod. The feel of the probe as it was pushed into the slope indicated how granular, cohesive or rocky the material was. A visual inspection could be made from the material adhering to the probe when it was wi thdrawn. As well as being useful for ident i fy ing construct ion materials, the probe could ident i fy repaired areas beneath topsoils. In these cases the contrast in materials detected and the shape of the area in wh ich they were found, were good indications as to when a repair was present.
3

County I Recent weather
I Road I
I . Soil and/or rock description including rock discontinuity information
2. Vegetation type
3. Slip, minor slip and incipient slip descrip.
1 ..~'~ ~ _ . ~ - ~ o _ ~ _ , c./~Q//~/~ye./"//-o ,~,k,~ a~" 0=)~, _
4. Pavement problems ?
5. Water present ?
On failure plane
Saturating soil
As springs
Ponding
8. Description of repair
,m,.o;-. embankment ^~ ~.~+h*
Observed
aff. o. o.~, o-5
1.ch. 12. ch.
3 -S/~I# ~,Z)~.., I 4
i I~. Pro.le cha°ge~
N "o,~"~
Prop. aff. I Location Sound ab. I
I Personnel I J ' P A I~/P
7, Seepage and/or erosion
Prop. aff.
Sound ab.
From geol. survey
n~:~, d ,5~-~
I Sheet
9. Drainage, type and condit ion
10.
1 1. Classify problem
12. Photos
. 7 ~ . o~ 7 o
7~-.a? o
1 2
1 2
Age 011 o/e~lOzJO. 01,~'
Other
i
Slope Chainage Descri ption angle
.2o ~ o:".s~/v~. /
~0,,,~ ~,c Ke.,,,.eo~l iVo. i
., /~- f ,,,,,~ ~ . ~
, /7o, , , ~/,~~,'~..s ;,~..d~o /~_.~,, ~I ,¢e.~,e~',L,.," 1~.,3 I~
-.5/,,~'=, f:_...,~_i.2cis
V/I /~. S,z~, .5 " I (Space o~er,eaf,
B O/P~ ~¢//t_.~ Loc. ~O//
. . 5 o M . . ~ "
Slope Slope Slope length height bearing
-_V/-o 13.~ ,~o
~ .o /#.~ ~o
(* Delete as necessary)
Fig.1 A completed survey form

2.4 PROCESSING THE DATA Information from the completed survey forms and the prepared plans was used to describe the motorways as a series of features. With the aid of an appropriate computer program the length of slope with any given combination of characteristics can be extracted by summing those features with the characteristics required. Interpolation within a feature may be necessary for restrictions on slope angle and height.
The locations of all slope failures, both repaired and unrepaired, were collated and distributed for information to the appropriate Consulting Engineer or County Highway Authority responsible for maintenance operations.
2.5 FACTORS STUDIED IN THE ANALYSIS OF SLOPES
It was considered that the principal factors having an influence on the extent of failures were the geology, the age of the earthworks and their geometry. The effects of these factors have therefore been studied in detail. Also considered to be worthy of study were the type of drainage used (at the bottom of embankment slopes and the top of cutting slopes) and the orientation of the slope.
Geology was the first slope characteristic to be examined and variation in age and geometry was not taken into account at that stage. Initially this Report considers the effect of geology in separate sections, beginning with the youngest material, and later covers the overall problem of failure. Single and combinations of two geologies were studied; higher multiples of geologies were encountered but the proportional effect of each geology was difficult to quantify. Where mixtures of geologies occur in an earthwork, they are considered in the section where the youngest geology appears. Similarly in the tables of results, the youngest geologies appear first (as they would in a geological log of a borehole) and where there is a combination of materials the younger geology governs its position.
Analyses have been made, for given ranges of height and slope angle, of the variation of percentage of failure for geologies on different motorways, or on different lengths of the same motorway, which cover a number of ages. Percentage of failure is defined as the length of failed slope expressed as a percentage of the total length of slope involved. The necessity to compare different ages, each with failures in the same geology, restricts the number for comparison and consequently any trends are limited. Height bands of 0-2.5 m, 2.5-5.0 m and more than 5.0 m were used in this instance.
In order to determine the effect of age on the performance of earthworks for each individual motorway, dates of occurrence of slope failures are
required over a long time-scale. Such information was not readily available from the Authorities responsible for the maintenance of the particular lengths of motorway. An attempt is being made to determine the effect of age on specific lengths of motorway by studying aerial photographs taken in the lifetime of the earthworks and will be published in a later document. Locations are being selected where high percentages of failure have been observed and it is hoped that photographs may have been taken sufficiently frequently to allow the pattern of failures with time to be established.
Although surveyed, failures which occurred during motorway construction have not, for the purposes of analysis, been included in the length of failed slope. The survey was primarily concerned with the performance of slopes since construction.
In general, the slope angles of the earthworks tended to be designed as fairly uniform for any given age, especially for embankments, although sufficient variability occurred in practice to provide some indication of the effect of slope angle on the occurrence of failures. The height bands used in the sections relating to the effect of geometry are in 2.5 m steps.
The effect on the percentage of failure of three types of drainage at the bottom of embankments and the top of cuttings is considered. The drainage in both locations has been categorized as none, where no drainage was seen; open ditch, where a simple steep sided, lined or unlined ditch occurred; and French drain, which appeared as parallel sided, aggregate filled trenches with a pipe at the bottom. Comparisons of the effect of the types of drainage are made and in each case earthworks of the same geology, age and geometry are considered.
A study has been made to find the effect of slope drains on the percentage of failure. This is discussed in the Section on Jurassic and Triassic deposits for embankment slopes and in the Section on Eocene and Cretaceous deposits for cutting slopes. A slope drain appears as an aggregate filled trench running up the slope in a straight line or in a pattern such as herringbone. Slope drains were very rarely seen on embankments and were more commonly seen on cuttings in areas of seepage.
To show the effect of orientation on the percentage of failures, combinations of geology, age and geometry were classified in 90 degree quadrants averaging north, east, south and west facing directions.
From the geometry data, maximum slope angles are derived, for given ranges of heights, which minimize the risk of shallow failures within the maximum life span of the motorways studied. (Data from the survey only apply to a maximum age of 25 years, with many results only being applicable to younger
5
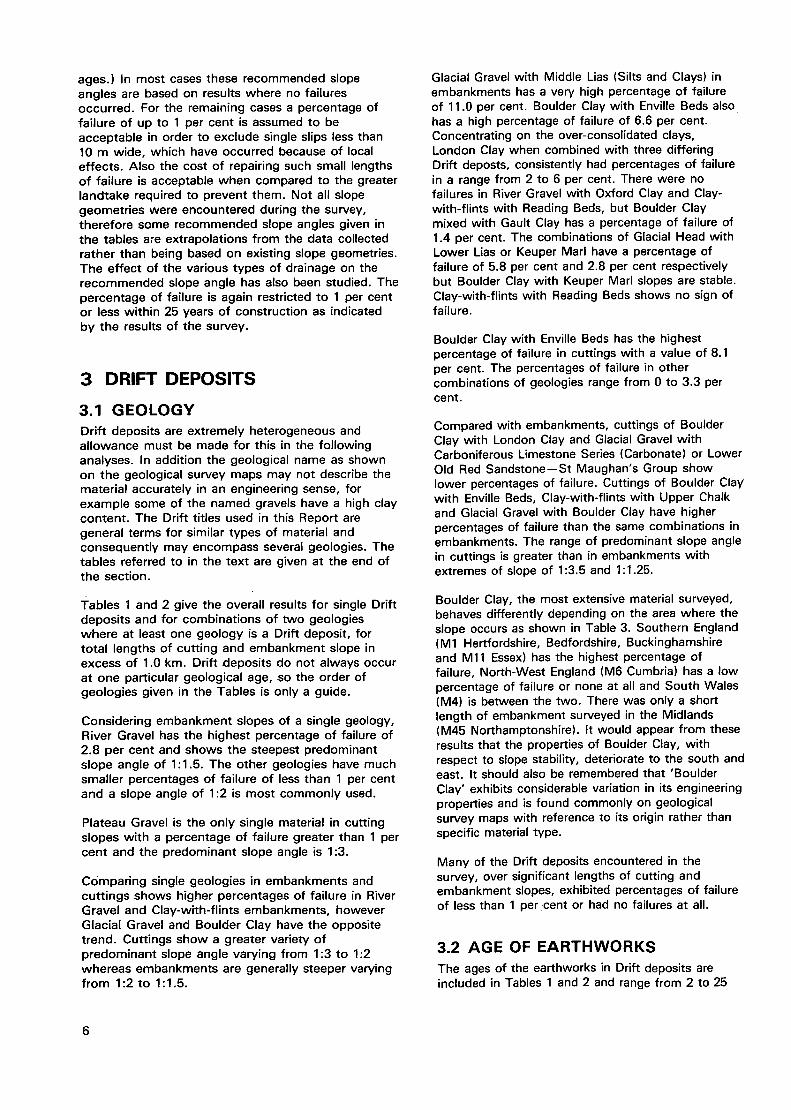
ages.) In most cases these recommended slope angles are based on results where no failures occurred. For the remaining cases a percentage of failure of up to 1 per cent is assumed to be acceptable in order to exclude single slips less than 10 m wide, which have occurred because of local effects. Also the cost of repairing such small lengths of failure is acceptable when compared to the greater landtake required to prevent them. Not all slope geometries were encountered during the survey, therefore some recommended slope angles given in the tables are extrapolations from the data collected rather than being based on existing slope geometries. The effect of the various types of drainage on the recommended slope angle has also been studied. The percentage of failure is again restricted to 1 per cent or less within 25 years of construction as indicated by the results of the survey.
3 DRIFT DEPOSITS
3.1 GEOLOGY Drift deposits are extremely heterogeneous and allowance must be made for this in the following analyses. In addition the geological name as shown on the geological survey maps may not describe the material accurately in an engineering sense, for example some of the named gravels have a high clay content. The Drift titles used in this Report are general terms for similar types of material and consequently may encompass several geologies. The tables referred to in the text are given at the end of the section.
Tables 1 and 2 give the overall results for single Drift deposits and for combinations of two geologies where at least one geology is a Drift deposit, for total lengths of cutting and embankment slope in excess of 1.0 kin. Drift deposits do not always occur at one particular geological age, so the order of geologies given in the Tables is only a guide.
Considering embankment slopes of a single geology, River Gravel has the highest percentage of failure of 2.8 per cent and shows the steepest predominant slope angle of 1:1.5. The other geologies have much smaller percentages of failure of less than 1 per cent and a slope angle of 1:2 is most commonly used.
Plateau Gravel is the only single material in cutting slopes with a percentage of failure greater than 1 per cent and the predominant slope angle is 1:3.
Co'mparing single geologies in embankments and cuttings shows higher percentages of failure in River Gravel and Clay-with-flints embankments, however Glacial Gravel and Boulder Clay have the opposite trend. Cuttings show a greater variety of predominant slope angle varying from 1:3 to 1:2 whereas embankments are generally steeper varying from 1:2 to 1 : 1.5.
Glacial Gravel with Middle Lias (Silts and Clays) in embankments has a very high percentage of failure of 11.0 per cent. Boulder Clay with Enville Beds also has a high percentage of failure of 6.6 per cent. Concentrating on the over-consolidated clays, London Clay when combined with three differing Drift deposts, consistently had percentages of failure in a range from 2 to 6 per cent. There were no failures in River Gravel with Oxford Clay and Clay- with-flints with Reading Beds, but Boulder Clay mixed with Gault Clay has a percentage of failure of 1.4 per cent. The combinations of Glacial Head with Lower Lias or Keuper Marl have a percentage of failure of 5.8 per cent and 2.8 per cent respectively but Boulder Clay with Keuper Marl slopes are stable. Clay-with-flints with Reading Beds shows no sign of failure.
Boulder Clay with Enville Beds has the highest percentage of failure in cuttings with a value of 8.1 per cent. The percentages of failure in other combinations of geologies range from 0 to 3.3 per cent.
Compared with embankments, cuttings of Boulder Clay with London Clay and Glacial Gravel with Carboniferous Limestone Series (Carbonate) or Lower Old Red Sandstone--St Maughan's Group show lower percentages of failure. Cuttings of Boulder Clay with Enville Beds, Clay-with-flints with Upper Chalk and Glacial Gravel with Boulder Clay have higher percentages of failure than the same combinations in embankments. The range of predominant slope angle in cuttings is greater than in embankments with extremes of slope of 1:3.5 and 1:1.25.
Boulder Clay, the most extensive material surveyed, behaves differently depending on the area where the slope occurs as shown in Table 3. Southern England (M1 Hertfordshire, Bedfordshire, Buckinghamshire and M l l Essex) has the highest percentage of failure, North-West England (M6 Cumbria) has a low percentage of failure or none at all and South Wales (M4) is between the two. There was only a short length of embankment surveyed in the Midlands (M45 Northamptonshire). It would appear from these results that the properties of Boulder Clay, with respect to slope stability, deteriorate to the south and east. It should also be remembered that 'Boulder Clay' exhibits considerable variation in its engineering properties and is found commonly on geological survey maps with reference to its origin rather than specific material type.
Many of the Drift deposits encountered in the survey, over significant lengths of cutting and embankment slopes, exhibited percentages of failure of less than 1 per cent or had no failures at all.
3.2 AGE OF EARTHWORKS The ages of the earthworks in Drift deposits are included in Tables 1 and 2 and range from 2 to 25

years. Tables 4 and 5 show the results of an analysis to compare percentages of failure of similar earthworks which cover a number of ages. Failures begin at a variety of ages depending on the geology and the geometry. The general trend in embankments is for the percentage of failed slope to increase with the age of the earthwork, as would be expected, although one of the results for Boulder Clay is inconsistent. Cuttings show a less clear trend with some geometries behaving very erratically. The variability of these results, especially for Boulder Clay, may reflect the heterogeneous nature of the materials. Four out of the seven cases where failure occurred, however, show an increase in the percentage of failure with time.
3.3 GEOMETRY OF SLOPE Results of the effect of geometry on the percentage of failure are given in Figures 2 and 3 for those combinations of geology and age that had a percentage of failure greater than 1 per cent and a total length of slope in excess of 2.5 kin. These Figures illustrate the high percentages of failed slope that have occurred with certain combinations of geology, age and geometry. Boulder Clay with London Clay (6 years old), Plateau Gravel with London Clay (10 years old) and Glacial Head with Lower Lias (13 years old) are Cases where more than 50 per cent of embankment slopes have failed for particular geometries. In cuttings the percentages of failure are generally lower; the highest percentage being Boulder Clay with London Clay (7 years old) which has approximately 25 per cent of slopes failing. It is worth noting again the poor performance of London Clay in combination with more granular materials.
For both embankments and cuttings there is clear evidence that the height of slope has an effect on the percentage of failure. In the majority of cases an increase in height for constant slope angle is accompanied by an increase in the percentage of failure.
The effect of slope angle on embankments and cuttings is not so clear and in some instances flatter or intermediate slope angles have yielded higher percentages of failure. This is most pronounced for embankments of River Gravel (10 years old), River Gravel with London Clay (10 years old), Glacial Head with Lower Lias (13 years old) and Glacial Head with Keuper Marl (23 years old). A similar effect is shown by cuttings of Boulder Clay with London Clay (7 years old) and Clay-with-flints with Upper Chalk (10 years old).
Embankments of Glacial Gravel with Lower Old Red Sandstone--St Maughan's Group show an increase in the percentage of failure with increasing slope angle at two different ages. In cuttings of Clay-with- flints with Upper Chalk, there is a similar behaviour for both the ages studied at the steeper slope angles.
At the flatter slope angles both ages may show a similar trend but a comparison has not been possible as there were no 22 year old slopes, in these materials, encountered in the survey.
3.4 TYPE OF D R A I N A G E For embankments there were no cases where all three types of drainage could be compared. Comparing the cases where two types occurred, in six out of eleven cases distinctly higher percentages of failed slope occurred where no drainage was provided; slopes with open ditches had the smallest percentage of failure in f ive of these six cases. There were two cases where slopes with open ditches had a higher percentage of failure than when drainage was not provided. In the eleven examples studied the ranges of percentages of failure are as fol lows:
None 0-58 per cent French drain 0 -13 per cent Open ditch 0 - 4 per cent
With cutting slopes there were three cases where all three types of drainage occurred and in every case the greatest percentage of failure occurred with no drainage. Where there were two types of drainage to compare, slopes with French drains showed distinctly higher percentages of failure in three cases, two of which were greater than where no drainage was provided, however, in the third case the slopes with no drainage produced the higher percentage of failure. Slopes with open ditches had no failures or a very small amount in the four cases where they occurred. In the seven examples studied the ranges of percentages of failure are,
None 0-35 per cent French drain 0 -13 per cent Open ditch 0 - 5 per cent
These ranges are similar to those for embankments and it would appear that drainage at the bottom of embankment slopes and at the top of cutt ings produces, in the majority of cases, the least percentages of failure for earthworks constructed of Drift material or mixtures of Drift and Solid material. The presence of an open ditch or French drain at the top of cuttings indicates that the need for a cut-off drain was recognized during design and the results show this arrangement performs satisfactorily.
3.5 ORIENTATION OF SLOPE Variations occurred between the percentages of failure of embankment and cutt ing slopes of differing orientations, but there was no consistent pattern of behaviour over the range of geologies studied. No evidence has been obtained to indicate whether or not the climatic influence of orientation has any effect.

3
¢o
10
5
0 25
R iver Gravel
I I I 1:2 1:1¾ 1:1½
10 I River G I Londor | z~ . , Age- '
o 5 F -- ~ ~ ~ ~'A~
iver Gravel with London Clay Age -- 10yrs
20 25
701 Plateau Gravel with • I London Clay I Age -- 10yrs
3s F ~
0L___~ ~ " i
35 (deg.)]_ Slope
(v:h) J angle
30
20 25 30
Height O 0 -- 2.5m • 7.5 -- 10.0m • 2.5 -- 5.0m r'l 10.0 - 12.5m Z~ 5.0 - 7.5m
Boulder Clay with 60 -- London Clay
Age -- 6yrs
30
o ~ ~ I 1S 20
0~
¢o
m
u ==
oJ
O
f
o
f J
f
25 30
6
3 f ~
0 ~ o I o I 15 20 25
Boulder Clay with Gault Clay Age -- 22yrs
30
50 Boulder Clay with , ~ I Enville Beds f
25 IAge -- 19.5yrs f f
o ~ I O 15 '20 25
30 I Glacial Gravel with O i l I LORS- St. Maughan's /J I Group
15 k Age -- 6.5yrs.
O / 501 Glacial Gravel with P --~ I LORS- St. Maughan's / I I Group "~ 20 25 130(deg') t Slope I"- Age 9.5yrs /
I I 25 1:2½ 1:2 1~1¾ (v:h) J angle / /
~= o / . t I 15 20 25 30
0 10
Glacial Gravel wi th Carboniferous Limestone Series -Carbonate
- Age -- 9.5yrs
/ / /
/ / / / /
"5o I I
1:2 1:1%
0 1 20 25 35 (deg.)
slope ! I I I I I angle t 1:2½ 1:1½ (v:h) 1:3½ 1:3 1:2½ 1:2
30
80 I Glacial Head with ~IB t Lower Lias /
4 0 L Age - 13yrs /
30 (deg.)
I 1:1% (v:h)
Slope angle
20 I Glacial Head w i t ~ I Keuper Marl I Age -- 23yrs
0 25 30 35 40(deg.)]
F | I r I (Horizontal and vertical axes vary) 1:1% 1:1½ 1:1¼ (v:h) J
Slope angle
Fig, 2 Rela t ions be tween the percentage of fa i lure of e m b a n k m e n t slopes and g e o m e t r y o f slope

Height
O 0--2.5m [ ] 10.0--12.5m • 2.5--5.0rn I 12.5--15.0m Z~ 5.0-7.5m ~ lS.O-17.5m • 7.5-10.0rn
Plateau Gravel Age -- 10yrs 1!t
15 ¢0
30 / 0 ¢
O 20
I 25
15
I I 1:3½ 1:3
Boulder Clay with London Clay Age -- 7yrs
I 20 25 (deg.)
I I 1:2½ 1:2 (v:h)
Slope angle
10 I Glacial Gravel with I LORS--St Maughan's / Group
5 r Age -- 6.5yrs
/ 0 / A ,.a I
15 ~ ' ~ 20 I
25
10 Clay-with-flints with I Upper Chalk
5 ~Age -- 22yrs
0 / I 15
I 1:3½ 1:3
20
I 1:2½
Slope angle
25
I 1:2
30 (deg.)
I 1:1¾ (v:h)
0J Clay-with-flints with Upper Chalk Age -- 10yrs
B
I I 0---35 25 30 40 (deg.)
I I I I I I I 1:3½ 1:3 1:2½ 1:2 1:1¾ 1:1½ 1:1¼ (v:h)
Slope angle
(Horizontal and vertical axes vary)
Fig. 3 Relations between the percentage of failure of cutting slopes and geometry of slope
3 . 6 D E S I G N O F S I D E S L O P E S I N N E W C O N S T R U C T I O N
Tables 6 and 7 give the results of an analysis of the maximum slope angles allowable to minimize failure in the height ranges of 0-2.5 m, 2.5-5.0 m and greater than 5.0 m. The geologies are given in the same order as Tables 1 and 2 so that comparisons can be made between the maximum recommended slope angle and the actual predominant slope angle. For example embankments of Glacial Gravel with Middle Lias (Silts and Clays) are constructed at a predominant slope angle of 1:2, but a slope angle of 1:3 would reduce the percentage of failure from 11 per cent to less than 1 per cent based on the results of the survey. In the North-West of England, engineers have independently, over the years since construction of the M6 Preston Northern By-Pass, reduced the slope angle used for Boulder Clay cuttings to 1:2.5 (Arrowsmith 1987, personal communication). This slope angle is exactly the same
as the maximum recommended slope angle found in the survey.
The effect of drainage on the maximum recommended slope angles of certain geologies is given in Table 8. This Table shows the types of drainage and geometry that restrict failures to less than 1 per cent within 25 years of construction as indicated by the results of the survey. Steeper slope angles can be used for slopes with open ditches in most of the cases where Drift deposits are present, and French drains also affect two of the remaining geologies. Only River Gravel with London Clay in embankment slopes exhibits a greater percentage of failure when drainage is provided. The results for both this Section and Section 3.4 indicate that open ditches are more effective than French drains at reducing slope failures. Open ditches are also less expensive and simpler to construct than French drains although in the longer term they may require more maintenance.

T A B L E 1
Drift deposits encountered in the survey, with a total length of slope in excess of 1.0 km
Age of earthworks
when surveyed Total length Percentage of (years) (km) failure
Predominant measured slope angle;
all heights (v:h)
E M B A N K M E N T S SINGLE GEOLOGIES
River Gravel Glacial Gravel Boulder Clay
Clay-with-flints
10,19 2.8 2.8 1:1.5 6.5,9.5,22 9.6 0.4 1:2
3,6,7,9.5,16, 49.4 0.3 1:2 17,18,22,23,25
10,22 12.7 0.7 1:2
COMBINATIONS OF TWO GEOLOGIES
River Gravel with London Clay 10 2.8 2.2 1:2 Upper Chalk 10,22 1.7 0 1:2 Lower Chalk 22 2.5 0 1:2 Oxford Clay 22 2.2 0 1:2.5
Plateau Gravel with London Clay 10 4.7 6.0 1:2
Glacial Gravel with Boulder Clay 3,18,22 3.0 0 1:2 Pebbly Clay and Sand 22 1.5 0 1:2.5 Upper Chalk 22 3.1 0.3 1:2 Middle Lias (Silts and Clays) 25 2.1 11.0 1:2 Keuper Marl 23 4.2 0 1:2 Carboniferous Limestone 9.5 4.2 1.4 1:2
Series (Carbonate) Lower Old Red Sandstone 6.5,9.5,20 10.8 2.3 1:2
--St. Maughan's Group Lower Old Red Sandstone 6.5,20 1.4 0 1:2
--Raglan Marl Group Boulder Clay with
Glacial Silt and Varved Clay 18 2.6 0.6 1:2 London Clay 6,7 3.9 4.6 1:3 Upper Chalk 3 6.9 0 1:2 Gault Clay 22 3.3 1.4 1:2.5 Lower Greensand 22 2.2 0 1:2 Keuper Marl 23 2.7 0 1:2 Enville Beds 19.5 3.7 6.6 1:2 Carboniferous Limestone 16,17 10.6 0 1:2
Series (Carbonate) Carbonifer~ous Limestone 16 1.9 0 1:2
Series (Arenaceous) Glacial Head with
Lower Lias 13 1 1.5 5.8 1:2 Keuper Marl 23 3.3 2.8 1:1.5
Clay-with-flints with Reading Beds 10 1.8 0 1:2 Upper Chalk 10,22 22.5 0.1 1:2
10

TABLE 2
Drift deposits encountered in the survey, with a total length of slope in excess of 1.0 km
Age of earthworks
when surveyed Total length Percentage of (years) (km) failure
Predominant measured slope angle;
all heights (v:h)
CUTTINGS
SINGLE GEOLOGIES
River Gravel Plateau Gravel Glacial Gravel
Boulder Clay
Glacial Head Clay-with-flints Pebbly Clay and Sand
10,20,22 4.7 0.2 1:2.5 6,10 2.6 1.1 1:3
3,6.5,7,9.5,20, 36.4 0.6 1:2 22,23,25
2,3,4.5,6,7,9.5, 97.2 0.8 1:2 14,16,17,18,22,
23,25 6,13,23 4.4 0 1:3 10,22 29.4 0.2 1:3
22 1.0 0.5 1:2
COMBINATIONS OF TWO GEOLOGIES
Glacial Gravel with Boulder Clay 3,18,25 Carboniferous Limestone 9.5
Series (Carbonate) Lower Old Red Sandstone
--St. Maughan's Group Boulder Clay with
London Clay 0,6,7 Upper Chalk 3 Lower Greensand 22 Oxford Clay 22 Keuper Conglomerate 2,4.5,9.5 Enville Beds 19.5 Carboniferous Limestone 4.5,9.5,16
Series (Carbonate) Clay-with-flints with
Reading Beds 22 Upper Chalk 9,10,22
2.0 1.7 1:2 4.7 0.1 1:2
6.5,9.5,20 6.9 1.4 1:2
2.6 3.3 1:3.5 3.3 0 1:2 2.9 0 1:2 1.0 0 1:2 1.8 1.5 1:2.5 2.0 8.1 1:2.5 3.1 " 0 1:2
1.1 0 1:3 10.5 2.1 1:1.25
TABLE 3
The percentages of failure of Boulder Clay in different parts of England and Wales with a slope angle of 1:2 and a height greater than 5.0 m
Age of earthworks
when surveyed Total length Percentage of Area (years) (m) failure
EMBANKMENTS Southern England 6,7,22 1418 8.8 South Wales 9.5 546 2.7 North-West England 16,18 1296 0
CUl-FINGS
Southern England 22 1033 18.1 South Wales 9.5 648 11.6 Midlands 25 690 5.5 North-West England 16,17,18 3089 3.9
11
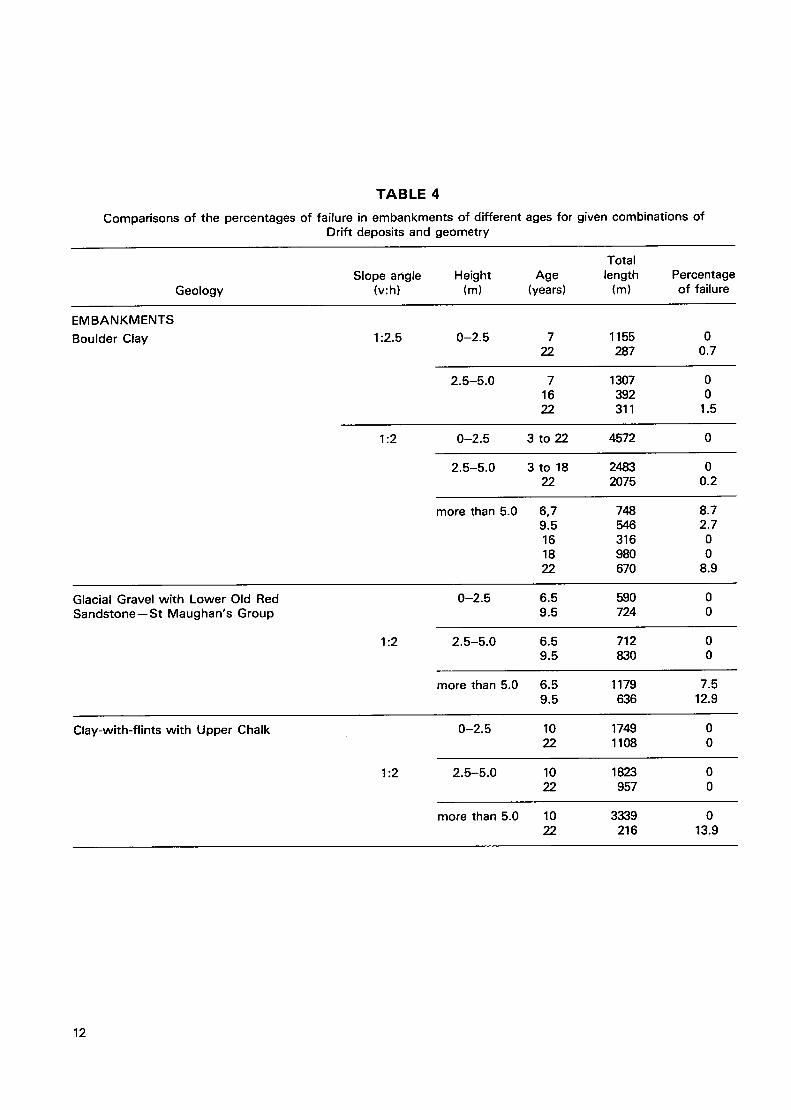
T A B L E 4
Comparisons of the percentages of failure in embankments of different ages for given combinations of Drift deposits and geometry
Total Slope angle Height Age length Percentage
Geology (v:h) (m) (years) (m) of failure
EMBANKMENTS
Boulder Clay 1:2.5 0-2.5 7 1155 0 22 287 0.7
2.5-5.0 7 1307 0 16 392 0 22 311 1.5
1:2 0-2.5 3 to 22 4572 0
2.5-5.0 3 to 18 2483 0 22 2075 0.2
more than 5.0 6,7 749 8.7 9.5 546 2.7 16 316 0 18 980 0 22 670 8.9
Glacial Gravel with Lower Old Red Sandstone--St Maughan's Group
1:2
0-2.5 6.5 590 0 9.5 724 0
2.5-5.0 6.5 712 0 9.5 830 0
more than 5.0 6.5 1179 7.5 9.5 636 12.9
Clay-with-flints with Upper Chalk
1:2
0-2.5 10 1749 0 22 1108 0
2.5-5.0 10 1823 0 22 957 0
more than 5.0 10 3339 0 22 216 13.9
12

TABLE 5
Comparisons of the percentages of failure in cuttings of different ages for given combinations of Drift deposits and geometry
Total Slope angle Height Age length Percentage
Geology (v:h) (m) (years) (m) of failure
CuI - r lNGS
Boulder Clay 1:2.5
1:2
0-2.5 3 to 22 4744 0
2.5-5.0 3 to 18 4142 0 22 204 20.5
more than 5.0 3 1634 2.4 7 2558 0
9.5 502 7.0 16 567 0
0-2.5 3 to 7 746 0 9.5 803 0.2
16 to 23 6665 0 25 898 1.7
2.5-5.0 7 to 17 3291 0 18 1750 1.0 22 2319 3.7 25 463 5.8
more than 5.0 9.5 648 11.6 16 to 17 1064 0
18 2025 5.9 22 1033 18.1 25 690 5.5
Giacial Gravel with Lower Oid Red Sandstone--St Maughan's Group
1:2 0-2.5 6.5 202 0 9.5 472 0
2.5-5.0 6.5 629 0 9.5 274 0
more than 5.0 6.5 1994 2.6 9.5 987 0
Clay-with-flints with Upper Chalk 1:2 2.5-5.0 9 202 0 22 290 1.7
13

T A B L E 6
Maximum slope angles allowable to restrict the percentages of failure to below 1 per cent within 25 years of construction as indicated by the results of ~.he survey
Maximum slope angle (v:h)
Height Drift Deposits 0-2.5 m : 2.5-5.0 m : More than 5.0 m
E M B A N K M E N T S SINGLE GEOLOGIES
River Gravel Glacial Gravel Boulder Clay South
West North-West
Clay-with-flints
COMBINATIONS OF TWO GEOLOGIES
River Gravel with London Clay Upper Chalk Lower Chalk Oxford Clay
Plateau Gravel with London Clay
Glacial Gravel with Boulder Clay Pebbly Clay and Sand Upper Chalk Middle Lias (Silts and Clays) Keuper Marl Carboniferous Limestone Series (Carbonate) Lower Old Red Sandstone--St. Maughan's Group Lower Old Red Sandstone--Raglan Marl Group
Boulder clay with Glacial Silt and Varved Clay London Clay Upper Chalk Gault Clay Lower Greensand Keuper Marl Enville Beds Carboniferous Limestone Series (Carbonate) Carboniferous Limestone Series (Arenaceous)
Glacial Head with Lower Lias Keuper Marl
Clay-with-flints with Reading Beds Upper Chalk
1:1.5 1:1.75 1:1.75" 1:1.75 1:2.5 1:2.5" 1:2 1:3 1:3 1:2 1:2 1:2.5" 1:1.75 1:1.75 1:1.75 1:2 1:3 1:3.5"
1:2 1:3* 1:3* 1:2 1:2 1:2 1:1.75 1:1.75 -- 1:2.5 1:2.5 --
1:2 1:3" 1:3.5"
1:2 1:2 -- 1:2 1:2 -- 1:2 1:2 1:2 1:3" 1:3" 1:3" 1:2 1:2" 1:2" 1:1.75 1:1.75 1:2 1:1.75 1:2 1:3 1:2 -- --
1:2.5" 1:2.5" 1:2.5" 1:2 1:2 1:3 1:1.75 1:1.75 1:1.75 1:2.5 1:3.5" -- 1:2 1:2 -- 1:2 1:2 1:2 1:2 1:3 1:3.5" 1:2 1:2 1:2 1:2 1:2 1:2
1:2 1:3.5 1:3.5 1:1.5 1:2 1:2
1:2 1:2 1:2 1:1.75 1:1.75 1:2.5
* Extrapolated result.
14

T A B L E 7
Maximum slope angles allowable to restrict the percentages of failure to below 1 within 25 years of construction as indicated by the results of the survey
per cent
Maximum slope angle (v:h)
Height Drift Deposits 0-2.5 m : 2.5-5.0 m : More than 5.0 m
CUTTINGS
SINGLE GEOLOGIES
River Gravel Plateau Gravel Glacial Gravel Boulder Clay South
West Midlands North-West
Glacial Head Clay-with-flints
COMBINATIONS OF TWO GEOLOGIES
Glacial Gravel with Carboniferous Limestone Series (Carbonate) Lower Old Red Sandstone--St Maughan's Group
Boulder Clay with London Clay Upper Chalk Lower Greensand Oxford Clay Keuper Conglomerate Enville Beds Carboniferous Limestone Series (Carbonate)
Clay-with-flints with Upper Chalk
1:2.5 1:2.5 1:2.5 1:2.5 1:2.5 1:3.5" 1:1.5 1:1.75 1:2 1:1.75 1:3.5 1:3.5 1:1.75 1:2 1:3" 1:2.5 1:2.5 1:2.5" 1:1.75 1:2 1:2.5 1:2.5 -- -- 1:2.5 1:2.5 1:2.5
1:1.75 1:1.75 1:1.75 1:2 1:2 1:2.5
1:2.5 1:2.5 1:4" 1:2 1:2 1:2 1:2 1:2 1:2 1:2 1:2 -- 1:2 1:2 -- 1:2 1:3 1:3 1:2 1:2 --
1:2 1:3.5 1:3.5"
* Extrapolated result
15

T A B L E 8
Types of drainage and maximum slope angles allowable to restrict the percentages of failure to below 1 per cent within 25 years of construction as indicated by the results of the survey
Maximum slope angle (v:h)
Height Drift deposits Type of drainage 0-2.5 m : 2.5-5.0 m : More than 5.0 m
EM B A N K M ENTS COMBINATIONS OF TWO GEOLOGIES
River Gravel with London Clay
Plateau Gravel with London Clay
Glacial Gravel with Carboniferous Limestone
Series (Carbonate) Lower Old Red Sandstone
- -St Maughan's Group Glacial Head with
Lower Lias Keuper Marl
None
Open ditch
Open ditch
French drain
Open ditch Open ditch
c u ' n ' I N G S
SINGLE GEOLOGIES
Plateau Gravel
1:2 1:2 1:2
1:2 1:2 --
1:1.75 1:1.75 1:1.75
1:1.75 1:2 1:2
1:2 1:2 1:2 1:1.5 1:1.5 1:1.5
French drain 1:2.5 1:2.5 1:3
COMBINATIONS OF TWO GEOLOGIES
Clay-with-flints with Upper Chalk Open ditch 1:1.25 1:1.25
16

4 EOCENE A N D CRETACEOUS DEPOSITS
4.1 GEOLOGY Tables 9 and 10 show the overall results of single Eocene and Cretaceous deposits and combinations of two geologies, provided they are not associated with younger deposits where they will have appeared previously in Section 3. Again only total lengths of slope greater than 1.0 km have been considered. These and other relevant tables are located at the end of this Section.
For embankments, Gault Clay, Reading Beds, Reading Beds with Upper Chalk, London Clay with Reading Beds and London Clay have, in descending order, high percentages of failure ranging from 8.2 to 4.4 per cent. The remaining deposits have percentages of failure of 1.6 per cent or less. Overall 1:2 is the most common and steepest predominant slope angle but slope angles as flat as 1:2.5 and 1:3 do occur.
Gault Clay shows a high percentage of failure of 9;6 per cent in cuttings and a predominant slope angle of 1:2.5. Reading Beds have a percentage of failure of 2.9 per cent and the other geologies have percentages of failure of 1.2 per cent or less. Cutting slopes show a greater variety of predominant slope angle than embankments and vary from 1:3 to 1:1.25.
Cutting slopes of Gault Clay had 1.4 per cent more failure than embankment slopes with the predominant slope angle being 1:2.5 in each case. The slopes of Reading Beds and those of London Clay have a much higher percentage of failure in embankments than in cuttings which may be due to the predominant slope angle, for both geologies, being much steeper in embankments.
There are a number of Eocene and Cretaceous deposits that exhibited percentages of failure of less than 1 per cent or had no failures at all.
4.2 AGE OF EARTHWORKS Tables 9 and 10 show that the ages of earthworks constructed of Eocene and Cretaceous deposits range from 0 to 22 years. The results of an analysis of the effect of age on the percentage of failure is given in Table 11.
There is a clear trend for embankments constructed of London Clay and London Clay with Reading Beds, which shows that slopes of particular geometries on younger earthworks are exhibiting higher percentages of failure than the slopes of older earthworks. A similar trend can be seen in embankments of Oxford Clay in Section 5.2. Variations of soil properties, motorway specifications and construction practices are likely explanations of this behaviour. Cutting
slopes in London Clay and Gault Clay, exhibit higher percentages of failure as the age of earthworks increases.
4.3 GEOMETRY OF SLOPE Figures 4 and 5 show the results of the effect of various combinations of geology, age and geometry on the percentage of failure, for slopes of total length in excess of 2.5 km with a percentage failure greater than 1 per cent.
It was recognized during the survey that Reading Beds contained two extensive soil types, one that was granular and the other cohesive, occurring in two distinct areas. The cohesive beds contained the majority of failures and consequently are analysed in detail.
Total failure has occurred in embankment slopes of Reading Beds (cohesive) which have a slope angle of 1:2 and heights within the range of 12.5 m to 15.0 m. Although embankments within this height range in an over-consolidated clay are uncommon, Reading Beds (cohesive) showed high percentages of failure for all heights above 2.5 m at 1:2. Similarly, Gault Clay (22 years old) has a high percentage of failure of nearly 50 per cent at 1:2.5 and over 25 per cent at 1:2 for heights between 5.0 m and 7.5 m. Greenwood, Holt and Herrick (1985) also report a large number of failures in this material on the A45 trunk road at a slope angle of 1:2. Reading Beds (cohesive), Reading Beds with Upper Chalk, London Clay with Reading Beds (cohesive) and Gault Clay all show a reduction in the percentage of failure with increasing slope angle. (Upper Tunbridge Wells Sand shows a gradual increase and then a reduction in the percentage of failure for one particular height band but the percentages are small.) London Clay, as a single geology, and Weald Clay show the opposite trend.
In cuttings, the two geologies represented show high percentages of failure. Twenty two year old Gault Clay slopes at 1:3 between 5.0 m and 7.5 m high have a percentage of failure in excess of 50 per cent. The 10 year old slopes in Gault Clay show an increase in the percentage of failure with an increase in slope angle while the 22 year old slopes show a maximum percentage of failure at a slope angle of 1:3. It is reasonable to assume that the older Gault Clay slopes would behave similarly to the 10 year old slopes, with the percentage of failure increasing, if slopes with angles steeper than 1:2 had been found.
There is a clear indication, with both embankments and cuttings, that the percentage of failure increases as the height of slope increases.
4.4 TYPE OF DRAINAGE At the bottom of embankment slopes there were seven cases where the effect of all three types of
17

1
W
London Oay Zl Age-- 5y~
o I I 30 35
I I I 1:2 1:1 ~ 1:1½
15 London Clay
(deg,)
(v:h)
I o - - .~ ~ ~ 20 2s 30 (d~g.) 0 Slope 15 | " I I
angle 1 : ½ 1:3 1:2½ 1:2 {v:h)
40 t . o n d o n Clay Age -- lOyrs
20
0 r -
Slope . J I I angle L 1:4 1:3½
• I
1:3
I 2O 25 30 (deg.)
I I I 1:2½ 1:2 1:1% (v:h)
50
P
"6 0
o
Reading Beds (cohesive) Age --lOyn~
\ \
\ z , - - - - - - - A \ \
~ C L ~ 20 25 30 (deg.)
I I I I I I 1:4 1:3½ 1:3 1:2½ 1:2 1:1~ (v:h)
50 Reading Beds with U. Chalk Z~ l Age -- lOy~
25 30 (deg.)
I i I I 1:2~ 1:2 1:1~ 1:1½ (v:h}
Slope . ~ angle I
1:3
40 London Clay with I ( 1 ~ Reading Beds (cohesive)
I o 25 30 (deg.)
t I 1:2½ 1:2 (v:h)
Height O 0 -- 2,5m • 7,5 -- 10.0m • 2.5 - 5.0m I-I 10.0 -- 12.5m Z~ 5.0 - 7.5m • 12.5 - 15.0m
5O i I Gault Clay
25 ~Age - 22y.
/ 0 I
15 20 25 30
/ Weald Clay 10 I - Age - 9vrs /
/ / /
'o[ 20"-----" 25 30
° t . 10
0 O 15
i I 1:3½ 1:3
Reading Beds (cohesive) Age -- 3yrs
I I 20 25 30 (deg.) ]
Slope I I
1:2½ 1:2 (v:h) j angle
Upper Tunbridge Wells Sand Age -- 9yrs / , ~ '
~ 2s
° ~ 40 t 2O
0 20
I I I I 1:3½ 1:3 1:2½ 1:2
Z ~ London Clay with Reading Beds (cohesive)
14yrs A g e -
\
25 30 (deg.) L Slope
I I (v h) J angle 1 :'Z½ 1:2 :
10 (deg.) !" Slope
1:1~ (v:h) .Jangle
(Horizontal and vertical axes vary)
Fig. 4 Rela t ions b e t w e e n the percentage o f fa i lure of e m b a n k m e n t slopes and geometry o f slope
18

Height
O 0-2.5m • 2.5--5.0m L~ 5.0-7.5m • 7.5-10.0m
o
co
~3 O
25
20
15
10
5
0 10
Reading Beds (cohesive) ~ l l _Age -- lOyrs • f ~ /
/
- - o 'o
0~
¢o
-~ o 0 15
Gault Clay Age -- 10yrs
D
I 6 i O 20 25
I I I I 1:3Y2 1:3 1:2'/2 1:2
Slope angle
50
25
0 10
Gault Clay Age -- 22yrs /#Z~
B
30 (deg.) 15 20 25 (deg,)
I I I I I I I 1:1¾ (v:h) 1:5 1:4 1:3Y2 1:3 1:2V2 1:2 (v:h)
Slope angle
(Horizontal and vertical axes vary)
Fig. 5 Relations between the percentage of failure of cutting slopes and geometry of slope
drainage could be compared. The types of drainage associated with the slopes having the highest percentage of failure varied in each case. French drains and no drainage were highest in two cases and open ditches were highest in three cases. Open ditches never occurred at the bottom of slopes with the least percentage of failure. Studying all the cases where more than one type of drainage occurred, twelve out of a total of nineteen cases showed slopes with open ditches as having the highest percentage of failure. French drains accounted for three of the other cases and no drainage for the remaining four. The last two types of drainage each had some cases where the percentage of failure of the slope was greater than for a comparable slope with open ditch. Open ditches occurred with slopes having the least percentage of failure in three cases compared to eight for each of the two other types of drainage. It would appear from these results that open ditches are associated with the majority of slope failures in embankments. The ranges of percentages of failure found are,
French drain 0-46 per cent Open ditch 0-45 per cent None 0-22 per cent
Only five cases for comparison could be made of drainage at the top of cuttings. In the one case where all three types of drainage could be compared, the highest percentage of failure was for slopes with no drainage. These slopes also had a distinctly higher percentage of failure when compared with French drain only. There were three cases in Gault Clay where slopes with open ditches had a distinctly
higher percentage of failure than slopes with no drainage. The ranges of percentages of failure found are,
Open ditch 0-83 per cent None 5.8-37 per cent French drain 0-10 per cent
There are insufficient data for cuttings to describe trends for all the geologies; in Gault Clay, however, there is a higher percentage of failure in slopes associated with open ditches, rather than in slopes with no drainage.
The effect of slope drains on the percentages of failure of cutting slopes in Reading Beds (cohesive) is given in Table 12 for slope angles of 1:3.
These results clearly show that drains on the slope itself can prevent shallow failures from occurring with this type of material. The slopes affected by slope drains accounted for thirty per cent of the cutting slope at 1:3 in Reading beds (cohesive).
4 .5 O R I E N T A T I O N O F S L O P E Reading Beds (cohesive) was the only geology in this Section which showed any distinct trend toward a particular slope orientation having an effect on the percentage of failure. In this material, the majority of slope angle and height combinations with the highest percentages of failure in embankments, and all the highest percentages in cuttings, faced toward the north as shown in Table 13.
19

4.6 DESIGN OF SIDE SLOPES IN NEW C O N S T R U C T I O N
Results of an analysis of the maximum slope angles allowable to minimize failure in the height range of 0-2.5 m, 2.5-5.0 m and greater than 5.0 m are given in Tables 14 and 15. Comparisons can be made, with Tables 9 and 10, between the predominant slope angle and those required for a percentage of failure of less than 1 per cent. The major over-consolidated clays would require flatter slope angles. Gault Clay, for example, in embankments and cuttings, would require a slope angle of 1:5 (for slopes greater than 5.0 m high) in order to reduce percentages of failure, while their current predominant slope angle is 1:2.5 in both cases.
Table 16 shows how the use of particular types of drainage can result in a steepening of the recommended slope angle. Open ditches are associated with most of the highest percentages of failure, as shown in Section 4.4, and so they are not a recommended type of drainage for most of the geologies shown.
For cuttings in Reading Beds (cohesive), the recommended slope angle can be altered by taking into account the slope's orientation (Table 13). On those slopes up to 5.0 m high which face east, south or west, with any type of drainage, the recommended slope angle can be steepened to 1:3.5. For slopes facing south with a French drain at the top, further steepening to a slope angle of 1:3 is possible while still keeping failures to a minimum.
TABLE 9 Eocene and Cretaceous deposits encountered in the survey, with a total length of slope in excess of 1.0 kin.
Age of earthworks Predominant
when surveyed Total length Percentage of measured slope angle; (years) (km) failure all heights (v:h)
E M B A N K M E N T S
EOCENE DEPOSITS
SINGLE GEOLOGIES
London Clay 5,6,10 Reading Beds 3,10
COMBINATIONS OF TWO GEOLOGIES
Bagshot Beds with London Clay 5
London Clay with Reading Beds 10,14
Reading Beds with Upper Chalk 10
CRETACEOUS DEPOSITS
SINGLE GEOLOGIES
Upper Chalk 10,19,22 Middle Chalk 3,22 Lower Chalk 10,22 Gault Clay 9,22 Lower Greensand 22 Weald Clay 9 Folkestone Beds 9 Upper Tunbridge Wells Sand 9
COMBINATIQNS OF TWO GEOLOGIES
Upper Chalk with Lower Chalk 10
Lower Chalk with Upper Greensand 10
Upper Greensand with Gault Clay 10
Weald Clay with Upper Tunbridge Wells Sands 8,9
Folkestone Beds with Sandgate Beds 9
60.9 4.4 1:2 40.7 7.6 1:2
1.6 0 --
10.7 5.0 1:2
4.1 5.9 1:2
11.1 0.1 1:2 5.3 0 1:2 7.7 <0.1 1:2 5.3 8.2 1:2.5 4.1 0.1 1:2.5
12.0 1.6 1:2.5 1.2 0 1:3
14.2 1.0 1:2
3.7 0 1:2
4.3 0 1:2
1.6 0 1:2
4.0 0.4 1:2
1.3 0 1:3
20

TABLE 10
Eocene and Cretaceous deposits encountered in the survey, with a total length of slope in excess of 1.0 kin.
Age of earthworks
when surveyed Total length Percentage of (years) (km) failure
Predominant measured slope angle;
all heights (v:h)
CUTI'INGS
EOCENE DEPOSITS
SINGLE GEOLOGIES
Bagshot Beds 5 1.5 0 London Clay 0,3,5,6,7,10 20.2 0.3 Reading Beds 10 20.0 2.9
CRETACEOUS DEPOSITS
SINGLE GEOLOGIES
Upper Chalk 3,10,14,22 28.4 0 Middle Chalk 3,9,10,22 10.6 0 Lower Chalk 9,10,22 13.8 0.1 Gault Clay 10,22 6.5 9.6 Lower Greensand 10,22 2.7 0 Weald Clay 9 6.1 0 Folkestone Beds 9 1.7 1.2 Upper Tunbridge Wells Sand 9 14.9 0.4
COMBINATIONS OF TWO GEOLOGIES
Lower Chalk with Upper Greensand 10 1.2 0
1:3 1:3
1:2 1:2 1:2 1:2.5 1 : 1.75 1:3 1:1.5 1:2
! :! .25
21

TABLE 11
Comparisons of the percentages of failure in embankments and cuttings of different ages for given Eocene and Cretaceous deposits and geometry
Total Slope angle Height Age length Percentage
Geology (v:h) (m) (years) (m) of failure
EMBANKMENTS London Clay 1:2 0-2.5 5,6 551 0
10 7426 0
2.5-5.0 5,6 625 14.6 10 9499 6.2
more than 5.0 5,6 149 32.2 10 7596 21.6
London Clay with Reading Beds 1:2 0-2.5 10 834 1.8 14 286 0
2.5-5.0 10 713 14.8 14 302 3.3
more than 5.0 10 1008 11.7 14 429 6.2
CU3-1"INGS
London Clay 1:3 0-2.5 0 424 0 10 380 3.2
2.5-5.0 0 390 0 6 533 1.9
10 543 3.2
Gault Clay 1:2.5 0-2.5 10 348 0 22 202 0
2.5-5.0 10 353 3.8 22 299 4.4
TABLE 12
The effect of slope drains on the percentages of failure in cuttings of Reading Beds (cohesive) at
a slope angle of 1:3 (10 years old).
Percentage of failure
Height Slopes without Slopes with (m) drains drains
0-2.5 0 0 2.5-5.0 5 0
more than 5.0 33 0
T A B L E 13
Effect of slope orientation on the percentages of failure of Reading Beds (cohesive) embankment and
cutting slopes (10 years old)
Percentage of failure
Slope angle Height East, (v:h) (m) North South,West
Embankments 1:2.5 0-2.5 8 0 1:2.5 2.5-5.0 41 7 1:2.5 5.0-7.5 60 19 1:2 2.5-5.0 9 15 1:2 5.0-7.5 31 27
Cuttings 1:3.5 2.5-5.0 10 0 1:3 2.5-5.0 14 1 1:3 5.0-7.5 41 10
22
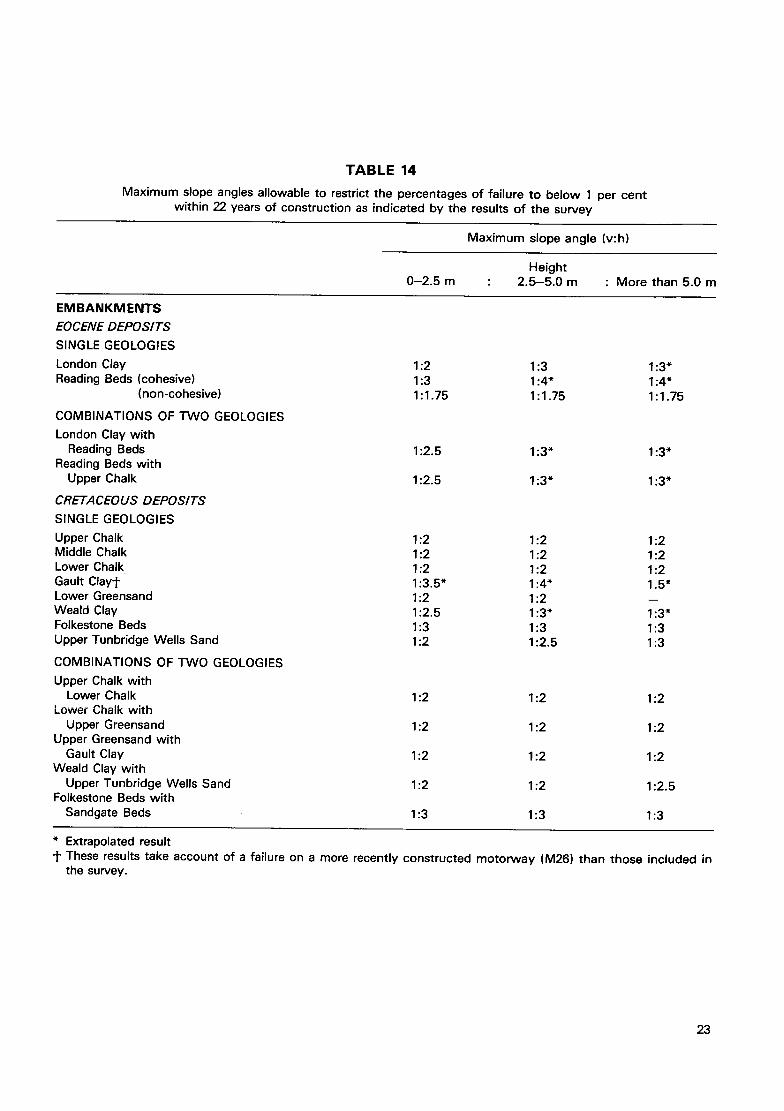
TABLE 14
Maximum slope angles allowable to restrict the percentages of failure to below 1 per cent within 22 years of construction as indicated by the results of the survey
Maximum slope angle (v:h)
Height 0-2.5 m : 2.5-5.0 m : More than 5.0 m
EMBANKMENTS EOCENE DEPOSITS
SINGLE GEOLOGIES
London Clay 1:2 1:3 1:3* Reading Beds (cohesive) 1:3 1:4* 1:4*
(non-cohesive) 1 : 1.75 1 : 1.75 1:1.75
COMBINATIONS OF TWO GEOLOGIES
London Clay with Reading Beds 1:2.5 1:3* 1:3*
Reading Beds with Upper Chalk 1:2.5 1:3* 1:3*
CRETACEOUS DEPOSITS
SINGLE GEOLOGIES
Upper Chalk 1:2 1:2 1:2 Middle Chalk 1:2 1:2 1:2 Lower Chalk 1:2 1:2 1:2 Gault Clayt 1:3.5* 1:4* 1.5* Lower Greensand 1:2 1:2 -- Weald Clay 1:2.5 1:3* 1:3* Folkestone Beds 1:3 1:3 1:3 Upper Tunbridge Wells Sand 1:2 1:2.5 1:3
COMBINATIONS OF TWO GEOLOGIES
Upper Chalk with Lower Chalk 1:2 1:2 1:2
Lower Chalk with Upper Greensand 1:2 1:2 1:2
Upper Greensand with Gault Clay 1:2 1:2 1:2
Weald Clay with Upper Tunbridge Wells Sand 1:2 1:2 1:2.5
Folkestone Beds with Sandgate Beds 1:3 1:3 1:3
* Extrapolated result t These results take account of a failure on a more recently constructed motorway (M26) than those included in
the survey.
23

T A B L E 15
Maximum slope angles allowable to restrict the percentages of failure to below 1 per cent within 22 years of construction as indicated by the results of the survey
Maximum slope angle (v:h)
Height 0 -2 .5 m : 2.5-5.0 m : More than 5.0 m
c u ' n ' I N G S EOCENE DEPOSITS
SINGLE GEOLOGIES London Clay 1:3.5 1:3.5 1:3.5 Reading Beds (cohesive) 1:4* 1:4* 1:4*
(non-cohesive) 1:2.5 1:2.5 1:3
CRETACEOUS DEPOSITS
SINGLE GEOLOGIES Upper Chalk 1 : 1.25 1 : 1.25 1 : 1.25 Middle Chalk 1:1 1:1 1:1 Lower Chalk 1 : 1.5 1:2 1:2 Gault Clay 1:3.5 1:4 1:5* Lower Greensand 1 : 1.75 1:1.75 1 : 1.75 Weald Clay 1:2.5 1:2.5 1:2.5 Upper Tunbridge Wells Sand 1:2 1:2 1:2.5
COMBINATIONS OF TWO GEOLOGIES
Lower Chalk with Upper Greensand 1 : 1.25 1 : 1.25 1 : 1.25
* Extrapolated result
T A B L E 16
Types of drainage and maximum slope angles allowable to restrict the percentages of failure to below 1 per cent within 22 years of construction as indicated by the results of the survey
Maximum slope angle (v:h)
Height Type of drainage 0-2 .5 m : 2.5-5.0 m : More than 5.0 m
E M B A N K M E N T S EOCENE DEPOSITS
SINGLE GEOLOGIES
London Clay None Reading Beds (cohesive) French drain
COMBINATIONS OF TWO GEOLOGIES
London Clay with Reading Beds
CRETACEOUS DEPOSITS
SINGLE GEOLOGIES
Weald Clay Open ditch Upper Tunbridge Wells Sand None
C U ' F r l N G S
EOCENE DEPOSITS
SINGLE GEOLOGIES
Reading Beds (cohesive)
1:2 1:2.5 1:2.5
French drain 1:2 1:2
1:2 1:2.5 1:2.5 1:2 1:2 1:2
French drain 1:3 1:3
24

5 JURASSIC A N D TRIASSIC DEPOSITS
5.1 GEOLOGY The overall results for Jurassic and Triassic deposits, with total lengths of slope greater than 1.0 km, are given in Tables 17 and 18. These and other relevant tables are located at the end of this section. Results for combinations of these geologies with a younger deposit are given earlier in this Report in Sections 3 and 4.
Kimmeridge Clay and Oxford Clay are the geologies with the highest percentages of failure in embankment slopes, with values of 6.1 per cent and 5.7 per cent respectively. Lower Keuper Sandstone slopes have a predominant slope angle of 1:1.5 and a percentage of failure of 4.9 per cent. Of these failures, 62 per cent were failures of the topsoil at its junction with the more rocky material within the fill. It would appear, therefore, that although the rock fill is stable, for most slopes of Lower Keuper Sandstone, the topsoil fails at such steep slope angles. These slips were overgrown at the time of the survey indicating failure at an earlier stage in the motorway's life. Lower Lias and Oxford Clay with Kellaways Beds both have percentages of failure of 3.5 per cent. All other geologies have percentages of failure of 1.2 per cent or less, with some having no failures at all. The commonest predominant slope angle overall is 1:2 with other slope angles ranging from 1:2 up to 1:1.5.
Middle Lias (Silts and Clays) with Lower Lias cutting slopes show a very high percentage of failure of 13.1 per cent. Oxford Clay and Bunter Pebble Beds show percentages of failure of 3.2 and 2.3 per cent respectively. All other geologies have percentages of 1.0 per cent or less. The predominant slope angles for all the cuttings in these geologies range from 1:4 to 1:1.5 with 1:2 being the most frequent.
Oxford Clay and Lower Lias slopes failed in both cuttings and embankments but Oxford Clay with Kellaways Beds failed in embankments only which may reflect the flatter predominant slope angle in cuttings.
5.2 AGE OF EARTHWORKS The ages of the earthworks surveyed in these deposits range from 1 to 25 years. The effect of age on the percentage of failure was analysed and the results are given in Table 19. Oxford Clay embankment slopes show a similar trend to the Eocene deposits in Section 4.2 where the percentage of failure decreases as the age of the earthworks increases. However, Lower Lias over a similar range of ages shows the opposite trend in both embankments and cuttings.
5.3 GEOMETRY OF SLOPE The effect of geometry on the percentage of failure is illustrated in Figures 6 and 7 for Jurassic and Triassic deposits with total lengths of slope in excess of 2.5 km and a percentage of failure greater than 1 per cent. Embankment slopes of Oxford Clay, Kimmeridge Clay and Lower Lias and cutting slopes in Oxford Clay show percentages of failure of 50 per cent or more for certain combinations of geometry. Bunter Pebble Beds and Lower Keuper Sandstone embankment slopes, and Bunter Pebble Beds and Keuper Conglomerate cutting slopes exhibit lower percentages of failure. The results for each height band do not always cover more than one slope angle.
In the 10 year old Oxford Clay embankments there is a strong trend for the percentage of failure to decrease as slope angle increases. However, the 22 year old Oxford Clay embankments, covering the same range of slope angle, show the opposite trend for one height band, the same trend for another and a constant percentage of failure for 2.5-5.0 m. Lower Lias embankments (25 years old) show a similar pattern to that seen with other geologies, where there is an increase in the percentage of failure as the slope angle increases at the lower end of the range, then a reduction occurs at steeper slope angles. Presumably the percentage of failure would have again increased if slopes with steeper angles had been encountered. Kimmeridge Clay shows a reduction in the percentage of failure with an increase in slope angle.
In cuttings the 22 year old Oxford Clay slopes show an increase in the percentage of failure at steeper slope angles.
In both embankment and cutting slopes, there is evidence that as the height of slope increases so does the percentage of failure.
5.4 TYPE OF DRAINAGE There were three cases of embankment slopes where all three types of drainage could be compared. Each case had slopes with one of the three types of drainage associated with the highest percentage of failure. Where two or three types of drainage could be compared, fifteen out of a total of twenty-one cases had slopes with open ditches associated with the highest percentage of failure. In fourteen out of the twenty-one cases, slopes with no drainage had the least percentage of failure. The ranges of percentages of failure are,
Open ditch 0-62 per cent French drain 0-58 per cent None 0-34 per cent
In cuttings, comparing all cases including one where all three types of drainage occurred, slopes with
25

o l c - - - - ~ - - ° - - - " q 20 25 30 a~
c
~. 40 / Oxford Clay "~ . ~ Age -- 22yrs = /
20 / /
-
o - - - - t - - --~- - - .--hi 25 30 20
mmei C ] 0 30
~6 o - - o l
20 25 30 c
40 ~ / Lower Lias ~, , ~ Age -- 13yPs
/ O
2O
[.__ i-- 25 30 (deg.)
Slope I I I , angle 1:21/= 1:2 1:1¾ (v:h)
Height I O 0--2.5m /% 5.0--7.5m • 2.5--5.0m • 7.5--10.0m
O
20 I Lower Keuper Sandstone I
I A g e -- 2 3 y ~
0
A
25 I o
30 35
15 =1 Bunter Pebble Beds /
I A g , - 2 3 y ~
/ /
/
0L_ 25 35 (deg.)
I I I 1:2 1:1¾ 1:1½ (v:h)
__ Slope angle
ofL°werL Age -- 25yrs
25
o r'~ - - - - ~ I b - - - - - - I - - - 0 . , - . ,..=. 10 15 20 25 - 30 (deg.)
I I I I 1 I I 1:5 1:4 1:3½ 1:3 1:2½ 1:2 1:1¾ (v:h)
Slope angle
(Horizontal and vertical axes vary)
Fig. 6 Relations between the percentage of failure of embankment slope and geometry of s l o p e
open ditches had the highest percentage of failure in four out of the total of six cases. Slopes with no drainage had the least percentage of failure in f ive of the cases. The performance of slopes with French drains cannot be ful ly established as there were only two cases for comparison. The ranges of percentages of failure are as fol lows:
Open ditch 6-52 per cent None 0-20 per cent French drain 0 -3 per cent
Open ditches at the bottom of embankment slopes and at the top of cutting slopes appear to be associated wi th most of the highest percentages of failure. The lowest percentages of failure occurred with slopes which had no drainage. In the survey, the area found to have the most slope drains on embankments was the M6 in Staffordshire on slopes of Keuper Marl. These lengths, with slope angles up to 1:1.5 and heights greater than 5.0 m , had no failures of either slopes with drains on them
(which accounted for twenty five per cent of the measured length) or of slopes without drains. Other motorways, with similar slope characteristics and no slope drains only show small percentages of failure, illustrating the good performance of the existing Keuper Marl embankments up to the present time. Based on the results of the survey, slope drains in Keuper Marl embankments, under normal drainage conditions, will prevent only a small number of failures occurring within 23 years of construction. This number of failures is probably too small to warrant the cost of extensive slope drains. Although the evidence for the use of slope drains in Keuper Marl embankments is unfavourable, this certainly does not mean that other materials would not benefit from such drainage facilities. For example, outside the survey area, slope drains installed in an embankment slope of Gault Clay (Johnson, 1985) are currently stable while adjacent untreated slopes are failing; slope drains were also the least expensive of the two preventative measures considered.
26

_= 5
"6 ==
0 ~= 25
"t B 0
5
0
@
,%
25 30
Height O 0--2.5m /k 5.0--7.5m • 2.5--5.0m • 7.5--10.0m
[ ] 10.0--12.5m
Bunter Pebble Beds Age -- 1yr
I I I 30 35 40 45
I I
Bunter Pebble Beds Age -- 19.5¥rs
35 40 45
so f 25
0 15
,0 \
~aw 30
I I 1:2 1:1¾
O
Oxford Clay Age -- 22yrs
20 25 30
20 I Keuper Conglomerate
10 ~Age -- 9.Syrs
/ O _1_ O 0
15 20
I I I 1:3½ 1:3 1:2½
Slope angle
,%
I • I 25 30 (deg.)
I I 1:2 1:1¾ (v:h)
35 40 45
I I I
I Bunter Pebble Beds J i
Age -123yrs
50 (deg.)
1:1'/= 1:11/. 1:1 1:¾ (v:h) Slope angle
(Horizontal and vertical a x e s vary)
Fig. 7 Relations between the percentage of failure of cutting slopes and geometry of slope
5.5 ORIENTATION OF SLOPE Variations occurred between the percentages of failure of embankment and cutting slopes of differing orientation, but there was no consistent pattern over the range of geologies studied.
5.6 DESIGN OF SIDE SLOPES IN NEW CONSTRUCTION
Tables 20 and 21 show the results of an analysis of the maximum slope angles allowable to minimize failure in the height ranges 0 - 2 . 5 m, 2 .5 -5 .0 m and
greater than 5.0 m. Comparisons with the predominant slope angles in Tables 17 and 18 can be made. Oxford Clay, for example in embankments and cuttings, was commonly constructed at a slope angle of 1:2 but a percentage of failure of less than 1 per cent would have been achieved on slopes more than 5.0 m high if, based on the results of the survey, a slope angle of 1:3.5 had been used.
Table 22 shows how the recommended slope angle for Oxford Clay enbankments and Bunter Pebble Beds cuttings can be steepened if a particular type of drainage is used.
2 7

T A B L E 17
Jurassic and Triassic deposits encountered in the survey, with a total length of slope in excess of 1.0 km
Age of Predominant earthworks Total Percentage measured slope angle;
when surveyed length of all heights (years) (km) failure (v:h)
E M B A N K M E N T S JURASSIC DEPOSITS
SINGLE GEOLOGIES
Kimmeridge Clay 10 Coral Rag 10 Oxford Clay 10,22 Great Oolite Clay 10 Acton Turville Beds 10 Middle Lias (Silts and Clays) 25 Lower Lias 4.5,13,25
COMBINATIONS OF TWO GEOLOGIES
Kimmeridge Clay with Coral Rag 10
Oxford Clay with Kellaways Beds 10
Kellaways Beds with Cornbrash 10
Cornbrash with Great Oolite Clay 10
TRIASSIC DEPOSITS
SINGLE GEOLOGIES
Keuper Marl Lower Keuper Sandstone Bunter Pebble Beds
COMBINATIONS OF TWO GEOLOGIES
Keuper Marl with Lower Keuper Sandstone Bunter Pebble Beds Lower Old Red Sandstone
- -St Maughan's Group Lower Keuper Sandstone with
Bunter Pebble Beds Bunter Pebble Beds with
Keele Beds
16.7 6.1 1:2 3.6 0 1:2
33.8 5.7 1:2 7.5 0 1:1.75 1.1 0 1:2 2.8 0 1:2
34.1 3.5 1:2
1.1 0 1:1.75
1.6 3.5 1:1.75
7.9 0.9 1:1.75
1.1 0 1:1.5
10,20,23 29.6 <0.1 1:1.5 10,23 4.0 4.9 1:1.5
19.5,23 6.5 1.2 1:2
23 1.9 0.8 1:1.5 23 1.3 0 1:2
5,20 1.8 0 1:2
23 1.4 0 1:2
23 3.1 0 1:2
28

T A B L E 18
Jurassic and Triassic deposits encountered in the survey, with a total length of slope in excess of 1.0 km
Age of Predominant earthworks Total Percentage measured slope angle;
when surveyed length of all heights (years) (km) failure (v:h)
cu 'n ' INGS
JURASSIC DEPOSITS
SINGLE GEOLOGIES
Kimmeridge Clay 10 4.5 0 -- Coral Rag 10 2.4 0 1:2.5 Oxford Clay 10,22 14.6 3.2 1:2 Kellaways Beds 10 6.1 0 1:4 Cornbrash 10 3.8 O 1 : 1.5 Great Oolite Clay 10 9.0 0 -- Acton Turville Beds 10 2.0 0 -- Great Oolite Limestone 10 2.4 0 -- Middle Lias (Marlstone Rock) 25 2.5 0 1:2 Middle Lias (Silts and Clays) 25 6.5 0.6 1:2 Lower Lias 4,5,13,25 41.0 0.4 1:3
COMBINATIONS OF TWO GEOLOGIES
Oxford Clay with Kellaways Beds 10 1.1 0 1:3
Kellaways Beds with Cornbrash 10 1.9 0 1:2
Middle Lias (Silts and Clays) with Lower Lias 25 1.7 13.1 1:2
TRIASSIC DEPOSITS
SINGLE GEOLOGIES
Rhaetic Keuper Marl Keuper Conglomerate Lower Keuper Sandstone Bunter Pebble Beds
4.5 4.5 <0.1 1:2 4.5,5,10,20,23 35.6 0.2 1:2
2,4.5,9.5,20 3.0 1.0 1:2 10,23 5.3 0 1 : 1.5
1,19.5,23 10.6 2.3 1:2
29

T A B L E 19
Comparisons of the percentages of failure in embankments and cuttings of different ages for given Jurassic and Triassic deposits and geometry
Total Percentage Slope angle Height Age length of
Geology (v:h) (m) (years) (m) failure
E M B A N K M E N T S Oxford Clay 1:2 0-2.5 10 3567 2.0
22 1417 1.8
2.5-5.0 10 1191 23.0 22 1500 7.1
more than 5.0 10 512 41.4 22 1263 36.3
Lower Lias 1:2 0-2.5 13 3672 0 25 654 5.5
2.5-5.0 13 2402 1.7 25 694 12.6
more than 5.0 13 1726 10 25 293 32.6
CUTTINGS
Lower Lias 1:2 0-2.5 4.5 443 0 25 679 6.4
2.5-5.0 4.5 529 0 25 894 1.4
30

T A B L E 20
Maximum slope angles allowable to restrict the percentages of failure to below 1 per cent within 25 years of construction as indicated by the results of the survey
Maximum slope angle (v:h)
Height 0-2.5 m : 2.5-5.0 m : More than 5.0 m
EMBANKMENTS JURASSIC DEPOSITS
SINGLE GEOLOGIES
Kimmeridge Clay 1:2.5 1:3.5* 1:3.5* Coral Rag 1:2 -- _ Oxford Clay 1:3* 1:3.5* 1:3.5* Great Oolite Clay 1:1.75 1 : 1.75 1:1.75 Acton Turville Beds 1:2 1:2 1:2 Middle Lias (Silts and Clays) 1:2 1:2 1:2 Lower Lias 1:5 1:5* 1:5*
COMBINATIONS OF TWO GEOLOGIES
Kimmeridge Clay with Coral Rag 1:1.75 1:1.75 --
Kellaways Beds with Cornbrash 1:2 1:2.5 1:3*
TRIASSIC DEPOSITS
SINGLE GEOLOGIES
Keuper Marl 1:1.5 Lower Keuper Sandstone 1:2" Bunter Pebble Beds 1:1.75
COMBINATIONS OF TWO GEOLOGIES
Keuper Marl with Lower Keuper Sandstone 1:1.5 Bunter Pebble Beds 1:2
Bunter Pebble Beds with Keele Beds 1:2
1:1.5 1:1.75" 1:2* 1:2* 1:1.75 1:1.75
1:1.75* 1:2*
1:2 1:2
* Extrapolated result
31

T A B L E 21
Maximum slope angles allowable to restrict the percentages of failure to below 1 per cent within 25 years of construction as indicated by the results of the survey
Maximum slope angle (v:h)
Height 0-2.5 m : 2.5-5.0 m : More than 5.0 m
CUl- I ' INGS
JURASSIC DEPOSITS
SINGLE GEOLOGIES
Coral Rag 1 : 1.25 1:1.25 -- Oxford Clay 1:2.5 1:3 1:3.5* Kellaways Beds 1:2 1:3 1:3.5 Cornbrash 1 : 1.5 1:1.5 -- Middle Lias
(Marlstone Rock) 1:2 1:2 1:2 Middle Lias
(Silts and Clays) 1:2 1:2 .5* 1:2 .5" Lower Lias 1:4 1:5" 1:5*
COMBINATIONS OF TWO GEOLOGIES
Oxford Clay with Kellaways Beds 1:3 1:3 --
Kellaways Beds with Cornbrash 1:2 1:2 1:2
Middle Lias (Silts and Clays) with Lower Lias 1:2 1:2.5 1:2.5
TRIASSIC DEPOSITS
SINGLE GEOLOGIES
Rhaetic Keuper Marl Keuper Conglomerate Lower Keuper Sandstone Bunter Pebble Beds
1:1.5 1:1.5 1:1.5 1:1.5 1:1.75 1:1.75 1:1 - - - - 1 :1 .25 1:1.25 1:1.5 1:2 1:2 1:2.5
* Extrapolated result.
T A B L E 2 2
Types of drainage and maximum slope angles allowable to restrict the percentages of failure to below 1 per cent within 25 years of construction as indicated by the results of the survey
Maximum slope angle (v:h)
Height Type of drainage 0-2.5 m : 2.5-5.0 m : More than 5.0 m
E M B A N K M E N T S
JURASSIC DEPOSITS
SINGLE GEOLOGIES
Oxford Clay
CU'I-r lNGS
TRIASSIC DEPOSITS
SINGLE GEOLOGIES
Bunter Pebble Beds
French drain 1:2 1:2
None 1:2 1:2 1:2
32
6 CARBONIFEROUS A N D OLD RED SANDSTONE DEPOSITS
6.1 GEOLOGY Tables 23 and 24 show the overall results for single geologies and combinations of two geologies for Carboniferous and Old Red Sandstone deposits with total lengths of slope greater than 1.0 km. These and other relevant tables are located at the end of this Section. Where these deposits are combined with younger materials they appear earlier in Sections 3, 4 and 5 of this Report. The Coal Measures and Millstone Grit Series are divided into argillaceous and arenaceous lithologies, using information from geological survey maps and observations made during the survey. These divisions were necessary as the stability of each lithology varied.
There is no percentage of failure greater than 0.8 per cent for embankments constructed from these geologies and the failures that do occur are in geologies with some argillaceous material present. These failures appear to be a result of weathering of the shale or mudstone at the surface of the fill beneath the topsoil. The predominant slope angle in all cases is 1:2.
Cutting slopes of Enville Beds have 5.8 per cent failure; other materials have 1.7 per cent or less and some have none at all. Cutting slopes of Carboniferous Limestone Series (Carbonate) have 1.1 per cent failure. This is due to failure of the soil which infills cavities within the limestone as explained in more detail in Section 7.1. The commonest predominant slope angle is 1:2 with a range from 1:2.5 to 1:1.25.
A meaningful comparison cannot be made between the performance of Enville Beds in cuttings and its performance in embankments. Although 3.3 km of cutting slope were surveyed in this material, there was only a total length of 75 m of embankment slope which is not considered sufficient to be representative.
6.2 AGE OF EARTHWORKS Tables 23 and 24 show that the ages of earthworks studied range from 4.5 to 23 years. An analysis of the effect of age on the percentage of failure is shown in Table 25. Embankment slopes and cutting slopes show a similar trend, with higher percentages of failure occurring on the older motorways. There is one exception to this trend in Lower Old Red Sandstone--St. Maughan's Group, where 5 year old slopes with a geometry of 1:2 slope angle and a height of more than 5.0 m show a higher percentage of failure than slopes of 6.5 years, 9.5 years and 20 years of age at the same geometry. This erratic behaviour may reflect the differences in the proportions of strong and weak rock that occur in this formation.
6.3 GEOMETRY OF SLOPE As shown in Table 23, no lengths of embankment slope were found, in these materials, wi th a
• percentage of failure greater than 1 per cent. The geometry of these slopes has proven to be suff icient to prevent most failures from occurring. Consequently an analysis of the effect of geometry on the percentage of failure, for these lengths of embankment slope, is not possible.
Figure 8 shows the results of the effect of geometry on the percentages of failure for cutt ing slopes. Only geologies wi th a total length of slope greater than 2.5 km and a percentage of failure greater than 1 per cent were considered. Enville Beds have a trend of increasing percentage of failure with increasing slope angle for two bands of height, and Raglan Marl Group (6.5 years old) shows the same trend for one band of height. St. Maughan's Group (5.0 years old) has one band of height wi th increasing percentage of failure, and another wi th decreasing percentage, as the slope angle is steepened.
In most cases the percentage of failure increases as the height of slope increases.
6.4 TYPE OF DRAINAGE A N D ORIENTATION OF SLOPE
The design and maintenance of the types of drainage used, as well as the geometry, may be further reasons for the lack of failure in most of these geologies. Also, the orientation of the slopes has not been responsible for failures. The slips that have occurred are in cutt ings of Enville Beds and Lower Old Red Sandstone where nearly 16 km of slopes were surveyed. In these materials there are insufficient data from which to draw any conclusions about the effect of drainage or orientation on slope failures.
6.5 DESIGN OF SIDE SLOPES IN NEW CONSTRUCTION
Tables 26 and 27 show the results of an analysis of the maximum slope angles allowable to minimize failure in the height ranges of 0 -2 .5 m, 2 .5-5.0 m and greater than 5.0 m. Comparisons can be made, with Tables 23 and 24, between the predominant slope angles and those required for percentages of failure of less than 1 per cent. In embankments, for a large number of geologies, the predominant slope angle is the same as the maximum allowable to minimize failures on slopes more than 5.0 m high. This indicates that, for these materials, the original design has proved to be correct for the majority of slopes and conservative for the shorter lengths of slope at a f latter slope angle than the predominant. The exceptions which would require flatter slope angles are Middle Coal Measures (Argillaceous), Middle Coal Measures (Argil laceous wi th Arenaceous) and Lower Coal Measures (Argil laceous with
33

Height
O 0--2.5m I-I 10.0--12.5m • 2.5--5.0m • 12.5m--15.0m Z~ 5.0--7.5m X 15.o-17.5m • 7 .5 -10 .o
20 j Enville Beds J Age -- 19.5yrs
= 0 ~ I -~ __ 15 20 25
E
10 1 Lower Old Red Sandstone -- J ] Raglan Marl Group J
O | [ 0 25 (eg . ) 15 20
I I I I 1:3'/2 1:3 1:2'2 1:2 (v:h)
Slope angle
m
"~ 10 I Lower Old Red Sandstone -- J "5 J Raglan Marl Group
1 J A g e - - 2 0 y r s ~ 5
r .~ 20 25 30 (deg.) o I I I I
(v:h) 1:2V2 1:2 1:1¾ 1:1V.~ Slope angle
(Horizontal and vertical axes vary)
oJ
"5
== u
40
20
15
Lower Old Red Sandston=-- St Maughan's Group Age -- 5yrs
I O 2O
P /
/
i ~" "-~1 25
O
10 J ower Old Red Sandstone
St Maughan's Group
5 I Age -- 6.5yrs I
0 15 20
w 25 30
10 j Lower Old Red Sandstone- St Maughan's Group • Age -- 9.5yrs
I j E 15 20 5
I 3O
u it°werOeS-- • St Maughan's Group Age -- 20yrs
15 20 25 , , i ~30
I I I I I 1:3'/2 1:3 1:2V2 1:2 1:1¾
Slope angle
(deg.) I
1 :lY~ (v:h)
Fig. 8 Relations between the percentage of failure of cutting slopes and geometry of slope
Arenaceous). The only geology which is stable at a steeper slope angle than the predominant is Millstone Grit Series (Argillaceous with Arenaceous). For cuttings, there is some evidence that for certain geologies a steeper slope angle than the predominant
one would still produce a percentage of failure of less than 1 per cent. Some geologies, particularly Enville Beds, show percentages of failure in excess of 1 per cent and would require flatter slope angles to reduce the amount of failure.
34

T A B L E 23
Carboniferous and Old Red Sandstone deposits encountered in the survey, with a total length of slope in excess of 1.0 km
Age of Predominant earthworks Total Percentage measured slope angle;
when surveyed length of all heights (years) (km) failure (v:h)
EMBANKMENTS CARBONIFEROUS DEPOSITS
SINGLE GEOLOGIES
Middle Coal Measures (Argillaceous) 14,15
Lower Coal Measures (Argillaceous) 13
Lower Coal Measures (Arenaceous) 13
Millstone Grit Series (Argillaceous) 4.5,15
Millstone Grit Series (Arenaceous) 4.5,15
Carboniferous Limestone Series (Carbonate) 9.5
COMBINATIONS OF TWO GEOLOGIES
Upper Coal Meas (Arg) with Upper Coal Meas (Aren) 15
Middle Coal Meas (Arg) with Middle Coal Meas (Aren) 14,15
Lower Coal Meas (Arg) with Lower Coal Meas (Aren) 4.5,13,14
Mill Grit Series (Arg) with Mill Grit Series (Aren) 4.5,15
OLD RED SANDSTONE DEPOSITS
SINGLE GEOLOGIES
Lower Old Red Sandstone --St Maughan's Group
COMBINATIONS OF TWO GEOLOGIES
Lower Old Red Sandstone --Brownstone Group with
Lower Old Red Sandstone --St Maughan's Group
12.8 0.5 1:2
9.3 0.3 1:2
1.6 0 1:2
8.9 <0.1 1:2
1.8 0 1:2
10.3 0 1:2
2.0 0 1:2
38.5 0.8 1:2
24.8 0.8 1:2
20.1 0 1:2
5,9.5,20 6.4 0 1:2
6.5 2.5 0 1:2
35

TABLE 24
Carboniferous and Old Red Sandstone deposits encountered in the survey, with a total length of slope in excess of 1.0 km
Age of Predominant earthworks Total Percentage measured slope angle;
when surveyed length of all heights (years) (km) failure (v:h)
Cu l - r lNGS CARBONIFEROUS DEPOSITS
SINGLE GEOLOGIES
Enville Beds 19.5 Keele Beds 19.5,23 Upper Coal Measures
(Argillaceous) 15 Upper Coal Measures
(Arenaceous) 15 Middle Coal Measures
(Argillaceous) 14,15 Middle Coal Measures
(Arenaceous) 14,15 Lower Coal Measures
(Argillaceous) 4.5,13,14 Lower Coal Measures
(Arenaceous) 4.5,13 Millstone Grit Series
(Argillaceous) 4.5,15 Millstone Grit Series
(Arenaceous) 4.5,13,15 Carboniferous Limestone
Series (Carbonate) 4.5,9.5,16,17
COMBINATIONS OF TWO GEOLOGIES
Upper Coal Meas (Arg) with Upper Coal Meas (Aren) 15
Middle Coal Meas (Arg) with Middle Coal Meas (Aren) 14,15
Lower Coal Meas (Arg) with Lower Coal Meas (Aren) 13,14
Mill Grit Series (Arg) with Mill Grit Series (Aren) 4.5,15
OLD RED SANDSTONE DEPOSITS
SINGLE GEOLOGIES
Upper Old Red Sandstone Lower Old Red Sandstone
--St. Maughan's Group Lower Old Red Sandstone
--Raglan Marl Group
3.3 5.8 1:2.5 2.6 0 1:1.75
1.1 0 1:2
4.4 0 1:2
22.2 0.9 1:2
3.5 0.7 1:2
11.6 0.3 1:2
1.8 0 1:2
3.8 0.3 1:2
13.4 0.1 1:1.25
6.7 1.1 1:2
1.1 0 1:2
23.3 0.4 1:2
21.0 0.4 1:2
13.9 <0.1 1:1.75
9.5,20 3.7 0.5 1:2
5,6.5,9.5,20 9.7 1.7 1:2
6.5,7,20 2.9 1.5 1:2
36
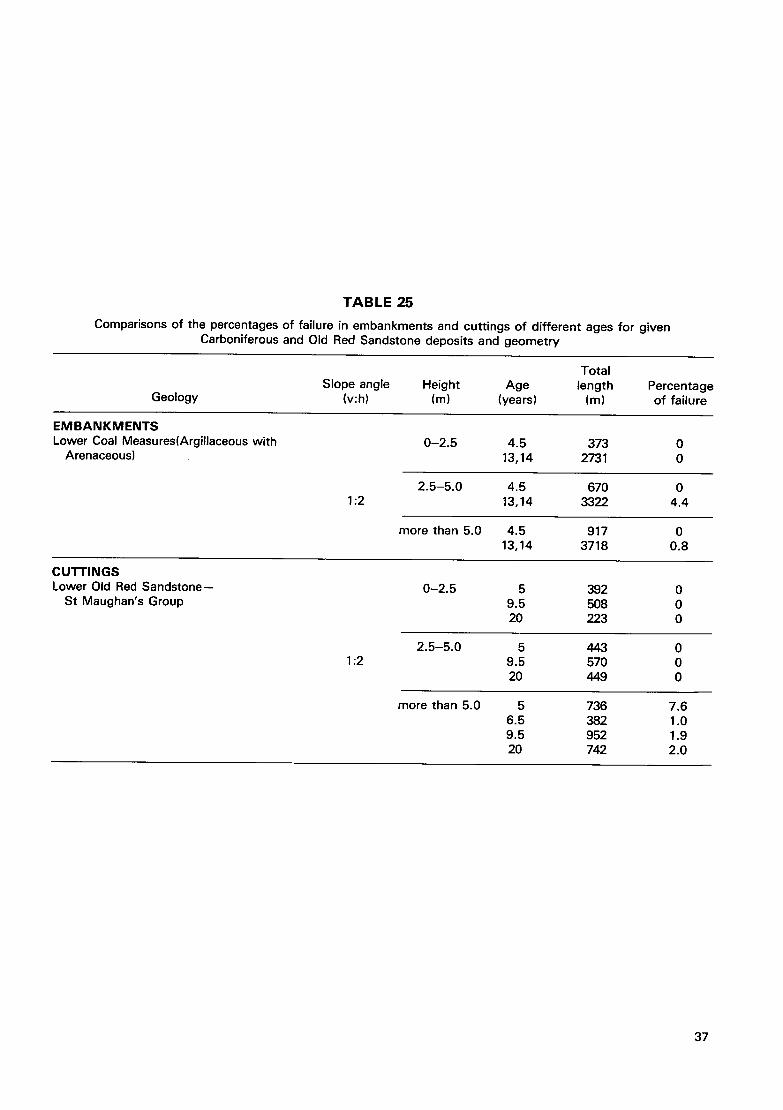
T A B L E 25
Comparisons of the percentages of failure in embankments and cuttings of different ages for given Carboniferous and Old Red Sandstone deposits and geometry
Total Slope angle Height Age length Percentage
Geology (v:h) (m) (years) (m) of failure
EMBANKMENTS Lower Coal Measures(Argillaceous with
Arenaceous) 0-2.5 4.5 373 0
13,14 2731 0
2.5-5.0 4.5 670 0 1:2 13,14 3322 4.4
more than 5.0 4.5 917 0 13,14 3718 0.8
C UlI-I'INGS Lower Old Red Sandstone--
St Maughan's Group
1:2
0-2.5 5 392 0 9.5 508 0 20 223 0
2.5-5.0 5 443 0 9.5 570 0 20 449 0
more than 5.0 5 736 7.6 6.5 382 1.0 9.5 952 1.9 20 742 2.0
37

T A B L E 26
Maximum slope angles allowable to restrict the percentages of failure to below 1 per cent within 23 years of construction as indicated by the results of the survey
Maximum slope angle (v:h)
Height 0-2.5 m : 2.5-5.0 m : More than 5.0 m
EM BANKM ENTS CARBONIFEROUS DEPOSITS
SINGLE GEOLOGIES
Middle Coal Measures (Argillaceous)
Lower Coal Measures (Argillaceous)
Lower Coal Measures (Arenaceous)
Millstone Grit Series (Argillaceous)
Millstone Grit Series (Arenaceous)
Carboniferous Limestone Series (Carbonate)
COMBINATIONS OF TWO GEOLOGIES
Upper Coal Meas (Arg) with Upper Coal Meas (Aren)
Middle Coal Meas (Arg) with Middle Coal Meas (Aren)
Lower Coal Meas (Arg) with Lower Coal Meas (Aren)
Mill Grit Series (Arg) with Mill Grit Series (Aren)
OLD RED SANDSTONE DEPOSITS
SINGLE GEOLOGIES
Lower Old Red Sandstone --St . Maughan's Group
COMBINATIONS OF TWO GEOLOGIES
Lower Old Red Sandstone --Brownstone Group with
Lower Old Red Sandstone - -St . Maughan's Group
1:2.5 1:3" 1:3"
1:1.75 1:2 1:2
1:2 1:2 1:2
1:2 1:2 1:2
1:2 1:2 1:2
1:2 1:2 1:2
1:2 1:2 1:2
1:2 1:2.5 1:3
1:2 1:2.5 1:2.5
1:1.5 1:1.75 1:1.75
1:2 1:2 1:2
1:1.5 1:1.75 1:2
* Extrapolated result.
38

T A B L E 27
Maximum slope angles allowable to restrict the percentages of failure to below 1 per cent within 23 years of construction as indicated by the results of the survey
Maximum slope angle (v:h)
Height 0-2.5 m : 2.5-5.0 m : More than 5.0
CUTTINGS CARBONIFEROUS DEPOSITS
SINGLE GEOLOGIES
Enville Beds Keele Beds Upper Coal Measures
(Argillaceous) Upper Coal Measures
(Arenaceous) Middle Coal Measures
(Argillaceous) Middle Coal Measures
(Arenaceous) Lower Coal Measures
(Argillaceous) Millstone Grit Series
(Argillaceous) Millstone Grit Series
(Arenaceous) Carboniferous Limestone
Series (Carbonate)
COMBINATIONS OF TWO GEOLOGIES
Upper Coal Meas (Arg) with Upper Coal Meas (Aren)
Middle Coal Meas (Arg) with Middle Coal Meas (Aren)
Lower Coal Meas (Arg) with Lower Coal Meas (Aren)
Mill Grit Series (Arg) with Mill Grit Series (Aren)
OLD RED SANDSTONE DEPOSITS
SINGLE GEOLOGIES
Upper Old Red Sandstone Lower Old Red Sandstone
--St. Maughan's Group Lower Old Red Sandstone
--Raglan Marl Group
1:2 1:2.5 1:3 1:1.75 1:1.75 1:1.75
1:2 1:2 1:2
1:2 1:2 1:2
1:2.5 1:3 1:3.5
1:2 1:2 1:2.5
1:2 1:2 1:2
1:1.75 1:1.75 1:1.75
1:1.5 1:1.5 1:1.75
1:1 1:1.25 1:1.25
1:2 1:2 1:2
1:2 1:2.5 1:2.5
1:1.75 1:2 1:2.5
1:1 1:1 1:1
1:1.75 1:2 1:2
1:1.75 1:2 1:2.5
1:2 1:2.5 1:2.5*
* Extrapolated result.
39

7. GENERAL RESULTS FOR ALL THE M O T O R W A Y S SURVEYED
7.1 DESCRIPTION OF SLOPE FAILURES The survey has revealed a significant incidence of slope failures in side slopes of both cuttings and embankments. In the 570 km of motorway surveyed, accumulated lengths of over 17 km of embankment slope and over 5.5 km of cutting slope have failed. The type of slope failure observed varied from distinct slab type to shallow circular type but with most slips having a combination of translational and circular movement. The vertical depth of the failure surface beneath the slope rarely exceeded 1.5 m with a minimum depth of 0.2 m and a maximum depth of 2.5 m (Table 28).
T A B L E 28
Percentage of slips with different depths of failure
Depth of failure surface Percentage of total slip (m) length
0.2-0.4 14 0.5-0.9 35 1.0-1.5 46 1.6-2.0 4 2.1-2.5 1
Where embankments are constructed of rock and the slope angle is high, very shallow failures can develop due to failure of the topsoil on the stable rock fill beneath, for example on Lower Keuper Sandstone and Chalk. Although the slope is stable for the rock fill it cannot always retain a topsoil and when failure occurs the rock becomes exposed to weathering. In the majori ty of embankments constructed of soil, the failure surface extends through the topsoil into the fill to greater depths than in embankments of rock fill.
In most instances the area of failure extended from the crest to the toe of the slope.
During the survey it was observed that, at the bottom of a small percentage of embankments and cuttings, the toe of the slope had been disturbed leaving a vertical face. This has been called 'toe erosion' and may have formed as a result of disturbance by maintenance plant or as a consequence of the motorway hard shoulder being widened. The vertical face was normally less than 0.5 m high in those geologies susceptible to failure. Although failures were present on slopes affected by toe erosion, analysis indicates that usually other factors, such as geometry, contributed to these failures.
The method used for repairing failures has been similar for all areas included in the survey and involved excavating the failed material, sometimes in benches, to below the failure surface and backfilling with a granular free-draining material such as gravel, brick rubble or crushed rock. Topsoil has been added in some regions, obscuring the repair and providing a more attractive appearance. Occasionally failure of a previously repaired slope has occurred presumably because excavation did not proceed beyond the original failure surface or a new failure surface has developed deeper in the fill.
Only one fabric reinforced soil reinstatement was located in the survey area, in a cutting on the M4 in Berkshire. This was a reinstatement of a deep seated failure, rather than a shallow slip, the design and construction of which is described by Murray, Wrightman and Burt (1982).
In cutting slopes where a soil overlies a rock, failures have occurred where the soil infilled cavities in the rock (Figure 9). Although the upper soil slope is generally constructed at a flatter slope angle, soil within the cavities is constructed at the steeper slope
V e g e t a t e d soi l s lope
. . . . , "-" ~ ---~ . . . . . ~ ;~ .~. i
• ~o "~ .~ • =,. - " • ~ o ,~ "" ~.~' , • . : . . ' . . " ~ ~'.
~ ~ ~ ' Steep s lope ~. " "'~'" - - " " - ' angle
~ ~ des igned
" ~ " "¢~'~ "~"~'2" ~ ' ~ ' d e n t i t i o n Fa i led soi l f r o m w i t h i n r o c k c a v i t y
Fig.9 Failure and repair of soil in rock cavities
S h a l l o w s lope angle des igned f o r soi l
40

angle suitable for the rock and consequently fails. Drift material above Carboniferous Limestone Series limestone is a good example of this. Failures have also occurred in steep rock cuttings due to weathering of vulnerable sections of the exposed rock face. In both situtions, rock 'dentit ion', where the failed soil or weathered rock is removed and the remaining material buttressed with more durable blocks of rock, has been used as a successful repair technique.
Failures that occurred during construction were usually deep seated and infrequent, compared to the number of shallow failures in later years. Repairs of these failures were completed before the motorway was open to traffic.
Slopes where cracking has occurred, have been treated in the survey as contributing to the length of stable slope, however a number of these slopes have subsequently failed. Had these slopes been treated as fully developed failures, the length of failure would have increased by a factor of about 1.8 for embankments and 2.0 for cuttings. No information is available on the time between the initial crack formation and the fully developed failure occurring. However, when the failure does become fully developed movements can occur at a rate of 1 m in 13 days (Crabb et a l 1987).
An assessment has been made as to what lengths of slope will be at risk of failure in the future. This is based on two criteria. Firstly, that an earthwork with an existing failed or cracked area will be likely to fail elsewhere in the same earthwork (with the same geology and age) but on slopes of more severe slope angle and height. Secondly, that slopes which have cracked are likely to fail in the future. The total length at risk of failure is the sum of the slopes of more severe geometry and the length of slope with cracking. Based on this premise, three times as many slopes are likely to fail in the future than have failed so far if no preventative measures are taken. This future estimate is almost certainly conservative as it is most likely that in the long-term failures will occur on slopes constructed at less severe geometries or on earthworks where no previous failures have occurred. The time-scale of future failures is, however, uncertain at this time but for some slopes it may take up to 120 years before failure occurs (Chandler and Skempton, 1974).
7.2 V A R I A T I O N OF DESIGN P A R A M ETERS
The survey covered a number of motorways of differing age and geology and, as a result, included many different design parameters. Figure 10 illustrates the range of heights and slope angles encountered. The distribution of height shows that 81 per cent of the embankment length and 76 per cent of the cutting length is less than 5.0 m high and that only 6 per cent of the embankment length and 9
~" 1 0 0 0 u~
= 80
e ~ ~ 60
~ ~ 40 g =
° N ~-~ o
o
I I I
5 10 15
H e i g h t o f s l o p e ( m )
I
20
~. 100 -~ r o 90 ° "5 c 80
~ 60 _ _ ~ tO ~
"6 ~- 40 O
~_ N 0 c : I I I 0 10 20 30 40 (deg.) 50
I I I I I I" I I I | I I / / / / / / ~ " / / / , ~ ( v : h )
. ~ , / ~ / - ~ / / - ,/- <. <. ,~-
.~o " . ' ~ .,~\~ ~'" "~" ~" S l o p e ang le
Fig. 10 The distribution of height and slope angle for embankments and cuttings encountered in the survey
per cent of the cutt ing length is greater than 7.5 m high. The highest embankment slope and highest cutt ing slope were 66.7 m and 32.0 m respectively. The height distribution is almost identical to that found previously by Parsons and Broad (1970). The distribution of embankment slope angle shows that over half the slopes were at 1:2. Cutting slopes were more variable and ranged up to 90 degrees for some rock slopes.
The overall drainage distribution for all the motorways surveyed is given in Table 29.
TABLE 29
Distribution of drainage at the bot tom of embankments and the top of cutt ings
Type of drainage Embankments Cutt ings
None 26% 60% Open ditch 46% 18% French drain 27% 17% Other 1% 5%
41

Open ditches are the most common type of drainage at the bottom of embankments. The majority of cutting slopes have no drainage at the top, which may reflect the fact that in cases where water movements at or near the ground surface are away from the motorway, a cut-off drain was not thought to be necessary.
This Report presents a catalogue of real events. Consequently it is not subject to the uncertainties and assumptions of the analysis and testing of soils. The values given in the tables of maximum slope angle are based on actual failures and so no assumptions have to be made and, unless the situation of the slope is exceptionally unusual, the uncertainties have been reduced by the large lengths of motorway studied. Steeper slope angles than those recommended in the tables may be acceptable in existing and new slopes if suitable preventative measures, such as rock ribs and geomesh plus anchors, are used (Johnson 1985). In new construction or for widening an existing highway where only a small amount of land is available, steeper slope angles may be constructed by, for example, using more stable material, such as rock fill, on the outer slope.
Using various types of drainage can result in the recommended slope angles being steepened. Based on the analysis of differing types of drainage and its effect on the percentage of failure, tables are given in most sections, of the steepened slope angle and most effective type of drainage. Although 570 km of motorway were surveyed, there is insufficient data to show the effect of drainage on the recommended slope angle for all of the geologies with failures.
The choice of slope angle may also be affected by other factors, outside the scope of this Report, such as land prices, environmental considerations and possible uses for the slope.
8 DISCUSSION The survey described in this Report covered 1500 km of motorway slope, which were selected in order to include a large number of geologies and a variety of geometries, motorway ages and types of drainage. This it has done very successfully, with the exception of some cases of motorway age, and in so doing has generated the largest computer database of its kind in England and Wales. Since the failure of cutting and embankment slopes is a continuing process, the database can be used in the future to study the long- term performance of the motorway earthworks surveyed.
Table 30 shows the top six single geologies, in embankments and cuttings, whose slopes have the highest percentages of failure.
For embankments, the Table includes most of the well known over-consolidated clays illustrating their susceptibility to failure. Most of the failures in Lower Keuper Sandstone are of the topsoil and not of the fill itself as was the case with the other geologies listed. In cuttings well known over-consolidated clays are again included as well as the Enville Beds, which were found on the M5 in Hereford and Worcester. London Clay, a well documented material because of
T A B L E 30
Geologies with a high percentage of failure
Geology Percentage of failure Predominant slope angle
E M B A N K M E N T S
Gault Clay Reading Beds Kimmeridge Clay Oxford Clay Lower Keuper Sandstone London Clay
8.2 1:2.5 7.6 1:2 6,1 1:2 5.7 1:2 4.9 1:1.5 4.4 1:2
CU'I- r lNGS
Gault Clay 9.6 1:2.5 Enville Beds 5.8 1:2.5 Oxford Clay 3.2 1:2 Reading Beds 2.9 1:3 Bunter Pebble Beds 2.3 1:2 Lower Old Red Sandstone--St Maughan's Group 1.7 1:2
42

its unstable behaviour, is not one of the six geologies in cuttings with the highest percentages of failure. The percentage of failure in this material was only 0.3 per cent with a predominant slope angle of 1:3, much less than that for embankments which may reflect the cautious approach adopted for cuttings in this material.
Considering embankment slopes with a combination of two geologies, Glacial Gravel with Middle Lias (Silts and Clays) has the highest percentage of failure of 11.0 per cent. In cuttings, Middle Lias (Silts and Clays) with Lower Lias has the highest percentage of failure of 13.1 per cent. However, none of these geologies individually has a percentage of failure greater than 0.6 per cent. In some cases, therefore, a combination of geologies can have a higher percentage of failure than the individual geologies.
In relation to age, higher percentages of failure were recorded in the more recently constructed embankment slopes of London Clay, Oxford Clay and London Clay with Reading Beds. To explain this, additional detailed studies would be required into the soil properties, specifications, design standards and construction practices for each individual motorway.
The study of the effect of geometry on slope stability has unexpectedly revealed that the steepest slope angle on over-consolidated clay soils is not necessarily associated with the highest percentage of failure. The phenomenon is not yet well understood and long-term studies of embankments on Gault Clay are being undertaken to find an explanation (Crabb and West, 1985). Cutting and embankment slopes in over-consolidated clay soils have a high initial strength due to the negative pore water pressures resulting from stress relief during construction (Skempton, 1977, Crabb et al, 1987). The rate at which this pressure changes (Vaughan and Walbancke, 1973, Chandler and Skempton, 1974, Chandler, 1984) is, amongst other things, related to slope angle, with the most rapid reductions occurring on flatter slopes which do not shed water as readily as steeper slopes. On the other hand disturbing forces are greatest on the steepest slopes and failures result from an interaction between this and the reducing shear strength with depth due to pore pressure equilibration. A possible implication is that in the longer term the slopes with steeper angles will reach at least the same percentages of failure as those flatter slope angles currently exhibiting the highest percentages of failure.
Other factors which may affect stability are the presence of shear surfaces induced by compaction plant (Whyte and Vakalis, 1987) which could have a detrimental effect on stability, and the roots of trees, shrubs and grasses (Barker, 1986) which may have a beneficial effect on stability. The normal variations in soil properties (Cripps and Taylor, 1986 and 1987) could possibly account for differences in the behaviour of some geologies. Access of water into
slopes can be assisted by the presence of shrinkage cracks initiated in hot, dry spells, the lack of compaction near the outer edges of embankments, if not overfilled and trimmed to a slope, and the opening up of fissures near the slope surface of cuttings. Also, disturbance of the slope by tree planting can assist water infiltration.
When comparing embankments and cuttings with each other, the types of failures (for example slab type failures), the depths of the failure surfaces beneath the slopes and the areas of slopes affected by individual slips, were all found to be similar. So, whatever the different causes of failure may be in each of the earthwork types, the geometry of the resulting slips are very much alike.
The effect on the percentage of failure of the three major types of drainage has been studied at the bottom of embankment slopes and the top of cutting slopes. Drift deposits, or mixtures including Drift deposits, have a lower percentage of failure on slopes with open ditches when compared to slopes with no drainage, but slopes of Solid deposits show the opposite behaviour. These results are difficult to explain but are likely to be related to the different permeabilities of these materials. Drift deposits, which generally have a high permeability, may b e effectively drained by open ditches and, consequently, slopes in this material have fewer failures than when no drainage is provided. Solid deposits are usually of low permeability and so open ditches would be as ineffective as no drainage at all. The factors which cause open ditches to have a detrimental effect on stability in Solid deposits could be associated with the lack of restraint at the bottom of embankments or the f low of groundwater onto the slopes of cuttings where open ditches are located. In Drift deposits, these factors seem to be more than outweighed by the beneficial effects of the drainage.
There is no consistent pattern of behaviour between the percentage of failure of slopes and orientation except for Reading Beds (cohesive) which in both embankments and cuttings had significantly greater percentages of failure on north facing slopes. There are many opposing factors to be taken into consideration when determining the effect of climate on embankment and cutting slopes. For example, the north side of a slope may remain wetter for longer periods but since the south side receives more sunshine the soil can dry out; shrinkage cracks may then develop allowing water to enter deeper into the earthwork when precipitation occurs. This may explain the irregular pattern of failures seen for nearly all the geologies when correlated with orientation. In the case of Reading Beds (cohesive), the north facing slopes appear to be more consistently affected by the wetter micro-climate associated with that orientation.
Figure 11 shows the maximum recommended slope angle for the least stable geology, or one of the least
43

C u t t i n g E m b a n k m e n t
Boolder C,ay ,Soo,hern England) - DRIFT
1:4 f Reading Beds (cohesive) - EOCENE " ~ 1 " 1:5 ~ - Gault Clay - CRETACEOUS
y ~ Lower Lias - JURASSIC
1 : 2 7 " ~ / Bunter Pebble Beds - TRIASSIC I
Middle Coal Measures (Argillaceous) -CARBONIFEROUS
1:2 Z
1:5
" ~ 1 : 1.75
1:3
St, Maughan's Group - OLD RED SANDSTONE
Fig.11
( V e r t i c a l scale x 2)
Maximum recommended slope angles for less than 1 per cent failure on slopes greater than 5.0m high
stable geologies, in each of the deposits studied. This Figure uses the information on single geologies given in the tables of maximum slope angle for new earthwork construction. The slope angles given restrict the percentage of failure to less than 1 per cent for all earthworks over 5.0 m high. It is clear that the younger Jurassic, Cretaceous and Eocene deposits contain geologies with a high percentage of failure at flatter slope angles.
9 C O N C L U S I O N
Shallow failures on slopes are a significant problem on motorway earthworks. Of the 570 km of motorway surveyed, over 17 km of embankment slope and over 5.5 km of cutting slope have failed with the failure surface rarely exceeding 1.5 m in depth. The types of failures, depths to the failure
• surfaces and areas of slopes affected by individual slips, were similar in both embankments and cuttings. The method of repair of shallow slips involved replacement of the failed soil with a free draining material.
Analysis confirmed that the principal factors having an influence on the extent of failures were geology, age of earthworks and geometry" of slope.
The greatest incidence of failure occurred in high plasticity over-consolidated clays. In some of these materials the percentage of failure unexpectedly decreased with increasing slope angle. The majority of geologies, however, show an increase in the percentage of failure with increasing slope angle. Also, for most of the geologies studied, the percentage of failure increases as the height of slope increases.
For some geologies in embankments, higher percentages of failure were recorded in the more recently constructed slopes. Cutting slope failures occurred at a number of ages but generally the older earthworks showed higher percentages of failure.
Fifty per cent or more of embankment slopes have failed for a number of geologies with particular combinations of slope angle, height and age. In cuttings there are a much smaller number of geologies that have percentages of failure greater than 25 per cent for particular geometries and age.
In Solid deposits, embankments with an open ditch at the bottom of the slope usually have a higher percentage of failure than similar slopes with no drainage at all. The same effect can be seen with these types of drainage at the top of cutting slopes. In Drift deposits, however, the opposite occurs for slopes under similar conditions. Slope drains increased the stability of slopes in materials susceptible to shallow failures. The survey shows that the orientation of the slopes studied was not a cause of failure for most geologies.
General guidance on the design of new earthwork side slopes can be gained from the results of the survey and the identification of areas at risk of failure in the longer term will be aided by reference to the maximum recommended slope angles given in this Report.
A conservative estimate of failures in the future suggests that three times as many slopes are likely to fail than have failed so far if no preventative measures are taken.
The construction, specifications and design methods used on the motorways studied have been successful at reducing shallow slope failures for many of the older deposits and for some of the more recent deposits.
1 0 A C K N O W L E D G E M E N T S
The author would like to thank the Consulting Engineers and County Highway Authorities concerned with the maintenance and original
44

construction of the lengths of motorway studied for their co-operation. The significant contributions of Mr A W Parsons and Dr R D Andrews are also acknowledged.
The work described in this Report was carried out in the Ground Engineering Division (Division Head: Dr M P O'Reilly) of the Structures Group of the TRRL.
1 1 REFERENCES
BARKER D H (1986). Enhancement of slope stability by vegetation. Ground Engineering, April 1986 pp 11-15.
CHANDLER R J (1984). Recent European experience of landslides in over-consolidated clays and soft rocks. In: CANADIAN GEOTECHNICAL SOCIETY. Proceedings of the forth international symposium on landslides, Toronto, 16-21 September 1984. Vol 1. pp 61-81. Toronto: University of Toronto.
CHANDLER R J and SKEMPTON A W (1974). The design of permanent cutting slopes in stiff fissured clays. Geotechnique, 24 (4) pp 457-466.
CRABB G I and WEST G (1985). Monitoring pore water pressures in an embankment slope. In: INSTITUTION OF CIVIL ENGINEERS. Proceedings of the international symposium on failures in earthworks, London, 6-7 March 1985. pp 406-410. London: Thomas Telford.
CRABB G I, WEST G and O'REILLY M P (1987). Groundwater conditions in three highway embankment slopes. In: INSTITUTION OF CIVIL ENGINEERS. Proceedings of the ninth European conference on soil mechanics and foundation engineering, Dublin, 31 August-3 September 1987. Groundwater effects in geotechnical engineering. pp 401-406. Rotterdam/Brookfield: A A Balkema.
CRIPPS J C and TAYLOR R K (1986). Engineering characteristics of British over-consolidated clays and mudrocks, I. Tertiary deposits. Engineering Geology, 22 pp 349-376.
CRIPPS J C and TAYLOR R K (1987). Engineering characteristics of British over-consolidated clays and mudrocks, II. Mesozoic deposits. Engineering Geology, 23 pp 213-263.
DEPARTMENT OF TRANSPORT (1981). Road layout and geometry: highway link design. Department Standard TD 9/81. Department of Transport, London.
DEPARTMENT OF TRANSPORT (1988). Transport statistics, Great Britain, 1977-1987. London: HMSO.
GREENWOOD J R, HOLT D A and HERRICK G W (1985). Shallow slips in highway embankments constructed of overconsolidated clay. In: INSTITUTION OF CIVIL ENGINEERS. Proceedings of the international symposium on failures in earthworks, London, 6-7 1985. pp 79-92. London: Thomas Telford.
JOHNSON P E (1985). Maintenance and repair of highway embankments: studies of seven methods of treatment. Department of Transport, TRRL Report RR30. Transport and Road Research Laboratory, Crowthorne.
MURRAY R T, WRIGHTMAN J and BURT A (1982). Use of fabric reinforcement for reinstating unstable slopes. Department of Transport, TRRL Report SR751. Transport and Road Research Laboratory, Crowthorne.
PARSONS A W and BROADB A (1970). A study of the feasibility of using belt conveyors for earthmoving in road construction. Ministry of Transport, TRRL Report LR336. Transport and Road Research Laboratory, Crowthorne.
PARSONS A W and PERRY J (1985). Slope stability problems in ageing highway earthworks. In: INSTITUTION OF CIVIL ENGINEERS. Proceedings of the international symposium on failures in earthworks, London, 6-7 March 1985. pp 63-78. London: Thomas Telford.
PERRY J (1985). Incidence of highway slope stability problems in Lower Lias and Weald Clay. In: INSTITUTION OF CIVIL ENGINEERS. Proceedings of the international symposium on failures in earthworks, London, 6-7 March 1985. pp 439-441. London: Thomas Telford.
SKEMPTON A W (1977). Slope stability of cuttings in brown London Clay. In: JAPANESE SOCIETY OF SOIL MECHANICS AND FOUNDATION ENGINEERING. Proceedings of the ninth international conference on soil mechanics and foundation engineering, Tokyo, 11-15 July 1977. Vol 3. pp 261-270. Japan: Jap. Soc. of Soil Mech. and Found. Engng.
VAUGHAN P R and WALBANCKE H J (1973). Pore pressure changes and the delayed failure of cutting slopes in over-consolidated clay. Geotechnique, 23 (4), pp 531-539.
WHYTE I L and VAKALIS I G (1987). Shear surfaces induced in clay fills by compaction plant. In: INSTITUTION OF CIVIL ENGINEERS. Proceedings of the conference on compaction technology, London, 29 October 1987. pp 125-137. London: Thomas Telford.
45

APPENDIX A
GLOSSARY OF TERMS Slope angle is the angle of a slope expressed either as the gradient of the slope, in terms of the vertical to horizontal distance (eg 1:3), or in degrees to the horizontal.
The percentage of failure is the length of failed slope (parallel to the centre line of the road) expressed as a percentage of the total length of slope involved; only repaired and unrepaired slips were considered as failures.
Age is the time between a motorway being opened to traffic and the survey.
Dr i f t and Sol id depos i ts are here defined as they would appear on a geological survey map, ie Drift is all superficial deposits including glacial, fluvio-glacial and alluvial, and Solid is all non-superficial deposits.
Features are lengths of slope where there is no change of any of its characteristics. Where a change occurs a new feature begins and so the motorway is divided into sections for storage as a computer database and subsequent analysis.
46

APPENDIX B
DETAILS OF MOTORWAYS SURVEYED
Carlisle
~Penrith
Motorway network
Surveyed length
Lancaster ' Leeds M62 _
Che
Sheffield
Stoke on Trent
:~If'lM 6 I
B i r m i n g h a m ~ M 5
Norcester O , l r M1
• ~ | M s Gloucester A
Swindon
• Leicester
Northampton °
Bedford
Readinc
Bristol Basingstoke
Guildford
Brighton
• Cambridge
M23
M l l
Wells
0 100km
I I
Fig B1 Map of motorway sections studied
47

T A B L E B1 Motorways surveyed
Motorway County Section Chainage Length (km)
Date of opening
Age when surveyed
(years)
M1
M1
M1
M1
M1/M45
M4
M4
M4
M4
M4
Hertfordshire
Bedfordshire
Buckinghamshire
South Yorkshire
Northamptonshire
Wiltshire
Berkshire
Mid-Glamorgan
South Glamorgan
Gwent
J5 (Bern/grove) J5-J7--St Albans By-Pass 2--section being widened during 84/86 J7 and M10 to J10 and Luton Spur--St Albans By-Pass 1
J10-J13 (Luton to Ridgmont)
J13-ch.94.0 (Ridgmont to maintenance limit)
J30-J32 (Barlborough to Morthen) J32-J34 (Morthen to Tinsley) J34-J38 (Tinsley to Haigh)
J16-J17 (M1) (A45 to M45) J17-A45 U/B (M45) (Northants C C) A45 U/B to end M5 (Warwicks C C)
J18-J15 (Tormarton to Liddington)
J15-JS/9 (Liddington to Holyport) Maidenhead and Slough by-pass widening
Maidenhead by-pass (side roads for M4) Slough by-pass (side roads for M4) A329(M) A4 to Lodden Bridge A329(M) A321 Twyford Road to A329 J34-J35 (Miskin to Pencoed) J35-E of J37 (Bridgend Northern By-Pass) J37 Additional work
Advanced works at Hoel Las Embankment J29-J32 (Castieton to Con/ton) J32-J34 (Con/ton to Miskin) J33 Culverhouse Link
J23-J24 (Magor to Coldra) J24-J28 (Newport By-Pass) J28-J29A and A48(M) (Tredegar Park to St Mellons)
J24-J25 Widening (Coldra to Caerlon) J26-J28 Widening (Malpas to Tredegar Park)
27.7 27.7-36.5
36.5-49.6
49.6-73.2
73.2-94.0
239.2-250.5
250.5-260.0 260.0-284.2
109.5-123.7 0.0-9.8
9.8-12.6
169.5-123.5
123.5-44.5 44.5-31.0
253.3-264.5 264.5-278.8
232.8-244.9 244.9-253.3 249.8-251.2
211.2-218.2 218.2-~8.4 ~8.4-236.1
218.2-79~.1
224.8-227.4
8.8
13.1 21.9
23.6 23.6
20.8 20.8
11.3
10.0 24.2 45.5
14.2 9.8
2.8 26.8
46.0 46.0
79.0 13.5 92.5
11.2 14.3
25.5
12.1 7.0 1.4
20.5
7.0 10.2 7.7
24.9
66/67 Jan 60
Nov 59
Nov'59
Nov'59
Dec'67
Dec'67 Oct'68
Nov'59 Nov'59
Nov'59
Dec'71
Dec'71 Dec'71
1962
Apr'63
74/75 75/76
Dec'77 Sept'81
Sept'81
Sept'81
Dec'77 Jul'80 Mar'85
Mar'67 Apr'67 0ct'77
Apr'82
Apr'80
14.0 22.0
22.0
22.0
22.0
15.0
15.0 14.0
25.0 25.0
25.0
10.0
10.0 10.0
19.0
18.0
6.0 5.0
9.5 4.5
4.5
4.5
9.5 6.5 2.0
20.0 20.0 9.5
5.0
7.0
48

Motorway County Section Chainage Length (km)
Date of opening
Age when surveyed
(years)
M5
M5
M6
M6
Mll
M23
M62
Gloucestershire
Worcester and Hereford
Staffordshire
Cumbria
Essex
Surrey
West Yorkshire
J12-ch.94.2 (Moreton Valence section) ch.94.2-ch.74.1 (Cheltenham and Gloucester section) ch.74.1-J9 (Tewkesbury section)
Canal U/B to J4 (Lydiate Ash)
J4 (Lydiate Ash to Frankley Service Area (Midlands Link C1.)
Addition of crawler lanes on NB carriageway Widening to 3 lane dual carriageway north of J4 1) Lydiate Ash to Dayhouse Bank (ch.21.4) 2) Dayhouse Bank to J3
J13-J14 (Dunston to Stafford) J14-ch.241.3 (Stafford to Tittensor) ch.241.3-J15 (Tittensor to Hanchurch)
N of J38--Thrimby Thrimby-- Hackthorpe Hackthorpe--J40 (Penrith By-Pass)
J3-J5 (Redbridge to Loughton) J5-J7 (Loughton to South Harlow) J7-J8 (South Harlow to A120) J8-J9 (A120 to Stump Cross)
J7-J8 (Hooley to Merstham) M23/M25 Junction 8 J8-J11 (Bletchingley to Pease Pottage)
Gatwick Link J22-J23 (Moss Moor to Outlane) J23-J24 (Outlane to Ainley) J24-J26 (Ainley to Chain Bar)
97.3-94.2
94.2-74.1
74.1-70.2
42.9-22.9
22.9-16.5
30.6-28.9 26.8-25.2
one cut affected
219.9-230.9 230.9-241.3
241.3-246.4
433.0-447.8 447.8-451.6 451.6-459.2
10.0-18.5 18.5-31.0
31.0-46.5 46.5-71.0
27.0-30.2 30.2-32.9 32.9-54.4
75.5-87.4 87.4-89.7
89.7-100.5
Total Surveyed
3.1
20.1
3.9 27.1
20.0
6.4 26.4
11.0 10.4
5.1 26.5
14.8 3.8 7.6
26.2
8.5 12.5
15.5 24.5 61.0
3.2 2.7
21.5 27.4
11.9 2.3
10.8 25.0
567.6
Apr'71
Apr'71
Apr'71
Jul'62
Nov'65
1975
1984
original slope
Sept'62 Dec'62
Dec'62
Oct'70 Aug'69 Nov'68
1976 1976
June'75 Nov'79
Dec'74 Dec'74 Dec'74
Nov'75 Dec'70 Dec'72 Jul'73
13.0
13.0
13.0
23.0
19.5
10.0
1.0
23.0 23.0
23.0
16.0 17.0 18.0
6.0 6.0
7.0 3.0
9.0 9.0 9.0
8.0 15.0 13.0 12.5
Printed in the United Kingdom for Her Majesty's Stationery Office (1433/89) Dd8227758 6/89 C5 G476 10170
49