a synergetic use of observations from modis, seviri msg, asar and amsr-e to infer a daily soil...
TRANSCRIPT

A synergetic use of observations from MODIS, SEVIRI MSG, ASAR and AMSR-E to infer a daily soil
moisture indexC. Notarnicola1, F. Di Giuseppe2, K. Lewinska1, L. Pasolli1,3, M. Temimi4, B. Ventura1, M. Zebisch1
1 EURAC-Institute for Applied Remote Sensing, Viale Druso 1, Bolzano, Italy.
2ARPA-ServizioIdroMeteoClima, Viale Silvani 6, Bologna, Italy
3Dep. of Information Engineering and Computer Science, University of Trento, Via Sommarive, 14, Trento, Italy.
4NOAA-CREST/NOAA-CREST/The City University of New York, The City College, 140th St @ Convent Ave.
Steinman Hall (T-109), New York, NY 10031.
IEEE International Geoscience and Remote Sensing Symposium - IGARSS 2011
Vancouver, Canada - July 24-29, 2011
Outline
2
Introduction
Main concept: multi-sensor approach
Test sites and EO data
Apparent Thermal Inertia (ATI) approach
Synergy with SAR images and AMSR-E data
Experimental results
Conclusions and future steps
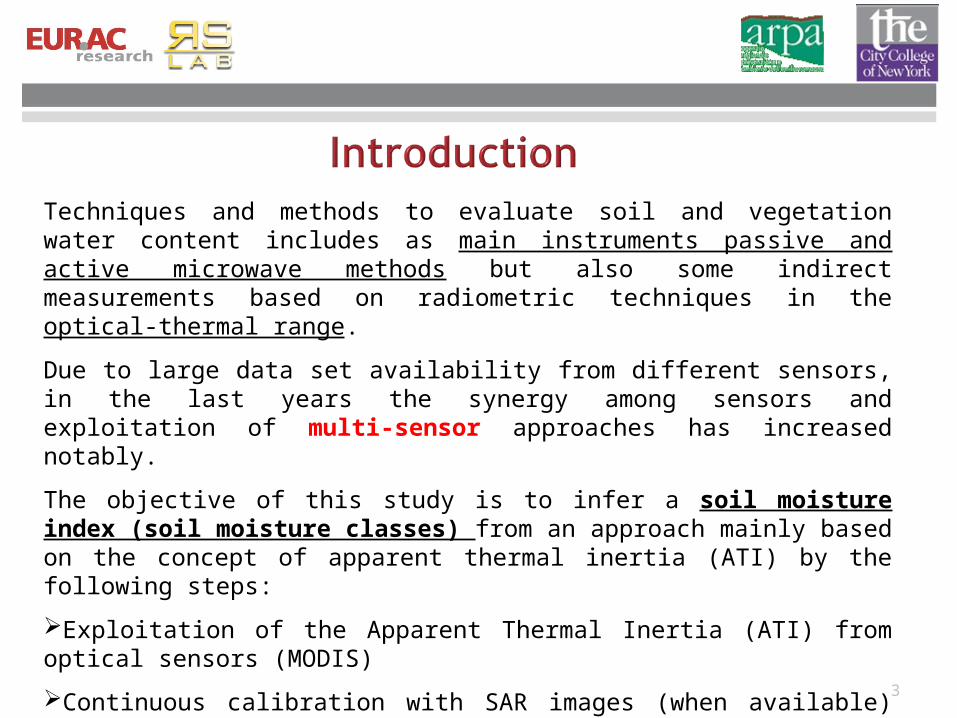
Techniques and methods to evaluate soil and vegetation water content includes as main instruments passive and active microwave methods but also some indirect measurements based on radiometric techniques in the optical-thermal range.
Due to large data set availability from different sensors, in the last years the synergy among sensors and exploitation of multi-sensor approaches has increased notably.
The objective of this study is to infer a soil moisture index (soil moisture classes) from an approach mainly based on the concept of apparent thermal inertia (ATI) by the following steps:
Exploitation of the Apparent Thermal Inertia (ATI) from optical sensors (MODIS)
Continuous calibration with SAR images (when available) and AMSR-E data
Synergy with SEVIRI MSG acquisitions 3
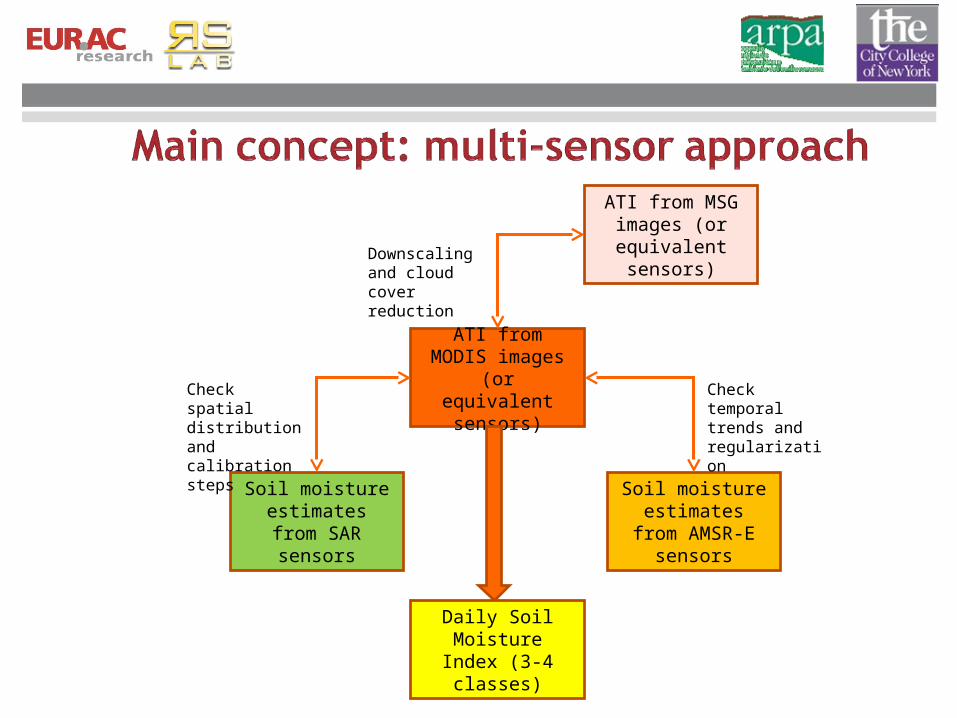
ATI from MODIS images (or equivalent sensors)
ATI from MSG images (or equivalent sensors)
Soil moisture estimates from AMSR-E sensors
Soil moisture estimates from
SAR sensors
Check spatial distribution and calibration steps
Check temporal trends and regularization
Downscaling and cloud cover reduction
Daily Soil Moisture Index (3-4 classes)
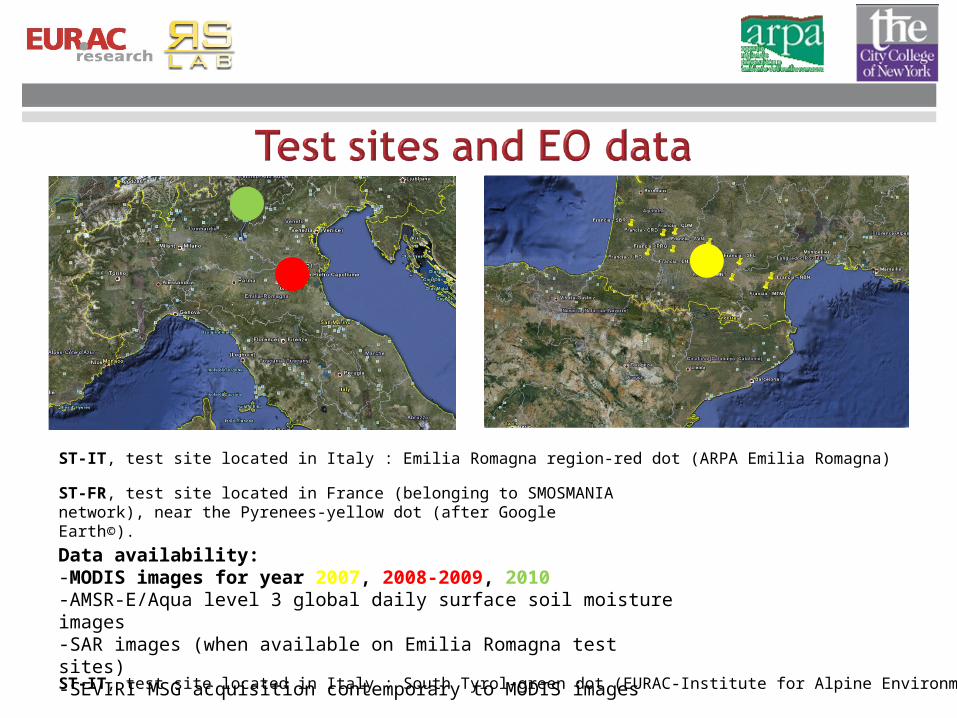
ST-IT, test site located in Italy : Emilia Romagna region-red dot (ARPA Emilia Romagna)
ST-FR, test site located in France (belonging to SMOSMANIA network), near the Pyrenees-yellow dot (after Google Earth©).
ST-IT, test site located in Italy : South Tyrol-green dot (EURAC-Institute for Alpine Environment)
Data availability:-MODIS images for year 2007, 2008-2009, 2010-AMSR-E/Aqua level 3 global daily surface soil moisture images-SAR images (when available on Emilia Romagna test sites)-SEVIRI MSG acquisition contemporary to MODIS images

Physical Thermal Inertia (TI) (Watson et. al., 1971; Price 1977)• Response to temperature change• Physical TI = √(density*thermal conductivity*heat
capacity)
Apparent Thermal Inertia (ATI) (Price 1985; Mitra & Majumdar 2004; Claps & Laguardia, 2004)
• ATI = (1-albedo) / (Temperature max - Temperature min)• Thermal image pair solar noon and pre-dawn 12:00
Tem
pera
ture
00:00 24:00 Time
bare soil
water
vegetation
MYD L1B
Day acq.
MYD L1B
Night acq.
Georeferencing/
Radiometric cal.
BT11m day
BT11m night
MYD 09Albedo calculationRe-projection
ATI
Cloud screenin
g (MYD035
)
22T
TATI
AA
ATIATI
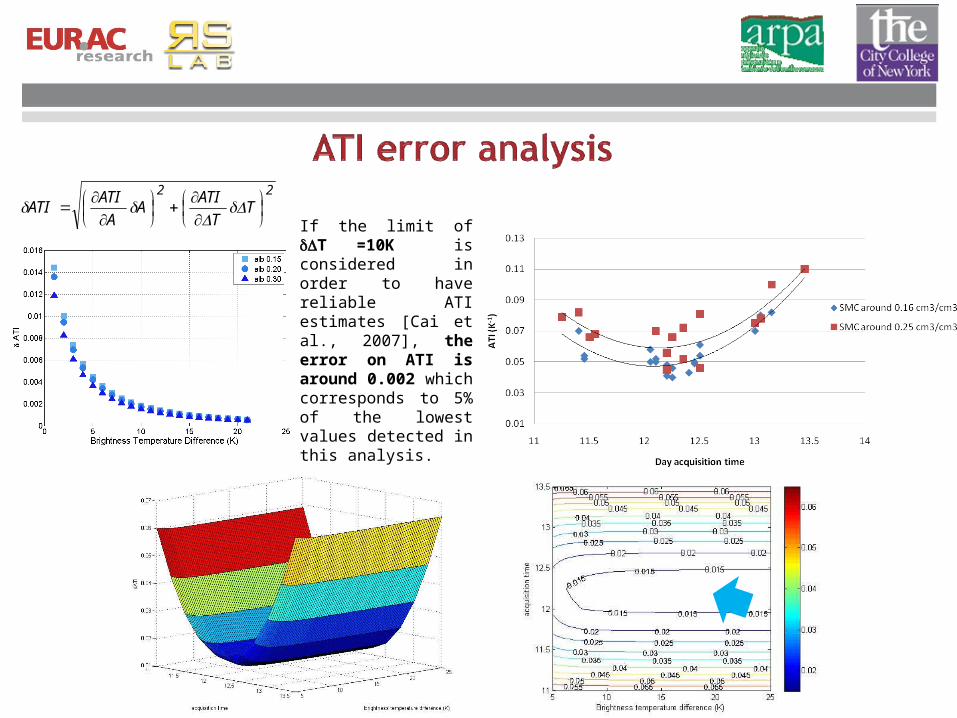
If the limit of T =10K is considered in order to have reliable ATI estimates [Cai et al., 2007], the error on ATI is around 0.002 which corresponds to 5% of the lowest values detected in this analysis.
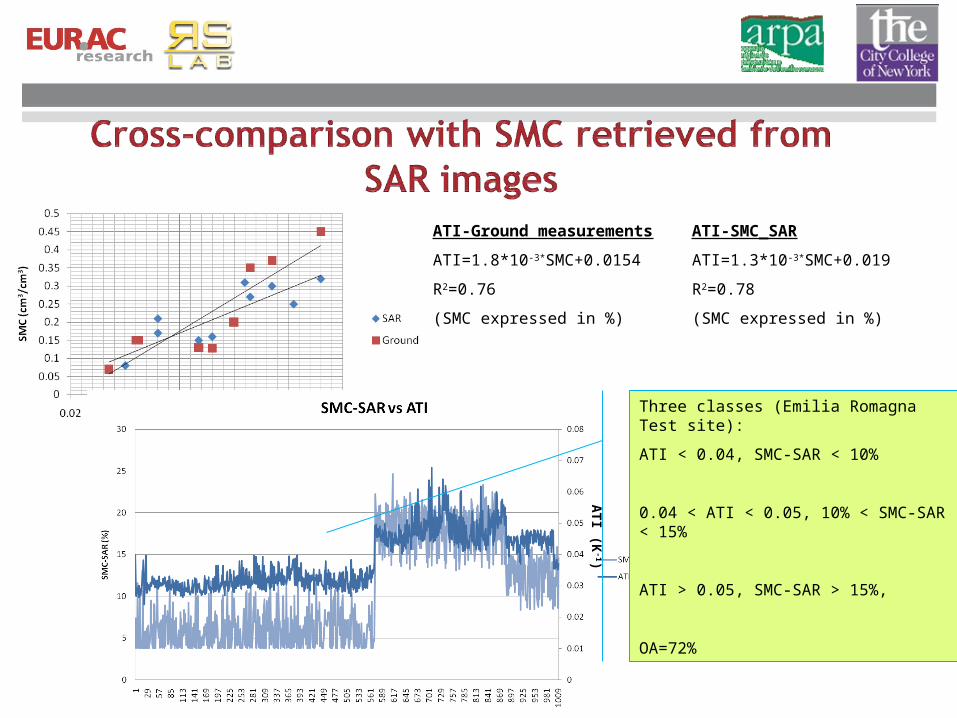
ATI-Ground measurements
ATI=1.8*10-3*SMC+0.0154
R2=0.76
(SMC expressed in %)
ATI-SMC_SAR
ATI=1.3*10-3*SMC+0.019
R2=0.78
(SMC expressed in %)
Urban
Forest
Water
bodies
ATI SAR
ATI (K
-1)
Three classes (Emilia Romagna Test site):
ATI < 0.04, SMC-SAR < 10%
0.04 < ATI < 0.05, 10% < SMC-SAR < 15%
ATI > 0.05, SMC-SAR > 15%,
OA=72%
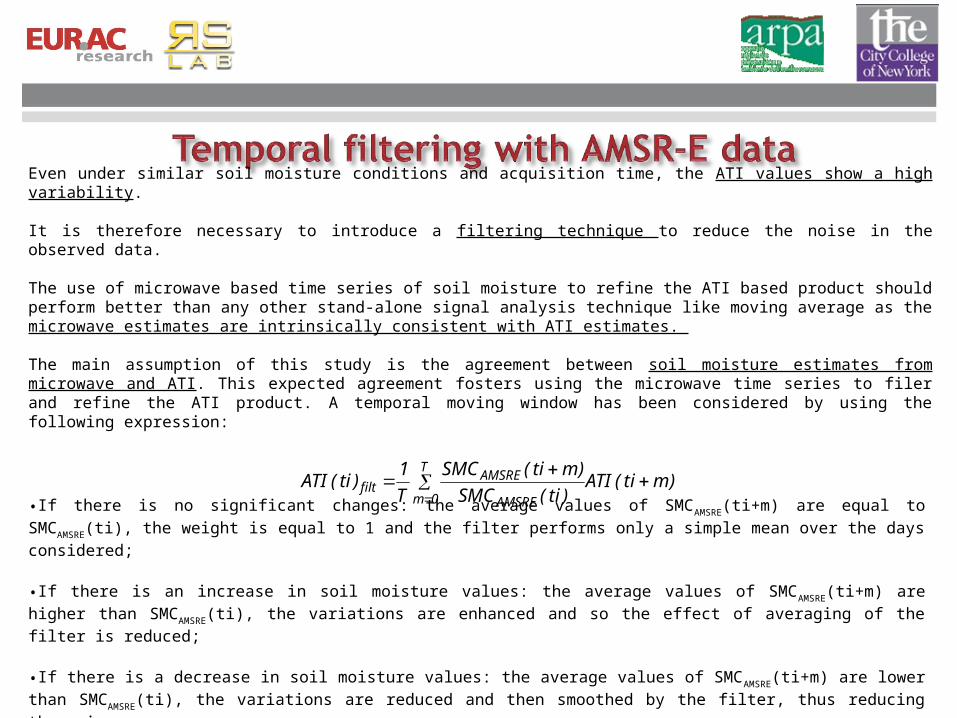
Even under similar soil moisture conditions and acquisition time, the ATI values show a high variability.
It is therefore necessary to introduce a filtering technique to reduce the noise in the observed data.
The use of microwave based time series of soil moisture to refine the ATI based product should perform better than any other stand-alone signal analysis technique like moving average as the microwave estimates are intrinsically consistent with ATI estimates.
The main assumption of this study is the agreement between soil moisture estimates from microwave and ATI. This expected agreement fosters using the microwave time series to filer and refine the ATI product. A temporal moving window has been considered by using the following expression:
)mti(ATI)ti(SMC
)mti(SMC
T
1)ti(ATI
T
0m AMSRE
AMSREfilt
•If there is no significant changes: the average values of SMCAMSRE(ti+m) are equal to SMCAMSRE(ti), the weight is equal to 1 and the filter performs only a simple mean over the days considered;
•If there is an increase in soil moisture values: the average values of SMCAMSRE(ti+m) are higher than SMCAMSRE(ti), the variations are enhanced and so the effect of averaging of the filter is reduced;
•If there is a decrease in soil moisture values: the average values of SMCAMSRE(ti+m) are lower than SMCAMSRE(ti), the variations are reduced and then smoothed by the filter, thus reducing the noise.

Analysis of temporal trends: Emilia Romagna
Comparison of the temporal trend among SMC (cm3/cm3), ATI originally calculated and ATI filtered. H stands for High NDVI values (> 0.4) and L stand for Low NDVI values (< 0.4).
No filter Simple filter Filter using AMSRE dataNDVI < 0.4 0.58 0.59 0.72NDVI > 0.4 0.45 0.45 0.56
Comparison between ATI and measured soil moisture values (SMC) over 1 year period for Emilia Romagna test site. The values represent the determination coefficients between ATI values and SMC in the different cases considered.

SMC classes from ATIFrom the error analysis on ATI, we need to consider:
•For the theoretical error the lowest value 0.015 K-1 has been considered, thus assuming that the filtering notably reduces the effect due to acquisition time;•The standard deviation values of the different ROI considered have a median value around 0.003 K-1.Considering these two independent sources of errors, the total error is: 0.0153 K-1. As the ATI values range from 0.04 K-1 to 0.10/0.12 K-1, the total error determines the possibility to detect at least four classes.
In order to determine the class boundaries and to verify their consistency with the error on SMC measurements (around 5% of the measured value), the clustering tool of Maltlab has been considered. ATI/SMC 1 (< 0.05) 2 (0.05-0.07) 3 (0.07-0.085) 4 (>0.085)
1 (<0.17) 0.57 0.43 - -2 (0.17-0.25) 0.24 0.62 0.09 0.053 (0.25-0.3) - 0.22 0.33 0.444 ( >0.3) - 0.25 0.25 0.50
The overall accuracy with four classes is around 51%. If we exclude the values of ATI within the confidence interval corresponding to the error measurements of
SMC values that can be misclassified, the accuracy raises to 81%.
SMC/ ATI 2 (<0.055) 3 (0.055-0.085) 4 (>0.085)2 (<0.20) 0.76 0.24 -3 (0.20-0.30) 0.12 0.60 0.284 ( >0.30) - 0.50 0.50
In this case, the overall accuracy is around 65%, and rises to 88% considering the misclassified values due to their position very close to the class boundaries.
4 - classes
3 - classes
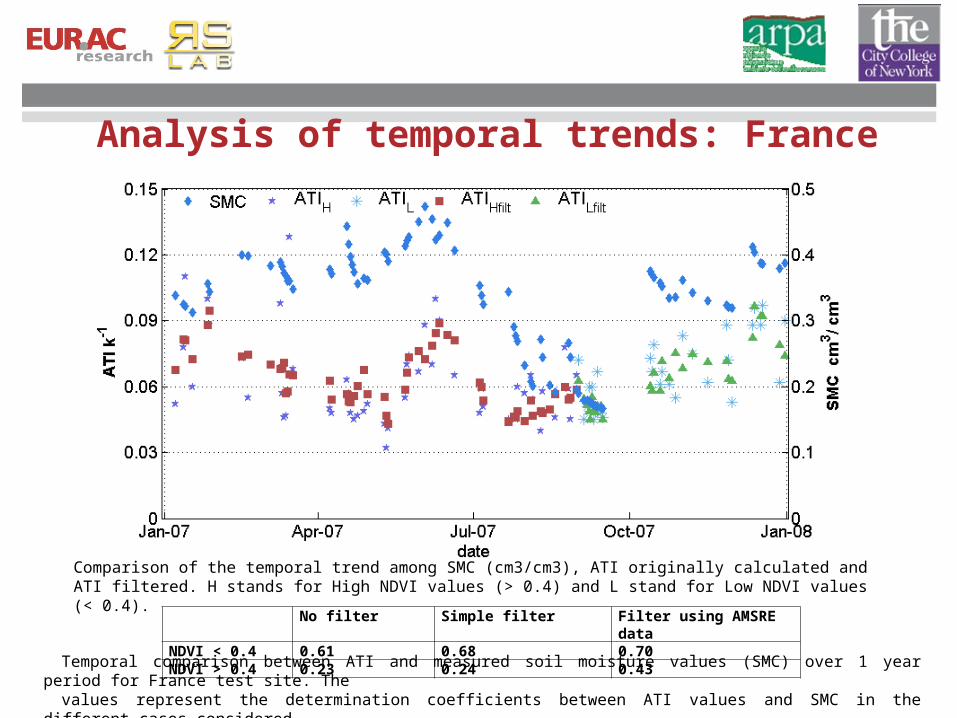
Analysis of temporal trends: France
Comparison of the temporal trend among SMC (cm3/cm3), ATI originally calculated and ATI filtered. H stands for High NDVI values (> 0.4) and L stand for Low NDVI values (< 0.4).
No filter Simple filter Filter using AMSRE dataNDVI < 0.4 0.61 0.68 0.70NDVI > 0.4 0.23 0.24 0.43
Temporal comparison between ATI and measured soil moisture values (SMC) over 1 year period for France test site. The
values represent the determination coefficients between ATI values and SMC in the different cases considered.
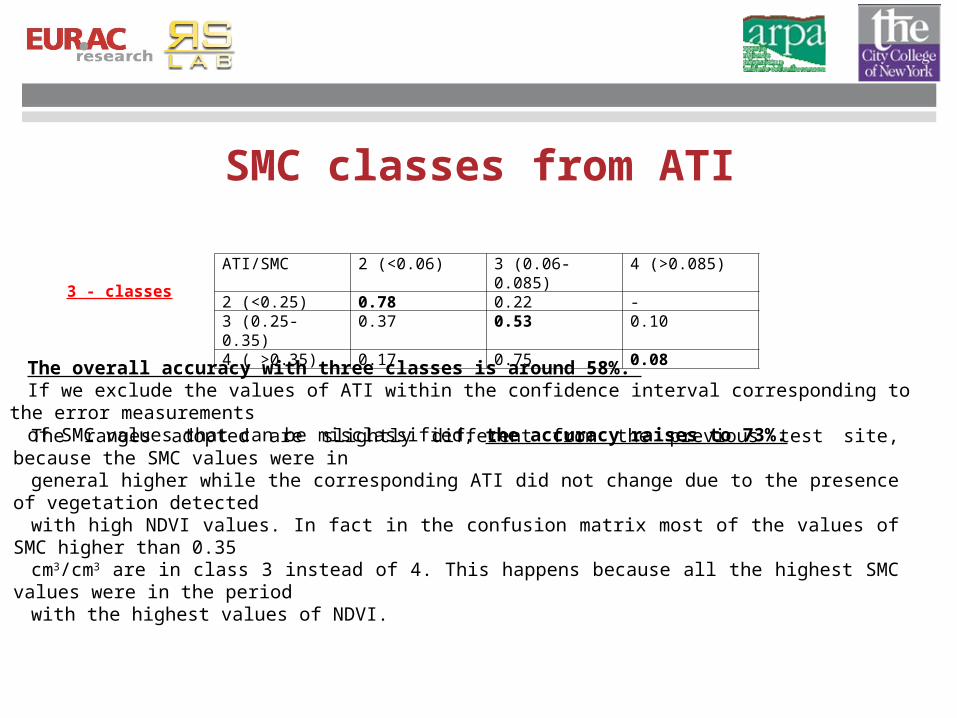
SMC classes from ATI
The overall accuracy with three classes is around 58%. If we exclude the values of ATI within the confidence interval corresponding to the error
measurements of SMC values that can be misclassified, the accuracy raises to 73%.
3 - classes
ATI/SMC 2 (<0.06) 3 (0.06-0.085) 4 (>0.085)2 (<0.25) 0.78 0.22 -3 (0.25-0.35) 0.37 0.53 0.104 ( >0.35) 0.17 0.75 0.08
The ranges adopted are slightly different from the previous test site, because the SMC values were in
general higher while the corresponding ATI did not change due to the presence of vegetation detected
with high NDVI values. In fact in the confusion matrix most of the values of SMC higher than 0.35
cm3/cm3 are in class 3 instead of 4. This happens because all the highest SMC values were in the period
with the highest values of NDVI.


15
ATI (K
-1)
The mismatch between ATI values and SMC measurements can be due to:
-High level of vegetation: NDVI is generally higher than 0.6-Difficulty in eliminating completely the cloud presence (the completely cloud free images were only 20% over 2010 acquisitions)-Topography effect-Time of the acquistions
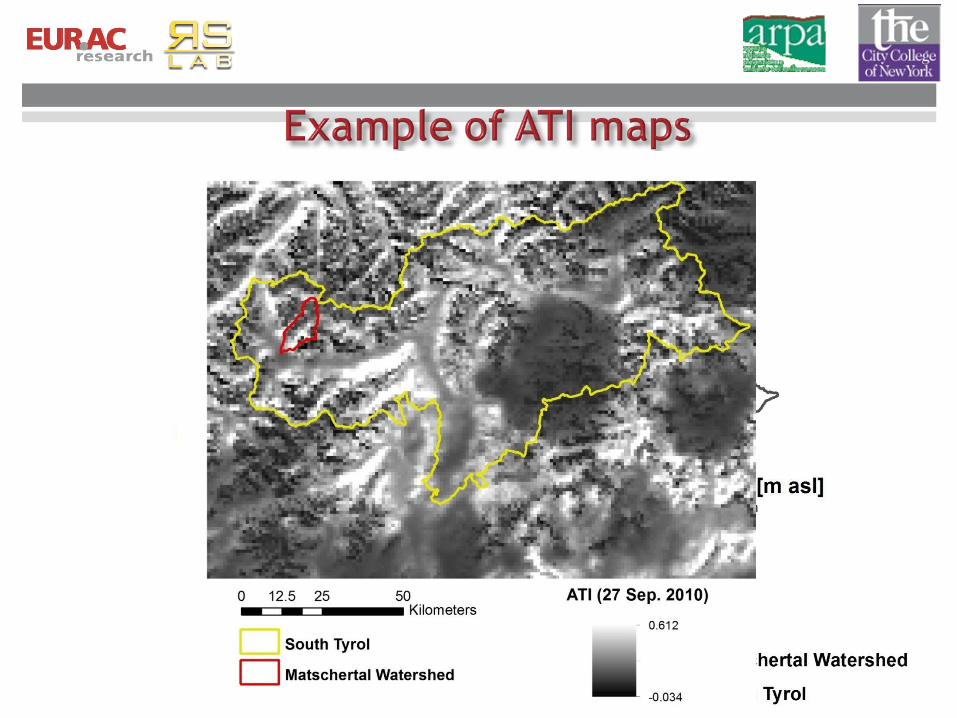
Matchertal watershed – One of the driest valley in South Tyrol

Time of acquisitionsTime of acquisitions
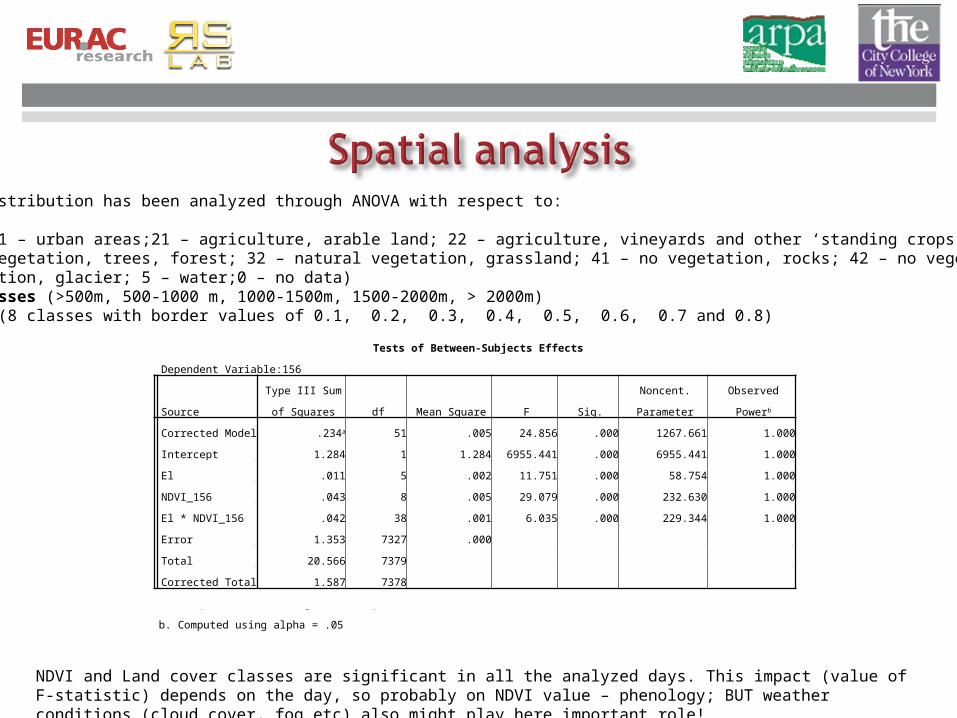
ATI spatial distribution has been analyzed through ANOVA with respect to:
- Land cover (1 – urban areas;21 – agriculture, arable land; 22 – agriculture, vineyards and other ‘standing crops’31 – natural vegetation, trees, forest; 32 – natural vegetation, grassland; 41 – no vegetation, rocks; 42 – no vegetation, debris43 – no vegatation, glacier; 5 – water;0 – no data)-Elevation classes (>500m, 500-1000 m, 1000-1500m, 1500-2000m, > 2000m)-NDVI classes (8 classes with border values of 0.1, 0.2, 0.3, 0.4, 0.5, 0.6, 0.7 and 0.8)
Tests of Between-Subjects Effects
Dependent Variable:145
Source
Type III Sum of
Squares df Mean Square F Sig.
Noncent.
Parameter Observed Powerb
Corrected Model .274a 81 .003 12.780 .000 1035.194 1.000
Intercept .509 1 .509 1924.258 .000 1924.258 1.000
LC .023 10 .002 8.819 .000 88.192 1.000
NDVI_145 .014 8 .002 6.651 .000 53.206 1.000
LC * NDVI_145 .024 63 .000 1.424 .016 89.743 1.000
Error 1.920 7256 .000
Total 26.702 7338
Corrected Total 2.194 7337
a. R Squared = .125 (Adjusted R Squared = .115)
b. Computed using alpha = .05
Tests of Between-Subjects Effects
Dependent Variable:156
Source
Type III Sum of
Squares df Mean Square F Sig.
Noncent.
Parameter Observed Powerb
Corrected Model .234a 51 .005 24.856 .000 1267.661 1.000
Intercept 1.284 1 1.284 6955.441 .000 6955.441 1.000
El .011 5 .002 11.751 .000 58.754 1.000
NDVI_156 .043 8 .005 29.079 .000 232.630 1.000
El * NDVI_156 .042 38 .001 6.035 .000 229.344 1.000
Error 1.353 7327 .000
Total 20.566 7379
Corrected Total 1.587 7378
NDVI and Land cover classes are significant in all the analyzed days. This impact (value of F-statistic) depends on the day, so probably on NDVI value – phenology; BUT weather conditions (cloud cover, fog etc) also might play here important role!


Cross-comparison with SEVIRI- MSG data
A cross-comparison with METEOSAT MSG data is under evaluation. Some MSG images contemporary to MODIS acquisitions have been processed and analyzed over the Emilia Romagna test sites. One of the major problems is the use of a correct cloud mask in order to not introduce not corrected ranges of ATI values.

This work proposes a multi-sensor analysis in order to determine soil moisture classes based on ATI derived from MODIS images. 3-4 classes of SMC were detectable.
For the approach, main limitation are the cloud coverage, the acquisition time of day and night images and the presence of vegetation.
The ATI values have been compared with ground measurements and with soil moisture maps estimated from SAR images in order to verified the spatial pattern consistency. The main limitation remains the low repetition time of SAR images
The temporal trends have been filtered by using the AMSR-E data in order to reduce the effect due to outliers (time of acquisition, clouds, etc..). In this case, the main limitation still remains the presence of vegetation.
First comparisons between MODIS and MSG images indicate a good correlation between these data. For MSG a good cloud cover is highly recommanded.
Future developments will include:
-Further comparison with MSG data, including improvement of the cloud mask
-Definition of a calibration procedure between MODIS and MSG data
-Integration of MODIS time series with MSG data
-Considering other data such as SMOS, Aquarius

22
Thank you for the attention!
Comments/questions?