a synergistic use of amsr2 and modis images to detect
TRANSCRIPT
Comptes Rendus
GéoscienceSciences de la Planète
Mohammad Hossein Merrikhpour and Majid Rahimzadegan
A synergistic use of AMSR2 and MODIS images to detect saline soils(Study Area: Iran)Volume 352, issue 2 (2020), p. 127-138.
<https://doi.org/10.5802/crgeos.11>
© Académie des sciences, Paris and the authors, 2020.Some rights reserved.
This article is licensed under theCreative Commons Attribution 4.0 International License.http://creativecommons.org/licenses/by/4.0/
Les Comptes Rendus. Géoscience — Sciences de la Planète sont membres duCentre Mersenne pour l’édition scientifique ouverte
www.centre-mersenne.org
Comptes RendusGéoscience — Sciences de la Planète2020, 352, n 2, p. 127-138https://doi.org/10.5802/crgeos.11
Hydrology, Environment — Original Article
A synergistic use of AMSR2 and MODIS images to
detect saline soils (Study Area: Iran)
MohammadHosseinMerrikhpoura andMajid Rahimzadegan ∗, a
a Water Resources Department, Faculty of Civil Engineering, K. N. Toosi University ofTechnology, Tehran, Iran
E-mails: [email protected] (M. H. Merrikhpour),[email protected] (M. Rahimzadegan)
Abstract. Soil salinity is a critical environmental problem especially in arid and semiarid regions.Then, the objective of this study is to detect saline soils by synergistic use of the Advanced MicrowaveScanning Radiometer 2 (AMSR2) and the Moderate Resolution Imaging Spectroradiometer (MODIS)images. In this regard, the Total Precipitable Water (TPW) Vapor parameter obtained from AMSR2 andMODIS, the Microwave Polarization Difference Index (MPDI), and a vertical to horizontal brightnesstemperature ratio (T Bv /T Bh ) in the 6 GHz channel of AMSR2 were used in two procedures. Inprocedure 1, the thresholding on the TPW and MPDI, and in procedure 2, the thresholding on the TPWand the T Bv /T Bh in the 6 GHz channel were investigated. The overall accuracy and Kappa coefficientof the produced saline soil map by the procedure 1 were acquired as 0.865 and 0.715, and for theprocedure 2 were 0.809 and 0.607, respectively.
Keywords. Saline soil, Advanced Microwave Scanning Radiometer 2 (AMSR2), Moderate ResolutionImaging Spectroradiometer (MODIS), Total Precipitable Water (TPW).
Manuscript received 6th April 2019, revised 14th March 2020, accepted 14th April 2020.
1. Introduction
Preparation of soil salinity map is of great impor-tance in the management of environment and agri-culture. Most agricultural crops are sensitive to thehigh intensity saline soils [Goossens and Van Ranst,1998]. Furthermore, this phenomenon has a neg-ative impact on the surface water and groundwa-ter resources as well as on the social structure of aregion [Li et al., 2014]. About 830 million hectaresof the world soil resources (around 7%), includingArgentina, Venezuela, Egypt, Iran, Pakistan, United
∗Corresponding author.
States, India, China, and Australia, are affected by thesoil salinity [Ghassemi et al., 1995]. In general, thereis soil salinity in about 20% of the irrigated agricul-tural areas around the world, which is about 30% inthe arid and semi-arid climates such as Egypt, Iran,and Venezuela [Goossens and Van Ranst, 1998].
Remote sensing techniques are among the mon-itoring tools for the identification of soil salinity ona large spatial scale [Bouaziz et al., 2011]. Salt con-tent of the soil affects the measured radiance in dif-ferent wavelengths of the electromagnetic spectrum.Therefore, the processing of the satellite images canbe used to produce saline soil maps [Metternicht andZinck, 2003]. However, there are some limitationsto monitor the soil salinity by the satellite imagery
ISSN (electronic) : 1778-7025 https://comptes-rendus.academie-sciences.fr/geoscience/

128 Mohammad Hossein Merrikhpour and Majid Rahimzadegan
such as (1) Different salts have different electromag-netic spectral absorption properties, which meansthat each wavelength can detect a particular type ofsalt, (2) The presence of vegetation cover can lead tomixed pixels producing an error in the detection ofthe salinity, (3) In some cases, the geometric proper-ties of the salt surface due to the human activities onthe soil, result in some ambiguities in the remote soilsalinity detection [Eklund, 1998].
In the last three decades, many studies have beenaccomplished to detect soil salinity using remotesensing data, especially in the optical spectral ranges.Satellite images have been used for monitoring, de-tecting, and generating saline soil maps all over theworld [Bouaziz et al., 2011, Lasne et al., 2008, Metter-nicht and Zinck, 2008, Verma et al., 1994].
1.1. Previous studies on detecting the saline soilsusing optical remote sensing
A lot of studies have been carried out to preparesaline soil maps using optical remote sensing basedon the use of various vegetation indices such asNDVI1, SAVI2, RVI3, SBI4, GVI5, and WI6 [Alhammadiand Glenn, 2008, Eldeiry and Garcia, 2008, Jabbar andChen, 2008, Lobell et al., 2010, Matinfar et al., 2013,Wang et al., 2002, 2013, Zhang et al., 2011]. Madani[2005] detected and monitored the soil salinity overthe Siwa Oasis, Egypt using two Landsat images ac-quired on 1987 and 1999. The salinity index of pix-els in the 1987 and 1999 was measured to be about0–0.2 and 0–0.4, respectively. These values showedthat the soil salinity had increased in that 12-year pe-riod. Fernandez-Buces et al. [2006] investigated thecorrelation of the COSRI7 remote sensing index from
1Normalized Difference Vegetation Index.
2Soil-adjusted Vegetation Index.
3Ratio Vegetation Index.
4Soil Brightness Index.
5Green Vegetation Index.
6Wetness Index.
7Combined Spectral Response Index.
the Landsat ETM sensor with the soil salinity pa-rameters, including the EC8 and Sodium AbsorptionRatio in the Mexican area of Texcoco. The coefficientsof determination of the results with the EC and theSodium Absorption Ratio were calculated to be 0.885and 0.857, respectively. Wu et al. [2008] identified thesoil salinity using 5 Landsat images from 1973 to 2006and monitored the salinity changes using a normalsupervised classification method. The overall accu-racy of the detection of saline soils in this study wasacquired as 90%. They also proved that the new ir-rigation methods have a significant effect on the re-ducing soil salinization speed. Bouaziz et al. [2011]provided the relationship for predicting soil salin-ity (EC parameter) using 18 indices of salinity, veg-etation, and intensity derived from MODIS9 in thenortheast of Brazil which is a dry region. Linear spec-tral separation method was used to separate the soilfrom the vegetation per pixel. The coefficient of de-termination and RMSE10 were determined as 0.4 and12 µscm−1, respectively. Zhang et al. [2015] investi-gated the correlation between the EVI11 and NDVIderived from MODIS with the soil salinity (EC pa-rameter) in the catchment area of the Yellow River inChina. The results showed a higher correlation of theEVI compared with the NDVI. The coefficient of de-termination of the EVI with the EC was calculated tobe 0.59–0.92 regarding the vegetation type. Yahiaouiet al. [2015] analyzed the relationship between topo-graphic parameters and soil salinity using reflectancevalues of two Landsat 7 images in winter and sum-mer and the DEM12 in the Lower Cheliff plain (Alge-ria) in 2013. They concluded that soil salinity had nocorrelation with slope gradient, while it was signifi-cantly correlated with elevation when the EC valueswere less than 8 dS/m.
8Electrical Conductivity.
9Moderate Resolution Imaging Spectroradiometer.
10Root Mean Square Errror.
11Enhanced Vegetation Index.
12Digital Elevation Model.
C. R. Géoscience, 2020, 352, n 2, 127-138

Mohammad Hossein Merrikhpour and Majid Rahimzadegan 129
1.2. Previous studies on detecting the saline soilsin the range of microwave wavelengths
Bobrov [1999] demonstrated that the value of the sur-face roughness, soil moisture, and evaporation fromthe soil surface have a high sensitivity to the soilsalinity changes. It was accomplished by experimentson the saline soil samples with different salinity lev-els and on the non-saline soil samples at a frequencyof 6.25 GHz. Lasne et al. [2008] investigated the ef-fect of the soil salinity on the dielectric constant ofthe soil and the SAR backscattering coefficient in thefrequency range of 1 to 7 GHz by implementing simu-lated experiments. The results showed the high sensi-tivity of the imaginary part of the dielectric constantto the salinity as well as the high effect of the salin-ity on the soil radar backscattering. Moreover, thesalinity influences on the VV polarization was greaterthan that of the HH. Gong et al. [2013] conducted ex-periments on 150 soil samples with different mois-ture and salinity levels at the different frequencies inthe range of microwave wavelengths (0.2 to 20 GHz).They concluded that the soil salinity has no effect onthe real part of the soil dielectric constant, but the ef-fect of its changes on the imaginary part is consider-able. Moreover, the highest sensitivity of the dielec-tric constant to the salinity was observed at frequen-cies below 2 GHz and this sensitivity was very lowat the frequencies higher than 8 GHz. Chi et al. [2017]estimated the amount of dielectric constant of thesoil and the soil salinity content. It was performed byusing the recorded quantities of the emissivity at themicrowave frequencies (1 to 10 GHz) over the salinesoils in the laboratory. Furthermore, there was founda relationship for the soil salinity estimation by usingthe standard PSO13 and improved PSO optimizationalgorithms. The success ratio of the results in the twoalgorithms was calculated to be approximately 60%and 75%, respectively.
According to the literature, one of the methodsfor estimating the soil salinity is the use of the mi-crowave data in the frequencies less than 7 GHz. Inthis regard, passive microwave satellite data such asAMSR214 measurements can be utilized. Thereafter,the passive microwave brightness temperatures of
13Particle Swarm Optimization.
14Advanced Microwave Scanning Radiometer 2.
AMSR2 in some frequencies are dependent on theTotal Precipitable Water (TPW) Vapor in addition tosalinity [Du et al., 2015, Jones et al., 2010, Merrikh-pour and Rahimzadegan, 017b]. TPW is the amountof the water vapor contained in a vertical column tothe unit area from the ground up to the top of the at-mosphere [Frouin et al., 1990]. Several methods arepresented for estimating TPW based on the satelliteremote sensing data including images in the opticalwavelengths (0.4–14 µm) [Gao and Kaufman, 2003,Merrikhpour and Rahimzadegan, 017a, Rahimzade-gan and Mobasheri, 2011, Seemann et al., 2003] andthe microwave wavelengths [Deeter, 2007, Du et al.,2015, Merrikhpour and Rahimzadegan, 017b, Zhouet al., 2016].
In general, most of the remote sensing studies todetect the soil salinity are within the range of opti-cal wavelengths. Moreover, investigations in the mi-crowave wavelength range were executed using ac-tive microwave wavelengths in the laboratory. In ad-dition, little research has been accomplished on thedetection of the saline soils using the passive mi-crowave data. Therefore, the aim of this study is todetect the saline soils in Iran using the estimatedTPW and the brightness temperature in the verti-cal and horizontal polarizations of the 6 GHz chan-nel of AMSR2. To calculate the TPW, the combina-tion of the optical and passive microwave data in-cluding data from MODIS, ASTER, and AMSR2 hasbeen used. The implementations of this study areperformed for 80 days from the four seasons of 2015–2016. In this regard, the study area and used data ofthis study are presented in the Section 2. Further-more, the methodology of the study, including themethod of estimating the TPW parameter and in-troducing the microwave indices to detect the salinesoils is presented in this section. Analysis of the re-sults, and finally, the conclusion are presented in theSections 3 and 4, respectively.
2. Materials and methods
2.1. Study area
Iran is the selected area of this study located in thesouthwestern Asia with an area of 1.65 million squarekilometers. The climate of Iran is arid and semi-aridfor about 90% of its area. Summer in the central re-gions of Iran is very hot and the temperature in some
C. R. Géoscience, 2020, 352, n 2, 127-138

130 Mohammad Hossein Merrikhpour and Majid Rahimzadegan
conditions is more than 50 ◦C. The temperature inwinter in many parts of Iran is negative and in somedays it reaches below −30 ◦C in the northwesternarea. The average annual precipitation in the cen-tral plateau of Iran is about 50 mm, on the north-ern coast is 1000 mm, and in total is about 250 mm[Qureshi et al., 2007]. The soil salinity is one of thecritical issues in Iran that has a negative impact onthe agriculture and its water resources. Some issuestriggered the development and expansion of the soilsalinity in the recent years in Iran. Those issues in-clude the lack of the adequate drainage of the sur-face water and groundwater, the lack of proper man-agement of water resources, the use of the salt wa-ter for irrigation of the fields and the presence of thesalt in the soils naturally (especially in the central re-gions of Iran). The soil salinity in the central regionsof Iran are high due to the high temperature and thepresence of salt in its soils. About 50% of agricul-tural lands of Iran is affected by the salinity of the soilin various degrees [Qureshi et al., 2007, Taghizadeh-Mehrjardi et al., 2014]. Figure 1 shows the location ofIran and the zoning map of soil salinity [Ghassemiet al., 1995].
2.2. Data processing
In this study, five remote sensing data sets were used.Those data sets include (1) the brightness temper-ature in different channels of AMSR2, (2) the dailyland surface temperature product of MODIS, (3) theMODIS daily surface reflectance in bands 1 and 2for producing NDVI, (4) the MODIS cloud prod-uct (MOD35), and (5) the ASTER DEM. Moreover, thesoil salinity zoning map of Iran produced by Ghas-semi et al. [1995] was used to select the training andtest data for evaluating the proposed method for thesaline soil detection.
2.2.1. Brightness temperatures of AMSR2
The AMSR-E15 sensor on board the NASA16 Aquasatellite was launched on May 4, 2002, and it wasretired in October 2012 [Al-Yaari et al., 2014]. The
15Advanced Microwave Scanning Radiometer for EOS.
16National Aeronautics and Space Administration.
AMSR2 sensor on board of the GCOM-W117 satel-lite was launched on May 18, 2012 by the JapanAerospace Exploration Agency as an alternative tothe AMSR-E. The GCOM-W1 satellite is the first gen-eration of GCOM series satellites that plays a key rolein the global study of the water and energy cycle.AMSR2 measures the brightness temperature at thehorizontal and vertical polarization in 7 channels at6.9, 7.3, 10.6, 18.7, 23.8, 36.5, and 89 GHz. The mostsignificant difference between AMSR2 and AMSR-Eis the improvement of the 25 km spatial resolution ofthe AMSR-E to 10 km [Kachi et al., 2014]. AMSR2 pro-duces geophysical products such as TPW at sea andocean surface, cloud liquid water, rainfall, sea sur-face temperatures, wind speed at sea surface, sea ice,snow depth, and soil moisture. AMSR2 image acqui-sition is twice a day when it is ascending (at 1:30 pmwhen passing through the equator) and when it is de-scending (at 1:30 am when crossing the equator) [Wuet al., 2016].
In this study, the brightness temperature in thehorizontal and vertical polarizations in 18, 23, 36,and 89 GHz bands was used to estimate the TPW.Moreover, the brightness temperature in 6 GHz chan-nel was used as an effective parameter to detect thesaline soil for 80 days from 2015 to 2016 (20 days ev-ery season of year). In order to synchronize the uti-lized AMSR2 and MODIS images, the daytime images(ascending overpasses) were used [JAXA, 2018].
2.2.2. MODIS data
According to the space programs of the USA, NASAset up a system to monitor, analyse, and investigatethe earth surface, oceans, atmosphere, and their in-teractions called EOS18 [Gao and Kaufman, 2003].MODIS with 36 spectral bands as a member of EOSwas launched on Terra platform in December 1999and the second MODIS sensor was launched on theAqua satellite in 2002 [García-Mora et al., 2012, Jus-tice et al., 2002]. In this study, the daily land sur-face temperature and daily reflectance products ofMODIS on board of the Terra satellite were used. Thelast product in bands 1 and 2 was used to calculate
17Global Change Observation Mission-Water 1.
18Earth Observing System.
C. R. Géoscience, 2020, 352, n 2, 127-138

Mohammad Hossein Merrikhpour and Majid Rahimzadegan 131
Figure 1. Iran’s position and the zoning map of soil salinity [Ghassemi et al., 1995].
the daily NDVI which is required in the TPW esti-mation algorithm. Furthermore, in using NDVI andland surface temperature, the MODIS cloud prod-uct (MOD35) with a spatial resolution of 1 km hasbeen used to identify clear sky pixels with a proba-bility higher than 95% [Ackerman et al., 2010] in thegiven time interval [NASA, 018b].
2.2.3. Digital elevation model
The DEM is one of the key data sets in manyhydrological and meteorological studies. In this re-search, an ASTER DEM image of Iran with a spa-tial resolution of 30 m was used in the TPW estima-tion algorithm [NASA, 018a]. ASTER was launched byNASA in 1999 with a spatial resolution of 15 to 90 m,on board of the Terra satellite. This sensor has beengathering data with 14 spectral bands since February2000 [Tachikawa et al., 2011].
2.2.4. Ground truth data
In this study, 348 point data including 117 salinesoil points and 231 non-saline soil points were gath-ered as the training set form the soil map of Iran rep-resented by Ghassemi et al. [1995] (Figure 1). More-over 126 data containing 49 saline soil points and77 non-saline soil points were considered as the testdata.
2.3. Methodology
In the studies on the soil salinity in the microwavewavelength range, the brightness temperature in the
Figure 2. The sensitivity of microwave fre-quencies to some environmental parameters[Ulaby et al., 1986].
L, S, and C bands (1–8 GHz) has been used [Bobrov,1999, Chi et al., 2017, Gong et al., 2013, Lasne et al.,2008]. The sensitivity of the brightness temperaturein these bands to the salinity is high. The brightnesstemperature indicates the microwave radiation of theobjects. The amount of radiation is proportional tothe surface emissivity, and surface emissivity indi-cates the ability of the objects to radiate [Jones et al.,2010]. Figure 2 shows the sensitivity of different fre-quencies in the range of microwave wavelengths tosome environmental parameters [Ulaby et al., 1986].
As shown in Figure 2, for the frequencies below10 GHz, the lower the frequency, the higher the sen-sitivity to the salinity. In addition, in the saline soilswith a low to high salinity, the brightness tempera-
C. R. Géoscience, 2020, 352, n 2, 127-138
132 Mohammad Hossein Merrikhpour and Majid Rahimzadegan
ture at frequencies below 10 GHz in the vertical po-larization is higher than that in the horizontal polar-ization [McColl et al., 2012]. Therefore, the differencein the brightness temperature between vertical andhorizontal polarizations in this frequency range canbe used to detect the soil salinity. Since the lowest fre-quency in the AMSR2 images is 6.93 GHz channel, inthis research the brightness temperature of this bandin the horizontal and vertical polarizations was usedas the determinant parameter to identify the salinesoil.
To investigate the difference in the brightnesstemperatures of the vertical and horizontal polariza-tions in the saline soils, the MPDI19, and the ratioof the brightness temperature in the vertical to thehorizontal polarizations (T Bv /T Bh) at 6 GHz bandwere considered. The MPDI is a vegetation index inthe microwave wavelength range that has been usedin many studies. It is shown in (1) [Chen et al., 2014,Jackson and Schmugge, 1991, Njoku and Li, 1999]:
MPDI = T Bv −T Bh
T Bv +T Bh(1)
In which T Bv and T Bh are the brightness temper-atures in the vertical and horizontal polarizations,respectively. According to (1), the higher the differ-ence between the brightness temperatures in the ver-tical and horizontal polarizations, the higher valuethe MPDI shows.
On the other hand, in the early studies, it was ob-served that the TPW value obtained from the algo-rithm based on the microwave brightness tempera-ture in areas with high soil salinity shows a highervalue than the real value. This higher value can bedue to high dielectric coefficient of the saline soil andthe high sensitivity of the microwave frequencies tothis parameter [Lasne et al., 2008]. Therefore, in thisresearch, the TPW obtained from AMSR2 images isalso used along with the mentioned indicators as an-other determinant parameter for saline soil detec-tion.
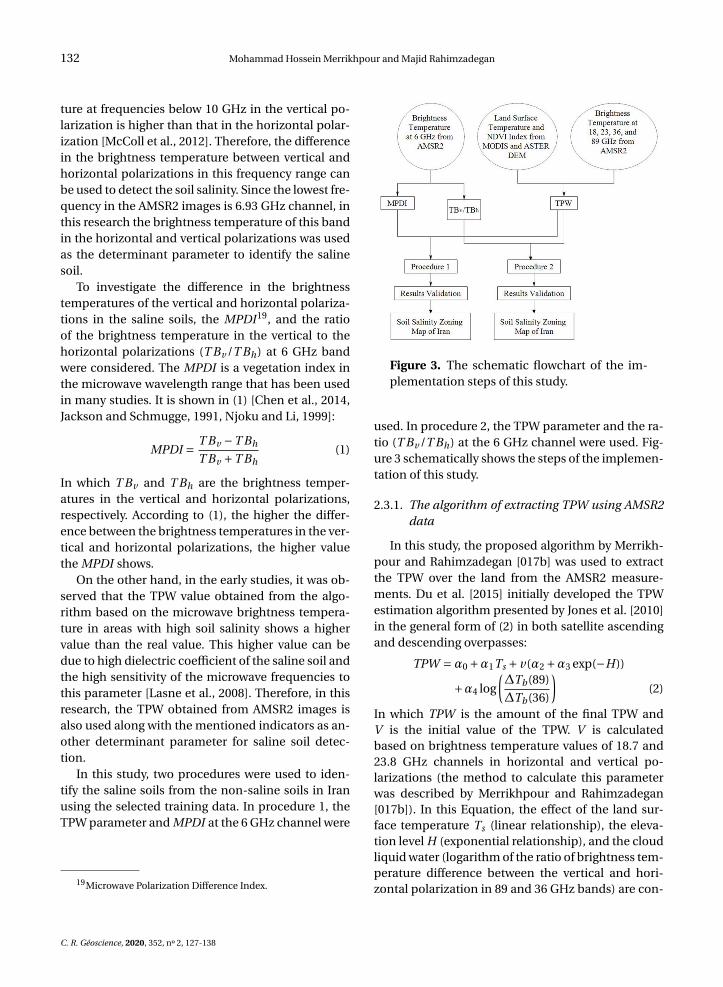
In this study, two procedures were used to iden-tify the saline soils from the non-saline soils in Iranusing the selected training data. In procedure 1, theTPW parameter and MPDI at the 6 GHz channel were
19Microwave Polarization Difference Index.
Figure 3. The schematic flowchart of the im-plementation steps of this study.
used. In procedure 2, the TPW parameter and the ra-tio (T Bv /T Bh) at the 6 GHz channel were used. Fig-ure 3 schematically shows the steps of the implemen-tation of this study.
2.3.1. The algorithm of extracting TPW using AMSR2data
In this study, the proposed algorithm by Merrikh-pour and Rahimzadegan [017b] was used to extractthe TPW over the land from the AMSR2 measure-ments. Du et al. [2015] initially developed the TPWestimation algorithm presented by Jones et al. [2010]in the general form of (2) in both satellite ascendingand descending overpasses:
TPW =α0 +α1Ts + v(α2 +α3 exp(−H))
+α4 log
(∆Tb(89)
∆Tb(36)
)(2)
In which TPW is the amount of the final TPW andV is the initial value of the TPW. V is calculatedbased on brightness temperature values of 18.7 and23.8 GHz channels in horizontal and vertical po-larizations (the method to calculate this parameterwas described by Merrikhpour and Rahimzadegan[017b]). In this Equation, the effect of the land sur-face temperature Ts (linear relationship), the eleva-tion level H (exponential relationship), and the cloudliquid water (logarithm of the ratio of brightness tem-perature difference between the vertical and hori-zontal polarization in 89 and 36 GHz bands) are con-
C. R. Géoscience, 2020, 352, n 2, 127-138
Mohammad Hossein Merrikhpour and Majid Rahimzadegan 133
sidered. Merrikhpour and Rahimzadegan [017b] rep-resented (3) to estimate the TPW parameter in Iranusing the AMSR2 ascending overpass. This was ac-complished by adding the effect of the NDVI as an ex-ponential relationship to the (2) and calculating thelocal coefficients as:
TPW =−7.3+0.27Ts +V (0.15+0.24exp(−H))
−11.59log
(∆Tb(89)
∆Tb(36)
)+7.49(N DV Imean)−0.143
(3)
2.3.2. Saline soil pixels identification
As mentioned in this study, three parametersMPDI at 6 GHz, the ratio (T Bv /T Bh) at 6 GHz, andTPW are used to identify saline soils. For this purpose,the optimal threshold of these parameters must becalculated. In procedure 1 based on the values of theTPW and MPDI at 6 GHz using the training data, theoptimal thresholds of these two parameters were cal-culated to separate the saline soils from non-salinesoils. If at a pixel the values of the TPW and MPDI arehigher than the calculated threshold values simulta-neously, then that point was considered as the salinesoil. In procedure 2, the extracted TPW and the ra-tio (T Bv /T Bh) at 6 GHz were used. After acquiredthresholds were implemented, a saline soil map wasproduced for each of the selected 80 satellite images.Then, the point which was assigned as the saline soilin the whole of 80 images was considered as a salinesoil.
2.3.3. Results evaluation method
To evaluate the results of the saline and non-salinesoil classification, the error matrix was produced us-ing the test data, with overall accuracy and kappacoefficient [Congalton and Green, 2008, Vieira et al.,2004] extracted. Equations (4) and (5) were utilized tocalculate the overall accuracy and kappa coefficient,respectively [Congalton and Green, 2008]:
Overall accuracy =∑r
i=1 xi i
N(4)
where N is the total number of test data, r denotesthe number of classes, and xi i is the main diagonal
value of the error matrix.
Kappa coefficient
= Observed accuracy−Chance agreement
1−Chance agreement
= N∑r
i=1 xi i −∑ri=1(xi+×x+i )
N 2 −∑ri=1(xi+×x+i )
(5)
where xi+ and x+i are the total number of data in rowand column i, respectively.
3. Results and discussion
Initially, two assumptions were evaluated:(1) In the saline soil pixels, the brightness temper-
ature at 6 GHz channel in the vertical polarization ishigher than that in the horizontal polarization.
(2) The TPW in the pixels with the saline soils hashigher value than that in the non-saline pixels.
The evaluation was accomplished at two salineand non-saline points with approximately the sameground elevation that are fairly near each other infifteen days from the four seasons of 2015–2016. Theresults are shown in Table 1 and corresponding chartsare shown in Figure 4.
According to Table 1 and Figure 4, it is clearthat the TPW, MPDI, and T Bv /T Bh in the 6 GHzchannel are significantly higher at the selected salinepoints than those in the non-saline points in all thefour seasons of 2015–2016 (other selected points alsohad similar results). These investigations confirmedthe sensitivity of the TPW parameter and the bright-ness temperature difference between the vertical andhorizontal polarization in the 6 GHz band to thesalinity of the soils.
Therefore, in order to detect the saline pixels fromthe non-saline ones, in procedure 1, the TPW andMPDI and in procedure 2, the TPW and the ratioT Bv /T Bh at 6 GHz band, were calculated. Using theextracted training data from Figure 1, in procedure1, the threshold values of the TPW and MPDI and inprocedure 2, the threshold values of TPW and the ra-tio T Bv /T Bh at 6 GHz channel were calculated. Theresults of the calculations showed that in procedure1, the threshold values of the TPW and MPDI at 6 GHzwere 11.7 mm and 0.08, respectively. For the proce-dure 2, threshold values of the TPW and the ratioT Bv /T Bh at 6 GHz were acquired to be 11.7 mm and1.17, respectively.
In order to evaluate the results of the soil salinitydetection using the optimal thresholds, pixels were
C. R. Géoscience, 2020, 352, n 2, 127-138

134 Mohammad Hossein Merrikhpour and Majid Rahimzadegan
Figure 4. The results of the comparison between two saline and non-saline points in 15 days from the 4seasons of 2015–2016, (a) TPW, (b) MPDI index, and (c) Ratio (T Bv /T Bh) at 6 GHz band.
Table 1. The results of the comparison of the TPW, MPDI, and (T Bv /T Bh) at the 6 GHz channel for twosaline and non-saline points in 15 days from the four seasons of 2015–2016
Daynumber
Date SalineTPW
Non-salineTPW
SalineMPDI
Non-salineMPDI
Saline(T Bv6/T Bh6)
Non-saline(T Bv6/T Bh6)
1 3-May 2015 20.58 15.54 0.05 0.04 1.12 1.09
2 5-May 2015 16.13 14.38 0.06 0.03 1.12 1.05
3 7-May 2015 22.87 12.93 0.11 0.02 1.24 1.03
4 10-May 2015 20.09 11.74 0.09 0.02 1.2 1.03
5 4-Jul 2015 24.16 16.97 0.07 0.02 1.15 1.04
6 8-Jul 2015 23.58 22.29 0.08 0.04 1.17 1.07
7 13-Jul 2015 21.63 20.98 0.07 0.03 1.16 1.06
8 15-Jul 2015 23.91 21.54 0.08 0.04 1.16 1.09
9 4-Nov 2015 13.89 8.04 0.16 0.02 1.37 1.05
10 11-Nov 2015 13.63 2.01 0.14 0.02 1.32 1.04
11 13-Nov 2015 14.27 2.99 0.13 0.02 1.3 1.03
12 14-Nov 2015 13.3 4.06 0.11 0.02 1.26 1.04
13 3-Jan 2016 7.31 4.86 0.09 0.03 1.2 1.06
14 7-Jan 2016 16.64 6.24 0.11 0.03 1.24 1.07
15 14-Jan 2016 12.77 2.15 0.14 0.03 1.33 1.06
classified into the saline and non-saline soil and theresults were evaluated with the extracted test data
from Figure 1. The overall accuracy and kappa coeffi-cient in the classification of the saline and non-saline
C. R. Géoscience, 2020, 352, n 2, 127-138

Mohammad Hossein Merrikhpour and Majid Rahimzadegan 135
Figure 5. Detected points as saline soil in thestudy area based on procedure 1.
Figure 6. Detected points as saline soil in thestudy area based on procedure 2.
soil in procedure 1 were calculated to be 0.865 and0.715, respectively which are acceptable values (Ta-ble 2). The overall accuracy and Kappa coefficient inprocedure 2 were calculated to be 0.809 and 0.607, re-spectively (Table 3).
According to the results of Tables 2 and 3, it wasconcluded that the calculated overall accuracy andKappa coefficient in procedure 1 were higher thanthose in procedure 2. The results of both procedureswere used to provide a map of the saline soils areas inthe study area. Figures 5 and 6 show the saline pointsdetected in the study area, using the thresholds of theprocedures 1 and 2, respectively.
According to Figures 5 and 6, and comparing themwith Figure 1 (as the evaluation map), it is proved thatthe pattern of identified points with the saline soil,
especially in areas with severe salinity, is approxi-mately the same in both procedures. However, in Fig-ure 6 more points with the saline soil were detectedcompared with those in Figure 5. Most of the areascontaining the saline soils in Iran were detected inthe center of Iran (central desert), the southwest, andthe southern coastline.
The uncertainty in Figures 5 and 6 correspondsto the detection of the northern coastline of Iran aswell as Lake Urmia as the saline areas. The first un-certainty can be due to the presence of the coast andthe presence of the saline water in the coastal areas.The second uncertainty is due to the abundant saltin the semi-dry Lake of Urmia, which in some areascontains the pure salt and in some areas the mixtureof water and salt.
4. Conclusion
The soil salinity is one of the important issues in thewater resources management and agriculture, es-pecially in the arid and semi-arid countries. Hence,it is very important to use different data sources toidentify this phenomenon on a large spatial scalesuch as a remote sensing tool. Then, the purpose ofthis study was to detect and prepare the saline soilmap in Iran with the synergistic use of the opticaland microwave remote sensing data. To identify thisphenomenon, the TPW parameter obtained fromthe AMSR2 and MODIS images, the MPDI at thefrequency of the 6 GHz, and the ratio of brightnesstemperatures in the vertical to horizontal polariza-tion at 6 GHz frequency of AMSR2 were used. Imple-mentations were carried out in two procedures for80 days from four seasons 2015–2016. Using trainingdata, in procedure 1, the optimal threshold for theTPW parameter and the MPDI in the 6 GHz channelwas calculated. In procedure 2, the optimal thresholdfor TPW parameter and the ratio (T Bv /T Bh) in the6 GHz band were calculated. Then, the proposedindices of the both procedures were calculated.Afterwards, pixels which exceeding the calculatedthresholds were considered to be points with thesaline soil.
To evaluate the accuracy of the results, by usingtest data, the overall accuracy and kappa coefficientwere extracted from the error matrix. The overall ac-curacy and Kappa coefficient in procedure 1 were0.865 and 0.715, respectively, and in procedure 2 were
C. R. Géoscience, 2020, 352, n 2, 127-138

136 Mohammad Hossein Merrikhpour and Majid Rahimzadegan
Table 2. Error matrix results in procedure 1
Classes Saline Non-saline Total User’s accuracy
Saline 40 9 49 0.816
Non-Saline 8 69 77 0.896
Total 48 78 126 Overall accuracy Total
0.865 0.715
Table 3. Error matrix results in procedure 2
Classes Saline Non-saline Total User’s accuracy
Saline 40 9 49 0.816
Non-Saline 15 62 77 0.805
Total 55 71 126 Overall Accuracy Total
0.809 0.607
0.809 and 0.607, respectively. At the end, the pointswhich were assigned as saline soil in the whole ofthe selected 80 days in the study area by implement-ing the calculated threshold values in the both pro-cedures were considered as the drawing a final salinemap.
Most saline areas identified in Iran were locatedin the central (central desert), the southwestern(Khuzestan province), and the southern coast ofIran. One of the advantages of this study is utilizingthe brightness temperatures of the AMSR2 in 5 chan-nels (6, 18, 23, 36 and 89 GHz) in the horizontal andvertical polarization in the saline soil detection alongwith MODIS bands. Using this innovative methodand importing a limited number of training datafrom saline and non-saline soil points in differentregions, we find it possible to present a soil salinityzonation map using satellite data, which has notbeen done in previous studies. Since Iran is a coun-try with different climates and the intensity of soilsalinity varies in different regions, the purpose of thisstudy was to classify saline and non-saline soils. Infuture studies, it is recommended that, on a smallspatial scale, by using the indices introduced in thisstudy and soil salinity ground data such as EC andSodium Absorption Ratio, a relationship is proposedto predict soil salinity parameters.
References
Ackerman, S. et al. (2010). Discriminating clear-skyfrom cloud with modis algorithm theoretical basisdocument (MOD35) Version 6.1. Cooperative Insti-tute for Meteorological Satellite Studies, Universityof Wisconsin–Madison: Madison, WI, USA.
Al-Yaari, A. et al. (2014). Global-scale evaluation oftwo satellite-based passive microwave soil mois-ture datasets (SMOS and AMSR-E) with respect toLand Data Assimilation System estimates. RemoteSens. Environ., 149:181–195.
Alhammadi, M. and Glenn, E. (2008). Detect-ing date palm trees health and vegetation green-ness change on the eastern coast of the UnitedArab Emirates using SAVI. Int. J. Remote Sens.,29(6):1745–1765.
Bobrov, P. P. (1999). Estimating of soil salinityby passive microwave observations at C band,IEEE 1999 International Geoscience and RemoteSensing Symposium. In IGARSS’99 (Cat. No.99CH36293), pages 1105–1107. IEEE.
Bouaziz, M., Matschullat, J., and Gloaguen, R. (2011).Improved remote sensing detection of soil salinityfrom a semi-arid climate in Northeast Brazil. C. R.Geosci., 343(11):795–803.
Chen, X. et al. (2014). Mapping global surfaceroughness using AMSR-E passive microwave re-mote sensing. Geoderma, 235:308–315.
Chi, T., Li, B., Mu, L., and Cao, G. (2017). Applicationstudy of the microwave emissivity spectra in the
C. R. Géoscience, 2020, 352, n 2, 127-138

Mohammad Hossein Merrikhpour and Majid Rahimzadegan 137
estimation of salt content of saline soil. ProcediaComput. Sci., 107:727–732.
Congalton, R. G. and Green, K. (2008). Assessing theAccuracy of Remotely Sensed Data: Principles andPractices. CRC Press.
Deeter, M. N. (2007). A new satellite retrieval methodfor precipitable water vapor over land and ocean.Geophys. Res. Lett., 34(2):1–5.
Du, J., Kimball, J. S., and Jones, L. A. (2015). Satel-lite microwave retrieval of total precipitable wa-ter vapor and surface air temperature over landfrom AMSR2. IEEE Trans. Geosci. Remote Sens.,53(5):2520–2531.
Eklund, P. W. (1998). Data mining and soil salinityanalysis. Int. J. Geogr. Inf. Sci., 12(3):247–268.
Eldeiry, A. and Garcia, L. A. (2008). Detecting soilsalinity in alfalfa fields using spatial modeling andremote sensing. Soil Sci. Soc. Am. J., 72(1):201–211.
Fernandez-Buces, N., Siebe, C., Cram, S., and Palacio,J. (2006). Mapping soil salinity using a combinedspectral response index for bare soil and vegeta-tion: a case study in the former lake Texcoco, Mex-ico. J. Arid Environ., 65(4):644–667.
Frouin, R., Deschamps, P. Y., and Lecomte, P. (1990).Determination from space of atmospheric totalwater vapor amounts by differential absorptionnear 940 nm: theory and airborne verification.J. Appl. Meteorol. Climatol., 29(6):448–460.
Gao, B. C. and Kaufman, Y. J. (2003). Water va-por retrievals using Moderate Resolution ImagingSpectroradiometer (MODIS) near-infrared chan-nels. J. Geophys. Res., 108(D13):1–10.
García-Mora, T. J., Mas, J. F., and Hinkley, E. A. (2012).Land cover mapping applications with MODIS:a literature review. Int. J. Digit. Earth, 5(1):63–87.
Ghassemi, F., Jakeman, A. J., and Nix, H. A. (1995).Salinisation of Land and Water Resources: Hu-man Causes, Extent, Management and Case Stud-ies. CAB International.
Gong, H., Shao, Y., Brisco, B., Hu, Q., and Tian, W.(2013). Modeling the dielectric behavior of salinesoil at microwave frequencies. Can. J. RemoteSens., 39(1):17–26.
Goossens, R. and Van Ranst, E. (1998). The use ofremote sensing to map gypsiferous soils in the Is-mailia Province (Egypt). Geoderma, 87(1):47–56.
Jabbar, M. T. and Chen, X. (2008). Land degradationdue to salinization in arid and semi-arid regionswith the aid of geo-information techniques. Geo.
Spat. Inf. Sci., 11(2):112–120.Jackson, T. and Schmugge, T. (1991). Vegetation ef-
fects on the microwave emission of soils. RemoteSens. Environ., 36(3):203–212.
JAXA (2018). The website of AMSR2 Data, Available:https://gcom-w1.jaxa.jp/auth.html.
Jones, L. A. et al. (2010). Satellite microwave remotesensing of daily land surface air temperature min-ima and maxima from AMSR-E. IEEE J. Sel. TopAppl. Earth Obs. Remote Sens., 3(1):111–123.
Justice, C. et al. (2002). An overview of MODIS Landdata processing and product status. Remote Sens.Environ., 83(1):3–15.
Kachi, M., Hori, M., Maeda, T., and Imaoka, K. (2014).Status of validation of AMSR2 on board the GCOM-W1 satellite. In 2014 IEEE Geoscience and RemoteSensing Symposium, pages 110–113. IEEE.
Lasne, Y. et al. (2008). Effect of salinity on the dielec-tric properties of geological materials: implicationfor soil moisture detection by means of radar re-mote sensing. IEEE Trans. Geosci. Remote Sens.,46(6):1674–1688.
Li, J. et al. (2014). Soil salinization research in China:advances and prospects. J. Geogr. Sci., 24(5):943–960.
Lobell, D. et al. (2010). Regional-scale assessment ofsoil salinity in the Red River Valley using multi-yearMODIS EVI and NDVI. J. Environ. Qual., 39(1):35–41.
Madani, A. A. (2005). Soil salinity detection and mon-itoring using Landsat data: A case study from SiwaOasis, Egypt. GIsci Remote Sens., 42(2):171–181.
Matinfar, H. R., Alavi Panah, S. K., Zand, F., and Kho-daei, K. (2013). Detection of soil salinity changesand mapping land cover types based upon re-motely sensed data. Arab. J. Geosci., 6(3):913–919.
McColl, K. A. et al. (2012). Soil salinity impacts on L-band remote sensing of soil moisture. IEEE Geosci.Remote S, 9(2):262–266.
Merrikhpour, M. H. and Rahimzadegan, M. (2017a).Improving the algorithm of extracting regionaltotal precipitable water vapor over land fromMODIS images. IEEE Trans. Geosci. Remote Sens.,55(10):5889–5898.
Merrikhpour, M. H. and Rahimzadegan, M. (2017b).An Introduction to an Algorithm for Extracting Pre-cipitable Water Vapor Over Land From AMSR2 Im-ages. IEEE J. Sel. Top Appl. Earth Obs. Remote Sens.,10(9):3975–3984.
C. R. Géoscience, 2020, 352, n 2, 127-138
138 Mohammad Hossein Merrikhpour and Majid Rahimzadegan
Metternicht, G. and Zinck, A. (2008). Remote Sensingof Soil Salinization: Impact on Land Management.CRC Press.
Metternicht, G. and Zinck, J. (2003). Remote sensingof soil salinity: potentials and constraints. RemoteSens. Environ., 85(1):1–20.
NASA (2018a). The website of ASTER Data, Available:https://asterweb.jpl.nasa.gov/gdem-wist.asp.
NASA (2018b). The website of MODIS Data, Available:https://ladsweb.nascom.nasa.gov.
Njoku, E. G. and Li, L. (1999). Retrieval of landsurface parameters using passive microwave mea-surements at 6–18 GHz. IEEE Trans. Geosci. RemoteSens., 37(1):79–93.
Qureshi, A. S., Qadir, M., Heydari, N., Turral, H., andJavadi, A. (2007). A Review of Management Strate-gies for Salt-Prone Land and Water Resources inIran. IWMI.
Rahimzadegan, M. and Mobasheri, M. R. (2011). Anattempt for improving MODIS atmospheric tem-perature profiles products inclear sky. Meteorol.Appl., 18(2):181–187.
Seemann, S. W., Li, J., Menzel, W. P., and Gumley,L. E. (2003). Operational retrieval of atmospherictemperature, moisture, and ozone from MODIS in-frared radiances. J. Appl. Meteorol., 42(8):1072–1091.
Tachikawa, T. et al. (2011). ASTER Global DigitalElevation Model Version 2-Summary of ValidationResults. NASA.
Taghizadeh-Mehrjardi, R., Minasny, B., Sarmadian, F.,and Malone, B. (2014). Digital mapping of soilsalinity in Ardakan region, central Iran. Geoderma,213:15–28.
Ulaby, F., Moore, R., and Fung, A. (1986). MicrowaveRemote Sensing Active and Passive, Volume III:From Theory to Applications. Artec House Inc.
Verma, K., Saxena, R., Barthwal, A., and Deshmukh,S. (1994). Remote sensing technique for mapping
salt affected soils. Int. J. Remote Sens., 15(9):1901–1914.
Vieira, C., Mather, P., and Aplinb, P. (2004). Assessingthe positional and thematic accuracy of remotelysensed data. In Proceedings XXth Congress of theInternational Society for Photogrammetry and Re-mote Sensing (ISPRS), pages 979–984. Geo-imageryBridging Continents.
Wang, D., Poss, J., Donovan, T., Shannon, M., andLesch, S. (2002). Biophysical properties andbiomass production of elephant grass under salineconditions. J. Arid. Environ., 52(4):447–456.
Wang, F., Chen, X., Luo, G., Ding, J., and Chen, X.(2013). Detecting soil salinity with arid fractionintegrated index and salinity index in feature spaceusing Landsat TM imagery. J. Arid. Land., 5(3):340–353.
Wu, J., Vincent, B., Yang, J., Bouarfa, S., and Vidal, A.(2008). Remote sensing monitoring of changes insoil salinity: a case study in Inner Mongolia, China.Sensors, 8(11):7035–7049.
Wu, Q., Liu, H., Wang, L., and Deng, C. (2016). Evalua-tion of AMSR2 soil moisture products over the con-tiguous United States using in situ data from theInternational Soil Moisture Network. Int. J. Appl.Earth Obs. Geoinf., 45:187–199.
Yahiaoui, I., Douaoui, A., Zhang, Q., and Ziane, A.(2015). Soil salinity prediction in the Lower Che-liff plain (Algeria) based on remote sensing and to-pographic feature analysis. J. Arid. Land., 7(6):794–805.
Zhang, T. T. et al. (2011). Using hyperspectral vegeta-tion indices as a proxy to monitor soil salinity. Ecol.Indic., 11(6):1552–1562.
Zhang, T. T. et al. (2015). Detecting soil salinity withMODIS time series VI data. Ecol. Indic., 52:480–489.
Zhou, F. C., Song, X., Leng, P., Wu, H., and Tang, B. H.(2016). An algorithm for retrieving precipitablewater vapor over land based on passive microwavesatellite data. Adv. Meteorol., 2016:1–12.
C. R. Géoscience, 2020, 352, n 2, 127-138