a system for imaging the regulatory noncoding xist rna in living
TRANSCRIPT

2634 | K. Ng et al. Molecular Biology of the Cell
A system for imaging the regulatory noncoding Xist RNA in living mouse embryonic stem cellsKaren Nga, Nathalie Daigleb, Aurélien Bancaudc,d, Tatsuya Ohhatae, Peter Humphreyse, Rachael Walkere, Jan Ellenbergb, and Anton Wutza,e
aResearch Institute of Molecular Pathology, 1030 Vienna, Austria; bCell Biology and Biophysics Unit, European Molecular Biology Laboratory, 69117 Heidelberg, Germany; cLaboratoire d’Analyse et d’Architecture des Systèmes, Centre National de la Recherche Scientifique, F-31077 Toulouse, France; dUniversité Toulouse III–Paul Sabatier, Institut National des Sciences Appliquées, Institut National Polytechnique, Institut Supérieur de l’Aéronautique et de l’Espace, and Laboratoire d’Analyse et d’Architecture des Systèmes, F-31077 Toulouse, France; eWellcome Trust Centre for Stem Cell Research, Cambridge CB2 1QR, United Kingdom
This article was published online ahead of print in MBoC in Press (http://www .molbiolcell.org/cgi/doi/10.1091/mbc.E11-02-0146) on May 25, 2011.Address correspondence to: Anton Wutz ([email protected]) or Jan Ellenberg ([email protected]).Abbreviations used: Dox, doxycycline; ES, embryonic stem; FCS, fluorescence correlation spectroscopy; FRAP, fluorescence recovery after photobleaching; GFP, green fluorescent protein; Xi, inactive X chromosome. © 2011 Ng et al. This article is distributed by The American Society for Cell Biol-ogy under license from the author(s). Two months after publication it is available to the public under an Attribution–Noncommercial–Share Alike 3.0 Unported Creative Commons License (http://creativecommons.org/licenses/by-nc-sa/3.0).“ASCB®,“ “The American Society for Cell Biology®,” and “Molecular Biology of the Cell®” are registered trademarks of The American Society of Cell Biology.
ABSTRACT In mammals, silencing of one of the two X chromosomes in female cells compen‑sates for the different number of X chromosomes between the sexes. The noncoding Xist RNA initiates X chromosome inactivation. Xist spreads from its transcription site over the X chromosome territory and triggers the formation of a repressive chromatin domain. To un‑derstand localization of Xist over one X chromosome we aimed to develop a system for in‑vestigating Xist in living cells. Here we report successful visualization of transgenically ex‑pressed MS2‑tagged Xist in mouse embryonic stem cells. Imaging of Xist during an entire cell cycle shows that Xist spreads from a single point to a steady state when the chromosome is covered with a constant amount of Xist. Photobleaching experiments of the established Xist cluster indicate that chromosome‑bound Xist is dynamic and turns over on the fully Xist cov‑ered chromosome. It appears that in interphase the loss of bound Xist and newly produced Xist are in equilibrium. We also show that the turnover of bound Xist requires transcription, and Xist binding becomes stable when transcription is inhibited. Our data reveal a strategy for visualizing Xist and indicate that spreading over the chromosome might involve dynamic binding and displacement.
INTRODUCTIONIn mammals the dosage difference that arises from the different number of X chromosomes between the sexes is compensated by X inactivation (Heard and Disteche, 2006; Payer and Lee, 2008). Early in female development one of the two X chromosomes is selected for inactivation in a random manner. This process involves counting the number of X chromosomes, choosing which chromosome to inactivate, and keeping the other X active in a reciprocal manner (Minks and Brown, 2009; Barakat et al., 2010). Chromosome-wide
inactivation of one X chromosome requires the noncoding Xist RNA (Borsani et al., 1991; Brockdorff et al., 1991; Brown et al., 1991a, 1991b). Xist is expressed from the future inactive X chromosome (Xi) and spreads over the X chromosome territory (Clemson et al., 1996). Thereby, Xist serves as a paradigm for studying noncoding RNA function in regulating chromatin organization.
The process of random X inactivation is recapitulated during the differentiation of female mouse embryonic stem (ES) cells. ES cells have therefore been extensively used for studying the mechanism of Xist function. Accumulation of Xist over the chromosome leads to the exclusion of RNA polymerase II and factors associated with tran-scription and splicing from the X chromosome nuclear domain (Okamoto et al., 2004; Chaumeil et al., 2006). Loss of activating histone modifications and recruitment of Polycomb group com-plexes lead to the formation of a repressive compartment (Chaumeil et al., 2002, 2006). Subsequently, chromatin modifications, includ-ing trimethylation of histone H3 lysine 27 and ubiquitination of histone H2A, contribute to the establishment of facultative hetero-chromatin on the Xi (Heard and Bickmore, 2007). It has been shown that the formation of a repressive compartment can be separated
Monitoring EditorA. Gregory MateraUniversity of North Carolina
Received: Feb 25, 2011Revised: Apr 19, 2011Accepted: May 16, 2011
MBoC | ARTICLE
Volume 22 July 15, 2011 Imaging of Xist RNA in living cells | 2635
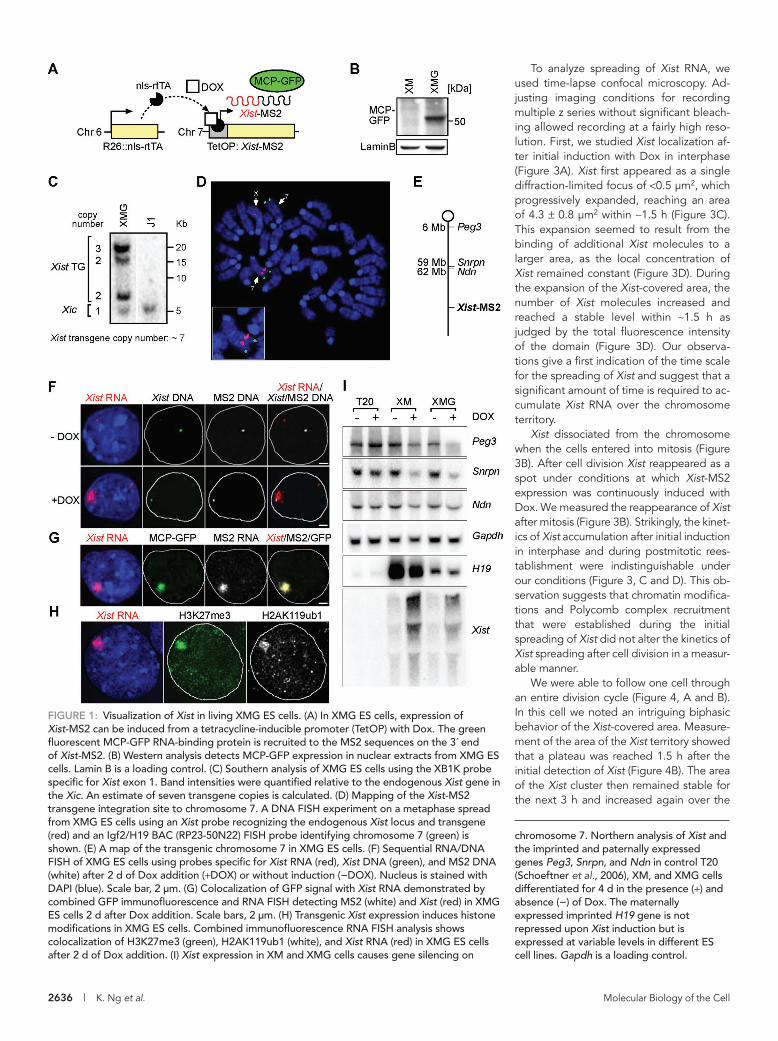
and forms a complex with picomolar binding affinity (Lowary and Uhlenbeck, 1987). We introduced 24 C-variant MS2-binding sites (5´-ACAUGAGGAUCACCCAUGU-3´) at the 3´ end of Xist (Xist-MS2). For regulating Xist-MS2 expression we used a tetracycline-inducible promoter. Similar transgenes have been shown previously to reca-pitulate silencing on autosomes in male mouse ES cells (Wutz and Jaenisch, 2000; Tang et al., 2010). The Xist-MS2 transgene was in-troduced into J1:R26/N-nlsrtTA ES cells (Wutz and Jaenisch, 2000), which contained a tetracycline-inducible transactivator expressed from the ubiquitous ROSA26 locus (Figure 1A). Subsequently a transgene for expression in the MS2 RNA-binding protein green fluorescent protein (GFP) fusion (MCP-GFP) (Bertrand et al., 1998; Fusco et al., 2003, 2004; Janicki et al., 2004) was introduced into these XM ES cells (Figure 1B). The resulting XMG ES cells contained seven copies of the Xist-MS2 transgene integrated into a single site in the distal third of chromosome 7 (Figure 1, C–E).
We verified Xist expression by RNA fluorescence in situ hy-bridization (FISH) analysis using probes specific for Xist and MS2 sequences. Xist-MS2 accumulated in the vicinity of its transcrip-tion site upon induction of expression with doxycycline (Dox; Figure 1F). Importantly, the Xist domain could also be observed by immunostaining with an antibody detecting the RNA-binding MCP-GFP fusion protein in XMG ES cells, showing that the MS2 RNA tag on Xist-MS2 was recognized by the MS2 RNA-binding protein in living cells (Figure 1G).
To determine whether the MS2-modified Xist retained its func-tion, we performed an analysis of chromatin modifications. We ob-served trimethylation of histone H3 lysine 27 and mono-ubiquitina-tion of histone H2A lysine 119 overlapping the Xist-MS2 domain, demonstrating that transgenic Xist-MS2 expression led to epige-netic marks that are associated with X inactivation (Figure 1H). To further assess gene silencing in the autosomal context, we analyzed the expression of several imprinted genes on chromosome 7. Im-printed genes are expressed from one of the parental chromosomes, and therefore repression of genes that are expressed from the Xist-MS2 transgenic chromosome can be measured. We observed re-pression of the paternally expressed imprinted Peg3, Snrpn, and Ndn genes on chromosome 7 upon Xist induction (Figure 1I). In contrast the maternally expressed imprinted H19 gene was not changed upon induction, suggesting that the Xist-MS2 transgene had integrated into the paternally inherited chromosome. Xist-MS2 induction caused strong repression of Snrpn and weaker repression of Peg3. Ndn was slightly repressed. Our data show that Xist-MS2 represses autosomal genes to various degrees. This is consistent with a recent study that comprehensively analyzed gene repression by autosomal Xist transgenes (Tang et al., 2010). Taken together, our observations show that Xist-MS2 retains several aspects of Xist func-tion in an autosomal context.
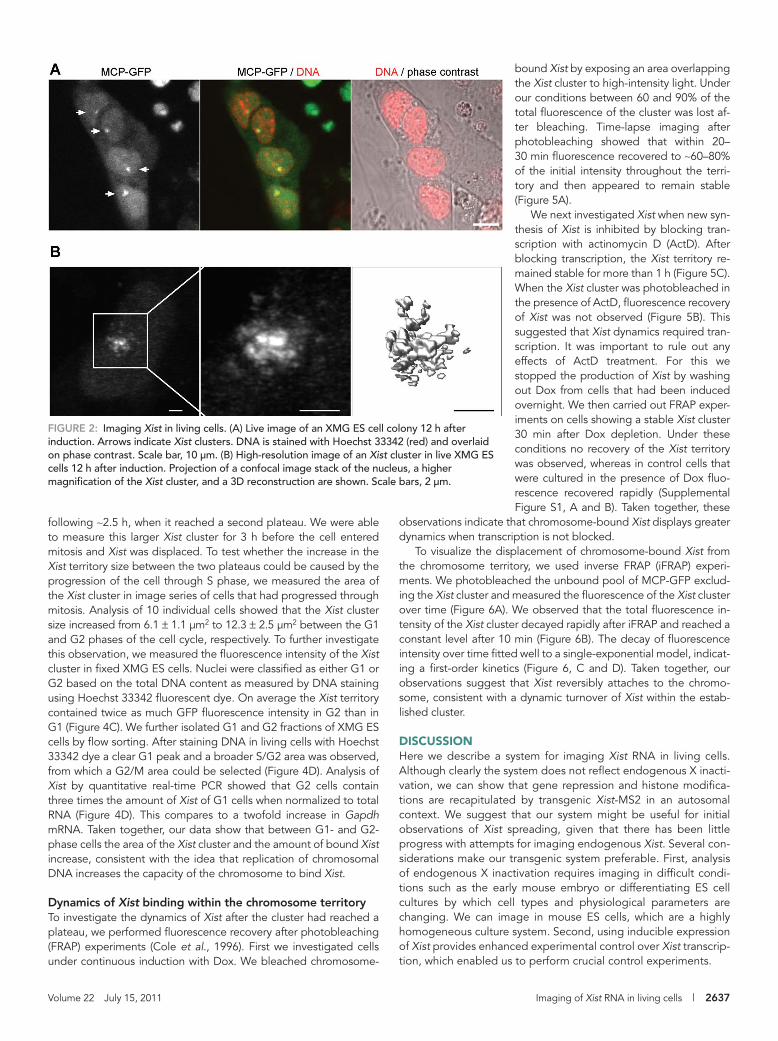
Analysis of Xist localization during the cell cycleWe next attempted to image Xist in living cells. A clearly defined green fluorescent territory was observed in the nucleus of living XMG ES cells after induction with Dox (Figure 2A). The fluorescence signal was low and required optimizing of the imaging conditions to avoid photobleaching. Using a confocal microscope that had been previously optimized for GFP imaging, we were able to capture a z-stack of images at high resolution under low excitation levels. Three-dimensional (3D) reconstruction of confocal images revealed a high density of Xist in the center and small clusters in the periph-ery of the Xist domain, which might reflect a heterogeneous distri-bution of Xist on the chromosome (Figure 2B and Supplemental Movie 1).
from gene silencing by specific mutations within Xist. The 5´ end of Xist that contains the repeat A sequence motif is required for gene repression (Wutz et al., 2002). Expression of Xist with a mutation of repeat A leads to the formation of a repressive compartment with-out initiation of gene repression (Chaumeil et al., 2006; Pullirsch et al., 2010). Recruitment of genes to the repressive compartment requires repeat A and involves additional pathways (Blewitt et al., 2008; Agrelo et al., 2009). From these observations it is clear that localization of Xist over the X chromosome does not require gene silencing. Consistent with this, previous studies have observed that expression of Xist in most differentiated cells does not lead to the initiation of gene silencing, whereas Xist RNA localization appears normal (Beard et al., 1995; Wutz and Jaenisch, 2000; Sado et al., 2004; Savarese et al., 2006).
Xist localization is not dependent on an X chromosomal con-text. Using transgenes, it has been shown that Xist can spread in cis over autosomes and cause repression of at least certain autosomal genes (Lee et al., 1996; Herzing et al., 1997; Heard et al., 1999; Wutz and Jaenisch, 2000; Hall et al., 2002; Chow et al., 2007; Tang et al., 2010). This suggests that X chromosome specific–sequences are not crucial for attachment of Xist to the chromosome. However, analysis of translocation chromosomes indicates that the X chromo-some might be more permissive for Xist spreading (Popova et al., 2006). In interphase Xist localizes to the core of the X chromosome territory that is composed of mainly noncoding sequences and ge-nomic repeats (Chaumeil et al., 2006; Clemson et al., 2006). In par-ticular, long interspersed elements (LINEs) have been implicated in X inactivation (Lyon, 2003; Tang et al., 2010). Taken together, these findings suggest that Xist might initially attach to genomic repeat sequences. Xist has also been shown to be retained in the nuclear matrix when chromatin is extracted (Clemson et al., 1996). The abil-ity of Xist to attach to the nuclear matrix has led to the proposal that Xist performs a structural role associated with the stability of the Xi territory. Consistent with this idea, chromosomal binding of Xist has been shown to be stable with a half-life of between 4 and 8 h when transcription is blocked (Panning et al., 1997; Wutz and Jaenisch, 2000; Sun et al., 2006). Xist localization requires the scaf-fold attachment factor A (SAF-A) gene (Hasegawa et al., 2010). SAF-A has been shown to be associated with the Xi nuclear matrix and contributes to a stable nuclear structure of the Xi in somatic cells (Helbig and Fackelmayer, 2003). The binding of SAF-A on the Xi has been measured under conditions that do not block transcrip-tion and shown to be statically bound with a half-life of over hours (Fackelmayer, 2005). The apparent static binding of Xist and SAF-A to the Xi raises the question of how Xist is distributed from the Xic locus over the chromosome territory.
Here we describe a new tool for studying Xist dynamics and ap-ply it to investigate the mechanism of Xist spreading. By visualizing the noncoding RNA in living mouse embryonic stem cells, we pres-ent data indicating that Xist dynamically associates with the chromo-some.
RESULTSIn vivo labeling of Xist RNA in embryonic stem cellsTo visualize Xist RNA in living cells, we chose a system for fluores-cently labeling RNA in vivo. For this we adopted a strategy of tag-ging Xist with an RNA motif from the MS2 phage that can be bound by an MS2 RNA-binding protein. This system has been used exten-sively in imaging cellular RNAs in a variety of organisms (Bertrand et al., 1998; Fusco et al., 2003, 2004; Janicki et al., 2004). A U-to-C mutation in this RNA sequence (C-variant) has been identified that interacts much more strongly with the MS2-binding protein
2636 | K. Ng et al. Molecular Biology of the Cell
To analyze spreading of Xist RNA, we used time-lapse confocal microscopy. Ad-justing imaging conditions for recording multiple z series without significant bleach-ing allowed recording at a fairly high reso-lution. First, we studied Xist localization af-ter initial induction with Dox in interphase (Figure 3A). Xist first appeared as a single diffraction-limited focus of <0.5 μm2, which progressively expanded, reaching an area of 4.3 ± 0.8 μm2 within ∼1.5 h (Figure 3C). This expansion seemed to result from the binding of additional Xist molecules to a larger area, as the local concentration of Xist remained constant (Figure 3D). During the expansion of the Xist-covered area, the number of Xist molecules increased and reached a stable level within ∼1.5 h as judged by the total fluorescence intensity of the domain (Figure 3D). Our observa-tions give a first indication of the time scale for the spreading of Xist and suggest that a significant amount of time is required to ac-cumulate Xist RNA over the chromosome territory.
Xist dissociated from the chromosome when the cells entered into mitosis (Figure 3B). After cell division Xist reappeared as a spot under conditions at which Xist-MS2 expression was continuously induced with Dox. We measured the reappearance of Xist after mitosis (Figure 3B). Strikingly, the kinet-ics of Xist accumulation after initial induction in interphase and during postmitotic rees-tablishment were indistinguishable under our conditions (Figure 3, C and D). This ob-servation suggests that chromatin modifica-tions and Polycomb complex recruitment that were established during the initial spreading of Xist did not alter the kinetics of Xist spreading after cell division in a measur-able manner.
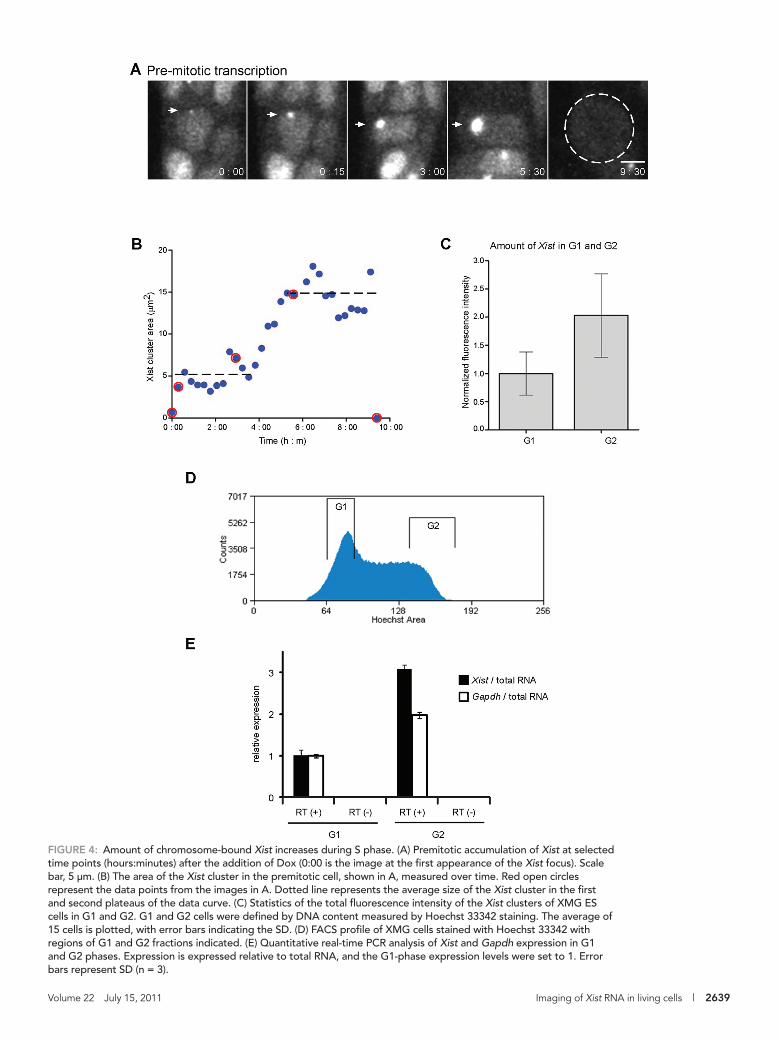
We were able to follow one cell through an entire division cycle (Figure 4, A and B). In this cell we noted an intriguing biphasic behavior of the Xist-covered area. Measure-ment of the area of the Xist territory showed that a plateau was reached 1.5 h after the initial detection of Xist (Figure 4B). The area of the Xist cluster then remained stable for the next 3 h and increased again over the
FIguRE 1: Visualization of Xist in living XMG ES cells. (A) In XMG ES cells, expression of Xist-MS2 can be induced from a tetracycline-inducible promoter (TetOP) with Dox. The green fluorescent MCP-GFP RNA-binding protein is recruited to the MS2 sequences on the 3´ end of Xist-MS2. (B) Western analysis detects MCP-GFP expression in nuclear extracts from XMG ES cells. Lamin B is a loading control. (C) Southern analysis of XMG ES cells using the XB1K probe specific for Xist exon 1. Band intensities were quantified relative to the endogenous Xist gene in the Xic. An estimate of seven transgene copies is calculated. (D) Mapping of the Xist-MS2 transgene integration site to chromosome 7. A DNA FISH experiment on a metaphase spread from XMG ES cells using an Xist probe recognizing the endogenous Xist locus and transgene (red) and an Igf2/H19 BAC (RP23-50N22) FISH probe identifying chromosome 7 (green) is shown. (E) A map of the transgenic chromosome 7 in XMG ES cells. (F) Sequential RNA/DNA FISH of XMG ES cells using probes specific for Xist RNA (red), Xist DNA (green), and MS2 DNA (white) after 2 d of Dox addition (+DOX) or without induction (−DOX). Nucleus is stained with DAPI (blue). Scale bar, 2 μm. (G) Colocalization of GFP signal with Xist RNA demonstrated by combined GFP immunofluorescence and RNA FISH detecting MS2 (white) and Xist (red) in XMG ES cells 2 d after Dox addition. Scale bars, 2 μm. (H) Transgenic Xist expression induces histone modifications in XMG ES cells. Combined immunofluorescence RNA FISH analysis shows colocalization of H3K27me3 (green), H2AK119ub1 (white), and Xist RNA (red) in XMG ES cells after 2 d of Dox addition. (I) Xist expression in XM and XMG cells causes gene silencing on
chromosome 7. Northern analysis of Xist and the imprinted and paternally expressed genes Peg3, Snrpn, and Ndn in control T20 (Schoeftner et al., 2006), XM, and XMG cells differentiated for 4 d in the presence (+) and absence (−) of Dox. The maternally expressed imprinted H19 gene is not repressed upon Xist induction but is expressed at variable levels in different ES cell lines. Gapdh is a loading control.
Volume 22 July 15, 2011 Imaging of Xist RNA in living cells | 2637
bound Xist by exposing an area overlapping the Xist cluster to high-intensity light. Under our conditions between 60 and 90% of the total fluorescence of the cluster was lost af-ter bleaching. Time-lapse imaging after photobleaching showed that within 20–30 min fluorescence recovered to ∼60–80% of the initial intensity throughout the terri-tory and then appeared to remain stable (Figure 5A).
We next investigated Xist when new syn-thesis of Xist is inhibited by blocking tran-scription with actinomycin D (ActD). After blocking transcription, the Xist territory re-mained stable for more than 1 h (Figure 5C). When the Xist cluster was photobleached in the presence of ActD, fluorescence recovery of Xist was not observed (Figure 5B). This suggested that Xist dynamics required tran-scription. It was important to rule out any effects of ActD treatment. For this we stopped the production of Xist by washing out Dox from cells that had been induced overnight. We then carried out FRAP exper-iments on cells showing a stable Xist cluster 30 min after Dox depletion. Under these conditions no recovery of the Xist territory was observed, whereas in control cells that were cultured in the presence of Dox fluo-rescence recovered rapidly (Supplemental Figure S1, A and B). Taken together, these
observations indicate that chromosome-bound Xist displays greater dynamics when transcription is not blocked.
To visualize the displacement of chromosome-bound Xist from the chromosome territory, we used inverse FRAP (iFRAP) experi-ments. We photobleached the unbound pool of MCP-GFP exclud-ing the Xist cluster and measured the fluorescence of the Xist cluster over time (Figure 6A). We observed that the total fluorescence in-tensity of the Xist cluster decayed rapidly after iFRAP and reached a constant level after 10 min (Figure 6B). The decay of fluorescence intensity over time fitted well to a single-exponential model, indicat-ing a first-order kinetics (Figure 6, C and D). Taken together, our observations suggest that Xist reversibly attaches to the chromo-some, consistent with a dynamic turnover of Xist within the estab-lished cluster.
DISCUSSIONHere we describe a system for imaging Xist RNA in living cells. Although clearly the system does not reflect endogenous X inacti-vation, we can show that gene repression and histone modifica-tions are recapitulated by transgenic Xist-MS2 in an autosomal context. We suggest that our system might be useful for initial observations of Xist spreading, given that there has been little progress with attempts for imaging endogenous Xist. Several con-siderations make our transgenic system preferable. First, analysis of endogenous X inactivation requires imaging in difficult condi-tions such as the early mouse embryo or differentiating ES cell cultures by which cell types and physiological parameters are changing. We can image in mouse ES cells, which are a highly homogeneous culture system. Second, using inducible expression of Xist provides enhanced experimental control over Xist transcrip-tion, which enabled us to perform crucial control experiments.
following ∼2.5 h, when it reached a second plateau. We were able to measure this larger Xist cluster for 3 h before the cell entered mitosis and Xist was displaced. To test whether the increase in the Xist territory size between the two plateaus could be caused by the progression of the cell through S phase, we measured the area of the Xist cluster in image series of cells that had progressed through mitosis. Analysis of 10 individual cells showed that the Xist cluster size increased from 6.1 ± 1.1 μm2 to 12.3 ± 2.5 μm2 between the G1 and G2 phases of the cell cycle, respectively. To further investigate this observation, we measured the fluorescence intensity of the Xist cluster in fixed XMG ES cells. Nuclei were classified as either G1 or G2 based on the total DNA content as measured by DNA staining using Hoechst 33342 fluorescent dye. On average the Xist territory contained twice as much GFP fluorescence intensity in G2 than in G1 (Figure 4C). We further isolated G1 and G2 fractions of XMG ES cells by flow sorting. After staining DNA in living cells with Hoechst 33342 dye a clear G1 peak and a broader S/G2 area was observed, from which a G2/M area could be selected (Figure 4D). Analysis of Xist by quantitative real-time PCR showed that G2 cells contain three times the amount of Xist of G1 cells when normalized to total RNA (Figure 4D). This compares to a twofold increase in Gapdh mRNA. Taken together, our data show that between G1- and G2-phase cells the area of the Xist cluster and the amount of bound Xist increase, consistent with the idea that replication of chromosomal DNA increases the capacity of the chromosome to bind Xist.
Dynamics of Xist binding within the chromosome territoryTo investigate the dynamics of Xist after the cluster had reached a plateau, we performed fluorescence recovery after photobleaching (FRAP) experiments (Cole et al., 1996). First we investigated cells under continuous induction with Dox. We bleached chromosome-
FIguRE 2: Imaging Xist in living cells. (A) Live image of an XMG ES cell colony 12 h after induction. Arrows indicate Xist clusters. DNA is stained with Hoechst 33342 (red) and overlaid on phase contrast. Scale bar, 10 μm. (B) High-resolution image of an Xist cluster in live XMG ES cells 12 h after induction. Projection of a confocal image stack of the nucleus, a higher magnification of the Xist cluster, and a 3D reconstruction are shown. Scale bars, 2 μm.

2638 | K. Ng et al. Molecular Biology of the Cell
surprising finding is that the spreading of Xist after initial induction and reestablishment of the Xist cluster after mitosis follow similar kinetics. This observation suggests that chromatin modifications do not have a measurable influence on Xist spreading. One limitation of this result is that we performed our studies in mouse ES cells, where X inactivation is reversible. Therefore our data do not rule out that changes in Xist spreading might be induced after entry into differentiation.
Our live-imaging system afforded us the opportunity to analyze the dynamics of chromosome-bound Xist. Measurements by FRAP and iFRAP indicate that Xist is dynamically bound and is replaced by newly synthesized Xist within the established cluster. This analy-sis critically depends on the stability of the Xist MS2 MCP-GFP interaction. Exchange of MCP-GFP on the Xist-MS2 RNA in the time scale of our measurements could seriously undermine our
Using this system, we have confirmed previous studies of Xist localization in living cells and made several new observations. Con-sistent with earlier work, we show that Xist spreads from a single spot over the chromosome until it is lost at mitosis. We extend previous studies by showing that spreading from a single site leads to saturation of the chromosome with Xist. Our study also gives a first idea of the time required to cover a chromosome with Xist. We determined that Xist accumulated within 1.5 h, which is a significant amount of time at the initiation of X inactivation. We further find that the amount of Xist approximately doubles between G1 and G2 phases of the cell cycle, indicating that the binding capacity is pro-portional to the amount of chromosomal DNA. This is compatible with the idea that distinct DNA sequences such as LINE elements or chromatin regions act as Xist attachment sites and their duplica-tion during replication leads to an increase in Xist binding. One
FIguRE 3: De novo establishment of Xist binding after first induction or mitosis. (A) Confocal images of Xist accumulation at selected time points (hours:minutes) after the addition of Dox (0:00 is the last image before an Xist focus was first detected). Arrows indicate the Xist territory. Scale bar, 5 μm. (B) XMG cells induced with Dox were followed through mitosis (time set to 0:00 at metaphase). Confocal images of Xist accumulation at selected time points (hours:minutes) after mitosis are shown. Arrows indicate the Xist territory. The mitotic cell is outlined with a dotted line. Scale bar, 5 μm. (C) The kinetics of Xist accumulation after initial induction in interphase (blue) and after mitosis (red). The area of the Xist clusters was measured, and the average of 10 cells each is plotted over time. Error bars indicate the SD. (D) The total fluorescence intensity (filled circles) and average fluorescence intensity of the Xist cluster is plotted over time as in C.
Volume 22 July 15, 2011 Imaging of Xist RNA in living cells | 2639
FIguRE 4: Amount of chromosome-bound Xist increases during S phase. (A) Premitotic accumulation of Xist at selected time points (hours:minutes) after the addition of Dox (0:00 is the image at the first appearance of the Xist focus). Scale bar, 5 μm. (B) The area of the Xist cluster in the premitotic cell, shown in A, measured over time. Red open circles represent the data points from the images in A. Dotted line represents the average size of the Xist cluster in the first and second plateaus of the data curve. (C) Statistics of the total fluorescence intensity of the Xist clusters of XMG ES cells in G1 and G2. G1 and G2 cells were defined by DNA content measured by Hoechst 33342 staining. The average of 15 cells is plotted, with error bars indicating the SD. (D) FACS profile of XMG cells stained with Hoechst 33342 with regions of G1 and G2 fractions indicated. (E) Quantitative real-time PCR analysis of Xist and Gapdh expression in G1 and G2 phases. Expression is expressed relative to total RNA, and the G1-phase expression levels were set to 1. Error bars represent SD (n = 3).

2640 | K. Ng et al. Molecular Biology of the Cell
components of fluorescence recovery. When Xist transcription is blocked, fluorescence recovery can only come from the ex-change of bleached for green MCP-GFP molecules on the bound Xist-MS2. We did not observe measurable recovery of fluores-cence within 30 min after FRAP. Results after washout of Dox or actinomycin D transcription inhibition confirm a long-lived in-teraction between the MCP-GFP protein and the MS2-tagged Xist-MS2 in our system. We therefore believe that our observa-tions on the dynamic binding of Xist might be mechanistically relevant.
To obtain an estimate for the half-life of bound Xist in our system we used the loss of fluorescence in our iFRAP experiments. These
analysis. In vitro measurements estimated that the complex of the C-variant MS2 RNA motif and the RNA-binding protein dis-sociates with a half-life of 408 min, or more than 6 h, which would certainly be long enough for measuring in the 30-min interval of our experiment (Lowary and Uhlenbeck, 1987). However, this might be changed in the in vivo context of our experiment. A recent study used a similar system to measure the dynamics of gurken mRNA in Drosophila egg chambers with half-lives in the order of minutes (Jaramillo et al., 2008). In our setup quasi-static binding of Xist when transcription is blocked (Clemson et al., 1996; Wutz and Jaenisch, 2000; Seidl et al., 2006; Sun et al., 2006) can serve as an additional control by separating the two
FIguRE 5: Turnover of Xist RNA within the chromosome territory in steady state. FRAP analysis of Xist dynamics in interphase XMG ES cells without (A) and with (B) ActD. A confocal image sequence (hours:minutes) is shown (left) in gray scale (top) and in pseudocolor (bottom). XMG ES cells were induced for Xist expression for 4 h prior to FRAP analysis, and photobleaching of the entire Xist cluster (circle) was carried out 10 min after the addition of 10 μg/ml ActD. Scale bar, 2 μm. The normalized signal intensity of the Xist cluster after photobleaching is plotted over time (right; n = 9). Error bars indicate the SD. (C) Xist remains stable for at least 80 min after the addition of ActD. Xist cluster intensity in living XMG ES cells normalized to nuclear background intensity is plotted against time. Error bars represent the SD from six cells.

Volume 22 July 15, 2011 Imaging of Xist RNA in living cells | 2641
data fitted well to a single-exponential model where the steady-state Xist concentration in the cluster results from the balance of transcription of new Xist and dissociation of old bound Xist from the territory (Figure 5C). From this a rate of dissociation for Xist of 0.006 ± 0.0007 s−1 was obtained. This corresponds to a residence time of Xist within the chromosome territory on the order of 3 min (Figure 6, C and D). How this dynamics compares to that of the en-dogenous Xist is unclear. It has been reported that Xist is continu-ously transcribed even in differentiated cells (Clemson et al., 1996). Therefore turnover of Xist is expected to be associated with the Xi. Our measurements might provide an upper bound for Xist turnover. Taking into account that a high rate of Xist production from the seven copies of Xist in XMG ES cells almost certainly leads to over-expression of Xist to some degree, it is likely that Xist is less dynamic during normal X inactivation. Furthermore, it is unknown whether the addition of the GFP protein molecules to Xist could have influ-enced its behavior. However, we note that in our transgenic system several features of X inactivation are recapitulated under conditions of highly dynamic Xist turnover.
Our iFRAP measurements consistently give shorter recovery times than our FRAP measurements. This might be explained by the need to bind MCP-GFP molecules to newly transcribed Xist-MS2, whereas the iFRAP experiment measures the dissociation of already MCP-GFP–labeled Xist. This suggests that a significant amount of time is required for MCP-GFP binding, which could involve folding of the MS2 RNA motif and diffusion of MCP-GFP molecules within the chromosome territory. Although dynamics measurements by fluorescence correlation spectroscopy (FCS) in-dicate that MCP-GFP diffusion is not limiting our kinetic measure-ments (Supplemental Figure S2), local effects within the chromo-some territory could lead to diffusion kinetics that differ substantially from the overall measurements in the nucleus. The idea of local effects in MCP-GFP diffusion and binding could eventually explain the fact that we rarely observed more than 80% recovery of the Xist cluster after FRAP. Local binding of bleached MCP-GFP to newly transcribed Xist is a likely explana-tion for this observation. Formally the difference between the ki-netics measured in our FRAP and iFRAP experiments could also be the result of different amounts of light-induced changes or damage of chromatin during photobleaching. However, we con-sider this unlikely, as the low fluorescence signal of the Xist cluster and the nuclear MCP-GFP were easily photobleached with rela-tive low light intensity. Under these conditions nuclear damage can be ruled out, making it unlikely that Xist dynamics was af-fected by photobleaching.
Less than complete recovery of fluorescence also opens up the possibility that a fraction of up to 20% of Xist is stably bound. We do not favor this idea, as a fraction of 20% of Xist would have been eas-ily detected in our iFRAP experiments, where we find no indication. Notably, over 90% of Xist within the cluster becomes stably bound when transcription is arrested, showing that the switch to stable binding is not caused by different populations of Xist.
In our study we observe that the kinetics of Xist within an estab-lished cluster is twice as fast as the initial establishment of the Xist cluster after mitosis or induction of expression. This suggests that
FIguRE 6: Displacement of chromosome-bound Xist. (A) iFRAP analysis of Xist turnover in XMG ES cells. A confocal image series is shown in gray scale (top) and in pseudocolor (bottom). The nuclear pool of MCP-GFP outside the Xist territory was photobleached (white outline). Scale bar, 2 μm. (B) The normalized signal intensity of the iFRAP experiment of the Xist cluster is plotted over time (n = 4). Error bars represent SD. (C) Xist turnover is characterized by its production with rate k1 from the site of transcription and loss due to dissociation off the chromosome with the dissociation constant k2. After dissociation Xist is degraded. In steady state the Xist cluster is stable,
and production and dissociation balance. (D) The normalized signal intensity of the single experiment shown in A is plotted over time. Red open circles indicate data points of the images in A. The data points were fitted to a kinetic model of Xist transcription and dissociation (black line).

2642 | K. Ng et al. Molecular Biology of the Cell
NJ). After further subcloning, a cell line was isolated that allowed imaging of Xist in the majority of cells.
RNA and DNA FISH analysisES cells were attached to poly-l-lysine–coated slides (Sigma-Aldrich, St. Louis, MO) by using a Shandon Cytospin 3 centrifuge (Thermo Fisher Scientific, Waltham, MA). RNA FISH was performed as de-scribed (Wutz and Jaenisch, 2000). Briefly, cells were permeabilized with CSK buffer/0.5% Triton X-100 for 2 min, fixed with 4% para-formaldehyde (PFA) in phosphate-buffered saline (PBS) for 10 min, and dehydrated progressively in ethanol. Hybridizations were per-formed overnight at 37ºC in a dark and humid chamber, followed by washing three times in 50% formamide/2× saline sodium citrate (SSC), three times in 2× SSC for 5 min each at 39ºC, and once in 1× SSC for 10 min at room temperature. Slides were counterstained with 4′,6-diamidino-2-phenylindole (DAPI), mounted with cover-slips, and analyzed. The coordinates of the cells on the slides were recorded on the microscope. Following RNase treatment (100 μg/ml) at 37ºC for 30 min, cells were denatured in 70% forma-mide/2× SSC at 80ºC for 10 min and rinsed in 2× SSC prior to over-night hybridization for sequential DNA FISH. For DNA FISH analy-sis, cells were fixed with methanol-acetic acid (3:1), dropped onto poly-l-lysine–coated slides, denatured at 80ºC for 5 min, and subse-quently hybridized.
Probes were labeled using random priming (PrimeIt; Stratagene, Santa Clara, CA) with cy5-dCTP or cy3-dCTP (Amersham, GE Health-Care, Piscataway, NJ). Xist was excised from ptetOP-Xist-PA (Wutz and Jaenisch, 2000) and MS2 from 24x MS2 (Fusco et al., 2003).
Immunofluorescence and protein analysisImmunofluorescence combined with RNA FISH was performed as described (Chaumeil et al., 2006). For GFP immunofluorescence, cells were fixed for 10 min at room temperature in 4% PFA in PBS, permeabilized for 5 min at room temperature (RT) in 0.1% Na cit-rate/0.1% Triton X-100, and blocked for 60 min at RT in PBS con-taining 5% (wt/vol) bovine serum albumin, 0.1% Tween-20. GFP was detected using a mixture of mouse monoclonal clone 7.1 and 13.1 anti-GFP antibody at 1:500 (#11814460001; Roche, Indianapolis, IN) followed by Alexa A-11034 Fluor 488 goat anti–mouse immuno-globulin G (IgG) (H+L) at 1:500 (Molecular Probes; Invitrogen, Carlsbad, CA). For combined H2AK119ub1/H3K27me3 immuno-fluorescence, cells were preextracted in 100 mM NaCl, 300 mM sucrose, 3 mM MgCl2, 10 mM 1,4-piperazinediethanesulfonic acid, pH 6.8, and 0.5% Triton for 2 min at room temperature. Histone modification H3K27me3 was detected using α-H3K27me3 at 1:1000 (#6523) (Schoeftner et al., 2006), followed by Alexa Fluor 488 goat anti–rabbit IgG (H+L) at 1:500 (Molecular Probes) staining. H2AK119ub1 primary antibody α-ubiquityl-histone H2A at 1:50 (clone E6C5; #05–678; Upstate Biotechnology, Waltham, MA) fol-lowed by secondary antibody Alexa Fluor 568 goat anti–mouse IgG (H+L) at 1:500 (Molecular Probes). After immunofluorescence, cells were fixed in 4% PFA in PBS for 10 min at room temperature, dehy-drated, hybridized, and washed as described for RNA FISH.
For Western analysis ES cells were grown for 2 d without feeders. Nuclear extracts were prepared and analyzed by SDS–PAGE as de-scribed (Schoeftner et al., 2006). GFP was detected with a mixture of mouse monoclonal clone 7.1 and 13.1 anti-GFP antibody at 1:200 (#11814460001; Roche) and a horseradish peroxidase–conjugated AffiniPure goat anti–mouse IgG (H+L), 1:5000 (Jackson ImmunoRe-search Laboratories, West Grove, PA), secondary antibody. Chemilu-minescence reagent (ECL; Amersham) and imaging film (Biomax; Eastman-Kodak, Rochester, NY) were used for detection.
once the chromosome is covered with Xist, newly synthesized Xist can bind more rapidly than on a chromosome that is not decorated with Xist. We think this might reflect changes in the organization of chromatin that are induced by Xist binding. Chromatin modifica-tions might play a lesser role for Xist binding, as we have observed similar kinetics of Xist accumulation after initial induction and after mitosis when chromatin modifications are inherited from the previ-ous cell cycle.
The kinetics of Xist turnover with and without transcription dif-fer by nearly two orders of magnitude, with half-lives of 3 min and 4–6 h, respectively. The very long half-life of Xist after transcription block indicates a very stable attachment and a corresponding high binding energy. An interesting question is then how this substan-tial energy barrier is overcome when newly synthesized Xist dis-places chromatin bound Xist. We speculate that the binding en-ergy could be overcome if Xist were displaced by a stepwise takeover of individual interactions along the RNA. Alternatively, Xist binding could be regulated, consistent with a report that Aurora B kinase has a role in the displacement of Xist during mito-sis (Hall et al., 2009).
Observations from visualization of Xist in living cells have uncov-ered a dynamic behavior that might be important for understanding the mechanism of Xist function. Further studies will be needed to confirm our results during normal X inactivation. Xist has exclusively evolved in placental mammals (Duret et al., 2006; Elisaphenko et al., 2008) and presents a model for noncoding RNA function in chroma-tin compartmentalization (Heard and Bickmore, 2007). In light of recent discoveries of large sets of long noncoding RNAs (Rinn et al., 2007; Guttman et al., 2009; Khalil et al., 2009; Ponting et al., 2009), live imaging might also be a useful approach for studying the role and dynamics of other noncoding transcripts in mammalian cells. We are confident that dynamics will prove a vital aspect of noncod-ing RNA function and our live-imaging system might introduce a new tool.
MATERIALS AND METHODSVector constructionptetOP-MS2 was generated by directional cloning of the BamHI (blunt)-SphI fragment of 24x MS2 (Fusco et al., 2003) into the EcoNI (blunt)-SphI site of ptetOP H/X vector (Wutz and Jaenisch, 2000). The ClaI-PvuI fragment was then inserted into ptetOP-Xist-PA vec-tor (Wutz and Jaenisch, 2000) and digested with ClaI-PvuI, giving ptetOP-Xist-MS2-PA. For pCAG-MCP-GFPnls the ClaI-digested nlsMCP(dIFG)-GFP fragment from plasmid hsp83-MCP(dIFG)-GFP (a gift from P. Becker) was inserted into the EcoRI-digested pCAG vector (Niwa et al., 1991).
Cell culture and generation of cell linesThe XMG cell line was generated by a two-step random integration strategy into J1 ES cells, which contained nlsrtTA targeted in the ROSA26 locus (Wutz and Jaenisch, 2000). First, 100 μg of ptetOP-Xist-MS2-PA and 10 μg pf pPGKpuro plasmid, both linearized, were coelectroporated into J1 ES cells to create the XM cell line. Puromy-cin (2 μg/ml)–resistant colonies were individually selected and screened for expression by Xist/MS2 RNA FISH after 24 h of induc-tion on Roboz slides (CellPoint Scientific, Gaithersburg, MD). Second, 100 μg of pCAG-MCP-GFP-nls with 10 μg of pPGKhygro, both linearized, were cointegrated into the XM cell line. Stable ex-pressing clones were identified after selection with hygromycin B (130 μg/ml) for 8 d. Positive clones were verified under the fluores-cence microscope after 24-h induction on Roboz slides and con-firmed by flow cytometry (FACsort; BD Biosciences, Franklin Lake,

Volume 22 July 15, 2011 Imaging of Xist RNA in living cells | 2643
For experiments involving washing out Dox for turning Xist tran-scription off, cells were grown on ibiTreat μ-Slide eight-well slides (ibidi, Martinsried, Germany) coated with gelatin (Figure S1). Cells were cultured overnight in the presence of 1 μg/ml Dox. Before imaging, Dox was washed out by five times replacing the medium with fresh prewarmed medium without Dox. After 30 min, Xist tran-scription became negligible. These ibidi slides provided superior adhesion for ES cells, allowing for repeated washes without cell displacement. Best imaging conditions were found using a 63× oil immersion objective on a Leica SP5 confocal microscope with in-verted DMI6000 stands fitted with environmental cube housings for live-cell imaging.
Fluorescence correlation spectroscopy Fluorescence correlation spectroscopy (FCS) was performed at room temperature using a Zeiss LSM FCS Confocor2 with a 40× water immersion objective (numerical aperture, 1.2) It records fluo-rescence intensity fluctuations, which were analyzed using the auto-correlation function of the intensity signal, which can be adjusted with the anomalous diffusion model (Bancaud et al., 2009). This technique enabled us to measure the MCP-GFP nucleoplasmic dif-fusion coefficient and concentration based on anomalous diffusion fitting (Haustein and Schwille, 2007):
ACF t =1N
1
1+tt
1+1S
ttD
2/
2D
( ) ×
×
β
2/ 0 5β .
(3)
where ⟨N⟩ is the mean number of tracers in the confocal volume, τD is the mean residence time in the confocal volume, S2 is the struc-ture parameter, which is defined by the confocal volume equatorial-to-axial dimension ratio, and β is the anomaly parameter. According to Zeiss specifications, the confocal volume axial and equatorial di-mensions are typically 0.3 and 1.5 μm, respectively, so S was set to 5. The fit using (3) enables us to measure MCP-GFP nucleoplasmic residence time (Supplemental Figure 2) and the nucleoplasmic concentration of MCP-GFP, given the confocal volume dimension. On the basis of combining FCS with confocal imaging, the onset of MCP-GFP concentration in the Xist territory was subsequently ex-tracted, providing an estimate for the number of MCP-GFP bound to Xist. Assuming that 33 MCP-GFP bind to one Xist RNA (Fusco et al., 2003), we could calculate the steady-state number of Xist molecules.
Expression analysis of g1‑ and g2‑phase cellsXMG ES cells were cultured overnight in the presence of 1 μg/ml Dox. Approximately 5 × 10⁶ cells were harvested and incubated with Hoechst 33342 dye diluted 1:100 in medium containing 1 μg/ml Dox for 30 min at 37ºC. Sorting of the cells was performed on a Dako MoFlo cell sorter (Beckman Coulter, Brea, CA). Total RNA was isolated from equal numbers of G1- and G2-phase cells using TRIzol (Invitrogen). RNA concentration was determined on a NanoDrop spectrophotometer.
Quantitative real-time PCR of gene expression was performed using the Fast SYBR Green Master Mix and the StepOnePlus Real-Time PCR System (Applied Biosystems, Foster City, CA). Sequences for primers for detection of Xist were TCATCACAACAGCAGTTCTC and CAGGAGCACAAAACAGACTC. Gapdh was detected using the previously published primer set Gapd F and Gapd R2 (Sado et al., 2005).
Live cell microscopy and data analysisConfocal images were acquired on a Zeiss LSM510 microscope. For live-cell observation, cells were grown in Lab-Tek chamber coverglasses (Nunc, Thermo Fisher Scientific) overnight in the pres-ence of feeders. Dox (1 μg/ml) was added to the cells 4 h before imaging. Prior to imaging, the medium was changed to prewarmed CO2-independent medium without phenol red (Invitrogen) contain-ing 1 μg/ml Dox, unless otherwise stated, and was sealed with sili-con grease. Where indicated, DNA was stained in live cells by 0.2 μg/ml Hoechst 33342. For ActD experiments, 20 μg/ml ActD (Sigma-Aldrich) was added as a 2× solution to imaging medium for 10 min before the experiment. Single confocal sections or three-di-mensional stacks of live cells were captured automatically (Rabut and Ellenberg, 2004) using a Zeiss LSM510 confocal microscope with a 63× oil immersion objective (Gerlich et al., 2006). For FRAP experiments three iterations of photobleaching at 100- to 500-fold the acquisition laser intensity with 100% transmission of 488-nm la-ser on either the entire Xist cluster or half the Xist cluster or the nu-cleoplasm were used. The first postbleach frame was acquired im-mediately after photobleaching. A time series of typically six confocal z sections (3-μm pinhole with 2-μm z-intervals) was re-corded with 2-min intervals for a total of 30 min for untreated cells and 60 min for ActD-treated cells.
Images were adjusted by the brightness and contrast and filtered using a low-pass filter implemented in the LSM510 software and then assembled in ImageJ and cropped. For 3D reconstruction, Imaris (Bitplane, South Windsor, CT) was used. Quantification was carried out using ImageJ. Fluorescence recovery in photobleaching experiments was measured in fixed-size user-defined cellular re-gions in 3D projection of the z-stacks at all time points. To measure the area of Xist territories during cell cycle, images were thresholded with the mean background value plus two times the SD of the back-ground. FRAP experiments, which show a signal-to-noise ratio of >2 and Xist clusters ∼2 μm in diameter, were quantified and were nor-malized to the initial fluorescence-intensity distribution and to total fluorescence, thereby correcting for movements in z-plane and for fluorescence decay due to postbleach acquisition (Rabut and Ellenberg, 2004). FRAP and iFRAP experiments were normalized to the initial Xist cluster intensity, and the normalized intensity value for the Xist cluster, Inorm, was measured for each time point:
I =I t I tI t I t
Inorm
BG
Nu BG
Xist Xist( ) ( )( ) ( )
(−−
−tt = postbl I t = postbl
I t = postbl IBG
Nu BG
) ( )( )
−− (( )
( )
t = postbl
I t = prebl IB
÷−Xist GG
Nu BG
t = preblI t = prebl I t = prebl
( )( ) ( )−
−−I t = postbl I t = postbl
I t = posBG
Nu
Xist ( ) ( )( ttbl I t = postblBG) ( )−
(1)
where IXist and INu are the Xist cluster and total nuclear background corrected intensities, respectively, prebl is prebleached, and postbl is postbleached. IBG is the background intensity outside the nucleus.
Kinetic modeling: Xist is produced by transcription at a constant rate (k1); it then binds to chromatin, and its association is character-ized by a dissociation constant (k2). At steady state, production and dissociation are balanced and define the number of Xist bound to the chromosome, Xistst = k1/k2. Xist dynamics can be described with a first-order kinetics:
ddt
k2stXist
Xist Xist= −( )
(2)
This equation was used to fit FRAP/iFRAP experiments, in which the MCP-GFP shuttling can be neglected.

2644 | K. Ng et al. Molecular Biology of the Cell
Fusco D, Accornero N, Lavoie B, Shenoy SM, Blanchard JM, Singer RH, Bertrand E (2003). Single mRNA molecules demonstrate probabilistic movement in living mammalian cells. Curr Biol 13, 161–167.
Fusco D, Bertrand E, Singer RH (2004). Imaging of single mRNAs in the cytoplasm of living cells. Prog Mol Subcell Biol 35, 135–150.
Gerlich D, Koch B, Dupeux F, Peters JM, Ellenberg J (2006). Live-cell imag-ing reveals a stable cohesin-chromatin interaction after but not before DNA replication. Curr Biol 16, 1571–1578.
Guttman M et al. (2009). Chromatin signature reveals over a thousand highly conserved large non-coding RNAs in mammals. Nature 458, 223–227.
Hall LL, Byron M, Pageau G, Lawrence JB (2009). AURKB-mediated effects on chromatin regulate binding versus release of XIST RNA to the inac-tive chromosome. J Cell Biol 186, 491–507.
Hall LL, Byron M, Sakai K, Carrel L, Willard HF, Lawrence JB (2002). An ecto-pic human XIST gene can induce chromosome inactivation in postdiffer-entiation human HT-1080 cells. Proc Natl Acad Sci USA 99, 8677–8682.
Hasegawa Y, Brockdorff N, Kawano S, Tsutui K, Tsutui K, Nakagawa S (2010). The matrix protein hnRNP U is required for chromosomal localization of Xist RNA. Dev Cell 19, 469–476.
Haustein E, Schwille P (2007). Fluorescence correlation spectroscopy: novel variations of an established technique. Annu Rev Biophys Biomol Struct 36, 151–169.
Heard E, Bickmore W (2007). The ins and outs of gene regulation and chro-mosome territory organisation. Curr Opin Cell Biol 19, 311–316.
Heard E, Disteche CM (2006). Dosage compensation in mammals: fine-tuning the expression of the X chromosome. Genes Dev 20, 1848–1867.
Heard E, Mongelard F, Arnaud D, Avner P (1999). Xist yeast artificial chro-mosome transgenes function as X-inactivation centers only in multicopy arrays and not as single copies. Mol Cell Biol 19, 3156–3166.
Helbig R, Fackelmayer FO (2003). Scaffold attachment factor A (SAF-A) is concentrated in inactive X chromosome territories through its RGG domain. Chromosoma 112, 173–182.
Herzing LB, Romer JT, Horn JM, Ashworth A (1997). Xist has properties of the X-chromosome inactivation centre. Nature 386, 272–275.
Janicki SM et al. (2004). From silencing to gene expression: real-time analy-sis in single cells. Cell 116, 683–698.
Jaramillo AM, Weil TT, Goodhouse J, Gavis ER, Schupbach T (2008). The dynamics of fluorescently labeled endogenous gurken mRNA in Droso-phila. J Cell Sci 121, 887–894.
Khalil AM et al. (2009). Many human large intergenic noncoding RNAs asso-ciate with chromatin-modifying complexes and affect gene expression. Proc Natl Acad Sci USA 106, 11667–11672.
Lee JT, Strauss WM, Dausman JA, Jaenisch R (1996). A 450 kb transgene displays properties of the mammalian X-inactivation center. Cell 86, 83–94.
Lowary PT, Uhlenbeck OC (1987). An RNA mutation that increases the af-finity of an RNA-protein interaction. Nucleic Acids Res 15, 10483–10493.
Lyon MF (2003). The Lyon and the LINE hypothesis. Semin Cell Dev Biol 14, 313–318.
Minks J, Brown CJ (2009). Getting to the center of X-chromosome inactiva-tion: the role of transgenes. Biochem Cell Biol 87, 759–766.
Niwa H, Yamamura K, Miyazaki J (1991). Efficient selection for high-expres-sion transfectants with a novel eukaryotic vector. Gene 108, 193–199.
Okamoto I, Otte AP, Allis CD, Reinberg D, Heard E (2004). Epigenetic dynamics of imprinted X inactivation during early mouse development. Science 303, 644–649.
Panning B, Dausman J, Jaenisch R (1997). X chromosome inactivation is mediated by Xist RNA stabilization. Cell 90, 907–916.
Payer B, Lee JT (2008). X chromosome dosage compensation: how mam-mals keep the balance. Annu Rev Genet 42, 733–772.
Ponting CP, Oliver PL, Reik W (2009). Evolution and functions of long non-coding RNAs. Cell 136, 629–641.
Popova BC, Tada T, Takagi N, Brockdorff N, Nesterova TB (2006). Attenu-ated spread of X-inactivation in an X;autosome translocation. Proc Natl Acad Sci USA 103, 7706–7711.
Pullirsch D, Hartel R, Kishimoto H, Leeb M, Steiner G, Wutz A (2010). The Trithorax group protein Ash2l and Saf-A are recruited to the inactive X chromosome at the onset of stable X inactivation. Development 137, 935–943.
Rabut G, Ellenberg J (2004). Automatic real-time three-dimensional cell tracking by fluorescence microscopy. J Microsc 216, 131–137.
Rinn JL et al. (2007). Functional demarcation of active and silent chromatin domains in human HOX loci by noncoding RNAs. Cell 129, 1311–1323.
Sado T, Hoki Y, Sasaki H (2005). Tsix silences Xist through modification of chromatin structure. Dev Cell 9, 159–165.
ACKNOWLEDGMENTSWe thank L. Klein and M. Busslinger for critical discussion of the manuscript and P. Becker for providing the hsp83-MCP(dIFG)-GFP plasmid. J.E. acknowledges support from the European Molecular Biology Laboratory and the German National Research Council (DFG EL 246/2-2). A.B. was funded through a Federation of Euro-pean Biochemical Societies postdoctoral fellowship. A.W. is sup-ported by a Wellcome Trust Senior Research Fellowship (Grant Ref-erence 087530/Z/08/A). This work was supported by the Research Institute of Molecular Pathology and by a grant from the Austrian Science Fund (Grant Reference SFB17 FWF).
REFERENCESAgrelo R et al. (2009). SATB1 defines the developmental context for
gene silencing by Xist in lymphoma and embryonic cells. Dev Cell 16, 507–516.
Bancaud A, Huet S, Daigle N, Mozziconacci J, Beaudouin J, Ellenberg J (2009). Molecular crowding affects diffusion and binding of nuclear proteins in heterochromatin and reveals the fractal organization of chro-matin. EMBO J 28, 3785–3798.
Barakat TS, Jonkers I, Monkhorst K, Gribnau J (2010). X-changing informa-tion on X inactivation. Exp Cell Res 316, 679–687.
Beard C, Li E, Jaenisch R (1995). Loss of methylation activates Xist in so-matic but not in embryonic cells. Genes Dev 9, 2325–2334.
Bertrand E, Chartrand P, Schaefer M, Shenoy SM, Singer RH, Long RM (1998). Localization of ASH1 mRNA particles in living yeast. Mol Cell 2, 437–445.
Blewitt ME et al. (2008). SmcHD1, containing a structural-maintenance-of-chromosomes hinge domain, has a critical role in X inactivation. Nat Genet 40, 663–669.
Borsani G et al. (1991). Characterization of a murine gene expressed from the inactive X chromosome. Nature 351, 325–329.
Brockdorff N, Ashworth A, Kay GF, Cooper P, Smith S, McCabe VM, Norris DP, Penny GD, Patel D, Rastan S (1991). Conservation of position and exclusive expression of mouse Xist from the inactive X chromosome. Nature 351, 329–331.
Brown CJ, Ballabio A, Rupert JL, Lafreniere RG, Grompe M, Tonlorenzi R, Willard HF (1991a). A gene from the region of the human X inactivation centre is expressed exclusively from the inactive X chromosome. Nature 349, 38–44.
Brown CJ, Lafreniere RG, Powers VE, Sebastio G, Ballabio A, Pettigrew AL, Ledbetter DH, Levy E, Craig IW, Willard HF (1991b). Localization of the X inactivation centre on the human X chromosome in Xq13. Nature 349, 82–84.
Chaumeil J, Le Baccon P, Wutz A, Heard E (2006). A novel role for Xist RNA in the formation of a repressive nuclear compartment into which genes are recruited when silenced. Genes Dev 20, 2223–2237.
Chaumeil J, Okamoto I, Guggiari M, Heard E (2002). Integrated kinetics of X chromosome inactivation in differentiating embryonic stem cells. Cytogenet Genome Res 99, 75–84.
Chow JC, Hall LL, Baldry SE, Thorogood NP, Lawrence JB, Brown CJ (2007). Inducible XIST-dependent X-chromosome inactivation in human somatic cells is reversible. Proc Natl Acad Sci USA 104, 10104–10109.
Clemson CM, Hall LL, Byron M, McNeil J, Lawrence JB (2006). The X chromosome is organized into a gene-rich outer rim and an internal core containing silenced nongenic sequences. Proc Natl Acad Sci USA 103, 7688–7693.
Clemson CM, McNeil JA, Willard HF, Lawrence JB (1996). XIST RNA paints the inactive X chromosome at interphase: evidence for a novel RNA involved in nuclear/chromosome structure. J Cell Biol 132, 259–275.
Cole NB, Smith CL, Sciaky N, Terasaki M, Edidin M, Lippincott-Schwartz J (1996). Diffusional mobility of Golgi proteins in membranes of living cells. Science 273, 797–801.
Duret L, Chureau C, Samain S, Weissenbach J, Avner P (2006). The Xist RNA gene evolved in eutherians by pseudogenization of a protein-coding gene. Science 312, 1653–1655.
Elisaphenko EA, Kolesnikov NN, Shevchenko AI, Rogozin IB, Nesterova TB, Brockdorff N, Zakian SM (2008). A dual origin of the Xist gene from a protein-coding gene and a set of transposable elements. PLoS One 3, e2521.
Fackelmayer FO (2005). A stable proteinaceous structure in the territory of inactive X chromosomes. J Biol Chem 280, 1720–1723.

Volume 22 July 15, 2011 Imaging of Xist RNA in living cells | 2645
Sun BK, Deaton AM, Lee JT (2006). A transient heterochromatic state in Xist preempts X inactivation choice without RNA stabilization. Mol Cell 21, 617–628.
Tang YA, Huntley D, Montana G, Cerase A, Nesterova TB, Brockdorff N (2010). Efficiency of Xist-mediated silencing on autosomes is linked to chromosomal domain organisation. Epigenetics Chromatin 3, 10.
Wutz A, Jaenisch R (2000). A shift from reversible to irreversible X inactivation is triggered during ES cell differentiation. Mol Cell 5, 695–705.
Wutz A, Rasmussen TP, Jaenisch R (2002). Chromosomal silencing and localization are mediated by different domains of Xist RNA. Nat Genet 30, 167–174.
Sado T, Okano M, Li E, Sasaki H (2004). De novo DNA methylation is dis-pensable for the initiation and propagation of X chromosome inactiva-tion. Development 131, 975–982.
Savarese F, Flahndorfer K, Jaenisch R, Busslinger M, Wutz A (2006). He-matopoietic precursor cells transiently reestablish permissiveness for X inactivation. Mol Cell Biol 26, 7167–7177.
Schoeftner S, Sengupta AK, Kubicek S, Mechtler K, Spahn L, Koseki H, Jenuwein T, Wutz A (2006). Recruitment of PRC1 function at the initia-tion of X inactivation independent of PRC2 and silencing. EMBO J 25, 3110–3122.
Seidl CI, Stricker SH, Barlow DP (2006). The imprinted Air ncRNA is an atypi-cal RNAPII transcript that evades splicing and escapes nuclear export. EMBO J 25, 3565–3575.