the xist rna-prc2 complex at 20-nm resolution reveals a low xist
TRANSCRIPT

The Xist RNA-PRC2 complex at 20-nm resolutionreveals a low Xist stoichiometry and suggests ahit-and-run mechanism in mouse cellsHongjae Sunwooa,b,c, John Y. Wua,d,e, and Jeannie T. Leea,b,c,1
aHoward Hughes Medical Institute; bDepartment of Molecular Biology, Massachusetts General Hospital, Boston, MA 02114; cDepartment of Genetics,Harvard Medical School, Boston, MA 02115; dDepartment of Molecular and Cellular Biology, Harvard University, Cambridge, MA 02138; and eDepartment ofChemistry and Chemical Biology, Harvard University, Cambridge, MA 02138
Edited by Huntington F. Willard, The Marine Biological Laboratory, Woods Hole, MA, and approved June 26, 2015 (received for review February 25, 2015)
X-chromosome inactivation (XCI) is initiated by the long noncodingRNA Xist, which coats the inactive X (Xi) and targets Polycomb repres-sive complex 2 (PRC2) in cis. Epigenomic analyses have provided sig-nificant insight into Xist binding patterns and chromatin organizationof the Xi. However, such epigenomic analyses are limited by averagingof population-wide dynamics and do not inform behavior of singlecells. Here we view Xist RNA and the Xi at 20-nm resolution usingSTochastic Optical Reconstruction Microscopy (STORM) in mouse cells.We observe dynamics at the single-cell level not predicted by epige-nomic analysis. Only ∼50 hubs of Xist RNA occur on the Xi in themaintenance phase, corresponding to 50–100 Xist molecules per Xiand contrasting with the chromosome-wide “coat” observed by deepsequencing and conventional microscopy. Likewise, only ∼50 hubsPRC2 are observed. PRC2 and Xist foci are not randomly distributedbut showed statistically significant spatial association. Knock-off ex-periments enable visualization of the dynamics of dissociation andrelocalization onto the Xi and support a functional tethering of Xistand PRC2. Our analysis reveals that Xist-PRC2 complexes are less nu-merous than expected and suggests methylation of nucleosomes in ahit-and-run model.
super resolution microscopy | Xist RNA | Polycomb | X inactivation |chromosome
X-chromosome inactivation (XCI) silences a whole X chromo-some in the early mammalian female embryo and is maintained
through life to balance gene dosage between sexes (1–4). Silencingrequires the long noncoding Xist RNA (5), which is expressed onlyfrom the inactive X (Xi) and is known to “coat” the Xi in cis (6).Biochemical and genetic analyses have shown that expression ofXist RNA initiates XCI by targeting Polycomb repressive complex 2(PRC2) to a nucleation site located at the X-inactivation center(7–9). Upon leaving the nucleation site, the Xist-PRC2 complexspreads together along the X-chromosome to establish silencingby depositing the repressive trimethylated histone H3-lysine 27(H3K27me3) mark (9–13). Understanding how silencing factorsspread in cis has been advanced by employment of next-generationsequencing techniques. For example, CHART-seq (capture hy-bridization analysis of RNA targets with deep sequencing) andChIP-seq analyses have provided a first molecular examinationof Xist binding patterns (10, 14) and localization dynamics ofvarious chromatin epitopes (11, 15) at a population-wide level.Developmental profiling demonstrates that Xist RNA and PRC2initially localize to broad gene-rich, multimegabase clusters andlater spread into intervening gene-poor regions.Although these epigenomic studies have yielded high-resolution
views, they have also been limited by the population averagingof millions of input cells, masking the dynamics and potential var-iations at the level of single cells or single chromosomes. Althoughconventional light microscopy has provided critical single-cell per-spectives over the past five decades, its resolving power of 200–300 nmhas precluded analysis at the subchromosomal level. By con-ventional light microscopy, Xist RNA appears as a μm-scale “cloud”
in interphase cells (e.g., Fig. 1A) (6) and as broad discontinuousbands on mitotic chromosomes (16, 17), with broad overlappingstaining of PRC2 and other chromatin epitopes (9, 13, 18, 19). Topush the resolving power of light microscopy, two recent studiesused structured illumination microscopy (SIM) with a resolvingpower of ∼100 nm to examine the relationship of Xist RNA tonuclear markers (20, 21). One report surprisingly concludedthat Xist RNA does not colocalize with PRC2 and H3K27me3and called into question the idea that Xist RNA and PRC2 arefunctionally tethered (20). Here we turn to a superresolution mi-croscopic technique with substantially higher resolution. By Sto-chastic Optical Reconstruction Microscopy (STORM) (22–24), wevisualize the relationship between Xist, PRC2, and the Xi, to elu-cidate their stoichiometry and spatial association, which supporta model in which Xist and PRC2 are functionally tethered witheach other.
Results and DiscussionUsing 3D STORM, we examined the spatial organization of the Xiin female mouse embryonic fibroblasts (MEFs) at 20-nm lateral and50-nm axial resolution. Xist transcripts that were evident as anamorphous cloud by conventional microscopy (Fig. 1A) now ap-peared as discrete Xist puncta within the Xi territory (Fig. 1B andFig. S1). Interestingly, we observed an average of only 53 Xistpuncta per cloud (s.d. of 13.9, n = 50, Fig. 1C). This estimate isconsiderably lower than the previously published estimates of 300–2,000 Xist transcripts in ES cells and mouse tissues (25, 26), raisingthe possibility that each punctum could harbor an aggregate oftranscripts rather than a single molecule.
Significance
X-chromosome inactivation (XCI) is initiated by the long non-coding RNA Xist. Here we view Xist RNA and the Xi at 20-nmresolution using STochastic Optical Reconstruction Microscopy(STORM) and observe dynamics at the single-cell level not pre-dicted by epigenomic analysis. Only 50–100 Xist molecules and∼50 PRC2 foci are observed per Xi, contrasting with the chromo-some-wide “coat” observed by deep sequencing and conventionalmicroscopy. Xist knock-off experiments enable visualization ofdissociation and relocalization dynamics, and support a functionaltethering of Xist and PRC2. Thus, Xist-PRC2 complexes are lessnumerous than expected, implying that the Xist-PRC2 complexesmethylate nucleosomes in a hit-and-run model.
Author contributions: H.S., J.Y.W., and J.T.L. designed research; H.S. and J.Y.W. performedresearch; J.Y.W. contributed new reagents/analytic tools; H.S. and J.T.L. analyzed data; and H.S.and J.T.L. wrote the paper.
The authors declare no conflict of interest.
This article is a PNAS Direct Submission.1To whom correspondence should be addressed. Email: [email protected].
This article contains supporting information online at www.pnas.org/lookup/suppl/doi:10.1073/pnas.1503690112/-/DCSupplemental.
E4216–E4225 | PNAS | Published online July 20, 2015 www.pnas.org/cgi/doi/10.1073/pnas.1503690112
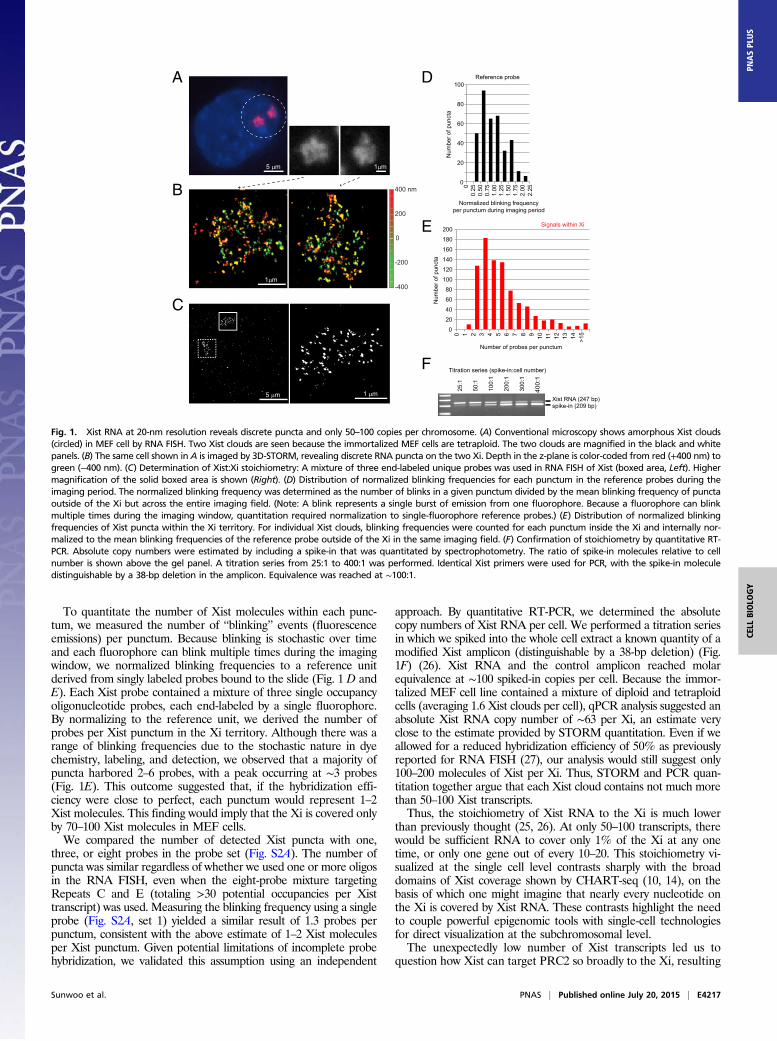
To quantitate the number of Xist molecules within each punc-tum, we measured the number of “blinking” events (fluorescenceemissions) per punctum. Because blinking is stochastic over timeand each fluorophore can blink multiple times during the imagingwindow, we normalized blinking frequencies to a reference unitderived from singly labeled probes bound to the slide (Fig. 1 D andE). Each Xist probe contained a mixture of three single occupancyoligonucleotide probes, each end-labeled by a single fluorophore.By normalizing to the reference unit, we derived the number ofprobes per Xist punctum in the Xi territory. Although there was arange of blinking frequencies due to the stochastic nature in dyechemistry, labeling, and detection, we observed that a majority ofpuncta harbored 2–6 probes, with a peak occurring at ∼3 probes(Fig. 1E). This outcome suggested that, if the hybridization effi-ciency were close to perfect, each punctum would represent 1–2Xist molecules. This finding would imply that the Xi is covered onlyby 70–100 Xist molecules in MEF cells.We compared the number of detected Xist puncta with one,
three, or eight probes in the probe set (Fig. S2A). The number ofpuncta was similar regardless of whether we used one or more oligosin the RNA FISH, even when the eight-probe mixture targetingRepeats C and E (totaling >30 potential occupancies per Xisttranscript) was used. Measuring the blinking frequency using a singleprobe (Fig. S2A, set 1) yielded a similar result of 1.3 probes perpunctum, consistent with the above estimate of 1–2 Xist moleculesper Xist punctum. Given potential limitations of incomplete probehybridization, we validated this assumption using an independent
approach. By quantitative RT-PCR, we determined the absolutecopy numbers of Xist RNA per cell. We performed a titration seriesin which we spiked into the whole cell extract a known quantity of amodified Xist amplicon (distinguishable by a 38-bp deletion) (Fig.1F) (26). Xist RNA and the control amplicon reached molarequivalence at ∼100 spiked-in copies per cell. Because the immor-talized MEF cell line contained a mixture of diploid and tetraploidcells (averaging 1.6 Xist clouds per cell), qPCR analysis suggested anabsolute Xist RNA copy number of ∼63 per Xi, an estimate veryclose to the estimate provided by STORM quantitation. Even if weallowed for a reduced hybridization efficiency of 50% as previouslyreported for RNA FISH (27), our analysis would still suggest only100–200 molecules of Xist per Xi. Thus, STORM and PCR quan-titation together argue that each Xist cloud contains not much morethan 50–100 Xist transcripts.Thus, the stoichiometry of Xist RNA to the Xi is much lower
than previously thought (25, 26). At only 50–100 transcripts, therewould be sufficient RNA to cover only 1% of the Xi at any onetime, or only one gene out of every 10–20. This stoichiometry vi-sualized at the single cell level contrasts sharply with the broaddomains of Xist coverage shown by CHART-seq (10, 14), on thebasis of which one might imagine that nearly every nucleotide onthe Xi is covered by Xist RNA. These contrasts highlight the needto couple powerful epigenomic tools with single-cell technologiesfor direct visualization at the subchromosomal level.The unexpectedly low number of Xist transcripts led us to
question how Xist can target PRC2 so broadly to the Xi, resulting
5 µm 1µm
1µm
0
400 nm
200
-200
5 µm 1 µm
A
B
C
F
25:1
50:1
100:
1
200:
1
300:
1
400:
1
100
80
60
40
20
0 0
0.50
0.75
1.00
2.00
180
140
60
40
20
0
160
120
100
80
0 1 2 3 4 5 6 7 8 9 10 11 12 13 14 >15
D
-400
Num
ber o
f pun
cta
Num
ber o
f pun
cta
Normalized blinking frequencyper punctum during imaging period
Number of probes per punctum
200
0.25
1.75
1.25
1.50
E
Reference probe
Signals within Xi
Xist RNA (247 bp)spike-in (209 bp)
Titration series (spike-in:cell number)
2.25
Fig. 1. Xist RNA at 20-nm resolution reveals discrete puncta and only 50–100 copies per chromosome. (A) Conventional microscopy shows amorphous Xist clouds(circled) in MEF cell by RNA FISH. Two Xist clouds are seen because the immortalized MEF cells are tetraploid. The two clouds are magnified in the black and whitepanels. (B) The same cell shown in A is imaged by 3D-STORM, revealing discrete RNA puncta on the two Xi. Depth in the z-plane is color-coded from red (+400 nm) togreen (−400 nm). (C) Determination of Xist:Xi stoichiometry: A mixture of three end-labeled unique probes was used in RNA FISH of Xist (boxed area, Left). Highermagnification of the solid boxed area is shown (Right). (D) Distribution of normalized blinking frequencies for each punctum in the reference probes during theimaging period. The normalized blinking frequency was determined as the number of blinks in a given punctum divided by the mean blinking frequency of punctaoutside of the Xi but across the entire imaging field. (Note: A blink represents a single burst of emission from one fluorophore. Because a fluorophore can blinkmultiple times during the imaging window, quantitation required normalization to single-fluorophore reference probes.) (E) Distribution of normalized blinkingfrequencies of Xist puncta within the Xi territory. For individual Xist clouds, blinking frequencies were counted for each punctum inside the Xi and internally nor-malized to the mean blinking frequencies of the reference probe outside of the Xi in the same imaging field. (F) Confirmation of stoichiometry by quantitative RT-PCR. Absolute copy numbers were estimated by including a spike-in that was quantitated by spectrophotometry. The ratio of spike-in molecules relative to cellnumber is shown above the gel panel. A titration series from 25:1 to 400:1 was performed. Identical Xist primers were used for PCR, with the spike-in moleculedistinguishable by a 38-bp deletion in the amplicon. Equivalence was reached at ∼100:1.
Sunwoo et al. PNAS | Published online July 20, 2015 | E4217
CELL
BIOLO
GY
PNASPL
US
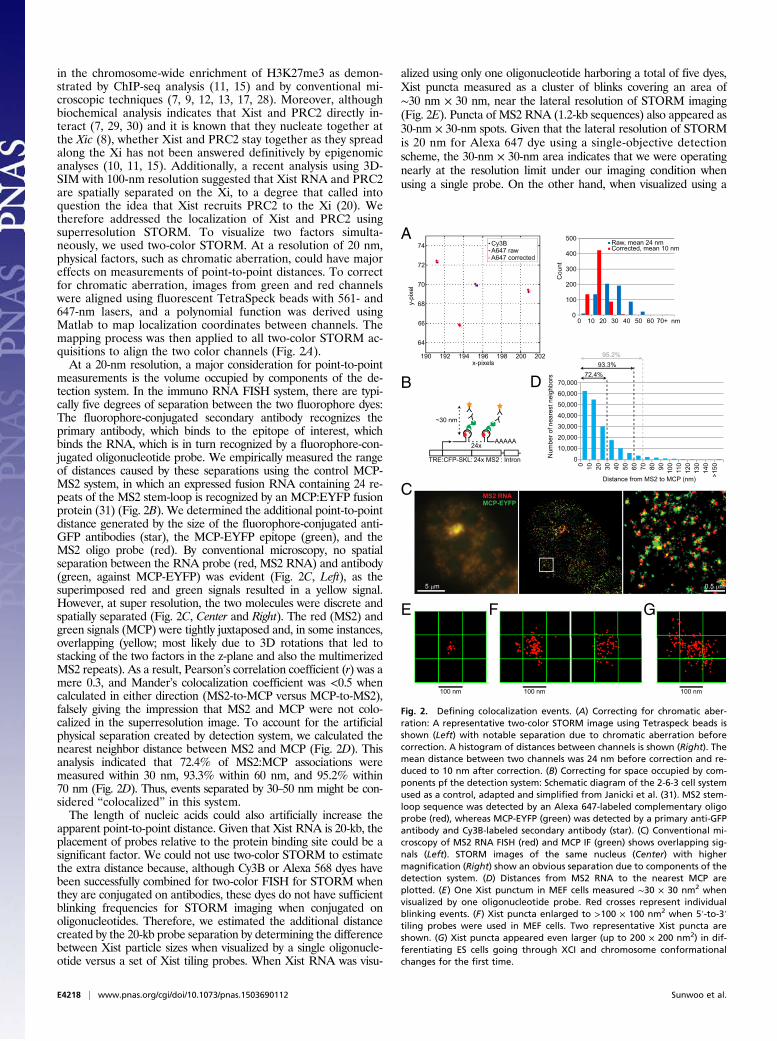
in the chromosome-wide enrichment of H3K27me3 as demon-strated by ChIP-seq analysis (11, 15) and by conventional mi-croscopic techniques (7, 9, 12, 13, 17, 28). Moreover, althoughbiochemical analysis indicates that Xist and PRC2 directly in-teract (7, 29, 30) and it is known that they nucleate together atthe Xic (8), whether Xist and PRC2 stay together as they spreadalong the Xi has not been answered definitively by epigenomicanalyses (10, 11, 15). Additionally, a recent analysis using 3D-SIM with 100-nm resolution suggested that Xist RNA and PRC2are spatially separated on the Xi, to a degree that called intoquestion the idea that Xist recruits PRC2 to the Xi (20). Wetherefore addressed the localization of Xist and PRC2 usingsuperresolution STORM. To visualize two factors simulta-neously, we used two-color STORM. At a resolution of 20 nm,physical factors, such as chromatic aberration, could have majoreffects on measurements of point-to-point distances. To correctfor chromatic aberration, images from green and red channelswere aligned using fluorescent TetraSpeck beads with 561- and647-nm lasers, and a polynomial function was derived usingMatlab to map localization coordinates between channels. Themapping process was then applied to all two-color STORM ac-quisitions to align the two color channels (Fig. 2A).At a 20-nm resolution, a major consideration for point-to-point
measurements is the volume occupied by components of the de-tection system. In the immuno RNA FISH system, there are typi-cally five degrees of separation between the two fluorophore dyes:The fluorophore-conjugated secondary antibody recognizes theprimary antibody, which binds to the epitope of interest, whichbinds the RNA, which is in turn recognized by a fluorophore-con-jugated oligonucleotide probe. We empirically measured the rangeof distances caused by these separations using the control MCP-MS2 system, in which an expressed fusion RNA containing 24 re-peats of the MS2 stem-loop is recognized by an MCP:EYFP fusionprotein (31) (Fig. 2B). We determined the additional point-to-pointdistance generated by the size of the fluorophore-conjugated anti-GFP antibodies (star), the MCP-EYFP epitope (green), and theMS2 oligo probe (red). By conventional microscopy, no spatialseparation between the RNA probe (red, MS2 RNA) and antibody(green, against MCP-EYFP) was evident (Fig. 2C, Left), as thesuperimposed red and green signals resulted in a yellow signal.However, at super resolution, the two molecules were discrete andspatially separated (Fig. 2C, Center and Right). The red (MS2) andgreen signals (MCP) were tightly juxtaposed and, in some instances,overlapping (yellow; most likely due to 3D rotations that led tostacking of the two factors in the z-plane and also the multimerizedMS2 repeats). As a result, Pearson’s correlation coefficient (r) was amere 0.3, and Mander’s colocalization coefficient was <0.5 whencalculated in either direction (MS2-to-MCP versus MCP-to-MS2),falsely giving the impression that MS2 and MCP were not colo-calized in the superresolution image. To account for the artificialphysical separation created by detection system, we calculated thenearest neighbor distance between MS2 and MCP (Fig. 2D). Thisanalysis indicated that 72.4% of MS2:MCP associations weremeasured within 30 nm, 93.3% within 60 nm, and 95.2% within70 nm (Fig. 2D). Thus, events separated by 30–50 nm might be con-sidered “colocalized” in this system.The length of nucleic acids could also artificially increase the
apparent point-to-point distance. Given that Xist RNA is 20-kb, theplacement of probes relative to the protein binding site could be asignificant factor. We could not use two-color STORM to estimatethe extra distance because, although Cy3B or Alexa 568 dyes havebeen successfully combined for two-color FISH for STORM whenthey are conjugated on antibodies, these dyes do not have sufficientblinking frequencies for STORM imaging when conjugated onoligonucleotides. Therefore, we estimated the additional distancecreated by the 20-kb probe separation by determining the differencebetween Xist particle sizes when visualized by a single oligonucle-otide versus a set of Xist tiling probes. When Xist RNA was visu-
alized using only one oligonucleotide harboring a total of five dyes,Xist puncta measured as a cluster of blinks covering an area of∼30 nm × 30 nm, near the lateral resolution of STORM imaging(Fig. 2E). Puncta of MS2 RNA (1.2-kb sequences) also appeared as30-nm × 30-nm spots. Given that the lateral resolution of STORMis 20 nm for Alexa 647 dye using a single-objective detectionscheme, the 30-nm × 30-nm area indicates that we were operatingnearly at the resolution limit under our imaging condition whenusing a single probe. On the other hand, when visualized using a
A
TRE:CFP-SKL: : Intron24x MS2
AAAAA24x
YY
YY
~30 nm
C
5 µm 0.5 µm
B
MS2 RNA MCP-EYFP
0 10 20 30 40 50 60 70 80 90
>15010
011
012
013
014
0
70,000
60,000
50,000
40,000
30,000
20,000
10,000
0
72.4%
Raw, mean 24 nm Corrected, mean 10 nm
0 10 20 30 40 50 60 70+ nm
100
200
300
400
500
0
Cou
nt
D
Distance from MS2 to MCP (nm)
93.3%
E
Num
ber o
f nea
rest
nei
ghbo
rs
95.2%
F G
72
70
68
66
64
74
190 192 194 196 198 200 202
Cy3BA647 rawA647 corrected
y-pi
xel
x-pixels
100 nm 100 nm 100 nm
Fig. 2. Defining colocalization events. (A) Correcting for chromatic aber-ration: A representative two-color STORM image using Tetraspeck beads isshown (Left) with notable separation due to chromatic aberration beforecorrection. A histogram of distances between channels is shown (Right). Themean distance between two channels was 24 nm before correction and re-duced to 10 nm after correction. (B) Correcting for space occupied by com-ponents pf the detection system: Schematic diagram of the 2-6-3 cell systemused as a control, adapted and simplified from Janicki et al. (31). MS2 stem-loop sequence was detected by an Alexa 647-labeled complementary oligoprobe (red), whereas MCP-EYFP (green) was detected by a primary anti-GFPantibody and Cy3B-labeled secondary antibody (star). (C) Conventional mi-croscopy of MS2 RNA FISH (red) and MCP IF (green) shows overlapping sig-nals (Left). STORM images of the same nucleus (Center) with highermagnification (Right) show an obvious separation due to components of thedetection system. (D) Distances from MS2 RNA to the nearest MCP areplotted. (E) One Xist punctum in MEF cells measured ∼30 × 30 nm2 whenvisualized by one oligonucleotide probe. Red crosses represent individualblinking events. (F) Xist puncta enlarged to >100 × 100 nm2 when 5′-to-3′tiling probes were used in MEF cells. Two representative Xist puncta areshown. (G) Xist puncta appeared even larger (up to 200 × 200 nm2) in dif-ferentiating ES cells going through XCI and chromosome conformationalchanges for the first time.
E4218 | www.pnas.org/cgi/doi/10.1073/pnas.1503690112 Sunwoo et al.
mixture of tiling probes spanning the 5′ and 3′ ends of Xist RNA(totaling 34 oligonucleotides with maximum 74 occupancies pertranscript), Xist puncta measured greater than 100 nm × 100 nm inMEF (Fig. 2F). In differentiating ES cells where XCI is establishingde novo, Xist puncta were as much as 200 nm × 200 nm in dif-ferentiating ES cell (Fig. 2G), a somewhat larger area likely due tothe Xi not being fully condensed during this establishment phase.Thus, a 20-kb probe separation within Xist RNA could increasepoint-to-point distances by an additional 100 nm in MEF cells,depending on where the Xist probe is set relative to the fluo-rescently labeled antibodies. These empirical observations implythat it would be physically impossible for the fluorophores in animmuno RNA FISH experiment to be perfectly overlapped.We therefore took a statistical approach to examining the lo-
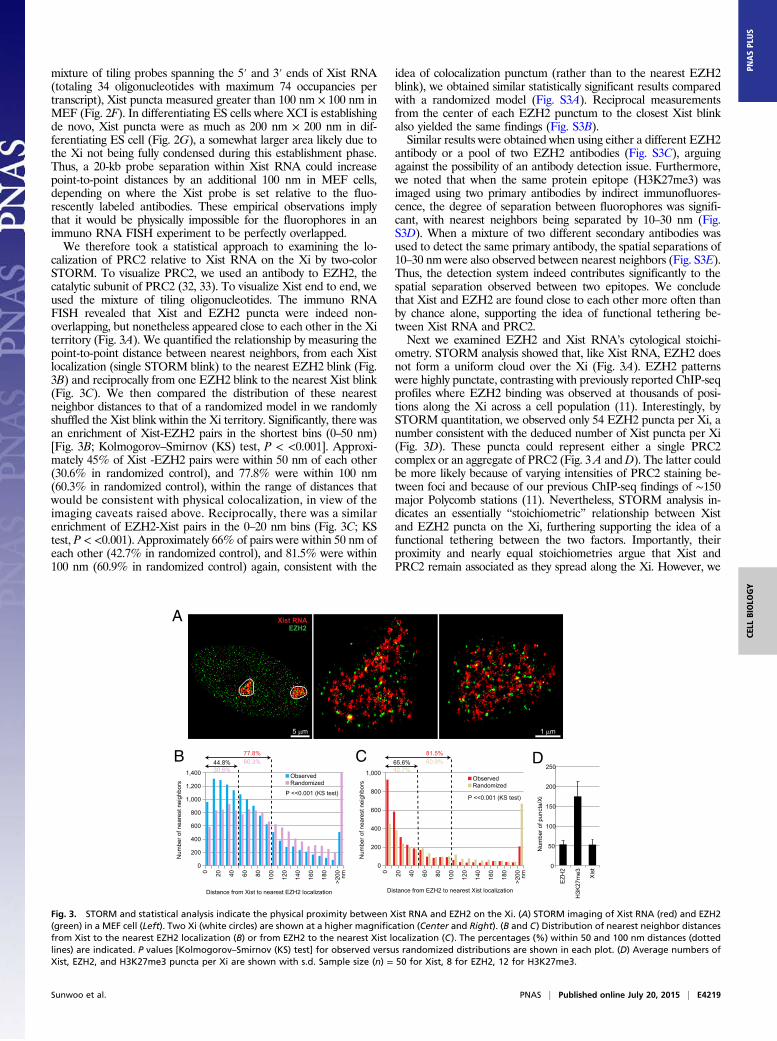
calization of PRC2 relative to Xist RNA on the Xi by two-colorSTORM. To visualize PRC2, we used an antibody to EZH2, thecatalytic subunit of PRC2 (32, 33). To visualize Xist end to end, weused the mixture of tiling oligonucleotides. The immuno RNAFISH revealed that Xist and EZH2 puncta were indeed non-overlapping, but nonetheless appeared close to each other in the Xiterritory (Fig. 3A). We quantified the relationship by measuring thepoint-to-point distance between nearest neighbors, from each Xistlocalization (single STORM blink) to the nearest EZH2 blink (Fig.3B) and reciprocally from one EZH2 blink to the nearest Xist blink(Fig. 3C). We then compared the distribution of these nearestneighbor distances to that of a randomized model in we randomlyshuffled the Xist blink within the Xi territory. Significantly, there wasan enrichment of Xist-EZH2 pairs in the shortest bins (0–50 nm)[Fig. 3B; Kolmogorov–Smirnov (KS) test, P < <0.001]. Approxi-mately 45% of Xist -EZH2 pairs were within 50 nm of each other(30.6% in randomized control), and 77.8% were within 100 nm(60.3% in randomized control), within the range of distances thatwould be consistent with physical colocalization, in view of theimaging caveats raised above. Reciprocally, there was a similarenrichment of EZH2-Xist pairs in the 0–20 nm bins (Fig. 3C; KStest, P < <0.001). Approximately 66% of pairs were within 50 nm ofeach other (42.7% in randomized control), and 81.5% were within100 nm (60.9% in randomized control) again, consistent with the
idea of colocalization punctum (rather than to the nearest EZH2blink), we obtained similar statistically significant results comparedwith a randomized model (Fig. S3A). Reciprocal measurementsfrom the center of each EZH2 punctum to the closest Xist blinkalso yielded the same findings (Fig. S3B).Similar results were obtained when using either a different EZH2
antibody or a pool of two EZH2 antibodies (Fig. S3C), arguingagainst the possibility of an antibody detection issue. Furthermore,we noted that when the same protein epitope (H3K27me3) wasimaged using two primary antibodies by indirect immunofluores-cence, the degree of separation between fluorophores was signifi-cant, with nearest neighbors being separated by 10–30 nm (Fig.S3D). When a mixture of two different secondary antibodies wasused to detect the same primary antibody, the spatial separations of10–30 nm were also observed between nearest neighbors (Fig. S3E).Thus, the detection system indeed contributes significantly to thespatial separation observed between two epitopes. We concludethat Xist and EZH2 are found close to each other more often thanby chance alone, supporting the idea of functional tethering be-tween Xist RNA and PRC2.Next we examined EZH2 and Xist RNA’s cytological stoichi-
ometry. STORM analysis showed that, like Xist RNA, EZH2 doesnot form a uniform cloud over the Xi (Fig. 3A). EZH2 patternswere highly punctate, contrasting with previously reported ChIP-seqprofiles where EZH2 binding was observed at thousands of posi-tions along the Xi across a cell population (11). Interestingly, bySTORM quantitation, we observed only 54 EZH2 puncta per Xi, anumber consistent with the deduced number of Xist puncta per Xi(Fig. 3D). These puncta could represent either a single PRC2complex or an aggregate of PRC2 (Fig. 3A andD). The latter couldbe more likely because of varying intensities of PRC2 staining be-tween foci and because of our previous ChIP-seq findings of ∼150major Polycomb stations (11). Nevertheless, STORM analysis in-dicates an essentially “stoichiometric” relationship between Xistand EZH2 puncta on the Xi, furthering supporting the idea of afunctional tethering between the two factors. Importantly, theirproximity and nearly equal stoichiometries argue that Xist andPRC2 remain associated as they spread along the Xi. However, we
A
5 µm
EZH2Xist RNA
1 µm
B C
0 20 40 60 80 100
120
140
160
180
>200 nm
0
200
400
600
800
1,000
65.6%
0 20 40 60 80 100
120
140
160
180
>200 nm
0
200
400
600
800
1,000
1,400
1,200
44.8% D
Distance from Xist to nearest EZH2 localization Distance from EZH2 to nearest Xist localization
77.8% 81.5%
Num
ber o
f pun
cta/
Xi
30.6%60.3%
ObservedRandomized
ObservedRandomized
42.7%60.9%
0
50
100
150
200
250
P <<0.001 (KS test)P <<0.001 (KS test)
Xis
t
EZH
2
H3K
27m
e3
Num
ber o
f nea
rest
nei
ghbo
rs
Num
ber o
f nea
rest
nei
ghbo
rs
Fig. 3. STORM and statistical analysis indicate the physical proximity between Xist RNA and EZH2 on the Xi. (A) STORM imaging of Xist RNA (red) and EZH2(green) in a MEF cell (Left). Two Xi (white circles) are shown at a higher magnification (Center and Right). (B and C) Distribution of nearest neighbor distancesfrom Xist to the nearest EZH2 localization (B) or from EZH2 to the nearest Xist localization (C). The percentages (%) within 50 and 100 nm distances (dottedlines) are indicated. P values [Kolmogorov–Smirnov (KS) test] for observed versus randomized distributions are shown in each plot. (D) Average numbers ofXist, EZH2, and H3K27me3 puncta per Xi are shown with s.d. Sample size (n) = 50 for Xist, 8 for EZH2, 12 for H3K27me3.
Sunwoo et al. PNAS | Published online July 20, 2015 | E4219
CELL
BIOLO
GY
PNASPL
US
note that, because a small minority (∼20%) of PRC2 puncta showed>100-nm separation from Xist RNA (Fig. 3 B andC), a subset of Xi-bound PRC2molecules may dissociate, at least transiently, fromXistRNA during spreading. Overall, it is likely that Xist and PRC2 nu-cleate together at the Xic and comigrate along the Xi.PRC2’s relationship to H3K27me3 was substoichiometric (Fig.
3D), consistent with PRC2 being a catalytic factor (32, 33). ByCHART-seq analysis, H3K27me3 was observed to parallel bothXist binding and PRC2 localization, covering broad swaths of theXi (10, 14). Given differences between single-cell and pop-ulation-wide views for Xist and EZH2, we examined localizationof the repressive H3K27me3 mark on the Xi and its geographic
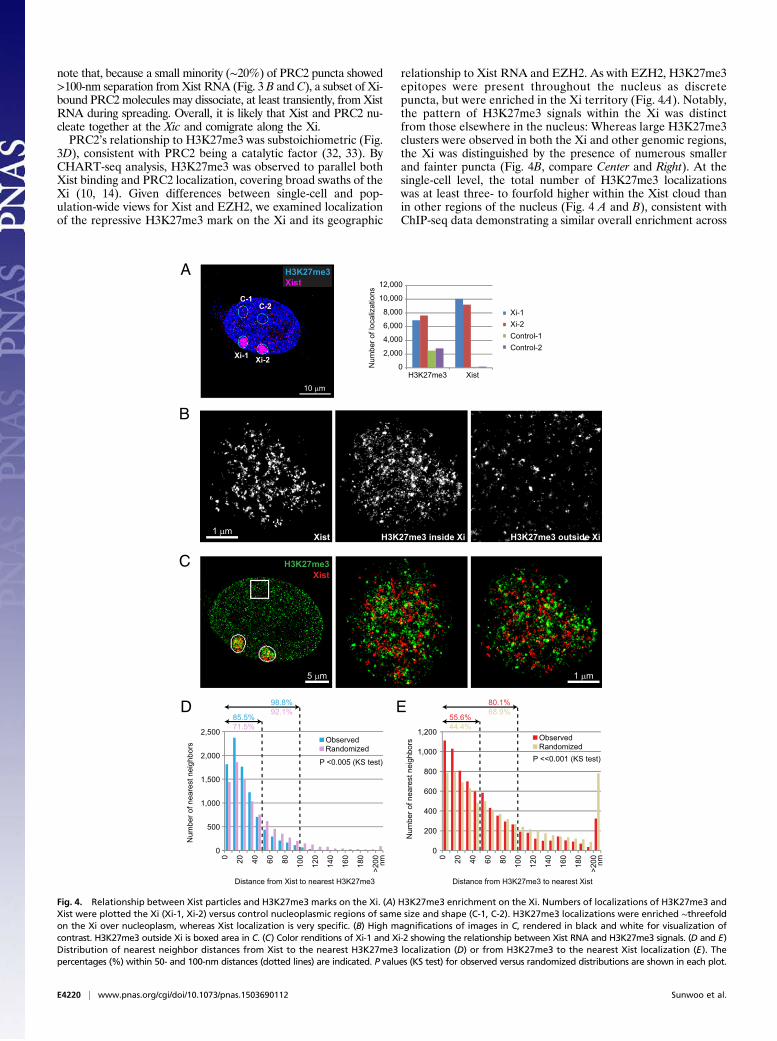
relationship to Xist RNA and EZH2. As with EZH2, H3K27me3epitopes were present throughout the nucleus as discretepuncta, but were enriched in the Xi territory (Fig. 4A). Notably,the pattern of H3K27me3 signals within the Xi was distinctfrom those elsewhere in the nucleus: Whereas large H3K27me3clusters were observed in both the Xi and other genomic regions,the Xi was distinguished by the presence of numerous smallerand fainter puncta (Fig. 4B, compare Center and Right). At thesingle-cell level, the total number of H3K27me3 localizationswas at least three- to fourfold higher within the Xist cloud thanin other regions of the nucleus (Fig. 4 A and B), consistent withChIP-seq data demonstrating a similar overall enrichment across
A
C
B
D
Xist H3K27me3 outside XiH3K27me3 inside Xi
XistH3K27me3
1 µm
12,000
10,000
8,000
6,000
4,000
2,000
0XistH3K27me3
Xi-1Xi-2
Control-2Control-1
Num
ber o
f loc
aliz
atio
ns
Xi-1 Xi-2
10 µm
C-1C-2
Distance from Xist to nearest H3K27me3
ObservedRandomized
0 20 40 60 80 100
120
140
160
180
>200 nm
0
500
1,000
1,500
2,000
2,500
85.5%71.5%
98.8%92.1%
ObservedRandomized
0 20 40 60 80 100
120
140
160
180
>200 nm
55.6%44.4%
80.1%68.9%
0
200
400
600
800
1,000
1,200
E
Distance from H3K27me3 to nearest Xist
P <<0.001 (KS test)P <0.005 (KS test)
Num
ber o
f nea
rest
nei
ghbo
rs
Num
ber o
f nea
rest
nei
ghbo
rs
H3K27me3Xist
5 µm 1 µm
Fig. 4. Relationship between Xist particles and H3K27me3 marks on the Xi. (A) H3K27me3 enrichment on the Xi. Numbers of localizations of H3K27me3 andXist were plotted the Xi (Xi-1, Xi-2) versus control nucleoplasmic regions of same size and shape (C-1, C-2). H3K27me3 localizations were enriched ∼threefoldon the Xi over nucleoplasm, whereas Xist localization is very specific. (B) High magnifications of images in C, rendered in black and white for visualization ofcontrast. H3K27me3 outside Xi is boxed area in C. (C) Color renditions of Xi-1 and Xi-2 showing the relationship between Xist RNA and H3K27me3 signals. (D and E)Distribution of nearest neighbor distances from Xist to the nearest H3K27me3 localization (D) or from H3K27me3 to the nearest Xist localization (E). Thepercentages (%) within 50- and 100-nm distances (dotted lines) are indicated. P values (KS test) for observed versus randomized distributions are shown in each plot.
E4220 | www.pnas.org/cgi/doi/10.1073/pnas.1503690112 Sunwoo et al.
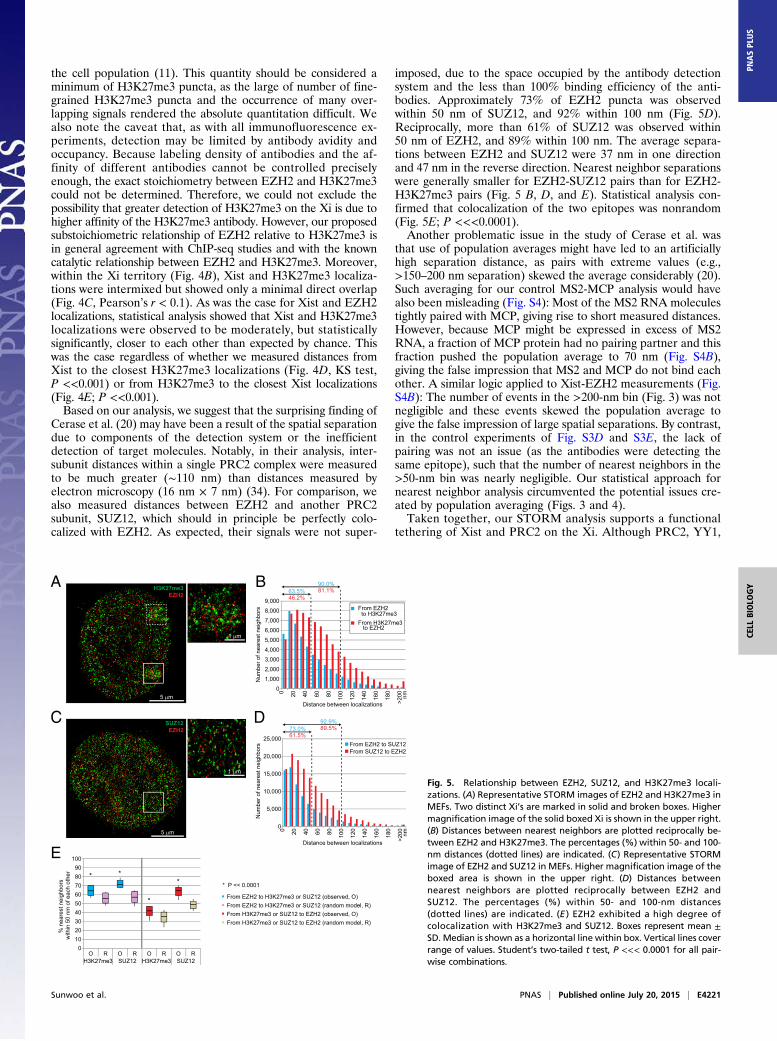
the cell population (11). This quantity should be considered aminimum of H3K27me3 puncta, as the large of number of fine-grained H3K27me3 puncta and the occurrence of many over-lapping signals rendered the absolute quantitation difficult. Wealso note the caveat that, as with all immunofluorescence ex-periments, detection may be limited by antibody avidity andoccupancy. Because labeling density of antibodies and the af-finity of different antibodies cannot be controlled preciselyenough, the exact stoichiometry between EZH2 and H3K27me3could not be determined. Therefore, we could not exclude thepossibility that greater detection of H3K27me3 on the Xi is due tohigher affinity of the H3K27me3 antibody. However, our proposedsubstoichiometric relationship of EZH2 relative to H3K27me3 isin general agreement with ChIP-seq studies and with the knowncatalytic relationship between EZH2 and H3K27me3. Moreover,within the Xi territory (Fig. 4B), Xist and H3K27me3 localiza-tions were intermixed but showed only a minimal direct overlap(Fig. 4C, Pearson’s r < 0.1). As was the case for Xist and EZH2localizations, statistical analysis showed that Xist and H3K27me3localizations were observed to be moderately, but statisticallysignificantly, closer to each other than expected by chance. Thiswas the case regardless of whether we measured distances fromXist to the closest H3K27me3 localizations (Fig. 4D, KS test,P <<0.001) or from H3K27me3 to the closest Xist localizations(Fig. 4E; P <<0.001).Based on our analysis, we suggest that the surprising finding of
Cerase et al. (20) may have been a result of the spatial separationdue to components of the detection system or the inefficientdetection of target molecules. Notably, in their analysis, inter-subunit distances within a single PRC2 complex were measuredto be much greater (∼110 nm) than distances measured byelectron microscopy (16 nm × 7 nm) (34). For comparison, wealso measured distances between EZH2 and another PRC2subunit, SUZ12, which should in principle be perfectly colo-calized with EZH2. As expected, their signals were not super-
imposed, due to the space occupied by the antibody detectionsystem and the less than 100% binding efficiency of the anti-bodies. Approximately 73% of EZH2 puncta was observedwithin 50 nm of SUZ12, and 92% within 100 nm (Fig. 5D).Reciprocally, more than 61% of SUZ12 was observed within50 nm of EZH2, and 89% within 100 nm. The average separa-tions between EZH2 and SUZ12 were 37 nm in one directionand 47 nm in the reverse direction. Nearest neighbor separationswere generally smaller for EZH2-SUZ12 pairs than for EZH2-H3K27me3 pairs (Fig. 5 B, D, and E). Statistical analysis con-firmed that colocalization of the two epitopes was nonrandom(Fig. 5E; P <<<0.0001).Another problematic issue in the study of Cerase et al. was
that use of population averages might have led to an artificiallyhigh separation distance, as pairs with extreme values (e.g.,>150–200 nm separation) skewed the average considerably (20).Such averaging for our control MS2-MCP analysis would havealso been misleading (Fig. S4): Most of the MS2 RNA moleculestightly paired with MCP, giving rise to short measured distances.However, because MCP might be expressed in excess of MS2RNA, a fraction of MCP protein had no pairing partner and thisfraction pushed the population average to 70 nm (Fig. S4B),giving the false impression that MS2 and MCP do not bind eachother. A similar logic applied to Xist-EZH2 measurements (Fig.S4B): The number of events in the >200-nm bin (Fig. 3) was notnegligible and these events skewed the population average togive the false impression of large spatial separations. By contrast,in the control experiments of Fig. S3D and S3E, the lack ofpairing was not an issue (as the antibodies were detecting thesame epitope), such that the number of nearest neighbors in the>50-nm bin was nearly negligible. Our statistical approach fornearest neighbor analysis circumvented the potential issues cre-ated by population averaging (Figs. 3 and 4).Taken together, our STORM analysis supports a functional
tethering of Xist and PRC2 on the Xi. Although PRC2, YY1,
46.2%81.1%
5 µm
H3K27me3EZH2
A B
0 20 40 60 80 100
120
140
160
180
>200 nm
5,000
4,000
0
1,000
2,000
3,000
9,000
8,000
7,000
6,000
63.5%90.0%
Distance between localizations
0 20 40 60 80 100
120
140
160
180
>200 nm
25,000
20,000
0
5,000
10,000
15,000
73.0%61.5%
92.9%89.5%
From EZH2 to SUZ12From SUZ12 to EZH2
Distance between localizations
C
E
From EZH2 to H3K27me3 or SUZ12 (observed, O)
From H3K27me3 or SUZ12 to EZH2 (random model, R)
D
5 µm
1 µm
SUZ12EZH2
H3K27me3 H3K27me3SUZ12 SUZ12O R O R O R O R
010203040
6050
100
70
9080
% n
eare
st n
eigh
bors
w
ithin
50
nm o
f eac
h ot
her
From EZH2 to H3K27me3 or SUZ12 (random model, R)From H3K27me3 or SUZ12 to EZH2 (observed, O)
* P << 0.0001* *
*
*
1 µm
Num
ber o
f nea
rest
nei
ghbo
rsN
umbe
r of n
eare
st n
eigh
bors
From EZH2 to H3K27me3From H3K27me3 to EZH2
Fig. 5. Relationship between EZH2, SUZ12, and H3K27me3 locali-zations. (A) Representative STORM images of EZH2 and H3K27me3 inMEFs. Two distinct Xi’s are marked in solid and broken boxes. Highermagnification image of the solid boxed Xi is shown in the upper right.(B) Distances between nearest neighbors are plotted reciprocally be-tween EZH2 and H3K27me3. The percentages (%) within 50- and 100-nm distances (dotted lines) are indicated. (C) Representative STORMimage of EZH2 and SUZ12 in MEFs. Higher magnification image of theboxed area is shown in the upper right. (D) Distances betweennearest neighbors are plotted reciprocally between EZH2 andSUZ12. The percentages (%) within 50- and 100-nm distances(dotted lines) are indicated. (E ) EZH2 exhibited a high degree ofcolocalization with H3K27me3 and SUZ12. Boxes represent mean ±SD. Median is shown as a horizontal line within box. Vertical lines coverrange of values. Student’s two-tailed t test, P <<< 0.0001 for all pair-wise combinations.
Sunwoo et al. PNAS | Published online July 20, 2015 | E4221
CELL
BIOLO
GY
PNASPL
US

ATRX, and hnRNP U are currently the only known directlyinteracting chromatin factors for Xist RNA (7, 8, 35, 36),several others have been shown to associate with the Xi in anXist-dependent manner, including the condensin-like protein,SMCHD1 (37), the repressive histone mark, H4K20me1 (12),and a novel protein, HBiX1 (19). Here we examined their re-lationship to Xist RNA by STORM imaging and observed thatall three epitopes showed a highly punctate staining pattern(Fig. 6A). None showed direct visual overlap but their locali-zations showed geographic proximity to Xist (Fig. 6A), mea-suring statistically significantly more molecules within 50 nm ofthe closest Xist signals than the randomized distribution (Fig.6B). Again, empirically observed distances for all pairwise com-binations were significantly lower than those predicted by ran-domized models (Fig. 6B; P <<0.01). By contrast, our negativecontrol active chromatin mark, H3K4me3, showed significantlyless proximity to Xist RNA and the measured distances betweenXist and H3K4me3 exceeded those of the randomized model,
consistent with H3K4me3 signals being outside of the Xi territory(Fig. 6B).Next, we asked whether Xist RNA localization dynamics differ
during the establishment phase of XCI and performed pertur-bation experiments to examine how Xist RNA and PRC2 re-localize onto the Xi. In differentiating mouse embryonic stem(ES) cells establishing XCI de novo, we observed that, althoughXist RNA was as punctate in early differentiating ES cells as inMEFs, the density of puncta over the Xi increased (Fig. 7A) andthe area occupied by the Xist cloud decreased (Fig. 7B) as dif-ferentiation progressed. At day 4, Xist puncta were relativelydiscernible, with Xist molecules spread across a larger territorythan in later-stage differentiating ES cells. Between days 4 and14, compaction of the cloud by up to 30% was evident, withindividual Xist puncta becoming more difficult to discern by days10 and 14 (Fig. 7 A and B). We then examined the differentiationdynamics for H3K27me3, EZH2, and SMCHD1 relative to XistRNAs (Fig. 7 C–E). Interestingly, when nearest neighbor distances
H3K
27m
e3
SM
CH
D1
H4K
20m
e1
HB
iX1
EZH
2
H3K
27m
e3
SM
CH
D1
H4K
20m
e1
HB
iX1
EZH
2
H3K
4me3
H3K
4me3
O R O RO RO RO RO RO RO RO R O RO RO R
100
80
60
40
20
0
90
10
30
50
70
% n
eare
st n
eigh
bors
w
ithin
50
nm o
f eac
h ot
her
5 µm 1 µmSMCHD1Xist RNA
B
From Xist to Xi markers (observed, O)
From Xi markers to Xist (random model, R)
A
H4K20me1Xist RNA
GFP-HBiX1Xist RNA
From Xist to Xi markers (random model, R)
From Xi markers to Xist (observed, O)
*
**
**
*
**
**
*
* P << 0.01*
Fig. 6. Association of Xist RNA with other Xi markers in MEFs. (A) STORM images of Xist RNA and SMCHD1 (Top), H4K20me1 (Middle), and GFP-HBiX1 (Bottom)in representative MEF cells. Two Xi territories are boxed and shown in at higher magnification in middle and right panels. (B) Summary of frequencies of Xistcolocalization with several Xi markers. An active chromatin marker, H3K4me3 serves as a negative control. O, observed. R, randommodel. Boxes represent mean±SD. Median is shown as a horizontal line within box. Vertical lines cover range of values. Student’s two-tailed t test: P <<0.01 for all pairwise combinations.
E4222 | www.pnas.org/cgi/doi/10.1073/pnas.1503690112 Sunwoo et al.

were calculated, Xist’s colocalization frequencies for the threeXi markers were higher than those in MEF (compare Fig. 7Cto Fig. 6D). For example, the percentage of Xist-EZH2 distancesthat were ≤50 nm was significantly higher during ES cell differ-entiation (73–86%) than that MEF cells (45%). By day 10, almostall Xist RNA signals were tightly associated with H3K27me3,consistent with previous Xist binding data (10, 14). The differencesbetween differentiating ES cells and MEF cells suggest that, duringthe de novo establishment of XCI (ES cells), a greater stoichi-ometry of Xist, PRC2, and other repressive chromatin factors maybe recruited to convert an uncondensed active X to the fully re-pressed and compacted state of the Xi and that, during themaintenance state, relatively fewer molecules of the Xist com-plexes may be required. Indeed, although we estimate the Xiststoichiometry to be 50–100 per Xi in MEF cells (Fig. 1), previousestimates in differentiating ES cells using the same RT-PCRmethod with spike-in control of in vitro transcribed RNA sug-gested 300 transcripts per cell (26).Finally, we investigated the behavior of PRC2 when Xist is
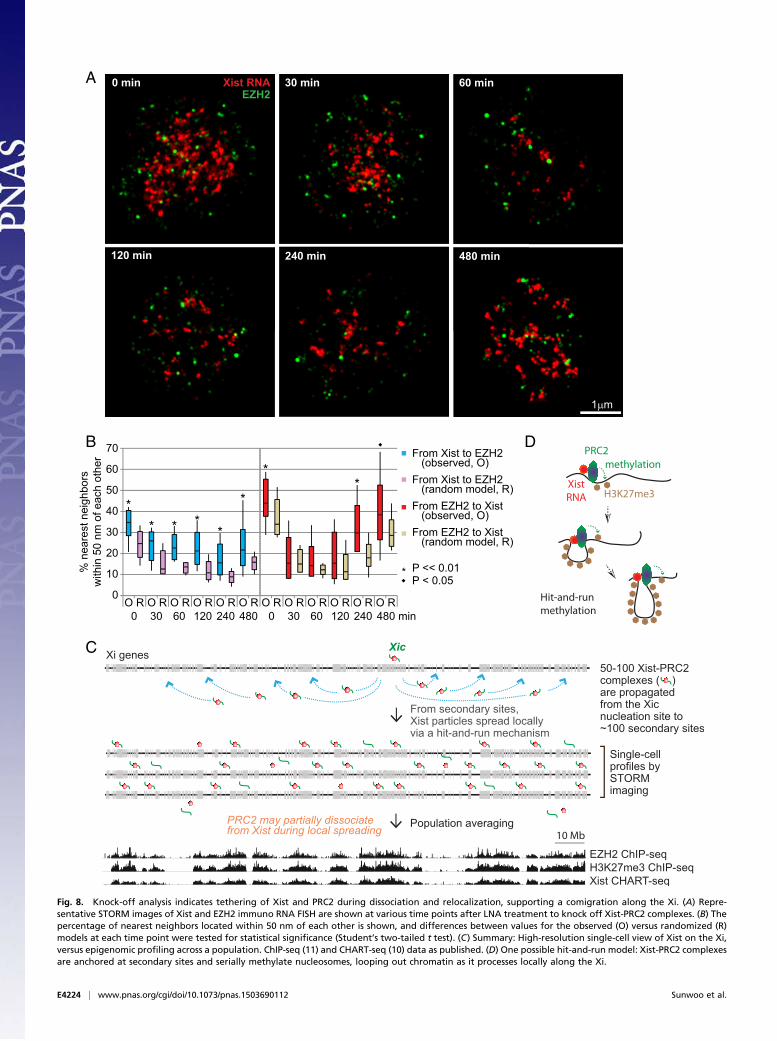
acutely displaced from the Xi using the Xist “knock-off” technology(38). We administered to cells a locked nucleic acid (LNA) anti-sense oligonucleotide (ASO) directed against Xist RNA’s RepeatC region (38), the region which binds to YY1 and enables loadingof the Xist-PRC2 complex to the Xi nucleation center (8). Con-sistent with previous conventional microscopy (38) and CHART-seq (32), STORM demonstrated that Xist RNA was stripped off of
the Xi within 30–60 min of LNA treatment and remained displacedover a 6–8 h time course. At the resolution of single cells and singlechromosomes, STORM analysis showed that the number of Xistpuncta dropped dramatically between 0–3 h of treatment, withnearly all Xist molecules lost on the Xi by 1 h (Fig. 8A, red signals).Xist RNA remained largely displaced until the 8-h mark, when thenumber of Xist puncta began to approximate the unperturbedstate. This rapid dissociation and eventual return provided a timewindow during which we could observe PRC2’s behavior, creating aproxy for real-time visualization, which is currently impossible byFISH or antibody labeling. Significantly, EZH2 puncta decreasedin parallel with Xist RNA during the Xi-dissociation phase andreappeared next to Xist during the Xi-reassociation phase (Fig. 8A,green signals). The Xist and EZH2 puncta remained nonrandomlycoclustered during the dynamic transitions surrounding de-localization and relocalization (Fig. 8 A and B). At the early timepoints (30, 60, and 120 min), the colocalization frequencies werenot statistically significant for the EZH2-to-Xist measurements,most likely due to population averaging of distances. Indeed, whendistributions were examined for each Xist cloud, KS tests revealedstatistical significance (P < 0.05). Altogether, these data providedstrong support for the functional tethering of Xist and PRC2 andthe idea that they travel together as they spread along the length ofthe Xi.In summary, based on our STORM analysis, we propose a
unifying model that reconciles differences between population-
400 nm
0
-4001 µm
A
From Xist To XistH3K27me3
H3K27me3EZH2
EZH2
SMCHD1
SMCHD10
20406080
100120
Day 14Day 10
Day 4Day 7
B
D
C
0
5
10
15
20
25
4 7 10 14
Xis
t clo
ud s
ize
(µm
2 )
1 µm XistH3K27me3
XistSMCHD1
E
Day 10 Day 14Day 4 Day 7
Day of differentiation
250 nm
250 nm
1 µm
1 µm 1 µm
% n
eare
st n
eigh
bors
with
in 5
0 nm
of e
ach
othe
r
Fig. 7. Organization of inactive X chromosome during differentiation of female ES cells. (A) 3D STORM of Xist RNA during ES cell differentiation from days 4–14.Depth in the z-plane is color-coded from red (+400 nm) to green (−400 nm). (B) The Xist cloud became compacted between days 4 and 7 of differentiation (errorbar of SD). (C) Patterns of association with Xist RNA for three Xi markers (EZH2, H3K27me3, and SMCHD1) during ES cell differentiation. Boxes represent mean ±SD. Median is shown as a horizontal line within box. Vertical lines cover range of values. (D, Left) A representative STORM image of Xist (red) and H3K27me3(green) from a day 14 ES cell is shown. (Center) Boxed area is shown at a higher magnification. (Right) H3K27me3 signals are shown in a rainbowmapwhere red ismost dense and purple is least dense. (E, Left) A representative STORM image of Xist (red) and SMCHD1 (green) from a day 14 ES cell is shown. (Center) Boxed areais shown at a higher magnification. (Right) H3K27me3 signals are shown in a rainbow map where red is most dense and purple is least dense.
Sunwoo et al. PNAS | Published online July 20, 2015 | E4223
CELL
BIOLO
GY
PNASPL
US
A
B D
C
Fig. 8. Knock-off analysis indicates tethering of Xist and PRC2 during dissociation and relocalization, supporting a comigration along the Xi. (A) Repre-sentative STORM images of Xist and EZH2 immuno RNA FISH are shown at various time points after LNA treatment to knock off Xist-PRC2 complexes. (B) Thepercentage of nearest neighbors located within 50 nm of each other is shown, and differences between values for the observed (O) versus randomized (R)models at each time point were tested for statistical significance (Student’s two-tailed t test). (C) Summary: High-resolution single-cell view of Xist on the Xi,versus epigenomic profiling across a population. ChIP-seq (11) and CHART-seq (10) data as published. (D) One possible hit-and-run model: Xist-PRC2 complexesare anchored at secondary sites and serially methylate nucleosomes, looping out chromatin as it processes locally along the Xi.
E4224 | www.pnas.org/cgi/doi/10.1073/pnas.1503690112 Sunwoo et al.

based and single-cell analyses (Fig. 8C). The Xist-PRC2 complexfirst loads onto a single nucleation site at the Xic (8) and thenspreads to 100 or so secondary sites on the Xi (11). With only50–100 Xist-PRC2 complexes revealed at the single-cell level ata single point in time, we propose that complexes targeted to thesecondary sites spread locally to methylate nucleosomes in a hit-and-run fashion. In one possible model, Xist and PRC2 are an-chored at secondary sites and serially methylate nucleosomes,looping out chromatin substrates as they process along thechromosome (Fig. 8D). Each complex would have an averagerange of 1–3 Mb or 10–20 genes of the Xi. Because of hit-and-run movements, 50–100 such Xist-PRC2 complexes are visual-ized within the Xi territory at any given time. When summedover millions of cells, a number typically used for CHART-seqand ChIP-seq experiments, broad swaths of Xist and PRC2binding are observed along the Xi, giving the impression of anRNA-protein “coat.” Interestingly, because ∼20% of PRC2 punctashowed a >100-nm separation from Xist RNA (Fig. 3 B andC), a subset of Xi-bound PRC2 molecules may dissociate, atleast transiently, from Xist RNA during spreading, potentiallyaiding in the promulgation of PRC2 and H3K27me3 along thelength of the Xi. Thus, STORM analysis at the single cell level hasprovided a high-resolution view of XCI dynamics and revealed astoichiometry that could not be appreciated by epigenomic analysis.
Materials and MethodsRNA FISH and Immuno RNA FISH. RNA FISH and immuno RNA FISH wereperformed as described elsewhere with minor modifications (39). Afterstaining, cells were dehydrated in series of ethanol and stored in dark untilSTORM imaging. Detailed methods of cell and probe preparation and an-tibodies are listed in the SI Materials and Methods.
Measuring Xist RNA Copy Numbers by RT-PCR. RT-PCR with in vitro transcribedspike-in Xist RNA harboring a 38-nt deletion was performed as describedelsewhere (26). From a plate, 106 MEF cells were used for RT-PCR while asmall fraction was used to count the number of Xist cloud by RNA FISH usinga pool of eight oligonucleotide probes. The number of Xist cloud per cellswas determined based on the number of observed Xist cloud and thenumber of nuclei counter stained by Hoechst 33342.
STORM Imaging and Analysis. STORM imaging was performed on an N-STORM(Nikon) equipped with 100×/1.4 N.A. λ objective lens. For two color STORMimaging, sequential imaging with appropriate emission filters (Cy5 em filterfor Alexa 647 and Cy3 em filter for Cy3B) was adapted to suppress anycrosstalk. After a polynomical function was fitted between two channelSTORM imaging of 100 nm TetraSpeck beads (Life Technology) by Matlab(Mathworks), all two-color STORM data sets were corrected accordingly. Xistcloud was identified based on localization density. Distances were measuredfrom any Xist localization to all localizations of Xi markers within the cloudto determine nearest Xi marker localizations. For localization of Xi markers,reciprocal calculation was performed. To create the random model, Xistcoordinates were randomly shuffled within the already defined area of eachXist cloud. Nearest neighbor’s distance between randomized Xist and Ximarkers was calculated as described above.
ACKNOWLEDGMENTS. We thank Dr. Xiaowei Zhuang for critical comments onthe manuscript and many helpful discussions regarding STORM. We also thankmembers of the Lee laboratory for support and valuable discussions; D. Spector(Cold Spring Harbor Laboratory) for the 2-6-3 cell line; Benjamin Heuberger(Massachusetts General Hospital) for oligo synthesis; Do-hyun Kim (Food andDrug Administration), Christopher E. Carr (MGH), Hongshin Sunwoo, andDoory Kim (Zhuang laboratory) for help with MatLab programming. H.S.was supported by the MGH Fund for Medical Discovery. J.Y.W. was supportedby National Science Foundation Graduate Research fellowship. J.T.L. was sup-ported by NIH RO1-GM090278. J.T.L. is an Investigator of the Howard HughesMedical Institute.
1. Starmer J, Magnuson T (2009) A new model for random X chromosome inactivation.Development 136(1):1–10.
2. Wutz A (2011) Gene silencing in X-chromosome inactivation: Advances in un-derstanding facultative heterochromatin formation. Nat Rev Genet 12(8):542–553.
3. Disteche CM (2012) Dosage compensation of the sex chromosomes. Annu Rev Genet46:537–560.
4. Lee JT (2011) Gracefully ageing at 50, X-chromosome inactivation becomes a para-digm for RNA and chromatin control. Nat Rev Mol Cell Biol 12(12):815–826.
5. Brown CJ, et al. (1992) The humanXIST gene: Analysis of a 17 kb inactive X-specific RNA thatcontains conserved repeats and is highly localized within the nucleus. Cell 71(3):527–542.
6. Clemson CM, McNeil JA, Willard HF, Lawrence JB (1996) XIST RNA paints the inactive Xchromosome at interphase: Evidence for a novel RNA involved in nuclear/chromo-some structure. J Cell Biol 132(3):259–275.
7. Zhao J, Sun BK, Erwin JA, Song JJ, Lee JT (2008) Polycomb proteins targeted by a shortrepeat RNA to the mouse X chromosome. Science 322(5902):750–756.
8. Jeon Y, Lee JT (2011) YY1 tethers Xist RNA to the inactive X nucleation center. Cell146(1):119–133.
9. Silva J, et al. (2003) Establishment of histone h3 methylation on the inactive X chro-mosome requires transient recruitment of Eed-Enx1 polycomb group complexes. DevCell 4(4):481–495.
10. Simon MD, et al. (2013) High-resolution Xist binding maps reveal two-step spreadingduring X-chromosome inactivation. Nature 504(7480):465–469.
11. Pinter SF, et al. (2012) Spreading of X chromosome inactivation via a hierarchy ofdefined Polycomb stations. Genome Res 22(10):1864–1876.
12. Kohlmaier A, et al. (2004) A chromosomal memory triggered by Xist regulates histonemethylation in X inactivation. PLoS Biol 2(7):E171.
13. Plath K, et al. (2003) Role of histone H3 lysine 27 methylation in X inactivation.Science 300(5616):131–135.
14. Engreitz JM, et al. (2013) The Xist lncRNA exploits three-dimensional genome archi-tecture to spread across the X chromosome. Science 341(6147):1237973.
15. Calabrese JM, et al. (2012) Site-specific silencing of regulatory elements as a mecha-nism of X inactivation. Cell 151(5):951–963.
16. Duthie SM, et al. (1999) Xist RNA exhibits a banded localization on the inactive X chro-mosome and is excluded from autosomal material in cis. Hum Mol Genet 8(2):195–204.
17. Chadwick BP, Willard HF (2004) Multiple spatially distinct types of facultative het-erochromatin on the human inactive X chromosome. Proc Natl Acad Sci USA 101(50):17450–17455.
18. Gendrel AV, et al. (2012) Smchd1-dependent and -independent pathways determinedevelopmental dynamics of CpG island methylation on the inactive X chromosome.Dev Cell 23(2):265–279.
19. Nozawa RS, et al. (2013) Human inactive X chromosome is compacted through aPRC2-independent SMCHD1-HBiX1 pathway. Nat Struct Mol Biol 20(5):566–573.
20. Cerase A, et al. (2014) Spatial separation of Xist RNA and polycomb proteins revealedby superresolution microscopy. Proc Natl Acad Sci USA 111(6):2235–2240.
21. Smeets D, et al. (2014) Three-dimensional super-resolution microscopy of the inactiveX chromosome territory reveals a collapse of its active nuclear compartment har-boring distinct Xist RNA foci. Epigenetics Chromatin 7:8.
22. Rust MJ, Bates M, Zhuang X (2006) Sub-diffraction-limit imaging by stochastic opticalreconstruction microscopy (STORM). Nat Methods 3(10):793–795.
23. Dempsey GT, Vaughan JC, Chen KH, Bates M, Zhuang X (2011) Evaluation of fluo-rophores for optimal performance in localization-based super-resolution imaging.Nat Methods 8(12):1027–1036.
24. Huang B, Wang W, Bates M, Zhuang X (2008) Three-dimensional super-resolutionimaging by stochastic optical reconstruction microscopy. Science 319(5864):810–813.
25. Buzin CH, Mann JR, Singer-Sam J (1994) Quantitative RT-PCR assays show Xist RNAlevels are low in mouse female adult tissue, embryos and embryoid bodies.Development 120(12):3529–3536.
26. Sun BK, Deaton AM, Lee JT (2006) A transient heterochromatic state in Xist preemptsX inactivation choice without RNA stabilization. Mol Cell 21(5):617–628.
27. Femino AM, Fay FS, Fogarty K, Singer RH (1998) Visualization of single RNA transcriptsin situ. Science 280(5363):585–590.
28. Wang J, et al. (2001) Imprinted X inactivation maintained by a mouse Polycomb groupgene. Nat Genet 28(4):371–375.
29. Cifuentes-Rojas C, Hernandez AJ, Sarma K, Lee JT (2014) Regulatory interactionsbetween RNA and polycomb repressive complex 2. Mol Cell 55(2):171–185.
30. Davidovich C, et al. (2015) Toward a consensus on the binding specificity and pro-miscuity of PRC2 for RNA. Mol Cell 57(3):552–558.
31. Janicki SM, et al. (2004) From silencing to gene expression: Real-time analysis in singlecells. Cell 116(5):683–698.
32. Simon JA, Kingston RE (2013) Occupying chromatin: Polycomb mechanisms for getting togenomic targets, stopping transcriptional traffic, and staying put. Mol Cell 49(5):808–824.
33. Di Croce L, Helin K (2013) Transcriptional regulation by Polycomb group proteins. NatStruct Mol Biol 20(10):1147–1155.
34. Ciferri C, et al. (2012) Molecular architecture of human polycomb repressive complex2. eLife 1:e00005.
35. Hasegawa Y, et al. (2010) The matrix protein hnRNP U is required for chromosomallocalization of Xist RNA. Dev Cell 19(3):469–476.
36. Sarma K, et al. (2014) ATRX directs binding of PRC2 to Xist RNA and Polycomb targets.Cell 159(4):869–883.
37. Blewitt ME, et al. (2008) SmcHD1, containing a structural-maintenance-of-chromo-somes hinge domain, has a critical role in X inactivation. Nat Genet 40(5):663–669.
38. Sarma K, Levasseur P, Aristarkhov A, Lee JT (2010) Locked nucleic acids (LNAs) revealsequence requirements and kinetics of Xist RNA localization to the X chromosome.Proc Natl Acad Sci USA 107(51):22196–22201.
39. Sunwoo H, et al. (2009) MEN epsilon/beta nuclear-retained non-coding RNAs are up-regulated upon muscle differentiation and are essential components of paraspeckles.Genome Res 19(3):347–359.
Sunwoo et al. PNAS | Published online July 20, 2015 | E4225
CELL
BIOLO
GY
PNASPL
US