a test of sample matching using a pseudo-web sample · a test of sample matching using a pseudo-web...
TRANSCRIPT
Telling Canada’s story in numbers
Golshid Chatrchi and Jack Gambino
INPS Conference, March 16, 2017
A test of sample matching
using a pseudo-web sample
13/03/20172
Outline
• Introduction
• Sample matching
• Pseudo-web sample
• Simulation results
• Carrot project: an experiment
13/03/20173
Introduction
• With increasing levels of nonresponse in
household surveys, there is renewed interest in
alternatives to the traditional way of conducting
surveys.
• Can we use non-probability samples in a
probabilistic way? How about the self selection
bias?

13/03/20174
• Bethlehem (2014)
“Due to (high) nonresponse, probability sampling
surveys more and more resemble self-selection
surveys.“
• Rivers (2007)
“There is no logical difference between the type of
modeling assumptions needed for nonresponse
adjustments and those needed for self-selected
samples.”
13/03/20175
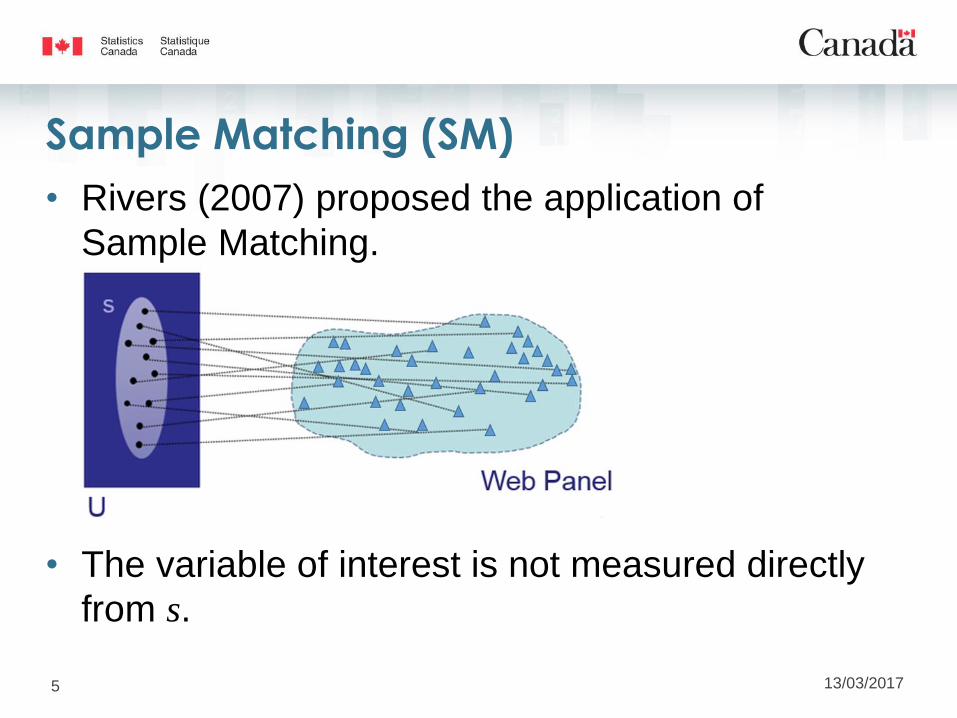
Sample Matching (SM)
• Rivers (2007) proposed the application of
Sample Matching.
• The variable of interest is not measured directly
from s.
13/03/20176
SM- population of interest
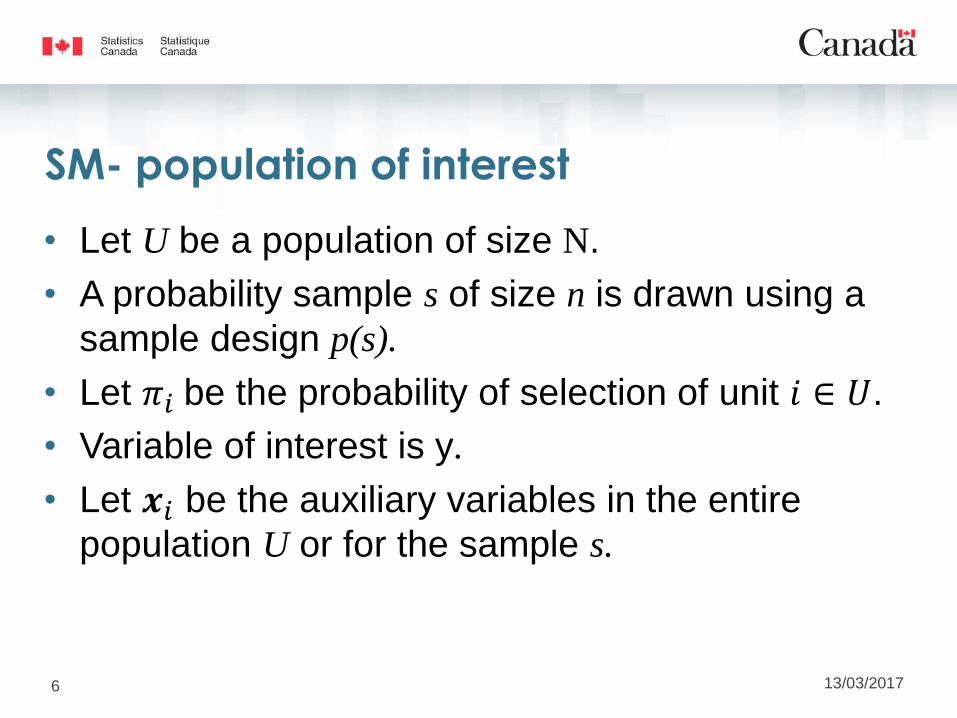
• Let U be a population of size N.
• A probability sample s of size n is drawn using a
sample design p(s).
• Let 𝜋𝑖 be the probability of selection of unit 𝑖 ∈ 𝑈.
• Variable of interest is y.
• Let 𝒙𝑖 be the auxiliary variables in the entire
population U or for the sample s.

13/03/20177
SM- panel
• Let 𝑛∗ be the size of panel.
• Let 𝒙1∗ , … , 𝒙𝑛∗
∗ be the auxiliary variables in the
panel.
• Let 𝑦1∗, … , 𝑦𝑛∗
∗ be the values of the
measurements in the panel.
• Let 𝑧𝑖 be an indicator of responding to the web-
panel survey.
• We assume that 𝑧𝑖 = 1, i = 1, … , 𝑛∗.
13/03/20178
SM- mechanism
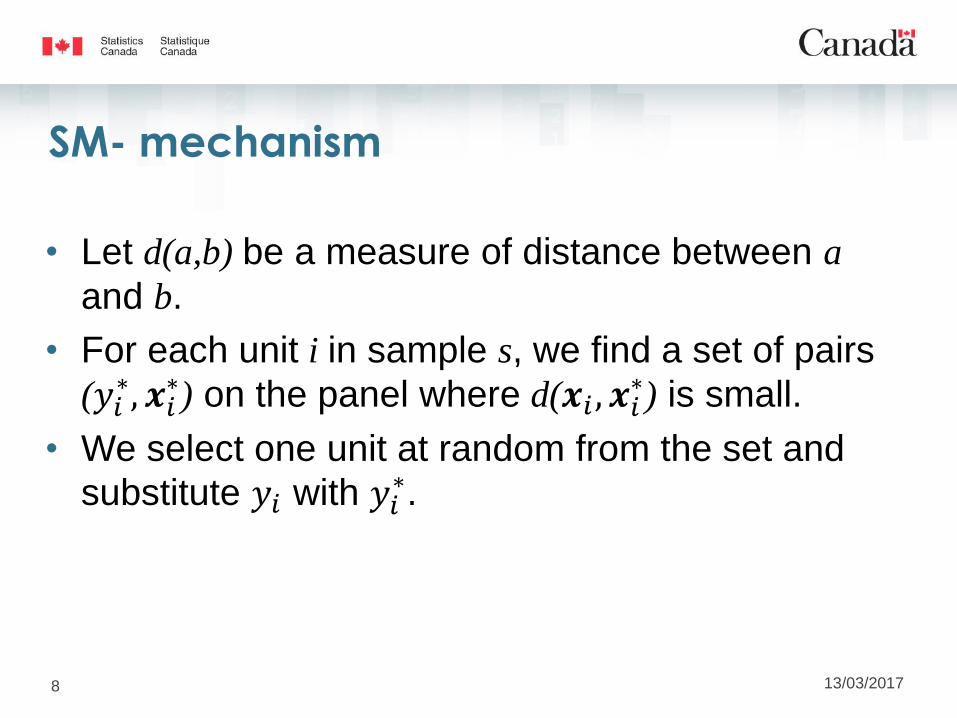
• Let d(a,b) be a measure of distance between a
and b.
• For each unit i in sample s, we find a set of pairs
(𝑦𝑖∗, 𝒙𝑖
∗) on the panel where d(𝒙𝑖 , 𝒙𝑖∗) is small.
• We select one unit at random from the set and
substitute 𝑦𝑖 with 𝑦𝑖∗.
13/03/20179
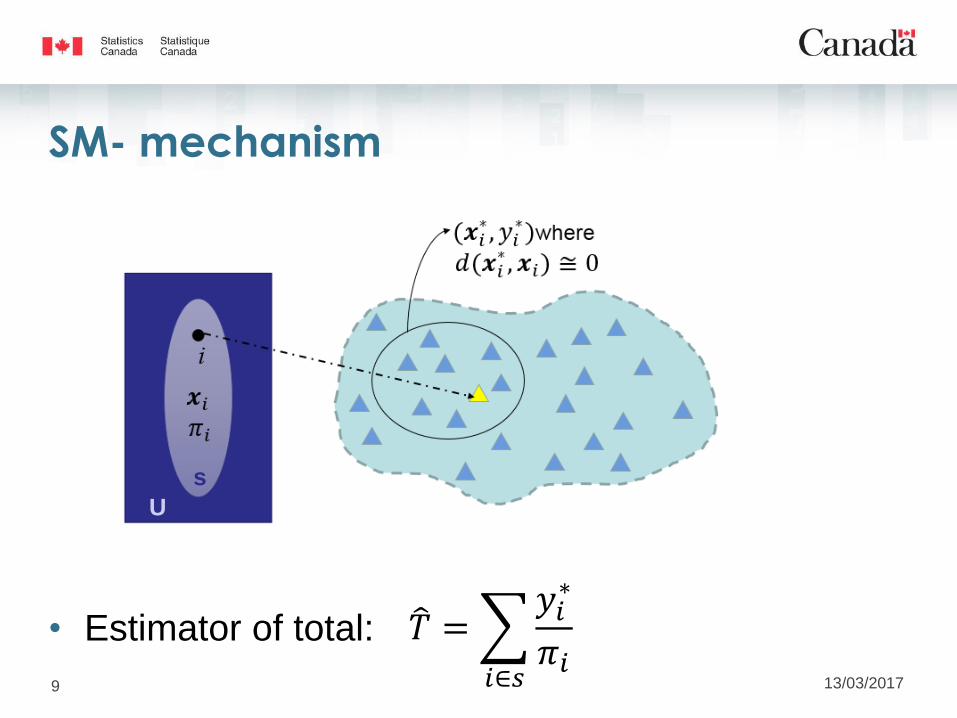
SM- mechanism
• Estimator of total:
U
s
𝑇 =
𝑖∈𝑠
𝑦𝑖∗
𝜋𝑖

13/03/201710
SM- assumptions
There are three main assumptions in Rivers’ paper:
1. “iid” data generating process (𝑦𝑖 , 𝒙𝑖 , 𝑧𝑖)
2. The panel covers all relevant portions of the
population U.
3. Ignorable selection
𝐹𝑌|𝑋 𝑦 𝒙 = 𝐹𝑌∗|𝑋∗ 𝑦 𝒙 ∀𝒙, 𝑦
The conditional distribution of Y on X in the
population is identical to that in the panel.
13/03/201711
Pseudo-web sample
• Two different household surveys are used to
simulate the SM methodology:
• 2011 National Household Survey (NHS)
• 2011 Canadian Labour Force Survey (LFS)
• NHS respondents are considered as the
population of the study. A probability sample s is
selected from the NHS.
• LFS respondents are treated as a pseudo-web
sample.

13/03/201712
National Household Survey (NHS)
• Statistics Canada conducted the NHS in May
2011 as a replacement for the long census
questionnaire.
• The survey was designed to collect social and
economic data about the Canadian population.
• NHS respondents~ 6.7 million persons
(“population size”)

13/03/201713
Labour Force Survey (LFS)
• The LFS is a household survey carried out
monthly by Statistics Canada.
• The goal of the survey is to provide information
on major labour market trends such as
unemployment rates.
• May 2011 LFS respondents ~127,000 persons
(“Panel size”)

13/03/201714
Why NHS and LFS?
• Demographic information from both surveys can
be used as auxiliary information.
• NHS is large enough to be considered as our
population.
• Both surveys were conducted in May 2011.
• Both surveys collect information on the labour
force status and we can evaluate the method
using NHS data.
13/03/201715
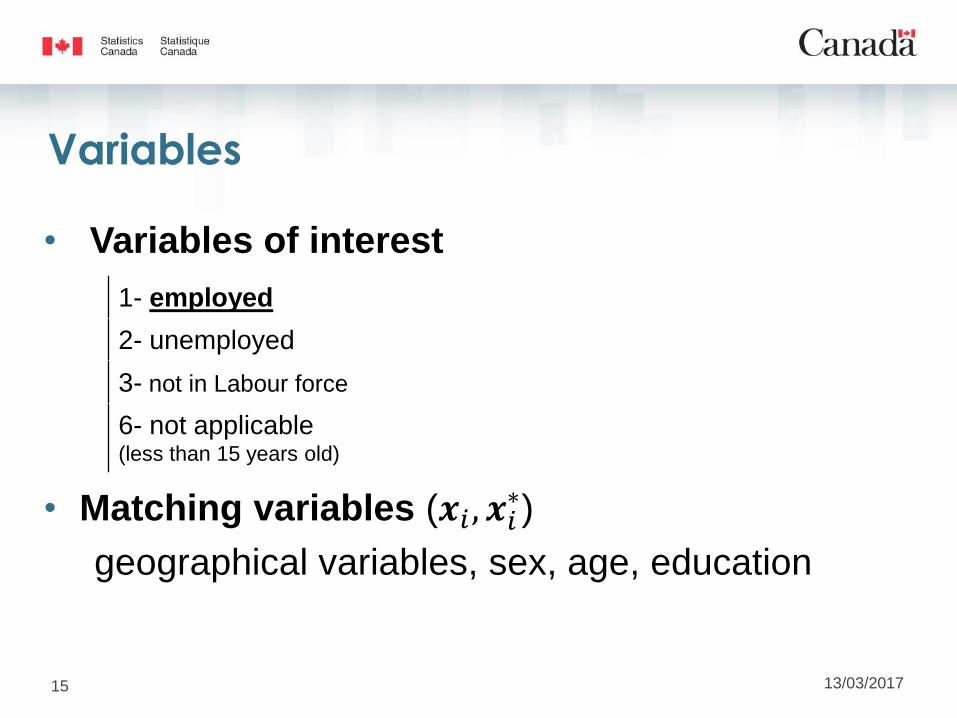
Variables
• Variables of interest
• Matching variables (𝒙𝑖 , 𝒙𝑖∗)
geographical variables, sex, age, education
1- employed
2- unemployed
3- not in Labour force
6- not applicable (less than 15 years old)

13/03/201716
Simulation• Random sample from NHS
• Sample size : 5000, 10000, 25000
• R=1000 simulated samples
• Matching variables:• Age/sex/province
• Age/sex/education
• Variable of interest: respondent was employed
during the reference week
y =1 if respondent was employed
0 otherwise
13/03/201717
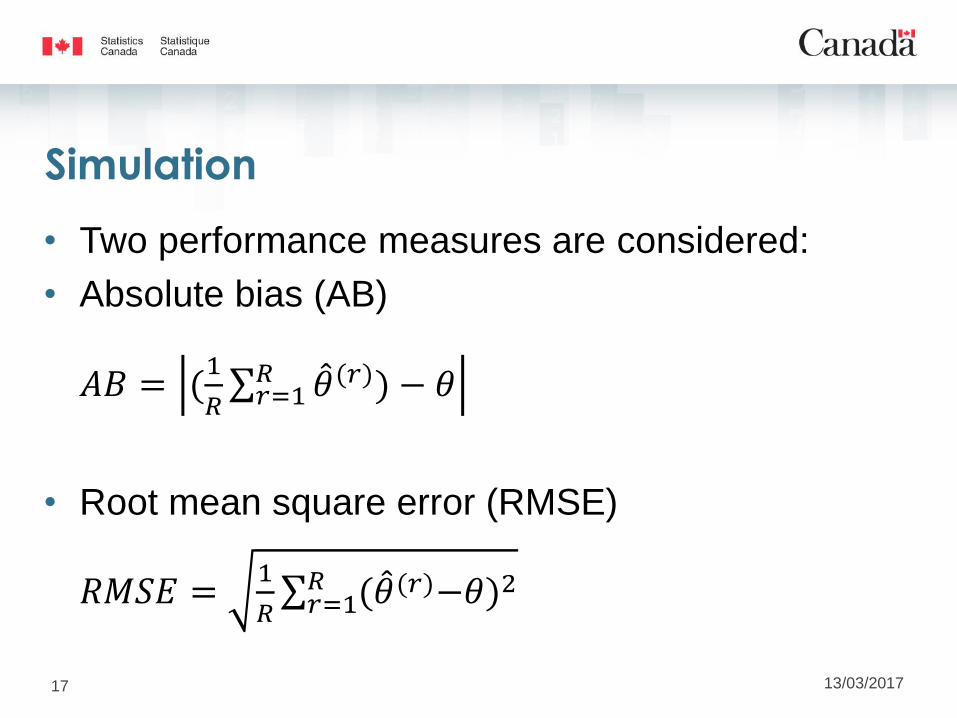
Simulation
• Two performance measures are considered:
• Absolute bias (AB)
𝐴𝐵 = (1
𝑅 𝑟=1
𝑅 𝜃(𝑟)) − 𝜃
• Root mean square error (RMSE)
𝑅𝑀𝑆𝐸 =1
𝑅 𝑟=1
𝑅 ( 𝜃(𝑟)−𝜃)2

13/03/201718
Simulation 1
• Matching variable: province*age*sex
• R=1000 simulated samples
• SRS
n AB RMSE
5000 0.036 0.694
10000 0.028 0.520
25000 0.004 0.321
50000 0.071 0.230
100000 0.659 0.912
150000 1.225 1.463
13/03/201719
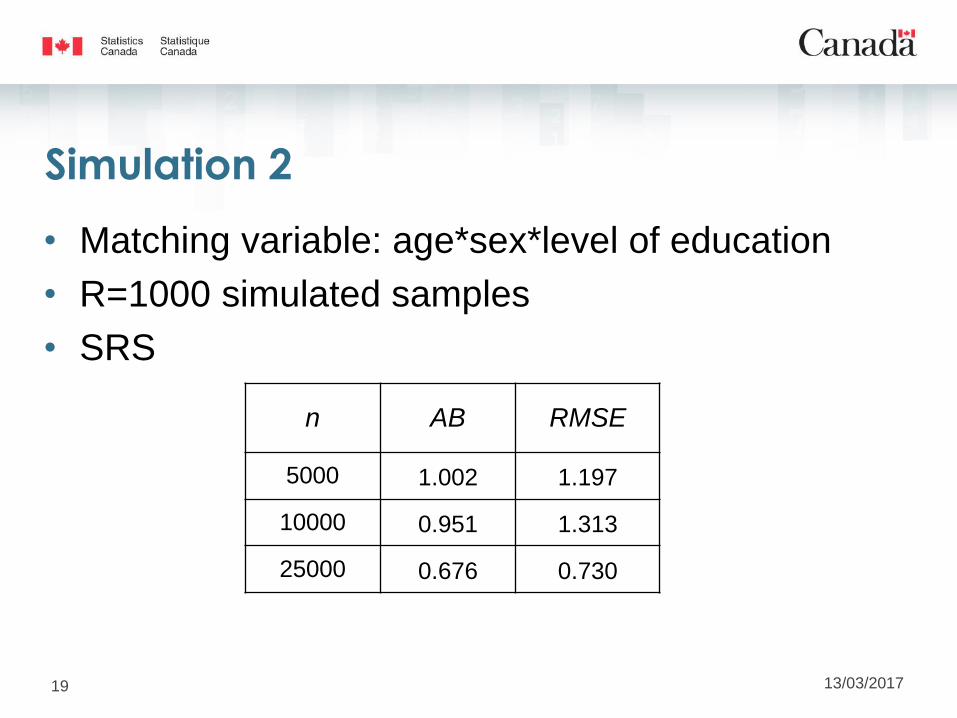
Simulation 2
• Matching variable: age*sex*level of education
• R=1000 simulated samples
• SRS
n AB RMSE
5000 1.002 1.197
10000 0.951 1.313
25000 0.676 0.730
13/03/201720
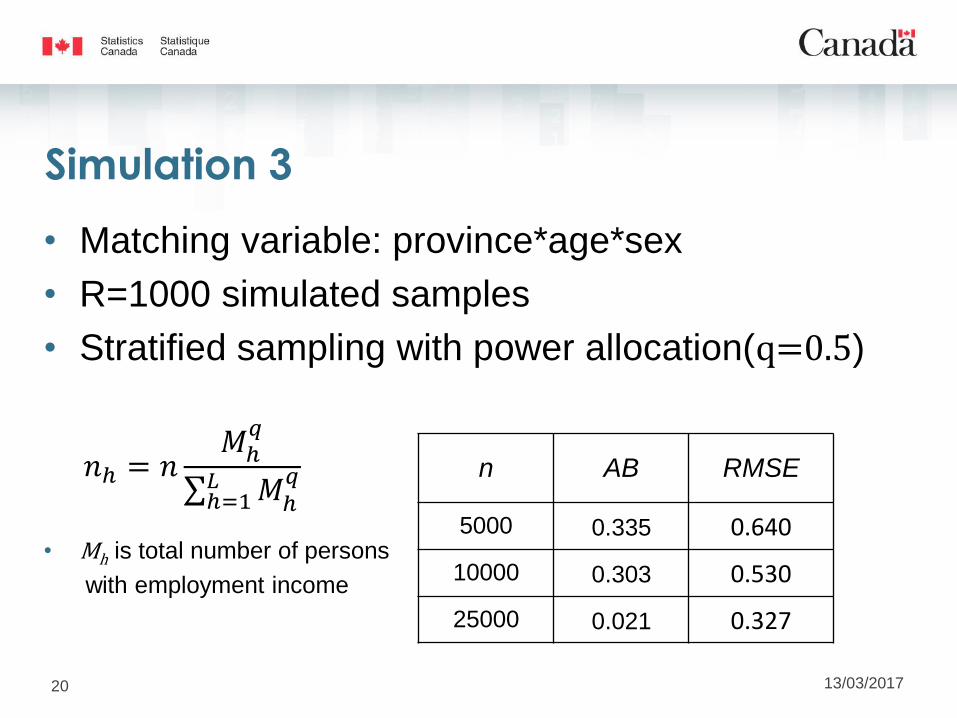
Simulation 3
• Matching variable: province*age*sex
• R=1000 simulated samples
• Stratified sampling with power allocation(q=0.5)
• Mh is total number of persons
with employment income
n AB RMSE
5000 0.335 0.640
10000 0.303 0.530
25000 0.021 0.327
𝑛ℎ = 𝑛𝑀ℎ
𝑞
ℎ=1𝐿 𝑀ℎ
𝑞
13/03/201721
Lessons learned
• Sample size
• Matching variables
• Sampling mechanism
Rivers (2007)
• “Sample matching is nearly unbiased if the panel is five
times the size of the target sample.”
• “The plausibility of this assumption depends largely on the
extent and relevance of the matching variables.”
• “Matching from a sufficiently large and diverse panel yields
results similar to a SRS.”
13/03/201722
Limitations of the method
• Survey data don’t have the same characteristics
as the panel data
• self-selected
• coverage
• Variable of interest (LFS) is a complex derived
variable.
• Imputation impact

13/03/201723
Carrot Project: an experiment
• Carrot Rewards app*
• incentive-based digital platform
• originally, a wellness app for
making healthy choices
• Register using basic demographic information
• Register rewards card (gas card, movie card, AEROPLAN miles)
• Receive mini surveys
• Complete tasks and collect reward points
*non-governmental application developed by Social Change Rewards (www.carrotinsights.com)
13/03/201724
Carrot Project: an experiment
• Three mini surveys were tested using content from
the Canadian Community Health Survey (CCHS).
• Survey #1: Demographics + Alcohol consumption
• Survey #2: Exposure to second hand smoke
• Survey #3: Neighbourhood environment
• Surveys #2 and #3 were only sent to respondents
of the first survey.
13/03/201725
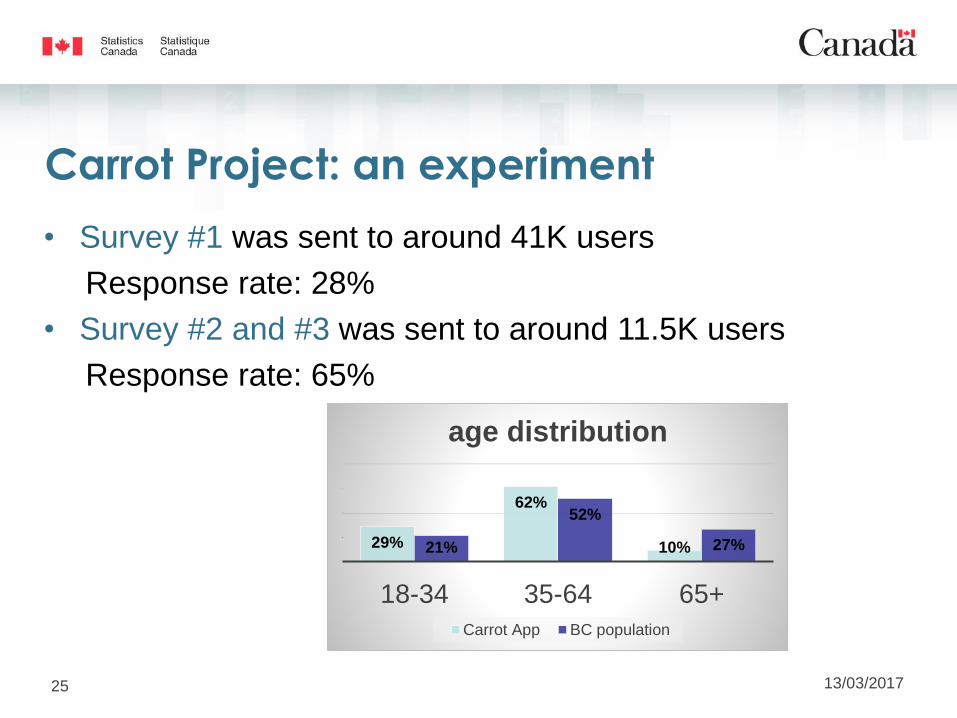
Carrot Project: an experiment
• Survey #1 was sent to around 41K users
Response rate: 28%
• Survey #2 and #3 was sent to around 11.5K users
Response rate: 65%
29%
62%
10%21%
52%
27%
18-34 35-64 65+
age distribution
Carrot App BC population
13/03/201726
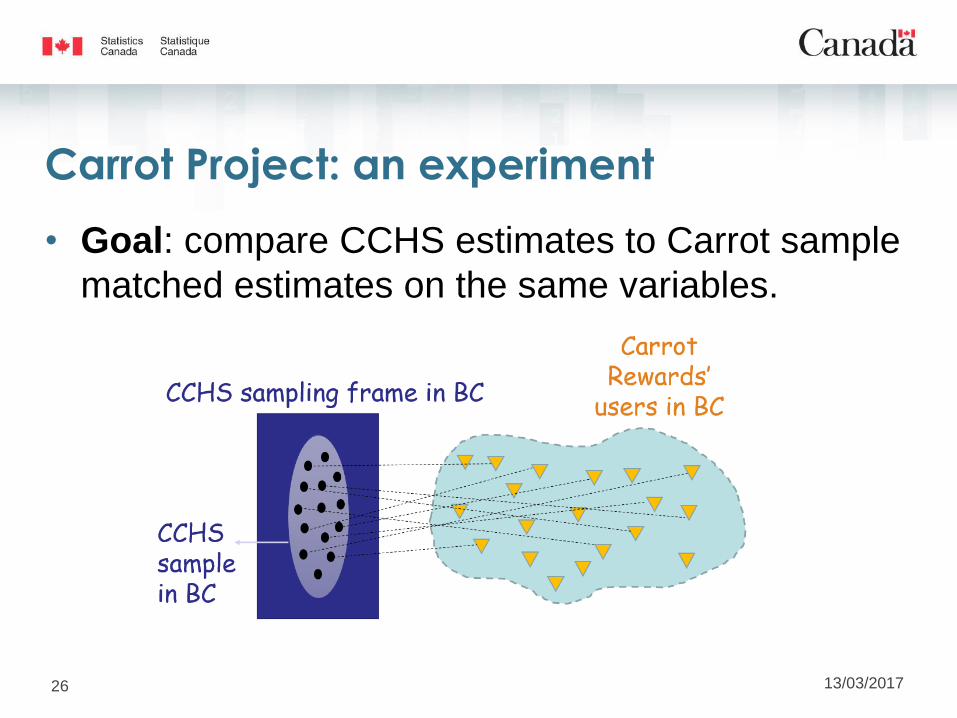
Carrot Project: an experiment
• Goal: compare CCHS estimates to Carrot sample
matched estimates on the same variables.

13/03/201727
Where are we heading?

13/03/201728
Thank you
For more
information please
contact:
Golshid Chatrchi
Jack Gambino
Merci
Pour plus
d’information,
veuillez contacter: