a three-dimensional articulatory model of the velum and...
TRANSCRIPT

A three-dimensional articulatory model of the velum andnasopharyngeal wall based on MRI and CT data
Antoine Serrurier and Pierre Badina�
GIPSA-lab, UMR 5216 CNRS-INPG-UJF-Université Stendhal, Département Parole and Cognition/ICP,46 avenue Félix Viallet, 38031 Grenoble Cedex 01, France
�Received 1 June 2007; revised 21 January 2008; accepted 23 January 2008�
An original three-dimensional �3D� linear articulatory model of the velum and nasopharyngeal wallhas been developed from magnetic resonance imaging �MRI� and computed tomography images ofa French subject sustaining a set of 46 articulations, covering his articulatory repertoire. The velumand nasopharyngeal wall are represented by generic surface triangular meshes fitted to the 3Dcontours extracted from MRI for each articulation. Two degrees of freedom were uncovered byprincipal component analysis: first, VL accounts for 83% of the velum variance, corresponding to anoblique vertical movement seemingly related to the levator veli palatini muscle; second, VSexplains another 6% of the velum variance, controlling a mostly horizontal movement possiblyrelated to the sphincter action of the superior pharyngeal constrictor. The nasopharyngeal wall isalso controlled by VL for 47% of its variance. Electromagnetic articulographic data recorded on thevelum fitted these parameters exactly, and may serve to recover dynamic velum 3D shapes. Themain oral and nasopharyngeal area functions controlled by the articulatory model, complemented bythe area functions derived from the complex geometry of each nasal passage extracted from coronalMRIs, were fed to an acoustic model and gave promising results about the influence of velummovements on the spectral characteristics of nasals. © 2008 Acoustical Society of America.�DOI: 10.1121/1.2875111�
PACS number�s�: 43.70.Bk, 43.70.Jt, 43.70.Aj �CHS� Pages: 2335–2355
I. INTRODUCTION
According to Crystal �1997�, “nasality is a term used inthe phonetic classification of speech sounds on the basis ofmanner of articulation: it refers to sounds produced while thesoft palate �or velum� is lowered to allow an audible escapeof air through the nose.” Understanding the production ofnasal sounds therefore requires a good knowledge of thevariable shape of the velopharyngeal port that connects therigid nasal tract to the vocal tract, and that is delimited by thevelum and the nasopharyngeal wall. A large number of stud-ies have been devoted to the production of nasality �see, e.g.,Ferguson, Hyman, and Ohala, 1975 or Huffman and Krakow,1993�.
A first gross estimation of the nasal tract geometry wasproposed by House and Stevens �1956� from anatomical con-siderations. The first systematic anatomical measures of thenasal tract that we know of were performed by Bjuggren andFant �1964�, who traced cross-sectional contours from slicescut from a plastic mold of the nasal passages of a cadaver.The cross-sectional contours and nasal passage areas thatthey proposed have served as a standard reference for manydecades, and have been used for acoustical simulations. Thefirst, and as far as we know the only, sets of transversalimages of the velopharyngeal port obtained by x-ray tomog-raphy were recorded by Björk �1961� for ten subjects utter-ing sustained articulations. Associating these images withsagittal x-ray tomography images of the same subjects, he
a�Author to whom correspondence should be addressed. Electronic mail:
[email protected]J. Acoust. Soc. Am. 123 �4�, April 2008 0001-4966/2008/123�4
found a linear relation between the nasal tract transverse cou-pling area and the velum/pharyngeal wall sagittal distance inthe midsagittal plane for distances greater than 0.2 cm. Themagnetic resonance imaging �MRI� technique is still consid-ered to be the only imaging technique that is safe for thesubject and that delivers comprehensive three-dimensional�3D� data. It has thus been largely used for determining thegeometry of the vocal tract in speech �see, e.g., Baer, Gore,Gracco, and Nye, 1991, Story, Titze, and Hoffman, 1996;Engwall and Badin, 1999; Badin, Bailly, Revéret, Baciu,Segebarth, and Savariaux, 2002� and has allowed new mea-surements on live subjects and permitted researchers to ob-tain more accurate area functions of the nasal tract. In 1992,Matsumura and Sugiura �1992� published the first cross-sectional profiles of nasal passages from MRI images. Areafunctions derived from these measurements were thus pro-posed by Matsumura, Niikawa, Shimizu, Hashimoto, andMorita �1994� two years later. At the same time, Dang,Honda, and Suzuki �1994� led a similar study which pro-posed new area functions and compared their results withthose obtained by Bjuggren and Fant �1964�. They high-lighted in particular the importance of mucosa in the nasalpassages. Demolin, Lecuit, Metens, Nazarian, and Soquet�1998� subsequently performed a unique 3D study of velo-pharyngeal port opening from MR images recorded on foursubjects pronouncing French nasal vowels and their oralcounterparts; more details on the cross-sectional contoursand areas of velopharyngeal port were then provided byDemolin, Delvaux, Metens, and Soquet �2003�. Delvaux,Metens and Soquet �2002� studied the position and shape of
the velum and the associated coordination of other articula-© 2008 Acoustical Society of America 2335�/2335/21/$23.00

˜
tors such as tongue movements used by French speakingsubjects in the production of French nasal vowels. Interest-ingly, they noted a possible contact between the velum andthe tongue for low velar positions.
Physiologically, the velopharyngeal port is organized ina complex way. A network of muscles linking the surround-ing organs, i.e., the velum, the lateral and posterior pharyn-geal walls and the tongue, controls the velopharyngeal port’sopening/closing mechanism. The velum, the principal organinvolved in the mechanism, is known to be controlled mainlyby five muscles �see Fig. 1�. Its major muscle, the levatorveli palatini, stretches symmetrically from the medial regionof the velum to the right and left Eustachian tubes. The twoother muscles of the velum are the tensor veli palatini,stretching laterally and symmetrically from the medial regionof the velum to the base of the cranium and passing througha tendon acting as a pulley to ensure a lateral tensing of thevelum, and the uvulae muscle �not visible in Fig. 1�, locatedentirely in the uvula—an appendix of the velum in the mid-sagittal region �see, for example, Fig. 2 for various uvulapositions�, which is believed to have only a small impact onthe velopharyngeal mechanism in speech. In addition, the
FIG. 1. Midsagittal view �a� and oblique anterior view �b� of vocal tract andvelopharyngeal port movements �from Kent, 1997�; 1: Tensor veli palatinisuperior constrictor.
5 10 15
6
8
10
12
/ta/
5 10 15
6
8
10
12
/na/
5 10 15
6
8
10
12
/ /�
5 10 15
6
8
10
12
/ /��
FIG. 2. �Color online� Midsagittal contours of the vocal tract for oral andnasal stop consonants /ta/ and /na/ �top� and for oral and nasal vowels /Å/ and
Å �bottom�. The thicker lines represent the velum contours.
2336 J. Acoust. Soc. Am., Vol. 123, No. 4, April 2008 A. Serr
velum is connected with its two neighboring organs: firstwith the tongue, through the palatoglossus muscle, with ori-gin in the medial lower part of the velum and linking thelateral basis of the tongue along the borders of the oral cav-ity, known as the anterior faucial pillars; second with thepharyngeal walls, through the palatopharyngeus muscle,with its main origin in the medial upper part of the velumand linking the pharyngeal walls by forming the two poste-rior faucial pillars on both sides of the oral cavity �see, forexample, Kent, 1997, for more detailed description of thesemuscles�. The pharyngeal walls are principally activethrough the superior, middle and inferior constrictor musclesthat surround the tract. The muscular structure of this region,in particular the interspersion between muscles from the ve-lum, the pharyngeal walls, and the tongue, leads to asphincter-like behavior �Amelot, Crevier-Buchman, andMaeda, 2003�. Note that the contraction of the fibers of thepalatopharyngeus muscle with those of the pterygopharyn-geal portion of the superior constrictor leads to a prominenceof the posterior wall called Passavant’s pad �Zemlin, 1968�,which contributes also to the sphincter effect. This effectmay be speaker dependent, and at least four velopharyngealclosure patterns, depending on the anatomy of the speaker,have been reported �see, for example, Kent, 1997, andAmelot et al., 2003, from fiberscopic data�. The active orpassive role played by each muscle involved in the closuremechanism during speech has led to various interpretations�see, for example Dickson and Dickson �1972�; Bell-Berti�1976�; Kollia, Gracco, and Harris �1995� and Wrench,1999�, although “the levator (veli)palatini muscle is widelyaccepted as the muscle primarily responsible for closing thevelopharyngeal port by exerting an upward and backwardpull on the velum” �Bell-Berti, 1993�.
Due to the complex organization of the velopharyngealport, the relative difficulty collecting geometric informationin this region of the vocal tract, and consequently of measur-ing velopharyngeal movements, only a few articulatory mod-els deal with nasals. House and Stevens �1956� proposed abasic model of nasal tract to oral tract coupling where thecoupling seems to be implemented simply through a linearinterpolation of the area function from the first velopharyn-geal cross-sectional area to the first nasal tract area consid-
atic directions of action of the principal muscles involved in the velum andevator veli palatini; 3: Palatoglossus; 4: Palatopharyngeus; 5: Pharyngeal
schem; 2: L
ered as fixed; they used this model for acoustical simulations
urier and P. Badin: Three-dimensional articulatory modeling of velum

and perceptual studies of nasality. Fant �1960� investigatedthe influence of nasal area coupling in terms of acoustics bymodeling the area function of the velopharyngeal port by asingle tube. Maeda �1982� and Fant �1985� used a modelsimilar to that of House and Stevens �1956�, augmented withsinus cavities, in order to assess the contribution of thesesinuses to the overall acoustic characteristics of nasals. Mer-melstein �1973� proposed a crude geometric midsagittalmodel of velum shape and assumed the velar opening area tobe proportional to the square of the distance between thecurrent uvula position and the position attained when thevelopharyngeal port is closed. This model has been used inparticular by Teixeira, Vaz, Moutinho, and Coimbra �2001�for perceptual tests of synthesized Portuguese nasals �Teix-eira, Moutinho, and Coimbra, 2003�.
The development of more realistic models of speechproduction—and particularly of nasals—calls for more de-tailed 3D articulatory models of the velopharyngeal port andof the nasal cavities. Indeed, the accurate area functions ofthe complex nasal passages and velopharyngeal port that areneeded to feed acoustical models, and thus to generatespeech, cannot be obtained with simple models: for somenasal articulations, e.g., the French back nasal vowels, ashighlighted by Demolin et al. �2003�, the uvula can be incontact with both the back of the tongue and the pharyngealwall in the midsagittal region �see Fig. 2�, leading to a mid-sagittal occlusion, though the channels on each side of thisocclusion remain open. Such articulations thus require a 3Ddescription. More or less successful ad hoc transformationsfrom midsagittal shape to area function have been proposedfor the oral tract �see, e.g., Sundberg, Johansson, Wilbr, andYtterbergh, 1987; Beautemps, Badin, and Bailly, 2001�; butthe only model proposed for the velopharyngeal port �Mer-melstein, 1973� cannot deal with a midsagittal occlusion. Itthus appears that a 3D model in which appropriate informa-tion is provided about the transverse structure of the vocaland nasal tracts is clearly needed.
This present study is intended to result in a nasal tractthat complements the 3D linear articulatory models previ-ously built in our laboratory �Beautemps et al., 2001; Badinet al., 2002� in the framework of the development of talkingheads �Badin, Bailly, Elisei, and Odisio, 2003�. Specifically,we attempted to reconstruct 3D nasal cavities, velum andnasopharyngeal wall shapes from MRI images from one sub-ject uttering a corpus of sustained French articulations, andto develop a corresponding 3D linear articulatory model.This organ-based approach, as opposed to the tract approachthat cannot take into account the complex geometry of thevarious speech articulators, aims in particular to explore thearticulatory degrees of freedom of the articulators, followingthe approach of Badin et al. �2002� to modeling of thetongue and lips, based on the same French subject and thesame corpus.
The following sections present the various articulatorydata acquired on the subject, their analysis in terms of un-correlated linear articulatory degrees of freedom, and the as-sociated linear articulatory models. A preliminary acoustical
evaluation of this articulatory model is also presented. ThisJ. Acoust. Soc. Am., Vol. 123, No. 4, April 2008 A. Serrurier an
study constitutes an extension of the 3D articulatory model-ing of nasals initiated in Serrurier and Badin �2005a� andSerrurier and Badin �2005b�.
II. ARTICULATORY DATA
A. Subject and speech material
Designing a corpus and recording appropriate data obvi-ously constitutes the first important stage of a data-basedapproach to articulatory modeling. As the principle underly-ing linear modeling is that any articulation should be decom-posable into a weighted sum of basic shapes, that constitutesa minimal basis for the space of articulations, the corpusshould constitute a representative sampling for this space.One way to achieve this is to include in the corpus all articu-lations that the subject can produce in his language. Thecorpus thus consisted of: the 10 French oral vowels �a � e i y
u o ø Å œ�, the four French nasal vowels �Ä̃ �̃ œ̃ Å̃�, theartificially sustained consonants �p t k f s b m n r l� producedin three symmetric contexts �a i u�, and, finally, a “rest”position and a “prephonatory” position. These last two areproduced without sound, lips open, nasal tract connected tothe oral tract, jaw open, in a neutral position for the restarticulation and in a position ready to phonate for the pre-phonatory articulation. Altogether, there are 46 target articu-lations. This limited corpus proved to be sufficient for devel-oping midsagittal articulatory models with nearly the sameaccuracy as corpora 40 times larger �Beautemps et al., 2001�.This corpus will be referred to as the main corpus.
As the present study constitutes the first attempt toelaborate a 3D articulatory model from MRI data, only onesubject was considered: we chose the male French speakeralready involved in the development of a midsagittal articu-latory model based on a cineradio-film �Beautemps et al.,2001�, and of 3D models of tongue, lips, and face based onMRI and video data �Badin et al., 2002�. He was about1.65 m tall and 43 years old at the time of recording the maincorpus.
B. Data
As highlighted in the introduction, one of the most effi-cient and accessible methods of collecting 3D sets of vocaltract shapes, and considered to be safe for the subjects, ismagnetic resonance imaging. Following Badin et al. �2002�,the present study is based on 3D sets of MR images collectedfor each articulation of the main corpus, i.e., 46 stacks ofsagittal images, from which 3D shapes of the soft organs areextracted. However, due to the difficulty of distinguishing airfrom bones in MRI, a set of computed tomography �CT�scans of the subject at rest was also recorded to serve as areference and to help interpret the MR images.
Other data were also collected on the same subject forspecific purposes. The geometry of the nasal passages beingvery complex and air passages sometimes very narrow, a setof coronal images considered to be perpendicular to the di-rection of the nasal tract has been recorded in order to opti-
mize air/tissue detection. In order to complement the MRId P. Badin: Three-dimensional articulatory modeling of velum 2337
static shapes with dynamic data, electromagnetic midsagittalarticulatory �EMA� data have also been recorded.
1. Sagittal MRI
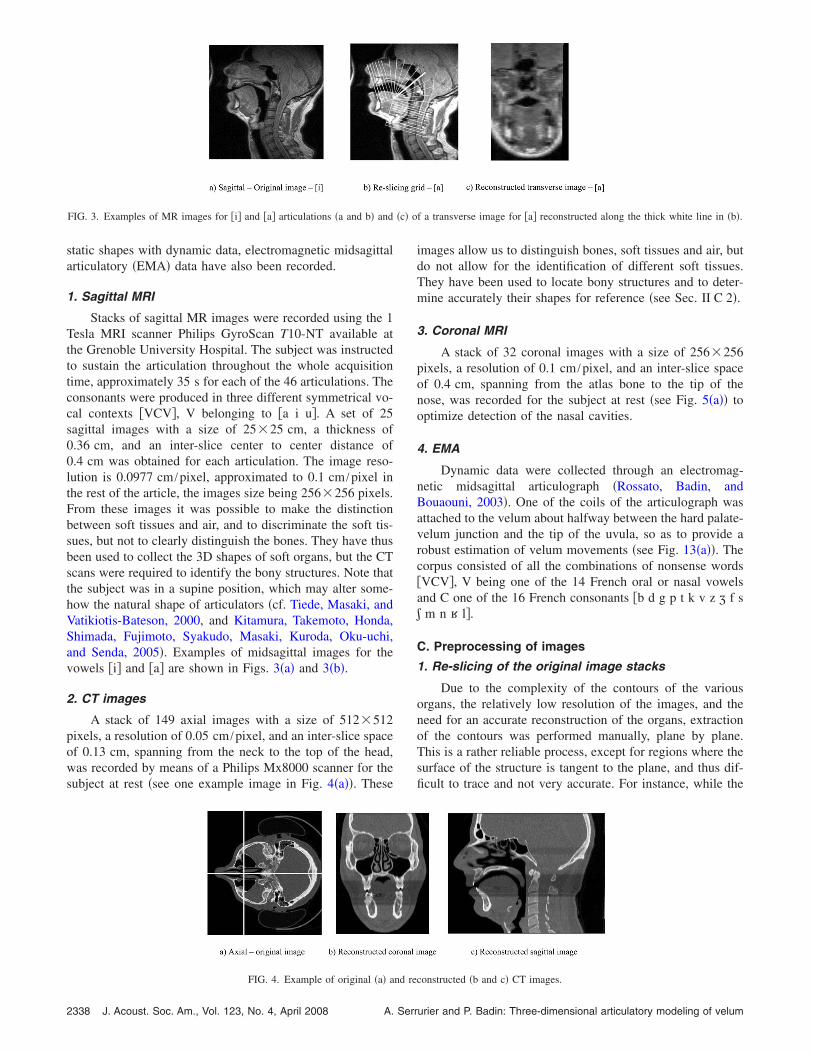
Stacks of sagittal MR images were recorded using the 1Tesla MRI scanner Philips GyroScan T10-NT available atthe Grenoble University Hospital. The subject was instructedto sustain the articulation throughout the whole acquisitiontime, approximately 35 s for each of the 46 articulations. Theconsonants were produced in three different symmetrical vo-cal contexts �VCV�, V belonging to �a i u�. A set of 25sagittal images with a size of 25�25 cm, a thickness of0.36 cm, and an inter-slice center to center distance of0.4 cm was obtained for each articulation. The image reso-lution is 0.0977 cm /pixel, approximated to 0.1 cm /pixel inthe rest of the article, the images size being 256�256 pixels.From these images it was possible to make the distinctionbetween soft tissues and air, and to discriminate the soft tis-sues, but not to clearly distinguish the bones. They have thusbeen used to collect the 3D shapes of soft organs, but the CTscans were required to identify the bony structures. Note thatthe subject was in a supine position, which may alter some-how the natural shape of articulators �cf. Tiede, Masaki, andVatikiotis-Bateson, 2000, and Kitamura, Takemoto, Honda,Shimada, Fujimoto, Syakudo, Masaki, Kuroda, Oku-uchi,and Senda, 2005�. Examples of midsagittal images for thevowels �i� and �a� are shown in Figs. 3�a� and 3�b�.
2. CT images
A stack of 149 axial images with a size of 512�512pixels, a resolution of 0.05 cm /pixel, and an inter-slice spaceof 0.13 cm, spanning from the neck to the top of the head,was recorded by means of a Philips Mx8000 scanner for thesubject at rest �see one example image in Fig. 4�a��. These
FIG. 3. Examples of MR images for �i� and �a� articulations �a and b� and
FIG. 4. Example of original �a� and re
2338 J. Acoust. Soc. Am., Vol. 123, No. 4, April 2008 A. Serr
images allow us to distinguish bones, soft tissues and air, butdo not allow for the identification of different soft tissues.They have been used to locate bony structures and to deter-mine accurately their shapes for reference �see Sec. II C 2�.
3. Coronal MRI
A stack of 32 coronal images with a size of 256�256pixels, a resolution of 0.1 cm /pixel, and an inter-slice spaceof 0.4 cm, spanning from the atlas bone to the tip of thenose, was recorded for the subject at rest �see Fig. 5�a�� tooptimize detection of the nasal cavities.
4. EMA
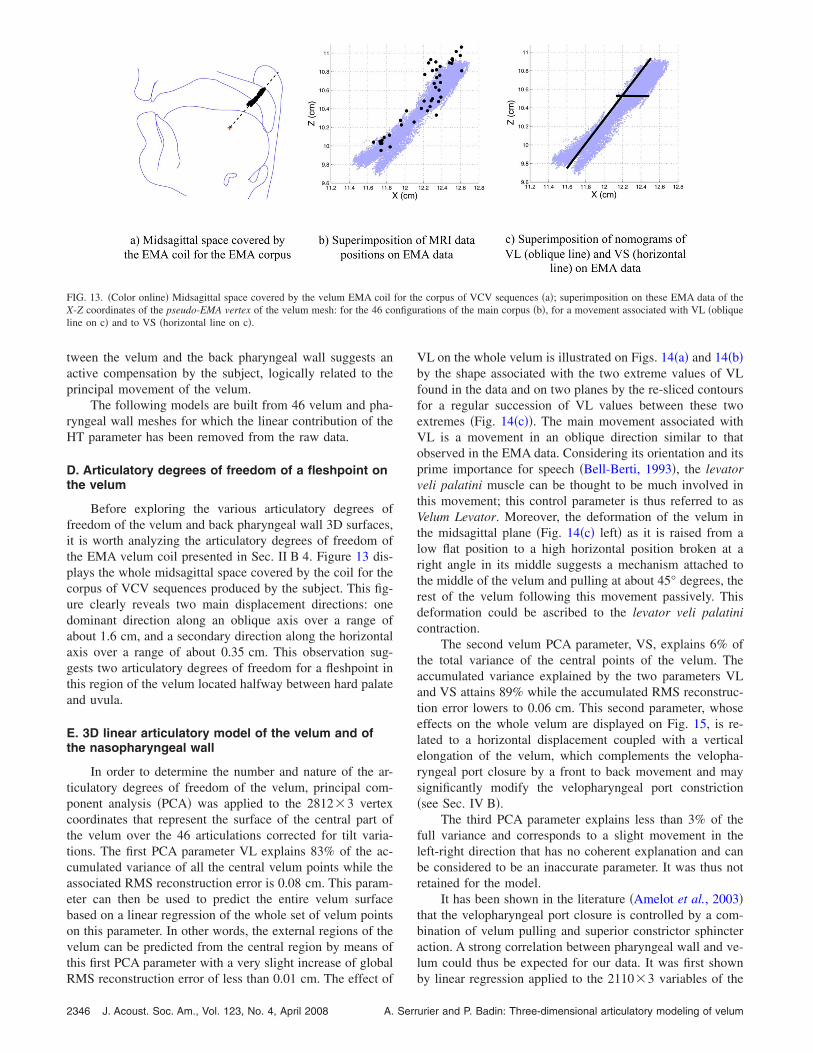
Dynamic data were collected through an electromag-netic midsagittal articulograph �Rossato, Badin, andBouaouni, 2003�. One of the coils of the articulograph wasattached to the velum about halfway between the hard palate-velum junction and the tip of the uvula, so as to provide arobust estimation of velum movements �see Fig. 13�a��. Thecorpus consisted of all the combinations of nonsense words�VCV�, V being one of the 14 French oral or nasal vowelsand C one of the 16 French consonants �b d g p t k v z c f sb m n r l�.
C. Preprocessing of images
1. Re-slicing of the original image stacks
Due to the complexity of the contours of the variousorgans, the relatively low resolution of the images, and theneed for an accurate reconstruction of the organs, extractionof the contours was performed manually, plane by plane.This is a rather reliable process, except for regions where thesurface of the structure is tangent to the plane, and thus dif-ficult to trace and not very accurate. For instance, while the
f a transverse image for �a� reconstructed along the thick white line in �b�.
�c� oconstructed �b and c� CT images.
urier and P. Badin: Three-dimensional articulatory modeling of velum

pharyngeal wall is easy to trace in the midsagittal plane, thesidewalls of the pharynx are nearly tangent to the off-midlinesagittal planes. This is why we have supplemented the origi-nal stacks of images used for the articulatory model with asingle orientation �axial for CT images and sagittal for MRimages� by extra sets of images reconstructed by intersectionof the initial stack with planes having a more useful orienta-tion, i.e., being more perpendicular to the organ surface.
The CT images have thus been resliced/interpolated intwo stacks of 512 coronal images and 512 sagittal images,leading altogether to three stacks of perpendicular CT imageswith a high resolution of 0.05 cm /pixel in the three orienta-tions �see Fig. 4�.
For the sagittal MR images, the initial sagittal stack wasresliced in images perpendicular to the vocal tract, consider-ing that they will be used to extract organ shapes delimitingthe vocal tract �e.g., velum, tongue, etc.�. They were thusre-sliced in 27 planes orthogonal to the midsagittal plane andintersecting it along a semipolar grid, as illustrated in Fig.3�b�. Each new image was given a resolution of0.1 cm /pixel. Finally, we disposed of two redundant or-thogonal stacks of MR images for each articulation.
In the same way, sagittal MR images have been re-slicedin the nostril region along a polar grid, as shown on Fig. 5, inorder to follow the nearly 90° bend of the nasal passagesnear the nostrils, and thus to maintain the images perpen-dicular to the nasal tract and therefore optimally adapted toborder tract detection. Eight new images of arbitrary size256�256 pixels, which have the same 0.1 cm /pixel reso-lution as the original images, have thus been created.
The original coronal images, being already perpendicu-lar to the tract between the cavum and the beginning of thenostrils, were used as is.
2. Extraction of bony structures and alignment of theimage stacks on a common reference
Regarding the data processing, a contour drawn on aspecific image �such as the solid line on Fig. 9�a� whichrepresents the velum� can be expressed in three differenttypes of units: �1� two-dimensional �2D� coordinates in theimage plane of the contour in a continuous pixel unit �i.e.,subpixel resolution�, referred to as 2D pixels; �2� 2D coordi-nates in the image plane in cm, which can be transformedinto continuous pixel units �and vice versa� by using the
FIG. 5. Original coronal MRI located between the atlas bone and the beginreconstructed images �b�.
image pixel resolution parameter, referred to as 2D cm; and
J. Acoust. Soc. Am., Vol. 123, No. 4, April 2008 A. Serrurier an
�3� 3D coordinates in cm, which can be transformed into 2Dcm and vice versa using the knowledge of the image plane3D location, referred to as 3D cm. The following processrefers to these various coordinates depending on the require-ments.
As the subject’s head may have moved between the re-cordings of the various articulations, it was necessary toalign the image stacks of each articulation on a commonreference framework, before attempting to determine theshape of the soft structures.
Fixed bony structures such as the cranium, hard palate,and various paranasal sinuses �maxillary, sphenoidal andfrontal sinuses� that can be seen—at least partially—on eachimage, were used as landmarks. The set of 3D triangularmeshes of the surface outlines of these structures was madefrom the stack of CT images where bones appear clearly, andwere then used as a common reference.
This process was implemented in the following way.Manual segmentation of each organ outline was done planeby plane, in one of the three CT stacks, or a combination ofthem, depending on the shape and orientation of the organ, insuch a way as to maximize the accuracy of complex organs�e.g., the maxillary sinuses were manually segmented in thecoronal stack while the sphenoid sinus was segmented in thesagittal one�. The planar contours are edited as 2D splinescontrolled by a limited number of points; for example, Figs.9�a� and 9�b� illustrate �with a solid line� the contour of thevelum manually segmented from MR images of articulation�la�. The whole set of 2D planar contours, whose coordinatesare originally in 2D pixels, were then expressed in 2D cmand expanded into 3D cm to form a set of 3D planar contoursrepresenting the specific organ �see Fig. 9�c� for the set of 3Dplanar contours of the velum for the configuration �la��.These 3D points have been then processed through a 3Dmeshing software �Fabri, 2007� to form a 3D surface meshbased on triangles �see further Fig. 10 for the velum andpharyngeal wall�.
The alignment of each stack of images on the commonframework defined by the fixed bony structures is performedin three steps. First, the rigid fixed bony structures �hardpalate, nasal passages, paranasal sinuses, etc.� are chosen asan arbitrary common reference. An absolute 3D referencecoordinate system, attached to the skull of the subject, isarbitrarily defined as follows: �1� the x axis is oriented from
of the nose �a�, and semipolar grid showing the location of the original and
ninganterior to posterior in the midsagittal plane and approxi-
d P. Badin: Three-dimensional articulatory modeling of velum 2339

mately in the occlusal plane, the y axis from left to right, andthe z axis from feet to head; �2� the lower edge of the upperincisors in the midsagittal plane is considered as the origin ofthe coordinate system. Second, the stacks of CT images aremanually aligned with this reference as a rigid body; thus,the associated transformation gives the position of the threestacks of CT images in the common reference coordinatesystem. This transformation corresponds to the six degrees offreedom of a rigid body and is thus defined by six param-eters: three parameters for the 3D rotation and three param-eters for the 3D translation; it will be referred to as a �3D�rototranslation. Finally, as the subject may have slightlychanged position between two MRI stacks recordings, eachstack was aligned with the common reference by using theappropriate 3D rototranslation. This rototranslation was de-termined by aligning specific rigid structures �hard palateand paranasal sinuses�, extracted from CT images, with eachstack of the MR images. This alignment is a semiautomaticprocess: �1� anchor points of the rigid structures are manu-ally marked with care on some of the MR images of thestack, �2� the associated 3D rototranslation is determined bya simple minimization of the added distance between these3D points �originally 2D planar points expressed in 2D pix-els, then expressed in 2D cm and finally expanded in 3D cm�and the corresponding nearest points on the 3D rigid struc-tures. A similar approach was proposed by Takemoto, Kita-mura, Nishimoto, and Honda �2004�, the main difference be-ing that their minimization error was the value of the volumeoverlap between the reference to align and the target data.
The same alignment procedure was also applied to thejaw for each articulation, in order to determine its relativeposition in relation to the fixed rigid structures: by combin-ing these relative 3D rototranslations and the absolute onecorresponding to the given stack, the positions of these twostructures are known in the common reference to each articu-lation.
Note that this procedure provides the geometric transfor-mation between the 3D reference coordinate system, inwhich contours and meshes are expressed in 3D cm, and thestacks of images, in which contours are expressed in 2Dpixels. This transformation can obviously be considered inboth direct and reverse directions, the two sets of coordinatesbeing thus equivalent. Note, however, that in order to maxi-mize the accuracy of the contours detection, we decided todraw contours �in 2D pixels� on original images wheneverthey existed, and to use this geometric transformation to pro-duce planar contours in 3D cm in the reference coordinatesystem, rather than applying the transformation to an imageand drawing contours in 3D cm on this transformed imagethat is necessarily more noisy.
D. Nasal passages: 3D geometry and area function
1. Contours extraction
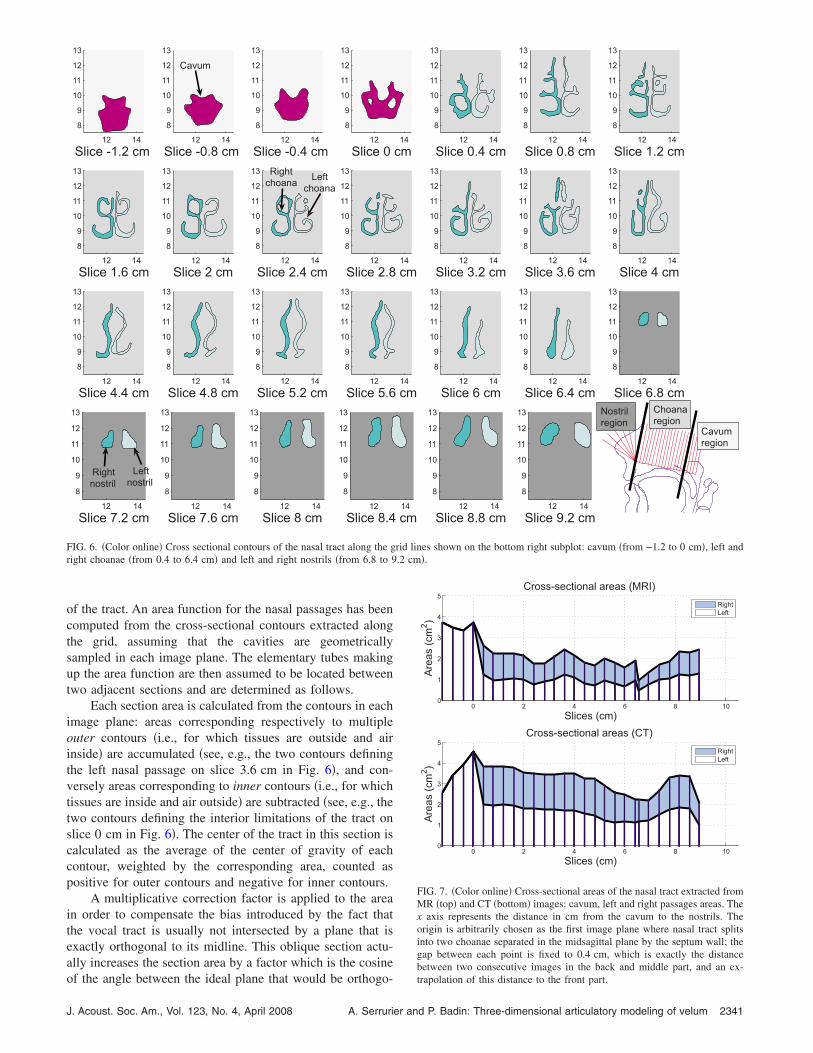
The nasal passage contours were manually segmentedon the 24 coronal MR images and the eight resliced imagesdefined by the grid visible in Fig. 5�b�. The corresponding setof contours for the nasal tract is illustrated in Fig. 6. Three
different regions can be considered in the nasal tract: �1� the2340 J. Acoust. Soc. Am., Vol. 123, No. 4, April 2008 A. Serr
cavum, which is the cavity located above the velum andbehind the septum wall of the nasal passages �its cross-sectional contours are visible on the slices numbered from−1.2 to 0 cm in Fig. 6�, �2� the choanae, which form themiddle region of the nasal tract from the cavum to the nos-trils �their cross-sectional contours are visible on the slicesnumbered from 0.4 to 6.4 cm in Fig. 6�, and �3� the nostrils,which are the outlet of the nasal tract �their cross-sectionalcontours are visible on the slices numbered from 6.8 to9.2 cm in Fig. 6�.
The complex shape of the nasal passages, particularly inthe middle region, combined with the relatively low reso-lution of the images �0.1 cm/pixel� makes it difficult to tracethe nasal passage contours. In order to improve the accuracyof detection, the contours of the nasal passages were ex-tracted from the CT images in the same way along the samegrid, and were superimposed on the MR images. This pro-vided a useful help for the determination of nasal passages,as soft tissues/air boundaries are better defined in CT images.We noticed, however, that the areas extracted from the CTimages were about twice as large as those extracted from theMR images �cf. Fig. 7�. This may be ascribed to the fact thatnasal mucosa have low tissue densities and thus may not bevisible on CT images. Figure 7 illustrates the resulting cross-sectional areas extracted from CT and MR images.
These results are in overall agreement with the observa-tions made by Dang et al. �1994� and complement their studyof four subjects. Note that the volume of the cavum is highlydependent on the position of the velum, which is very low inour case �see Fig. 5�b��; a low velum position results in largecross-sectional areas, as can be seen in Fig. 7 for slices lo-cated on the back of the septum, i.e., having negative ab-scissa. Note also the asymmetry between the left and rightpassages and the irregularities between two consecutive sec-tions. These characteristics are related to the rather intricateshape of the nasal passages which are made up of many thinand interlaced partitions �see Fig. 6 that illustrates the nasalpassage contours�. Each nasal passage constricts mildly at apoint located between the choanae and the nostrils. This con-striction of about 1 cm2 is located around 7 cm from theseparation point of the nasal tract into choanae and 2.4 cmfrom the nostrils’ outlet �at x=6.6 cm�. The size of this con-striction has often been discussed in the literature: it variesfrom 0.23 cm2 for House and Stevens �1956� to about 2 cm2
for Bjuggren and Fant �1964�; Feng and Castelli �1996� es-timated it to range between 0.5 and 1 cm2 and fixed it at0.6 cm2 for their acoustic simulations; based on measure-ments from MR images, Dang et al. �1994� showed constric-tions of about 1 cm2, and Matsumura et al. �1994� between0.5 and 1 cm2. Ultimately, the significant difference betweenareas extracted from CT and MR images emphasizes the im-portance of mucosa in the nasal passages.
2. Area function determination
Oral and nasal tracts can be approximated in speech by asuccession along a horizontal line of cylindrical tubes whoselengths and cross-sectional areas represent more or lessfinely the real tract; the area function provides this cross-
sectional area as a function of the abscissa along the midlineurier and P. Badin: Three-dimensional articulatory modeling of velum
.2 cm�.
of the tract. An area function for the nasal passages has beencomputed from the cross-sectional contours extracted alongthe grid, assuming that the cavities are geometricallysampled in each image plane. The elementary tubes makingup the area function are then assumed to be located betweentwo adjacent sections and are determined as follows.
Each section area is calculated from the contours in eachimage plane: areas corresponding respectively to multipleouter contours �i.e., for which tissues are outside and airinside� are accumulated �see, e.g., the two contours definingthe left nasal passage on slice 3.6 cm in Fig. 6�, and con-versely areas corresponding to inner contours �i.e., for whichtissues are inside and air outside� are subtracted �see, e.g., thetwo contours defining the interior limitations of the tract onslice 0 cm in Fig. 6�. The center of the tract in this section iscalculated as the average of the center of gravity of eachcontour, weighted by the corresponding area, counted aspositive for outer contours and negative for inner contours.
A multiplicative correction factor is applied to the areain order to compensate the bias introduced by the fact thatthe vocal tract is usually not intersected by a plane that isexactly orthogonal to its midline. This oblique section actu-ally increases the section area by a factor which is the cosine
12 14
8
9
10
11
12
13
Slice -1.2 cm12 14
8
9
10
11
12
13
Slice -0.8 cm12 14
8
9
10
11
12
13
Slice -0.4 cm12
8
9
10
11
12
13
Slice 0
12 14
8
9
10
11
12
13
Slice 1.6 cm12 14
8
9
10
11
12
13
Slice 2 cm12 14
8
9
10
11
12
13
Slice 2.4 cm12
8
9
10
11
12
13
Slice 2.8
12 14
8
9
10
11
12
13
Slice 4.4 cm12 14
8
9
10
11
12
13
Slice 4.8 cm12 14
8
9
10
11
12
13
Slice 5.2 cm12
8
9
10
11
12
13
Slice 5.6
12 14
8
9
10
11
12
13
Slice 7.2 cm12 14
8
9
10
11
12
13
Slice 7.6 cm12 14
8
9
10
11
12
13
Slice 8 cm12
8
9
10
11
12
13
Slice 8.4
Cavum
Right
choanaLeft
choana
Right
nostril
Left
nostril
FIG. 6. �Color online� Cross sectional contours of the nasal tract along the gright choanae �from 0.4 to 6.4 cm� and left and right nostrils �from 6.8 to 9
14
cm12 14
8
9
10
11
12
13
Slice 0.4 cm12 14
8
9
10
11
12
13
Slice 0.8 cm12 14
8
9
10
11
12
13
Slice 1.2 cm
14
cm12 14
8
9
10
11
12
13
Slice 3.2 cm12 14
8
9
10
11
12
13
Slice 3.6 cm12 14
8
9
10
11
12
13
Slice 4 cm
14
cm12 14
8
9
10
11
12
13
Slice 6 cm12 14
8
9
10
11
12
13
Slice 6.4 cm12 14
8
9
10
11
12
13
Slice 6.8 cm
14
cm12 14
8
9
10
11
12
13
Slice 8.8 cm12 14
8
9
10
11
12
13
Slice 9.2 cm
Nostril
region
Choana
regionCavum
region
rid lines shown on the bottom right subplot: cavum �from −1.2 to 0 cm�, left and
of the angle between the ideal plane that would be orthogo-
J. Acoust. Soc. Am., Vol. 123, No. 4, April 2008 A. Serrurier an
0 2 4 6 8 100
1
2
3
4
5
Slices (cm)
Are
as
(cm
2)
Cross-sectional areas (MRI)
Right
Left
0 2 4 6 8 100
1
2
3
4
5
Slices (cm)
Are
as
(cm
2)
Cross-sectional areas (CT)
Right
Left
FIG. 7. �Color online� Cross-sectional areas of the nasal tract extracted fromMR �top� and CT �bottom� images: cavum, left and right passages areas. Thex axis represents the distance in cm from the cavum to the nostrils. Theorigin is arbitrarily chosen as the first image plane where nasal tract splitsinto two choanae separated in the midsagittal plane by the septum wall; thegap between each point is fixed to 0.4 cm, which is exactly the distancebetween two consecutive images in the back and middle part, and an ex-
trapolation of this distance to the front part.d P. Badin: Three-dimensional articulatory modeling of velum 2341

nal to the midline and the actual cutting plane. The correc-tion factor is thus computed as the cosine of the angle be-tween �1� the 3D vector normal to the actual cutting plane ofthe tract and �2� the 3D vector normal to the ideal cuttingplane of the tract. The tract midline is approximated locallyby a circle passing through the center of gravity of the cross-sectional contour actually computed and those of its twoneighboring sections, and thus the 3D vector normal to theideal cutting plane is the tangent to this circle in the sectionconsidered.
The area of the tube is finally computed as the mean ofthe corrected areas of the two adjacent sections.
The length of the tube is computed as the distance be-tween the 3D coordinates of the centers of the tract in each ofthe two sections.
3. Nasal passage area functions
The area functions of the nasal passages derived fromthe MR contours are illustrated in Fig. 8. Each elementarytube is represented by a line whose length is plotted on the xaxis and whose area is plotted on the y axis. We observe alength of about 9.2 cm for the nasal passages, from the be-ginning of the septum �at x=0 cm� to the final outlet fromthe nostrils, and a constriction of about 0.6 cm long and1 cm2 large at 1.7 cm from the outlet of the nostrils �at x=6.9−7.5 cm�.
In comparison, the length of the nasal passages proposedby House and Stevens �1956� is around 8.5 cm long and thearea decreases from 5.9 to 0.23 cm2 at the nostrils, which isconsidered as the constriction. If the cross-sectional contoursproposed by Bjuggren and Fant �1964� seem similar to ourdata extracted from the MR images and the length of7–8 cm for nasal passages appears slightly smaller, their ar-eas seem largely overestimated, from more than 7 cm2 in themiddle part to around 2 cm2 for the nostrils, which consti-tutes the constriction. Dang et al. �1994� highlighted the im-portance of the mucosa in the nasal passages by comparingthe nasal contours of the same subject in a normal conditionand in a condition where the nasal mucosa had been spreadwith a vaso-constrictor substance, and concluded that Bjug-gren and Fant overestimated the areas due to a retraction ofmucosa on the cadaver. This assumption is confirmed in thisstudy, where cross-sectional areas extracted from CT images
-2 0 2 4 6 8 100
0.5
1
1.5
2
2.5
3
3.5
Length (cm)
Are
as
(cm
2)
Area Function (MRI)
Right
Left
FIG. 8. �Color online� Area function of the nasal tract: each tube is repre-sented by a length on the x axis and an area on the y axis.
appear overestimated, likely due to the low density mucosa
2342 J. Acoust. Soc. Am., Vol. 123, No. 4, April 2008 A. Serr
not visible on these images. The areas reported by Mat-sumura et al. �1994� appear significantly lower than those ofBjuggren and Fant �1964� �less than 3 cm2 for the middleand front part� and the constriction appears between 0.8 and2.8 cm from the tip of the nose, depending on the subject.Finally, as discussed above, our results correspond globallywith those reported by Dang et al. �1994�.
E. Determination of the soft structures
The shapes of the soft structures, i.e., the velum and thenasopharyngeal wall, were determined for each articulationin much the same way as the rigid structures, using bothoriginal sagittal MR image stacks and associated sets of re-constructed images. In addition, the 3D rigid structuresmeshes, properly aligned with the MR image stacks as de-scribed above, were then intersected by the planes corre-sponding to the MR images, leading to 3D planar contours incentimeters, easily expressed in 2D pixel planar contours,and superimposed on the MR images in order to providesome useful anchor points for the interpretation of the im-ages and for the tracing of the soft structure contours �seedashed lines in Figs. 9�a� and 9�b��. Figure 9 illustrates thesegmentation of the velum in both MRI stacks for the con-sonant �la�. In addition to the bony structures, previouslymanually segmented soft structures other than the velum arealso superimposed on the images to help the detection of thevelum, and to maintain coherence in tracing the various or-gans �see the tongue contours previously segmented in dash-dotted lines in Figs. 9�a� and 9�b��. The definition of theoutline of a soft organ is of prime importance for the 3Dshape extraction process. Air/tissue boundaries are obviousborders and are generally easy to detect on MRI �see, e.g.,Fig. 9�a� where the velum contour appears clearly�. As ourprimary goal is modeling the vocal tract boundaries, the bor-ders of organs that are never in contact with air are not veryimportant but may, however, play an important role in theelastic deformation of the organ under consideration �as dis-cussed later in this section�. Contour tracing in these regionshas thus been performed according to the principle of coher-ence: the border choice aims to ensure coherence across con-figurations, as well as anatomic likelihood. This difficultyarises particularly for the superior part of the velum in lateralregions on both sides of the velopharyngeal tract �see Fig.9�b��. Indeed, the velum shape was designed as a closedsurface �except at the connection with the hard palate� andconsequently the planar contours must be closed as well. Theback and lateral pharyngeal wall outlines of the velopharyn-geal port are on the contrary designed as a single open sur-face from the uvula level to the beginning of the cavum.Contours have therefore been traced in such a way as to stickon the velum contours in lateral regions in order to ensureclosure of the tract. The set of all 2D planar contours tracedin this way, initially expressed in 2D pixels, then in 2D cm,expanded into 3D cm and finally aligned with the commonreference by using the 3D rototranslation of the correspond-ing images stack �see Sec. II C 2�, forms a 3D description of
the given soft organ �see, e.g., Fig. 9�c��.urier and P. Badin: Three-dimensional articulatory modeling of velum

As linear analysis methods such as principal componentanalysis or multiple linear regressions require each observa-tion to bear on the same number of variables, it was neces-sary to ensure a common geometric representation of eachsoft organ for all the articulations in the corpus. A uniquegeneric 3D surface mesh, made of triangles, was thus definedfor each organ. These generic meshes were then fitted byelastic deformation to each of the 3D shapes of the corpus,providing a 3D representation of each organ surface with thesame 3D vertices. The generic meshes were derived from the
set of 3D planar contours of the �Ä̃� articulation by means ofa 3D meshing software �Fabri, 2007�. This articulation pre-sents the advantage of a minimal contact between the velumand the surrounding structures, and thus is the most efficientway to extract the full 3D surfaces. Furthermore, the genericmeshes �shown in Fig. 10� were slightly smoothed with thehelp of the SmoothMesh software �Huber, 2007� in order toreduce the noise introduced by the meshing procedure andthe discrepancies due to the general problem of sampling 3Dsurfaces by a relatively small number of planar contours. Thefit to each 3D shape extracted was computed by means of thematching software TestRigid developed at the TIMC labora-
FIG. 9. �Color online� Example of manual segmentation �a and b�, and of 3Dcorrespond to bony structures superimposed on the images while dash-dottecorresponds to the manually edited velar contour.
FIG. 10. �Color online� Three-dimensional generic meshes of the velum �a and b
J. Acoust. Soc. Am., Vol. 123, No. 4, April 2008 A. Serrurier an
tory in Grenoble �Couteau, Payan and Lavallée, 2000�, andbased on the elastic deformation of the generic meshes to thetarget configuration �see example of such a target in Fig.9�c��. In order to ensure convergence of the matching algo-rithm, the deformation from generic source meshes to targetconfigurations was supervised. About ten intermediate tar-gets were obtained by linear interpolation from the planarcontours which were achieved by intersections of the sourcemesh with planes of the target contours to the target contoursthemselves. The matching procedure was then applied instages by introducing these targets one after the other. Thismethod avoids unrealistic deformations that may occur whenfitting the source mesh to too disjoint a target. The deforma-tions of the soft organs obtained in such a way are believedto be close to the real deformations, i.e., the vertices of themesh can be considered as flesh points and their relativepositions coherent across configurations. This reconstructionprocess finally provides a set of soft organ surfaces describedin terms of triangular meshes having the same number ofvertices for all the articulations of the corpus and expressedin a common reference coordinate system. For all these ar-ticulations, each of the 46 closed velum surfaces is com-
esentation �c� of the velum for a �la� articulation. In a and b, the dashed lineses correspond to soft structures other than the velum edited. The solid line
˜
reprd lin
� and of the back pharyngeal wall �c� reconstructed for the �� articulation.
d P. Badin: Three-dimensional articulatory modeling of velum 2343

posed of 5239 vertices and each of the 46 pharyngeal wallsurfaces from the uvula level to the beginning of the cavumis composed of 2110 vertices. This matching process hasresulted in a root mean square �RMS� reconstruction errorbetween the fitted mesh and the target points over the 46configurations of 0.06 cm for the velum and of 0.04 cm forthe pharyngeal wall.
These sets of 3D data form the basis of the articulatorymodeling of the subject speech organs, as will be describedin the next sections.
III. 3D LINEAR ARTICULATORY MODELS OFVELOPHARYNGEAL PORT
A. Principles of articulatory modeling
As emphasized by Kelso, Saltzman, and Tuller �1986�,the speech organs are made of a large number of neuromus-cular components that offer a potentially large dimensional-ity and which must be functionally coupled in order to pro-duce relatively simple gestures. Thus, following theapproach used by Beautemps et al. �2001� and Badin et al.�2002�, we consider that these simple gestures for a givenorgan can be represented in terms of independent degrees offreedom defined as the specific displacements and deforma-tions of the organ which are linearly uncorrelated with theother degrees of freedom of this organ over the consideredset of tasks. These degrees of freedom can be determined byobserving the correlations between the various parametersthat constitute the accurate geometrical description of thearticulators’ shapes and positions, and retaining only inde-pendent parameters. These correlations stem from a series ofimplicit or explicit constraints: physical continuity of the ar-ticulators, biomechanical constraints, and the nature of thetask in relation to the control.
The movements of a speech organ can be modeled attwo levels: a physical level, which deals with the displace-ments and deformations of the organ as biomechanical re-sponses to muscle actions, and a functional level, whichdeals with the geometrical representation of the displace-ments and deformations of the organ. Linear articulatorymodeling aims to determine the functional degrees of free-dom of the organs and their associated control parameters.The correlations between the various movements observedon the articulator over the set of considered tasks are ex-ploited to reduce the number of degrees of freedom and todetermine the associated components. However, this ap-proach is carefully used with the biomechanical likelihoodconstraint: the components must correspond to plausiblemovements in terms of biomechanics and must not resultfrom a pure control strategy of the subject.
The linearity of the model means that the shape of anarticulator for a given articulation is expressed as a linearcombination of the components of the model, weighted bythe set of control parameters corresponding to the articula-tion. In other words, assuming that the shape of an articulatoris defined by the set of the coordinates of all its points means
that varying a single input value corresponding to a specific2344 J. Acoust. Soc. Am., Vol. 123, No. 4, April 2008 A. Serr
component, while keeping all others constant, leads to a dis-placement of each point of the articulator along a straightline.
Before describing the articulatory model based on thisapproach of the velopharyngeal port, i.e., of the velum andnasopharyngeal walls, we define the selection of the dataused for the analysis and assess the contribution of head tiltto the movement of these articulators.
B. Selection of data for analysis
As explained above, the planar contours of the organshave also been traced in regions that do not bring informa-tion about the 3D shape of the vocal tract. The main objec-tive of this study is to model the boundaries of soft organsthat contribute to the 3D vocal tract shape: the organs’ con-tours in these regions were thus considered irrelevant for themodel and not included in the analysis.
According to combined criteria of anatomic likelihoodand coherence across articulations, some regions of the ve-lum considered as irrelevant for the model have, however,been traced, as illustrated in Fig. 11 by dashed lines. In orderto simplify the choice of relevant regions, we applied a con-servative approach and restricted the analysis to a region nofurther than 1.5 cm on both sides from the midsagittal plane�cf. Fig. 11�. As will be explained in Sec. III E, the modelwas based on the analysis of this central part of the velumcomposed of 2812 vertices. In addition, the external regionswill be shown to be very well correlated with the centralregion, which is in the end not surprising, considering thefact that the muscular fibers of the velum stretch continu-ously from the center to the more external regions.
C. Head tilt influence
Considering that the subject’s head may have moved
Velum
Back Pharyngeal Wall
Tongue
FIG. 11. �Color online� Cross-sectional contours of the velum, the pharyn-geal wall and the tongue in the transverse plane shown on the MRI in theupper left corner for an �i� articulation. Oral and nasal cross-sectional areasare marked by a slightly dark color. The vertical dashed lines show thelateral limits of the analysis region of the velum at 1.5 cm on both sides ofthe midsagittal plane; the dashed contours of the velum beyond these verti-cal lines are considered to be irrelevant for the study.
during the recording session, the stacks of images have been
urier and P. Badin: Three-dimensional articulatory modeling of velum
trem
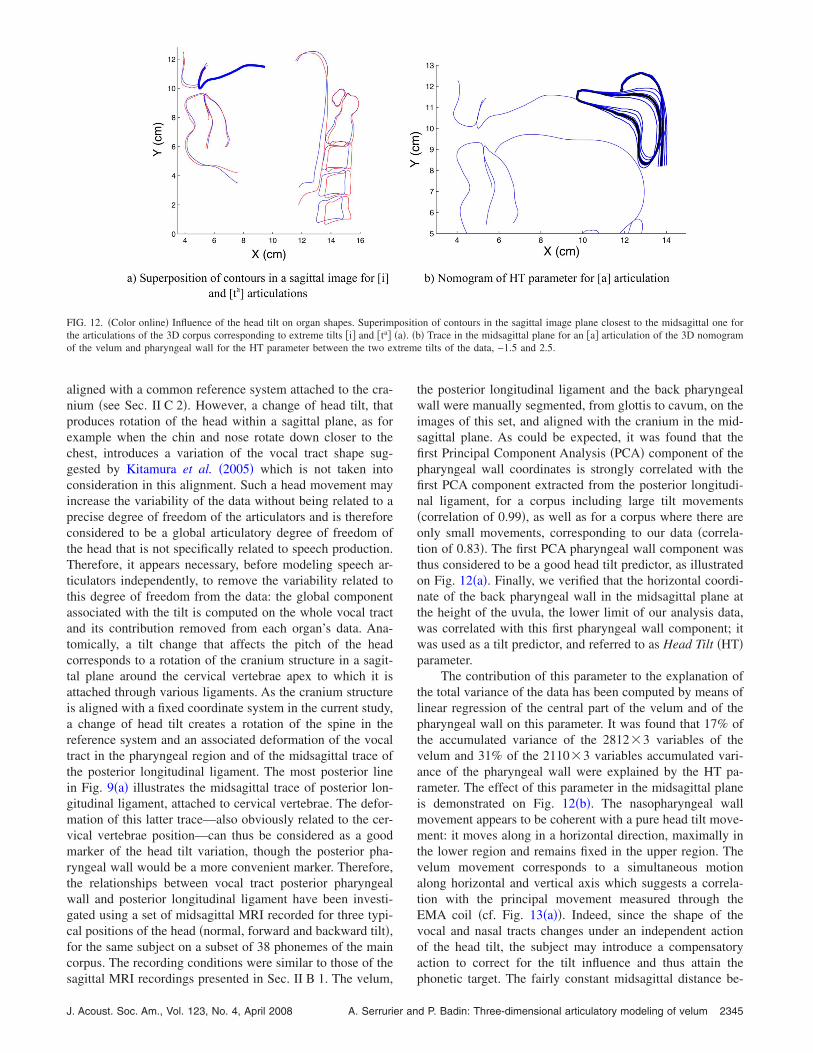
aligned with a common reference system attached to the cra-nium �see Sec. II C 2�. However, a change of head tilt, thatproduces rotation of the head within a sagittal plane, as forexample when the chin and nose rotate down closer to thechest, introduces a variation of the vocal tract shape sug-gested by Kitamura et al. �2005� which is not taken intoconsideration in this alignment. Such a head movement mayincrease the variability of the data without being related to aprecise degree of freedom of the articulators and is thereforeconsidered to be a global articulatory degree of freedom ofthe head that is not specifically related to speech production.Therefore, it appears necessary, before modeling speech ar-ticulators independently, to remove the variability related tothis degree of freedom from the data: the global componentassociated with the tilt is computed on the whole vocal tractand its contribution removed from each organ’s data. Ana-tomically, a tilt change that affects the pitch of the headcorresponds to a rotation of the cranium structure in a sagit-tal plane around the cervical vertebrae apex to which it isattached through various ligaments. As the cranium structureis aligned with a fixed coordinate system in the current study,a change of head tilt creates a rotation of the spine in thereference system and an associated deformation of the vocaltract in the pharyngeal region and of the midsagittal trace ofthe posterior longitudinal ligament. The most posterior linein Fig. 9�a� illustrates the midsagittal trace of posterior lon-gitudinal ligament, attached to cervical vertebrae. The defor-mation of this latter trace—also obviously related to the cer-vical vertebrae position—can thus be considered as a goodmarker of the head tilt variation, though the posterior pha-ryngeal wall would be a more convenient marker. Therefore,the relationships between vocal tract posterior pharyngealwall and posterior longitudinal ligament have been investi-gated using a set of midsagittal MRI recorded for three typi-cal positions of the head �normal, forward and backward tilt�,for the same subject on a subset of 38 phonemes of the maincorpus. The recording conditions were similar to those of the
FIG. 12. �Color online� Influence of the head tilt on organ shapes. Superimthe articulations of the 3D corpus corresponding to extreme tilts �i� and �ta�of the velum and pharyngeal wall for the HT parameter between the two ex
sagittal MRI recordings presented in Sec. II B 1. The velum,
J. Acoust. Soc. Am., Vol. 123, No. 4, April 2008 A. Serrurier an
the posterior longitudinal ligament and the back pharyngealwall were manually segmented, from glottis to cavum, on theimages of this set, and aligned with the cranium in the mid-sagittal plane. As could be expected, it was found that thefirst Principal Component Analysis �PCA� component of thepharyngeal wall coordinates is strongly correlated with thefirst PCA component extracted from the posterior longitudi-nal ligament, for a corpus including large tilt movements�correlation of 0.99�, as well as for a corpus where there areonly small movements, corresponding to our data �correla-tion of 0.83�. The first PCA pharyngeal wall component wasthus considered to be a good head tilt predictor, as illustratedon Fig. 12�a�. Finally, we verified that the horizontal coordi-nate of the back pharyngeal wall in the midsagittal plane atthe height of the uvula, the lower limit of our analysis data,was correlated with this first pharyngeal wall component; itwas used as a tilt predictor, and referred to as Head Tilt �HT�parameter.
The contribution of this parameter to the explanation ofthe total variance of the data has been computed by means oflinear regression of the central part of the velum and of thepharyngeal wall on this parameter. It was found that 17% ofthe accumulated variance of the 2812�3 variables of thevelum and 31% of the 2110�3 variables accumulated vari-ance of the pharyngeal wall were explained by the HT pa-rameter. The effect of this parameter in the midsagittal planeis demonstrated on Fig. 12�b�. The nasopharyngeal wallmovement appears to be coherent with a pure head tilt move-ment: it moves along in a horizontal direction, maximally inthe lower region and remains fixed in the upper region. Thevelum movement corresponds to a simultaneous motionalong horizontal and vertical axis which suggests a correla-tion with the principal movement measured through theEMA coil �cf. Fig. 13�a��. Indeed, since the shape of thevocal and nasal tracts changes under an independent actionof the head tilt, the subject may introduce a compensatoryaction to correct for the tilt influence and thus attain the
on of contours in the sagittal image plane closest to the midsagittal one for� Trace in the midsagittal plane for an �a� articulation of the 3D nomogram
e tilts of the data, −1.5 and 2.5.
positi�a�. �b
phonetic target. The fairly constant midsagittal distance be-
d P. Badin: Three-dimensional articulatory modeling of velum 2345
tween the velum and the back pharyngeal wall suggests anactive compensation by the subject, logically related to theprincipal movement of the velum.
The following models are built from 46 velum and pha-ryngeal wall meshes for which the linear contribution of theHT parameter has been removed from the raw data.
D. Articulatory degrees of freedom of a fleshpoint onthe velum
Before exploring the various articulatory degrees offreedom of the velum and back pharyngeal wall 3D surfaces,it is worth analyzing the articulatory degrees of freedom ofthe EMA velum coil presented in Sec. II B 4. Figure 13 dis-plays the whole midsagittal space covered by the coil for thecorpus of VCV sequences produced by the subject. This fig-ure clearly reveals two main displacement directions: onedominant direction along an oblique axis over a range ofabout 1.6 cm, and a secondary direction along the horizontalaxis over a range of about 0.35 cm. This observation sug-gests two articulatory degrees of freedom for a fleshpoint inthis region of the velum located halfway between hard palateand uvula.
E. 3D linear articulatory model of the velum and ofthe nasopharyngeal wall
In order to determine the number and nature of the ar-ticulatory degrees of freedom of the velum, principal com-ponent analysis �PCA� was applied to the 2812�3 vertexcoordinates that represent the surface of the central part ofthe velum over the 46 articulations corrected for tilt varia-tions. The first PCA parameter VL explains 83% of the ac-cumulated variance of all the central velum points while theassociated RMS reconstruction error is 0.08 cm. This param-eter can then be used to predict the entire velum surfacebased on a linear regression of the whole set of velum pointson this parameter. In other words, the external regions of thevelum can be predicted from the central region by means ofthis first PCA parameter with a very slight increase of global
FIG. 13. �Color online� Midsagittal space covered by the velum EMA coilX-Z coordinates of the pseudo-EMA vertex of the velum mesh: for the 46 coline on c� and to VS �horizontal line on c�.
RMS reconstruction error of less than 0.01 cm. The effect of
2346 J. Acoust. Soc. Am., Vol. 123, No. 4, April 2008 A. Serr
VL on the whole velum is illustrated on Figs. 14�a� and 14�b�by the shape associated with the two extreme values of VLfound in the data and on two planes by the re-sliced contoursfor a regular succession of VL values between these twoextremes �Fig. 14�c��. The main movement associated withVL is a movement in an oblique direction similar to thatobserved in the EMA data. Considering its orientation and itsprime importance for speech �Bell-Berti, 1993�, the levatorveli palatini muscle can be thought to be much involved inthis movement; this control parameter is thus referred to asVelum Levator. Moreover, the deformation of the velum inthe midsagittal plane �Fig. 14�c� left� as it is raised from alow flat position to a high horizontal position broken at aright angle in its middle suggests a mechanism attached tothe middle of the velum and pulling at about 45° degrees, therest of the velum following this movement passively. Thisdeformation could be ascribed to the levator veli palatinicontraction.
The second velum PCA parameter, VS, explains 6% ofthe total variance of the central points of the velum. Theaccumulated variance explained by the two parameters VLand VS attains 89% while the accumulated RMS reconstruc-tion error lowers to 0.06 cm. This second parameter, whoseeffects on the whole velum are displayed on Fig. 15, is re-lated to a horizontal displacement coupled with a verticalelongation of the velum, which complements the velopha-ryngeal port closure by a front to back movement and maysignificantly modify the velopharyngeal port constriction�see Sec. IV B�.
The third PCA parameter explains less than 3% of thefull variance and corresponds to a slight movement in theleft-right direction that has no coherent explanation and canbe considered to be an inaccurate parameter. It was thus notretained for the model.
It has been shown in the literature �Amelot et al., 2003�that the velopharyngeal port closure is controlled by a com-bination of velum pulling and superior constrictor sphincteraction. A strong correlation between pharyngeal wall and ve-lum could thus be expected for our data. It was first shown
e corpus of VCV sequences �a�; superimposition on these EMA data of therations of the main corpus �b�, for a movement associated with VL �oblique
for thnfigu
by linear regression applied to the 2110�3 variables of the
urier and P. Badin: Three-dimensional articulatory modeling of velum
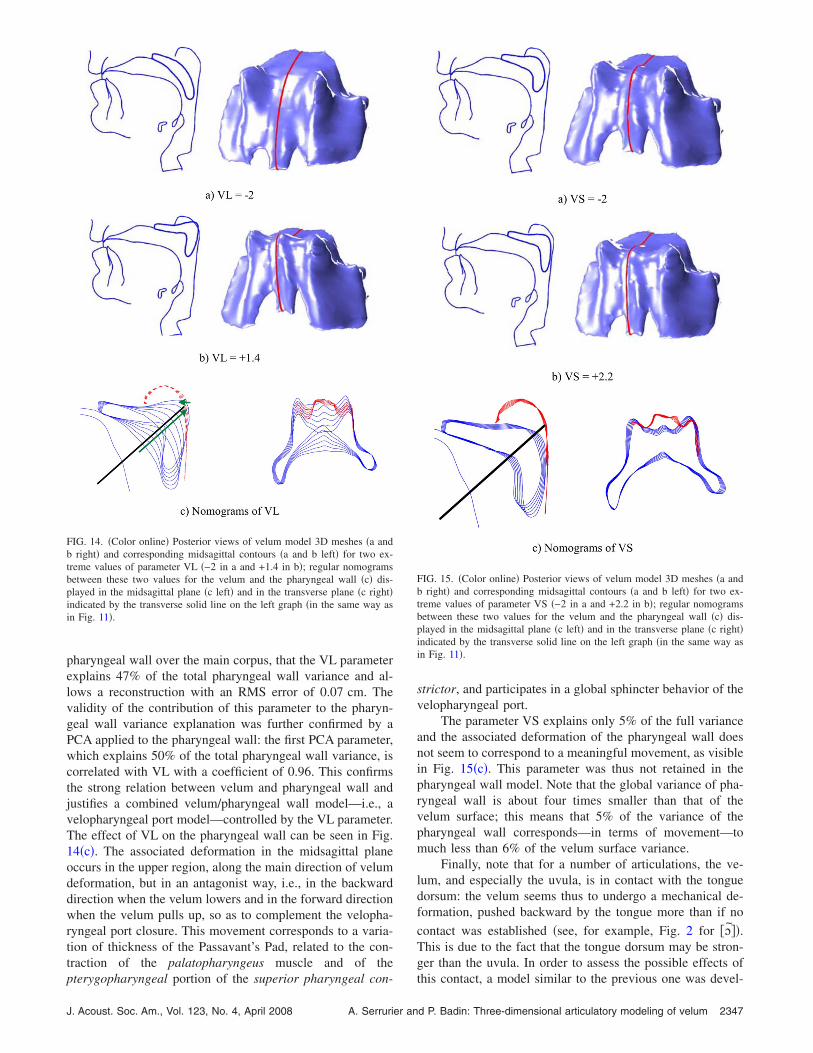
pharyngeal wall over the main corpus, that the VL parameterexplains 47% of the total pharyngeal wall variance and al-lows a reconstruction with an RMS error of 0.07 cm. Thevalidity of the contribution of this parameter to the pharyn-geal wall variance explanation was further confirmed by aPCA applied to the pharyngeal wall: the first PCA parameter,which explains 50% of the total pharyngeal wall variance, iscorrelated with VL with a coefficient of 0.96. This confirmsthe strong relation between velum and pharyngeal wall andjustifies a combined velum/pharyngeal wall model—i.e., avelopharyngeal port model—controlled by the VL parameter.The effect of VL on the pharyngeal wall can be seen in Fig.14�c�. The associated deformation in the midsagittal planeoccurs in the upper region, along the main direction of velumdeformation, but in an antagonist way, i.e., in the backwarddirection when the velum lowers and in the forward directionwhen the velum pulls up, so as to complement the velopha-ryngeal port closure. This movement corresponds to a varia-tion of thickness of the Passavant’s Pad, related to the con-traction of the palatopharyngeus muscle and of the
FIG. 14. �Color online� Posterior views of velum model 3D meshes �a andb right� and corresponding midsagittal contours �a and b left� for two ex-treme values of parameter VL �−2 in a and +1.4 in b�; regular nomogramsbetween these two values for the velum and the pharyngeal wall �c� dis-played in the midsagittal plane �c left� and in the transverse plane �c right�indicated by the transverse solid line on the left graph �in the same way asin Fig. 11�.
pterygopharyngeal portion of the superior pharyngeal con-
J. Acoust. Soc. Am., Vol. 123, No. 4, April 2008 A. Serrurier an
strictor, and participates in a global sphincter behavior of thevelopharyngeal port.
The parameter VS explains only 5% of the full varianceand the associated deformation of the pharyngeal wall doesnot seem to correspond to a meaningful movement, as visiblein Fig. 15�c�. This parameter was thus not retained in thepharyngeal wall model. Note that the global variance of pha-ryngeal wall is about four times smaller than that of thevelum surface; this means that 5% of the variance of thepharyngeal wall corresponds—in terms of movement—tomuch less than 6% of the velum surface variance.
Finally, note that for a number of articulations, the ve-lum, and especially the uvula, is in contact with the tonguedorsum: the velum seems thus to undergo a mechanical de-formation, pushed backward by the tongue more than if no
contact was established �see, for example, Fig. 2 for �Å̃��.This is due to the fact that the tongue dorsum may be stron-ger than the uvula. In order to assess the possible effects of
FIG. 15. �Color online� Posterior views of velum model 3D meshes �a andb right� and corresponding midsagittal contours �a and b left� for two ex-treme values of parameter VS �−2 in a and +2.2 in b�; regular nomogramsbetween these two values for the velum and the pharyngeal wall �c� dis-played in the midsagittal plane �c left� and in the transverse plane �c right�indicated by the transverse solid line on the left graph �in the same way asin Fig. 11�.
this contact, a model similar to the previous one was devel-
d P. Badin: Three-dimensional articulatory modeling of velum 2347

oped from the 28 of the 46 configurations of the main corpusthat were free of velum/tongue contact. To complement thiscontactless model, the region of the velum in contact withthe tongue was geometrically shifted in order to simulate thetongue push. This type of modeling did not bring significantimprovement in terms of variance explanation and RMS er-ror reconstruction and was thus not considered any further.
F. Consistency between MRI and EMAmeasurements
In order to establish more precisely the relation betweenthe 3D velum model and the EMA velum coil coordinates,which represent the displacement of a real flesh point of thevelum, the specific vertex of the velum mesh that could beconsidered as the flesh point on which the coil is attachedwas determined, according to the following method. �1� Eachof the 46 articulations of the MRI corpus were linked withone or more occurrences of the same articulation in the EMAcorpus; �2� for each occurrence, the velum vertices weresorted according to their distance from the correspondingEMA velum coil location; �3� the general rank of a givenvertex was then defined as the maximum of its distance rankin each occurrence, that corresponds to the maximal distanceover all the occurrences; �4� the pseudo-EMA vertex wasfinally chosen as the vertex with the smallest global rank,which ensures that it has the smallest of the maximal dis-tances over the occurrences.
Figure 13�b� displays, on top of the midsagittal spacecovered by the EMA velum coil, the pseudo-EMA vertexposition for the 46 shapes of the velum mesh constitutinganalysis data. The accurate correspondence between pseudo-EMA vertex and the real EMA velum coil confirms the con-sistency between the two sets of data.
Due to the linear nature of the velum model, each con-trol parameter drives the displacement of each vertex alongstraight lines. Figure 13�c� displays such lines for thepseudo-EMA vertex as a function of VL and of VS in themidsagittal plane on top of the midsagittal space covered bythe EMA velum coil. This confirms the excellent correspon-dence between the movements of the real EMA coil and ofthe pseudo-EMA vertex reconstructed from the MRI images,and thus the validity of our approach.
Finally, note that despite a relatively small gain in theamount of variance that is explained, VS appears as a coher-ent complementary degree of freedom to the velum: �1� itreduces the RMS reconstruction error by 25%, �2� it maymodify the velopharyngeal constriction in a meaningful way,and �3� it helps the pseudo-EMA vertex trajectories to coverthe 2D space of the real EMA data in a coherent way.
G. Recovery of 3D velum shape from midsagittalmeasurements
In the general context of speech production research, therelation between a 3D shape of an organ and its midsagittalcontours constitutes an interesting issue. Badin et al. �2002�have shown that the 3D shapes could be predicted for themost part from midsagittal contours for the tongue, the face
and the lips. Thus, it may be interesting to infer the time2348 J. Acoust. Soc. Am., Vol. 123, No. 4, April 2008 A. Serr
trajectories of the 3D velum and pharyngeal wall from mid-sagittal measurements such as EMA velum coil recordings.Therefore we assessed the possibility of recovering the 3Dgeometry of the velopharyngeal port from the position of thevelum EMA coil in the X-Z plane by means of the model. Weattempted to estimate the values of the two parameters VLand VS from the position in the X-Z plane of the pseudo-EMA vertex on the velum mesh for each of the articulationsof the main corpus. As the coordinates of this point in theX-Z plane are linearly related to VL and VS by the velummodel, the determination of these two parameters is straight-forward. Note that the reconstruction error for this point isnull, but may be non-optimal for the other vertices. A globalRMS reconstruction error of 0.08 cm was finally observedover the full corpus of the 46 configurations for the modeldriven by VL estimated from the pseudo-EMA vertex; theerror was down to 0.07 cm for the model driven by com-bined VL and VS. These results seem to be acceptable incomparison with the model RMS reconstruction errors of0.08 and 0.06 cm for VL and VL plus VS, respectively.Moreover, the real VL values and their estimation from thepseudo-EMA vertex are correlated with a coefficient of 0.98;similarly, a correlation of 0.95 was found for VS. These re-sults confirm the possibility of predicting the global 3Dshape of the velopharyngeal port from midsagittal data andfrom a single point such as an EMA coil record in particular.
IV. ARTICULATORY MODELING AND AREAFUNCTIONS
The new articulatory model represents important knowl-edge about the articulatory behavior of the subject’s velumand nasopharyngeal wall. However, since an aim of speechproduction modeling is to predict the speech signal, it is veryimportant to be able to derive area functions from the 3Dshape of the oral and nasal tracts in order to be able to char-acterize the resulting acoustics.
A. Oral and velopharyngeal area functiondetermination
At this level, a complete articulatory model of the oraltract of the subject is not yet available. Thus, in order toassess the acoustic influence of the velum movements, thecomplete area functions of the oral and nasal tracts for vari-ous values of parameters VL and VS were needed. We havethus manually traced oral tract cross-sectional contours on allthe transverse images defined by the semipolar grid illus-trated in Fig. 3�b� for the three point vowels �a i u�. Note thatthe superimposition on the images of the bony structure con-tours, including the teeth as illustrated in Fig. 9�a�, allowsmore accurate and reliable vocal tract contours to be drawn.For a given articulation and given values of VL and VS, thevelum and pharyngeal wall have then been intersected withtransverse planes in the velum region �see top left of Fig.16�, with an angle of 8° between two adjacent planes. Asvisible in Fig. 11, the nasal tract in such planes is delimitedby the velum and nasopharyngeal wall contours, while theoral tract is delimited by the velum and tongue contours.
Thus, the tongue contours have been manually traced in theurier and P. Badin: Three-dimensional articulatory modeling of velum

corresponding intersecting planes for �a, i, u�. Then, the oraland nasal tracts’ cross-sectional contours in these planes havebeen automatically detected. This detection assumes neces-sarily that the contours are closed. Therefore, organs sepa-rated by less than 0.03 cm were considered to be in contact,which ensured that the associated tract contours were closed.This was particularly needed in regions where the tongue andvelum were in contact. Note that in planes near the horizon-tal ones, the intersection with the velum—in fact the uvula—can be limited to a closed contour isolated inside the oraltract �see slices 1 and 2 of Fig. 16�. In this case, the cross-sectional area of the inner contour must be subtracted fromthat of the outer contour, to take into account the reduction oftract area due to the presence of the uvula. Figure 16 displaysthe cross-sectional organ outlines and corresponding oral andnasal cross-sectional areas in the velum region for VL andVS equal respectively to 0.3 and 0 and for the tongue shapeof �a�.
Oral and nasal area functions have then been computedfrom the cross-sectional contours following the process de-scribed in Sec. II D 2. The first cross section with a distinctnasal tract �e.g., grid 3 in Fig. 16� is considered as the be-ginning of the nasal tract, and thus connected to the nasalpassages described in Sec. II D 1 through the cavum. The
210
12
14
16
S
2 4 6 810
12
14
16
Slice 3
210
12
14
16
S
2 4 6 810
12
14
16
Slice 6
210
12
14
16
S
10 12 147
8
9
10
11
12
13
1
2
3
4
5
6
78
FIG. 16. �Color online� Display of cross sections of oral and nasal tracts fovelum region shown by the midsagittal grid on the top left of the figure. Ovelum intersections in grids 1 and 2 correspond to isolated flesh areas insid
eight oral tract cross sections corresponding to the velum
J. Acoust. Soc. Am., Vol. 123, No. 4, April 2008 A. Serrurier an
region are integrated into the whole set of the vowel crosssections already traced, in order to obtain complete oral areafunctions from the glottis to the lips. Note that the outlet tubeat the lips has been lengthened by 1.1 cm to take into ac-count the labial horn, i.e., the region of lips ahead of the lipcorner where the cross-sectional vocal tract outline is not aclosed contour any longer �Badin, Motoki, Miki, Ritterhaus,and Lallouache, 1994�. The next two sections describe theinfluence of the velum position on oral and nasal area func-tions.
B. Influence of velum movement on thevelopharyngeal area function
Figure 17 displays nomograms of the velopharyngealarea function for variations of VL and VS corresponding tothose of Figs. 14 and 15. As expected, variations of VL �Fig.17�a�� induce important area function variations: the volumeof the velopharyngeal tract from beginning of its separationfrom oral tract to the point of separation into two nasal pas-sages varies from 9.70 cm3 for a velum maximally open to4.25 cm3 at occlusion. The velopharyngeal port constrictionis located close to its lower end. When the velopharyngealport closes, the velum pulls up, while the uvula, the lower
6 8
1
2 4 6 810
12
14
16
Slice 2
6 8
4
2 4 6 810
12
14
16
Slice 5
6 8
7
2 4 6 810
12
14
16
Slice 8
�0.3, VS�0, and for the tongue shape of �a� along the eight planes in theoss-sectional areas are displayed in clear and nasal tract areas in dark. Theoral tract.
4
lice
4
lice
4
lice
r VLral cre the
end of the velopharyngeal tract, and the constriction location
d P. Badin: Three-dimensional articulatory modeling of velum 2349

move upwards. The constriction area varies from 0.8 cm2 fora velum maximally open to 0 at occlusion, while its location,considered as the midpoint of the constriction tube, movesupwards simultaneously over a range of 0.9 cm. These ob-servations are consistent with those of Demolin et al. �2003�who found for a velum maximally lowered a maximum ofthe constriction area ranging from 0.66 to 1.93 cm2, depend-ing on the subject. Moreover, they found that the cross-sectional area increases towards the cavum, as we observe inour data �see Fig. 17�. The second parameter VS �Fig. 17�b��induces smaller variations of the area function, but the rela-tive variations of the constriction area might be large, up to afactor of 3. Contrary to the VL effects, the constriction areareduction controlled by VS is accompanied by a downwardmovement of the constriction location: while the constrictionarea decreases from 0.3 to 0.1 cm2, its location moves about0.2 cm towards the glottis.
C. Relation between velopharyngeal area function,velum height, and midsagittal distance
The present 3D articulatory model is very detailed, andthus rather complex to use. As access to 3D data and modelsis not commonly granted, we have derived from our data asimplified model that delivers directly the velopharyngealarea function as a function of velum height.
Velum height can be defined as the distance of a mid-sagittal velum point about halfway between the hard palate-velum junction and the tip of the uvula along an oblique line.In the present study, the oblique line obtained by linear re-gression on the 46 pseudo-EMA vertex of the data �Fig.13�b�� is oriented at about 50° from an horizontal plane;velum height �referred to as VelHei� is thus defined as thedistance along this line of the pseudo-EMA vertex projectionfrom an arbitrary reference point �cf. the cross in Fig. 13�a��.The velopharyngeal port area function represents the velo-pharyngeal tract from the beginning of the nasal tract to thepoint where it splits into the two choanae. Considering thatthe tube number may change across articulations, the areafunction is resampled for each articulation into 11 tubes of
FIG. 17. �Color online� Variations of velopharyngeal port area function as atract is arbitrarily chosen as the point where the nasal tract splits into two cthe x axis and an area on the y axis.
identical length. The cross-sectional area of each of the 11
2350 J. Acoust. Soc. Am., Vol. 123, No. 4, April 2008 A. Serr
tubes is calculated so that the volume enclosed in it is equalto the total volume enclosed between the same boundariesalong the midline in the original tract. The 11 cross-sectionalareas and the common length of the tubes of the velopharyn-geal area function are then linearly controlled by the VelHeiparameter, the corresponding coefficients being determinedby linear regression analysis over the set of 46 area func-tions.
As expected, a significant amount of the variance of the11 tubes of the velopharyngeal port area function is ex-plained by this parameter �87%�. The constriction, whichconstitutes a critical parameter from the acoustic point ofview, displayed an area RMS reconstruction error of0.14 cm2 and a position error of 0.41 cm. These errors arevery close to those obtained when the articulatory model iscontrolled by only the VL parameter as in Sec. III G �areaerror of 0.16 cm2 and position error of 0.38 cm�. The varia-tions of the constriction area and position as a function ofVelHei are illustrated in Fig. 18. The linear modeling impliesmoreover that for each tube, area and length vary linearlywith VelHei. Note that the step-like behavior of the constric-tion location can be ascribed to changes of the constrictiontube index when the velum moves; increasing the number oftubes would reduce the step size without altering the generalbehavior. The velopharyngeal port area function is thus fairlywell predictable directly from the midsagittal measurementof a single EMA point without resorting to an articulatorymodel.
A complementary approach was used by Björk �1961�:based on sagittal and transverse x-ray tomograms taken fromten subjects, he established a linear relation between theminimal velum/pharyngeal wall midsagittal distance and thetransverse constriction area for distances greater than 0.2 cm.
We applied the same approach with the articulatorymodel. A set of midsagittal contours was obtained from the3D velum and pharyngeal wall meshes for VL varying be-tween the extreme values found from the data. Figure 19displays the relation between the minimal velum/pharyngealwall midsagittal distance and the constriction area. This re-
tion of VL �a� and VS �b� parameters. The origin of the abscissa along thee on each side of the septum wall. Each tube is represented by a length on
funchoana
lation is not perfectly linear, but close to Björk’s results.
urier and P. Badin: Three-dimensional articulatory modeling of velum

Note that the sagittal distance is null for small values of theconstriction area, which is explained by a full midsagittalcontact between velum and pharyngeal wall while the chan-nels on both sides remain open.
D. Influence of velum movement on the oral areafunction
An important question in the articulatory-acoustic studyof nasals lies in the co-variation of the oral and nasal areaswhen the velum moves. Some researchers have assumed thatthe velum acts as a trap door �Fujimura and Lindqvist, 1971�,while others have considered that the oral area decreases asmuch as the nasal area increases when the velum lowers, thetotal of both areas remaining constant �Maeda, 1982; Fengand Castelli, 1996�. Feng and Kotenkoff �2006� have more-over suggested that the decrease of oral tract constrictionarea induced by the velum lowering may play an importantrole in nasalization. This present model allows studying thisphenomenon.
FIG. 18. �Color online� Variations of the area �a� and location �b� of the veloof the tract is arbitrarily chosen as the point where the nasal tract splits into
0 0.1 0.2 0.3 0.4 0.5 0.6 0.7 0.8 0.90
0.05
0.1
0.15
0.2
0.25
0.3
0.35
0.4
Area (cm2)
Mid
agitta
ldis
tance
(cm
)
FIG. 19. �Color online� Variations of the velopharyngeal port midsagittalconstriction distance as a function of the constriction area for VL varying
linearly between the maximal values found in the data.J. Acoust. Soc. Am., Vol. 123, No. 4, April 2008 A. Serrurier an
The influence of velum movements on the oral areafunction is illustrated by Fig. 20, which displays nomogramsof the oral area function for the articulation �a� for VL andVS variations corresponding to those of Figs. 14 and 15.Note that the complete tract is considered fixed and that thearea variations are only due to velum position variations asfunction of VL and VS. We observe, for this articulation, animportant variation of the oral area function, from 0.2 to3 cm2 for the tube with maximal variation range between thetwo extreme positions of the velum corresponding to VL inthe corpus, and from 1.4 to 2.3 cm2 for the positions corre-sponding to VS. Important variations were observed for �i�and �u� as well, with areas varying from 5.1 to 8.5 cm2 for �i�and from 0 to 2.9 cm2 for �u� as a function of VL, and from6.5 to 8 cm2 for �i� and from 2.4 to 3.6 cm2 for �u� as afunction of VS.
In addition, we have characterized the co-variation ofthe areas of both tracts when the velum moves. Consideringthe relatively small variation of the oral area function withVS, we only investigated the effects of VL. As an illustra-tion, Fig. 21 displays the variations of the oral and nasalareas of the first tube of the area functions at the location ofthe nasal tract branching for the three oral articulations �a�,�i� and �u�. We observe that the oral area clearly increasesfaster than the nasal area decreases when the velum rises.The same behavior was found for the other tubes down-stream, i.e., towards the lips or nostrils, though this asym-metric effect becomes less prominent.
V. INFLUENCE OF VELUM MOVEMENTS ON THEACOUSTIC VOWEL SPACE
Nasalization is envisaged by Feng and Castelli �1996� asa trend from a pure oral articulation—from glottis to lips—toa pure nasopharyngeal target—from glottis to nostrils. Thesetwo extreme articulations correspond to single tracts withoutany other parallel tract �we do not consider in this study anyof the various paranasal sinuses�. The present model allowssimulating the variations of the vocal tract induced by the
yngeal port constriction as a function of Velum Height �VelHei�. The originchoanae on each side of the septum wall.
phartwo
velum alone, for transitions from a pure oral articulation to a
d P. Badin: Three-dimensional articulatory modeling of velum 2351

pure nasopharyngeal articulation, without influence of thecoarticulatory movements usually observed on other organs,such as the tongue, in natural productions. The area functionsof both tracts were determined according to the process de-scribed above. Using an acoustic model fed by these areafunctions, it is thus possible to investigate the influence ofthe velum movements on the acoustic transfer functions ofthe tracts between glottis and lips/nostrils. In the presentstudy, we used a standard frequency domain electrical lineanalog model of acoustic plane wave propagation based onBadin and Fant �1984�, and on Fant �1985� for the couplingof the nasal tract in parallel to the oral one. One may defineat least three acoustic transfer functions: �1� the oral transferfunction, i.e., the ratio between the acoustic velocity at thelips over the acoustic velocity at the glottis; �2� the nasopha-ryngeal transfer function, i.e., the ratio between the acousticvelocity at the nostrils over the acoustic velocity at the glot-tis; �3� the total transfer function, i.e., the sum of both, as-
FIG. 20. �Color online� Variations of oral tract area function as a function othe abscissa along the tract is arbitrarily chosen as glottal exit. Each tube is
-3 -2 -1 0 1 2 30
1
2
3
4
5
6
7
VL
Are
a(c
m2)
[a]
[i]
[u]
FIG. 21. �Color online� Oral �rising lines� and nasal �falling line� areas ofthe first tube of the area functions at the location of the nasal tract branchingas a function of VL for the three articulations �a�, �i� and �u�. The vertical
dashed lines mark the minimal and maximal VL values found in the data.2352 J. Acoust. Soc. Am., Vol. 123, No. 4, April 2008 A. Serr
suming as a first approximation that the sound radiated atsome distance from the mouth and nostrils is just the sum ofboth contributions. The connection of a tract in parallel withthe other tract both changes the poles of the transfer functionof the tract considered and introduces zeros as well �see, e.g.,Fant, 1985�. Figure 22 displays, for example, the evolutionof the total transfer function induced by variations of VLfrom a pure oral tract to a pure nasopharyngeal tract for afixed articulation �a�. The two extreme total transfer func-tions, displayed in bold, correspond to the two articulatorytargets, and contain only poles, while intermediate transferfunctions contain poles and zeros due to the presence of par-allel tracts.
We observe in the 500–1500 Hz frequency band that abound pole-zero pair evolves from the first formant towardthe second formant. Our simulations showed that the F1-F2
�a� and VS �b� parameters around the fixed articulation of �a�. The origin ofesented by a length on the x axis and an area on the y axis.
0 1000 2000 3000 4000 5000-120
-100
-80
-60
-40
-20
0
20
40
Hz
dB
FIG. 22. �Color online� Nomograms of the total transfer function of thevocal tract obtained by varying VL from a pure oral tract �VL�1.4, upperbold line� to a pure nasopharyngeal tract �VL=−2.6, lower bold line� for afixed articulation �a�. Each curve is arbitrarily separated from its neighborsby 10 dB for better reading. The two extreme transfer functions in boldcorrespond to oral tract �top� and nasopharyngeal tract �bottom� and contain
f VLrepr
only poles without zeros.
urier and P. Badin: Three-dimensional articulatory modeling of velum

formants associated with the pure nasopharyngeal tract for�a� are both lower than those associated with the pure �a� oraltract. Similar simulations for �i� and �u� led us to plot thevocalic triangle based on the three point vowels �a i u� for thetwo extreme positions of the velum �Fig. 23�. The dashedtriangle corresponds to the velum maximally high �pure oraltract� while the solid one corresponds to the velum maxi-mally low �pure nasopharyngeal tract�. We observe for thenasopharyngeal target a reduction of the vocalic space in azone close to 450–1000 Hz, globally consistent with thesimulations of Feng and Castelli �1996�.
VI. SUMMARY AND PERSPECTIVES
A. Summary
This study has resulted in an original set of three-dimensional geometric data and in an original three-dimensional model of the velopharyngeal port, i.e., of thevelum and of the nasopharyngeal wall. More precisely, setsof CT and MRI images have been collected from a Frenchsubject who sustained a set of 46 articulations covering therange of sounds that he can produce. Generic triangular sur-face meshes have been derived for the velum and the na-sopharyngeal wall; their shapes, fitted by elastic deformationto each of the articulations, constitute accurate and consistent3D geometric representations of these organs, with a con-stant number of vertices; they establish a unique referencecollection of accurate 3D articulatory data. Moreover, eachpoint of the generic meshes can be assumed to be a fleshpoint whose variations over the corpus represent the variabil-ity of a real flesh point. In addition, 3D shapes of rigid struc-tures such as the nasal passages, the various paranasal si-nuses, the hard palate, the jaw, etc. have been extracted fromCT and MRI images of the subject. These data complementthe various data already collected on the same French subject�cf. Beautemps et al., 2001; Badin et al., 2002; and Badin
5001000150020002500
200
300
400
500
600
700
800
F2 (Hz)
F1
(Hz)
FIG. 23. �Color online� Representation in the acoustic F1-F2 vowel space ofthe pure oral articulations �high velum� for �a i u� �dashed lines� and of thecorresponding pure nasopharyngeal articulations �low velum, solid lines�.
and Serrurier, 2006� and constitute a rich and accurate basis
J. Acoust. Soc. Am., Vol. 123, No. 4, April 2008 A. Serrurier an
for further developments in articulatory and acoustic model-ing of nasals and more generally of all articulations.
The second series of valuable results is the determina-tion of the degrees of freedom of the velum and of the na-sopharyngeal wall, and the associated 3D linear articulatorymodels. The first component extracted by PCA from the datawas a head tilt movement in a sagittal plane; as it was notrelated to speech its contribution was removed from data. Itwas nevertheless hypothesized that this general head move-ment could induce an active compensation of the velumshape by the subject. A PCA applied to the velum data cor-rected for head tilt uncovered two main degrees of freedom:the first—dominant—component, that accounts for 83% ofthe velum coordinates’ variance, corresponds to an obliquevertical movement clearly related to the pulling action thatcould be expected from the levator veli palatini muscle; thesecond component, that explains another 6% of the varianceand controls smaller movements, represents a mostly hori-zontal movement that corresponds rather well to the moresphincter-like action plausible for the superior pharyngealconstrictor. It was also shown that the nasopharyngeal wall,though its variance is four times smaller than that of thevelum, is very much correlated to the first parameter whichwas found to be able to account for 47% of its variance.
As a means to further assess the validity of the data andof the model, the midsagittal coordinates of a flesh point onthe lower face of the velum were collected by means of anEMA system for the same subject uttering a comprehensiveset of VCV sequences. It was found that the midsagittalspace covered by this point is very similar to the midsagittalspace covered by the particular point of the 3D velum ge-neric mesh considered to be the same flesh point.
The velopharyngeal port model is thus efficiently con-trolled by these two articulatory parameters. Note that theRMS reconstruction error of the organs is less than one mil-limeter, which is consistent with results obtained on thetongue �cf. Badin et al., 2002, and Badin and Serrurier,2006�.
Area functions could be derived from these 3D geomet-ric representations. The precise 3D geometry of the nasalpassages and the corresponding area functions constitute anew set of data consistent with the few investigations foundin the literature and confirms in particular a constriction ofabout 1 cm2 large and 0.6 cm long located 1.7 cm beforenostrils outlet. The nasal coupling area was found to raise upto 0.8 cm2 while the corresponding constriction location maymove over a range of about 1 cm. In addition, a simplifiedmodel of velopharyngeal port area function controlled di-rectly by the velum height was derived. The strong influenceof the velum movement on the oral tract area function hasbeen confirmed. Finally, acoustic simulations based on themodel gave results similar to that of Feng and Castelli�1996�, i.e., a reduction of the F1-F2 acoustic vowel spacewhen going from pure oral vowels to the corresponding purenasopharyngeal tract in the 450–1000 Hz zone, sometimes
referred to as the nasal gap.d P. Badin: Three-dimensional articulatory modeling of velum 2353

B. Perspectives
A part of the complex geometry of the nasal passagesremained unexploited in the present study. The shape of thevarious sinuses should be integrated into the area functionsof the nasal passages, and their influence on the acousticsshould be further assessed. More generally, the formants de-termined from the articulatory model should be compared tothose measured on the subject for the same articulations inorder to validate the model at the acoustic level. In particular,separate mouth-nose acoustic recordings performed on thesame subject by Feng and Kotenkoff �2006� will reveal veryuseful information. It is also likely that the complex shape ofthe nasal passages should be used to elaborate more realisticacoustic models, including more realistic losses.
In order to be fully operational for the study of nasality,the new model of velopharyngeal port presented should beintegrated into a complete articulatory model, including es-pecially the tongue �cf. Badin and Serrurier, 2006�. Thiswould allow accurate control of the complete 3D geometryof the oral and nasal tracts, to obtain corresponding areafunctions from the glottis to the lips and the nostrils, andfinally to determine the resulting acoustic characteristics interms of formants or speech sounds. This complete modelalso opens the possibility to characterize the importance oftongue backing for French nasal vowels as discussed byMaeda �1993�, Delvaux et al. �2002�, or Feng and Kotenkoff�2006�. The complete model would also allow the determi-nation of the covariation between oral and nasal couplingareas related to velum movements usually assumed to belinear in the literature �see, e.g., Maeda, 1982, or Feng andCastelli, 1996�.
The use of this articulatory model makes it possible tostudy the influence of sole velum movements on the vocaltract without the coarticulatory movements usually made byother organs during normal velum transitions in naturalspeech. More precisely, in the continuity of the work led byFeng and Castelli �1996� and Feng and Kotenkoff �2006�, itwill be useful to perform simulations to assess the acousticconsequences of the velum movement separately on thevelopharyngeal constriction, oral constriction and nasal cou-pling place in the oral tract, in order to contribute to thecharacterization of the acoustic cues of nasality.
The model, in relation with the dynamic articulatorymidsagittal trajectories of fleshpoints on the velum and thetongue provided by the EMA device, will allow the articu-latory copy synthesis of VCV sequences through the recov-ery of the complete 3D geometry of the vocal tract. Thecontrol of the various articulators for dynamic speech couldthus be investigated. In particular, assuming that the princi-pal parameter of the velopharyngeal port, e.g. VL, allows thecontrol of the constriction from closure to maximal aperture,it would be interesting to evaluate the possibility of control-ling the velum with only the VL parameter, which wouldreduce the complexity of articulatory control.
Finally, the articulatory synthesizer available would beuseful to study the perception of nasality. In particular, thestudy of the interaction between nasalization and height in
vowel perception led by Macmillan, Kingston, Thorburn,2354 J. Acoust. Soc. Am., Vol. 123, No. 4, April 2008 A. Serr
Walsh Dickey, and Bartels �1999� using a formant synthe-sizer could be replicated with more ecological stimuli, i.e.,stimuli that could really be produced by a human subject.
ACKNOWLEDGMENTS
We would like to thank Christoph Segebarth, Jean-François Lebas, and Monica Baciu for the main corpus sag-ittal MR images acquisition at the Radiology Department ofthe University Hospital, Grenoble, France, and KiyoshiHonda, Shinobu Masaki, Sayoko Takano, Yasuhiro Shimada,and Ichiro Fujimoto for coronal MRI and head tilt MRI ac-quisition at ATR, Kyoto, Japan. The EMA data have beenrecorded at ICP, Grenoble, France, thanks to the help ofAlain Arnal, Christophe Savariaux, and Solange Rossato. Weare grateful to Jacques Lebeau and Franz Chouly for theirvaluable discussions and bibliographic advice aboutanatomy. We acknowledge the help of the GMCAO team atTIMC for the use of the elastic matching software TestRigid�Yohan Payan, Maxime Bérar�, Daniel Huber for the smooth-ing software SmoothMesh �VMR Lab at Carnegie MellonUniversity, USA� and Andreas Fabri �Geometrica ResearchGroup at INRIA, France� for the 3D meshing software. Weare also grateful to David Pritchard for the English correc-tions. Finally, we would like to thank three anonymous re-viewers and the associate editor of the journal, ChristineShadle, for their pertinent comments on the first and secondversions of the manuscript, and for their very detailed andhelpful editorial help.
Amelot, A., Crevier-Buchman, L., and Maeda, S. �2003�. “Observations ofthe velopharyngeal closure mechanism in horizontal and lateral directionsfrom fiberscopic data,” In Proceedings of the 15th International Congressof Phonetic Sciences, edited by M.-J. Solé, D. Recasens, and J. Romero,Barcelona, Spain, pp. 3021–3024.
Badin, P., Bailly, G., Elisei, F., and Odisio, M. �2003�. “Virtual TalkingHeads and Audiovisual Articulatory Synthesis �Invited talk at the sympo-sium “Articulatory synthesis. Advances and prospects”�.” In Proceedingsof the 15th International Congress of Phonetic Sciences, M.-J. Solé, D.Recasens, and J. Romero, editors, Barcelona, Spain, Vol. 1, pp. 193–197.
Badin, P., Bailly, G., Revéret, L., Baciu, M., Segebarth, C., and Savariaux,C. �2002�. “Three-dimensional articulatory modeling of tongue, lips andface, based on MRI and video images,” J. Phonetics 30�3�, 533–553.
Badin, P., and Fant, G. �1984�. “Notes on vocal tract computation,” SpeechTransmission Laboratory-Quarterly Progress Status Report-Stockholm, 25,53–108.
Badin, P., Motoki, K., Miki, N., Ritterhaus, D., and Lallouache, T. M.�1994�. “Some geometric and acoustic properties of the lip horn,” J.Acoust. Soc. Jpn. �E� 15�4�, 243–253.
Badin, P., and Serrurier, A. �2006�. “Three-dimensional modeling of speechorgans: Articulatory data and models,” In Transactions on Technical Com-mittee of Psychological and Physiological Acoustics, The Acoustic Societyof Japan, Kanazawa, Japan, Vol. 36�5�, H-2006-77, pp. 421–426.
Baer, T., Gore, J. C., Gracco, L. C., and Nye, P. W. �1991�. “Analysis ofvocal tract shape and dimensions using magnetic resonance imaging: Vow-els,” J. Acoust. Soc. Am. 90�2, Pt. 1�, 799–828.
Beautemps, D., Badin, P., and Bailly, G. �2001�. “Linear degrees of freedomin speech production: Analysis of cineradio- and labio-film data andarticulatory-acoustic modeling,” J. Acoust. Soc. Am. 109�5�, 2165–2180.
Bell-Berti, F. �1976�. “An electromyographic study of velopharyngeal func-tion in speech,” J. Speech Hear. Res. 19, 225–240.
Bell-Berti, F. �1993�. “Understanding velic motor control: Studies of seg-mental context,” In Phonetics and Phonology, Nasals, Nasalization, andthe Velum, edited by M. K. Huffman and R. A. Krakow, �Academic, NewYork�, pp. 63–85.
Björk, L. �1961�. Velopharyngeal Function in Connected Speech. Studies
Using Tomography and Cineradiography Synchronized with Speech Spec-urier and P. Badin: Three-dimensional articulatory modeling of velum

trography �Appelbergs Bocktryckeri AB, Stockholm, Sweden�.Bjuggren, G., and Fant, G. �1964�. “The nasal cavity structures,” STL-QPSR
5�4�, 5–7.Couteau, B., Payan, Y., and Lavallée, S. �2000�. “The mesh-matching algo-
rithm: An automatic 3D mesh generator for finite element structures,” J.Biomech. 33, 1005–1009.
Crystal, D. �1997�. A Dictionary of Linguistics and Phonetics �Blackwell,MA�.
Dang, J., Honda, K., and Suzuki, H. �1994�. “Morphological and acousticalanalysis of the nasal and the paranasal cavities,” J. Acoust. Soc. Am. 96,2088–2100.
Delvaux, V., Metens, T., and Soquet, A. �2002�. “French nasal vowels:Acoustic and articulatory properties,” In Proceedings of the 7th Interna-tional Conference on Spoken Language Processing, Denver, Vol. 1, pp.53–56.
Demolin, D., Delvaux, V., Metens, T., and Soquet, A. �2003�. “Determina-tion of velum opening for French nasal vowels by magnetic resonanceimaging,” J. Voice 17�4�, 454–467.
Demolin, D., Lecuit, V., Metens, T., Nazarian, B., and Soquet, A. �1998�.“Magnetic resonance measurements of the velum port opening,” In Pro-ceedings of the 5th International Conference on Spoken Language Pro-cessing, edited by R. H. Mannell and J. Robert-Ribes, Sydney, Australia,Australian Speech Science and Technology Association Inc., Vol. 2, pp.425–428.
Dickson, D. R., and Dickson, W. M. �1972�. “Velopharyngeal anatomy,” J.Speech Hear. Res. 15, 372–381.
Engwall, O., and Badin, P. �1999�. “Collecting and analyzing two- andthree-dimensional MRI data for Swedish,” Tal Musik Hörsel - QuarterlyProgress Status Report - Stockholm, 40�3–4�, 11–38.
Fabri, A. 3D meshing software �http://cgal.inria.fr/Reconstruction, linkavailable May 29, 2007�.
Fant, G. �1960�. Acoustic Theory of Speech Production �Mouton, TheHague�.
Fant, G. �1985�. “The vocal tract in your pocket calculator,” STL-QPSR26�2–3�, 1–19.
Feng, G., and Castelli, E. �1996�. “Some acoustic features of nasal andnasalized vowels: A target for vowel nasalization,” J. Acoust. Soc. Am.99�6�, 3694–3706.
Feng, G., and Kotenkoff, C. �2006�. “New considerations for vowel nasal-ization based on separate mouth-nose recording,” In Proceedings of Inter-speech’06, Pittsburgh, pp. 2242–2245.
Ferguson, C. A., Hyman, L. M., and Ohala, J. J. �Editors�, �1975�. Nasalfest:Papers from a symposium on nasals and nasalization, Stanford, CA.
Fujimura, O., and Lindqvist, J. �1971�. “Sweep-Tone measurements ofvocal-tract characteristics,” J. Acoust. Soc. Am. 49, 541–558.
House, A. S., and Stevens, K. N. �1956�. “Analog studies of the nasalizationof vowels,” J. Speech Hear Disord. 21, 218–232.
Huber, D., The SmoothMesh software �http://www.cs.cmu.edu/~vmr/software/meshtoolbox/downloads.html, link available at May 29th, 2007�.
Huffman, M. K., and Krakow, R. A. �1993�. Phonetics and Phonology.Nasals, Nasalization, and the Velum �Academic Press, New York�, Vol. 5.
Kelso, J. A. S., Saltzman, E. L., and Tuller, B. �1986�. “The dynamicaltheory of speech production: Data and theory,” J. Phonetics 14, 29–60.
Kent, R. D. �1997�. The Speech Sciences �Singular, Stockholm, Sweden�.Kitamura, T., Takemoto, H., Honda, K., Shimada, Y., Fujimoto, I., Syakudo,
Y., Masaki, S., Kuroda, K., Oku-uchi, N., and Senda, M. �2005�. “Differ-ence in vocal tract shape between upright and supine postures: Observa-tion by an open-type MRI scanner,” Acoust. Sci. & Tech. 5, 465–468.
Kollia, H. B., Gracco, V. L., and Harris, K. S. �1995�. “Articulatory organi-zation of mandibular, labial, and velar movements during speech,” J.Acoust. Soc. Am. 98�3�, 1313–1324.
Macmillan, N. A., Kingston, J., Thorburn, R., Walsh Dickey, L., and Bar-tels, C. �1999�. “Integrality of nasalization and F . II. Basic sensitivity and
1J. Acoust. Soc. Am., Vol. 123, No. 4, April 2008 A. Serrurier an
phonetic labeling measure distinct sensory and decision-rule interactions,”J. Acoust. Soc. Am. 106�5�, 2913–2932.
Maeda, S. �1982�. “The role of the sinus cavities in the production of nasalvowels,” In Proceedings of the IEEE International Conference on Acous-tics, Speech and Signal Processing, Paris, France, pp. 911–914.
Maeda, S. �1993�. “Acoustics of vowel nasalization and articulatory shifts inFrench nasal vowels,” In Phonetics and Phonology. Nasals, nasalizationand the velum �Academic, New York�, pp. 147–167.
Matsumura, M., Niikawa, T., Shimizu, K., Hashimoto, Y., and Morita, T.�1994�. “Measurement of 3D shapes of vocal tract, dental crown and nasalcavity using MRI: Vowels and fricatives,” In Proceedings of the 3rd In-ternational Conference on Spoken Language Processing, Yokohama, Ja-pan, Vol. 2, pp. 619–622.
Matsumura, M., and Sugiura, A. �1992�. “Modeling of 3-dimensional vocaltract shapes obtained by magnetic resonance imaging for speech synthe-sis,” In Proceedings of the 2nd International Conference on Spoken Lan-guage Processing, Banff, Canada, pp. 425–428.
Mermelstein, P. �1973�. “Articulatory model for study of speech produc-tion,” J. Acoust. Soc. Am. 53, 1070–1082.
Rossato, S., Badin, P., and Bouaouni, F. �2003�. “Velar movements inFrench: An articulatory and acoustical analysis of coarticulation,” In Pro-ceedings of the 15th International Congress of Phonetic Sciences, editedby M.-J. Solé, D. Recasens, and J. Romero, Barcelona, Spain, pp. 3141–3144.
Serrurier, A., and Badin, P. �2005a�. “A three-dimensional linear articulatorymodel of velum based on MRI data,” In Interspeech’2005 - Eurospeech -9th European Conference on Speech Communication and Technology, Lis-bon, Portugal, pp. 2161–2164.
Serrurier, A., and Badin, P. �2005b�. “Towards a 3D articulatory model ofvelum based on MRI and CT images,” ZAS Papers in Linguistics, Speechproduction and perception: Experimental analyses and models, edited bySusanne Fuchs, Pascal Perrier and Bernd Pompino-Marschall, Vol. 40, pp.195–211.
Story, B. H., Titze, I. R., and Hoffman, E. A. �1996�. “Vocal tract areafunctions from Magnetic Resonance Imaging,” J. Acoust. Soc. Am.100�1�, 537–554.
Sundberg, J., Johansson, C., Wilbr, H., and Ytterbergh, C. �1987�. “Fromsagittal distance to area. A study of transverse, vocal tract cross-sectionalarea,” Phonetica 44, 76–90.
Takemoto, H., Kitamura, T., Nishimoto, H., and Honda, K. �2004�. “Amethod of teeth superimposition on MRI data for accurate measurement ofvocal tract shape and dimensions,” Acoust. Sci. & Tech. 25, 468–474.
Teixeira, A., Moutinho, L. C., and Coimbra, R. L. �2003�. “Production,acoustic and perceptual studies on European Portuguese nasal vowelsheight,” In Proceedings of the 15th International Congress of PhoneticSciences, edited by M.-J. Solé, D. Recasens, and J. Romero, Barcelona,Spain, pp. 3033–3036.
Teixeira, A., Vaz, F., Moutinho, L., and Coimbra, R. L. �2001�. “ArticulorySynthesis of Portuguese,” In III Encontro do Forum International de In-vestigadores Portugueses �Institut EETA, Aveiro, Portugal�.
Tiede, M. K., Masaki, S., and Vatikiotis-Bateson, E. �2000�. “Contrasts inspeech articulation observed in sitting and supine conditions,” In Proceed-ings of the 5th Seminar on Speech Production: Models and Data &CREST Workshop on Models of Speech Production: Motor Planning andArticulatory Modelling, Kloster Seeon, Germany, pp. 25–28.
Wrench, A. A. �1999�. “An investigation of sagittal velar movement and itscorrelation with lip, tongue and jaw movement,” In Proceedings of the14th International Congress of Phonetic Sciences edited by J. J. Ohala, Y.Hasegawa, M. Ohala, D. Granville, and A. C. Bailey, San Francisco, pp.2259–2262.
Zemlin, W. R. �1968�. Speech and Hearing Science-Anatomy and Physiol-ogy �Prentice-Hall, NJ�.
d P. Badin: Three-dimensional articulatory modeling of velum 2355