a three-dimensional multivariate image processing technique for the
TRANSCRIPT
BioMed CentralBMC Medical Imaging
ss
Open AcceResearch articleA three-dimensional multivariate image processing technique for the analysis of FTIR spectroscopic images of multiple tissue sectionsBayden R Wood*1, Keith R Bambery1, Corey J Evans2, Michael A Quinn3 and Don McNaughton1Address: 1Centre for Biospectroscopy and School of Chemistry, Monash University, 3800 Victoria, Australia, 2Department of Chemistry, University of Leicester, Leicester, LE1 7RH, UK and 3Department of Obstetrics and Gynaecology, Royal Women's Hospital, Grattan St. Parkville, 3052, Victoria, Australia Sciences, Monash University, 3800 Victoria, Australia
Email: Bayden R Wood* - [email protected]; Keith R Bambery - [email protected]; Corey J Evans - [email protected]; Michael A Quinn - [email protected]; Don McNaughton - [email protected]
* Corresponding author
AbstractBackground: Three-dimensional (3D) multivariate Fourier Transform Infrared (FTIR) image mapsof tissue sections are presented. A villoglandular adenocarcinoma from a cervical biopsy with anumber of interesting anatomical features was used as a model system to demonstrate the efficacyof the technique.
Methods: Four FTIR images recorded using a focal plane array detector of adjacent tissue sectionswere stitched together using a MATLAB® routine and placed in a single data matrix for multivariateanalysis using Cytospec™. Unsupervised Hierarchical Cluster Analysis (UHCA) was performedsimultaneously on all 4 sections and 4 clusters plotted. The four UHCA maps were then stackedtogether and interpolated with a box function using SCIRun software.
Results: The resultant 3D-images can be rotated in three-dimensions, sliced and made semi-transparent to view the internal structure of the tissue block. A number of anatomical andhistopathological features including connective tissue, red blood cells, inflammatory exudate andglandular cells could be identified in the cluster maps and correlated with Hematoxylin & Eosinstained sections. The mean extracted spectra from individual clusters provide macromolecularinformation on tissue components.
Conclusion: 3D-multivariate imaging provides a new avenue to study the shape and penetrationof important anatomical and histopathological features based on the underlying macromolecularchemistry and therefore has clear potential in biology and medicine.
BackgroundThe ability to generate and manipulate three-dimensional(3D) images of body parts or tissue sections is extremelyuseful in determining the extent and penetration of dis-
ease or tissue degeneration. Conventional ways of gener-ating such 3D images are Computerized Tomography(CT), Positron Emission Tomography (PET), MagneticResonance Imaging (MRI) and 3D ultrasound. X-ray
Published: 03 October 2006
BMC Medical Imaging 2006, 6:12 doi:10.1186/1471-2342-6-12
Received: 11 July 2006Accepted: 03 October 2006
This article is available from: http://www.biomedcentral.com/1471-2342/6/12
© 2006 Wood et al; licensee BioMed Central Ltd.This is an Open Access article distributed under the terms of the Creative Commons Attribution License (http://creativecommons.org/licenses/by/2.0), which permits unrestricted use, distribution, and reproduction in any medium, provided the original work is properly cited.
Page 1 of 9(page number not for citation purposes)

BMC Medical Imaging 2006, 6:12 http://www.biomedcentral.com/1471-2342/6/12
based techniques are becoming more useful with theincreased contrast available by coupling the techniquewith synchrotron radiation and using phase contrast anddiffraction enhanced imaging. These techniques do notsupply information on the macromolecular compositionin the image contrast, whereas spectroscopy based tech-niques do, and hence 3D IR imaging would provide a use-ful and novel alternative with the advantage of imagecontrast based directly on the underlying macromolecularcomposition. The lack of penetration of mid IR radiationinto tissue precludes real time imaging of whole samplesbut an alternative is to build a composite from 2D imagesof adjacent sections of tissue thus providing a method togauge the extent and penetration of disease, which may beof clinical value. This has the advantage of not requiring achemical or immunological staining protocol to providebiochemical information. High-speed low-cost comput-ers, in combination with infrared imaging instrumentsbased on Focal Plane Array (FPA) detectors, allow theimage acquisition and reconstruction to be achievedwithin a reasonable time frame.
The adaptation of multi-channel infrared array detectorsfrom military hardware to FTIR microscopes in the early1990s resulted in new methodologies to investigate themacromolecular architecture of cells in tissue sections [1].The new generation of FPA and more recently linear arraydetectors are capable of recording thousands of spectra inrapid time. Each pixel is essentially a digital hyper-spectraldata cube containing absorbance, wavenumber and x,yspatial coordinates. Univariate or chemical maps can beplotted based on peak height, integrated areas under spe-cific bands or band ratios. While these maps provide spa-tial information on the distribution and relativeconcentration of the major macromolecules they are notuseful in correlating anatomical and histopathologicalfeatures with corresponding spectral profiles [2]. Multi-variate imaging techniques including Unsupervised Hier-archical Cluster Analysis (UHCA) [2-9], K-meansclustering [8,10], Principal Components Analysis (PCA)[11], Linear Discriminant Analysis [12], Fuzzy C-meansclustering [8,13] and neural networks [11] have proven tobe invaluable in the identification of spectral groups or"clusters" which can be directly compared to stained tis-sue sections. In multivariate methods, the information ofthe entire spectrum can be utilized for the analysis. Thefirst part of the analysis requires a distance matrix to becalculated. This can be achieved using a number of differ-ent algorithms including D-values (Pearson's correlationcoefficient), Euclidean distances, normalized Euclideandistances, Euclidean squared distances and City Block allof which are available in the Cytospec™ software package[14] and appear to produce similar cluster maps althoughthe time taken for each method can vary. We used the D-values method because this is a well-established linear
regression method that is suited to relative concentrationdata. One disadvantage of this algorithm is that it is com-putationally more demanding than others; thereforemore time is required for the distance matrix calculation.
In cluster analysis a measure of similarity is established foreach class of related spectra and a mean characteristicspectrum can be extracted for each class. In the final step,all spectra in a cluster are assigned the same color. In thefalse color maps, the assigned color for each spectral clus-ter is displayed at the coordinates at which each data cubewas collected. The mean spectrum of a cluster representsall spectra in a cluster and can be used for the interpreta-tion of the chemical or biochemical differences betweenclusters. There are also a variety of algorithms to selectfrom to perform cluster analysis, including Ward's algo-rithm, which we employ because it minimizes the hetero-geneity of the clusters.
The high correlation of spectral clusters with anatomicaland histopathological features has been conclusivelydemonstrated for a number of different tissue typesincluding cervical [2,3], breast [10,15], liver [4,7], brain[5], mouth [6], intestine [8,16], skin [17], bone [18,19],cornea [20] and prostate [21]. Hitherto FTIR multivariateimaging has been mainly restricted to the generation of2D cluster maps. The exception is Mendelsohn and cow-orkers [22] who constructed a 3D univariate map of corti-cal bone based on peak ratios from serial two-dimensional sections. By interfacing two types of softwarenamely Cytospec [14] and SCIRun [23] and writing a sim-ple "stitching" algorithm we are able to generate 3D mul-tivariate cluster maps from multiple tissue sections. Theability to visualize 3D FTIR cluster maps provides a newavenue to assess variation in multiple tissue sections andto determine the penetration of histopathological struc-tures based on the underlying macromolecular structureof the diseased tissue.
MethodsFollowing approval from the Royal Women's HospitalResearch and Human Research Ethics Committees andthe Monash University Standing Committee on Ethics inResearch Involving Humans, written, informed preopera-tive consent was obtained from the patient and a cervicaltissue sample exhibiting villoglandular adenocarcinomawas then obtained by cone biopsy. The tissue sample wasthen embedded in a paraffin block and sliced by micro-tome into 4 μm sections. One group of four sections wasmounted on glass slides and stained with the routine his-topathology stain Hematoxylin and Eosin (H&E) for lightmicroscope examination. Hematoxylin has an affinitywith nucleic acids and Eosin has an affinity for the cellularcytoplasm. An adjacent group of four sections was depar-affinized, mounted on Kevley™ "low e" IR reflective
Page 2 of 9(page number not for citation purposes)

BMC Medical Imaging 2006, 6:12 http://www.biomedcentral.com/1471-2342/6/12
microscope slides and imaged with a Varian Stingray FTIRmicroscope system equipped with a 64 × 64 pixel HgCdTeliquid nitrogen cooled FPA with a 15× Cassegrain objec-tive. FTIR hyper-spectral data images were recorded in therange 4000-950 cm-1 at 6 cm-1 resolution and with 16scans co-added. For each of the four sections, step-motioncontrol of the microscope stage was used to construct a 16tile (4 × 4) FTIR image mosaic from FPA recordings col-lected as 16 pixel aggregates. Thus the spatial resolutionobtained is approximately 22 μm per pixel aggregate. EachFTIR image was therefore 2.0 mm2 in area and with thefour 4 μm thick adjacent sections giving a total sampledvolume of 1,400 × 1,400 × 16 μm. A spatial resolution of22 μm per pixel was used as this provided FTIR imagesthat covered an area of tissue large enough to encompassseveral examples of anatomically different tissue types.
Using a MATLAB® routine developed by our group, thefour FTIR images were stitched together side by side (or"unfolded") to give a single large 2D image frame (seeadditional file 1 "cyto4fs.m" a program for stitching mul-tiple tissue sections together for use in Cytospec™ spectro-scopic software). The absorbance was integrated over alarge spectral region (1750-950 cm-1) to assess samplethickness using a routine in Cytospec™. This avoids inac-curacies with too thin samples with low absorbance or toohigh absorbance that result in non-linear detectorresponse. A spectrum is rejected if the determined integra-tion value is higher or lower than a pre-defined threshold(1500 and 50 arbitrary units). Spectra that passed thethickness quality test were converted to second derivativespectra using a Savitsky-Golay algorithm (13 smoothingpoints). UHCA (D-values, Ward's algorithm) was per-formed to generate 4 clusters from second derivative spec-tra over the 1272-950 cm-1 spectral window. The resultantcluster map was then reorganized (or "back folded") intothe four individual 2D cluster maps, each map corre-sponding to one of the FTIR images. The four cluster mapswere saved in an image file format with a unique falsecolor assigned to each cluster and then aligned or "regis-tered" as separate floating layers of a single image in theGIMP [24] image-processing program. This registrationstep is necessary as the sample orientation was not identi-cal in both rotation and translation on each of the fouracquired 2D mosaic images. Proper pixel correspondencefrom one image to another was easily achieved using thismanual approach given the small number of image layers.The registered layers constituted a best fit because someslightly unequal distortion of the tissue matrix wasobserved presumably caused by the sectioning and prepa-ration processes. For this 3D imaging technique, specialcare must be taken to ensure the sections are not stretchedor distorted when deposited onto the slides.
The SCIRun [23] software suite provides a graphical userinterface for rapid development of "networks" of instruc-tion routines for the stacking and rendering of the inputdata (see additional file 2 "SCIRun adenocarcinoma.net"for the 3D image processing program modules and con-figuration parameters for SCIRun). The registered imageswere loaded into SCIRun as a set of indexed integer values(1 to 4 corresponding to each cluster) and then "stacked"into a scalar volume field of cluster values from which the3D cluster maps were rendered.
3D univariate chemical maps depicting a single spectralfeature were also generated. The spectra were vector nor-malized over the 1800-950 cm-1 range and then integratedunder the absorbance band of interest using a trapezoidalbaseline function in Cytospec™. The 3D univariate mapswere rendered from a scalar volume field of absorbancevalues generated from 2D FTIR images stacked in SCIRun.The 3D univariate maps were plotted with a 256 rainbowcolor palette using Gaussian interpolation between thedata grid points to produce a smoothly varying color field.The 3D cluster maps, on the other hand, were plotted in apalette of only 4 false colors and box interpolated, withone false color corresponding to each cluster. Figure 1depicts a schematic of the overall process from spectralacquisition to 3D image reconstruction.
Results and discussionFigure 2 shows a H&E stained 2D cervical section exhibit-ing a relatively rare form of neoplasm known as villoglan-dular adenocarcinoma. The neoplasm is characterized bythe presence of long villous fronds and papillae lined bycolumnar cells with intact cytoplasmic borders and dis-plays minimal atypia. [25] Spherical clusters of cells withsmooth intact communal cytoplasmic rings are also asso-ciated with this condition [25]. The sample makes anideal model for 3D unsupervised hierarchical cluster anal-ysis because it exhibits a variety of anatomical and his-topathological features, including connective tissue, redblood cells, inflammatory exudate and glandular cells.Figure 3a depicts a chemical map generated from all foursections simultaneously by integrating the area under theband in 1275-1190 cm-1 region associated mainly withphosphodiester contributions form nucleic acids. Thechemical maps show a good correlation with morphol-ogy; however, specific correlations with anatomical andhistopathological features cannot be gauged with thisform of processing.
It is necessary to perform UHCA over the entire set of spec-tra collected to fully characterize the range of spectral var-iations through all the tissue sections. Performingseparate UHCA on each individual tissue section wouldgive a different clustering result due to changes (althoughgenerally small) in the biochemical composition between
Page 3 of 9(page number not for citation purposes)

BMC Medical Imaging 2006, 6:12 http://www.biomedcentral.com/1471-2342/6/12
sections. For this reason the images were "stitched"together into a single frame to enable spectral pre-process-ing and UHCA to be performed in Cytospec™ on all spec-tra from all images simultaneously. UHCA was performedon the 1272-950 cm-1 region on second derivative vectornormalized spectra simultaneously on four adjacent sec-
tions and the resultant cluster maps are displayed in figure3b. The cluster maps show a general similarity and suc-cessfully highlight the major anatomical features. Theorange cluster represents red blood cells embedded in thestromal matrix. The light green cluster is predominantlystroma, while the brown is mainly lymphocyte exudates.The blue cluster is predominantly glandular tissue. In tis-sue sections 3 and 4 there is an increase in the area of con-nective tissue (green cluster) relative to glandular tissue(blue cluster) when compared to sections 1 and 2 indicat-ing penetration of the glandular tissue into the connectivelayer.
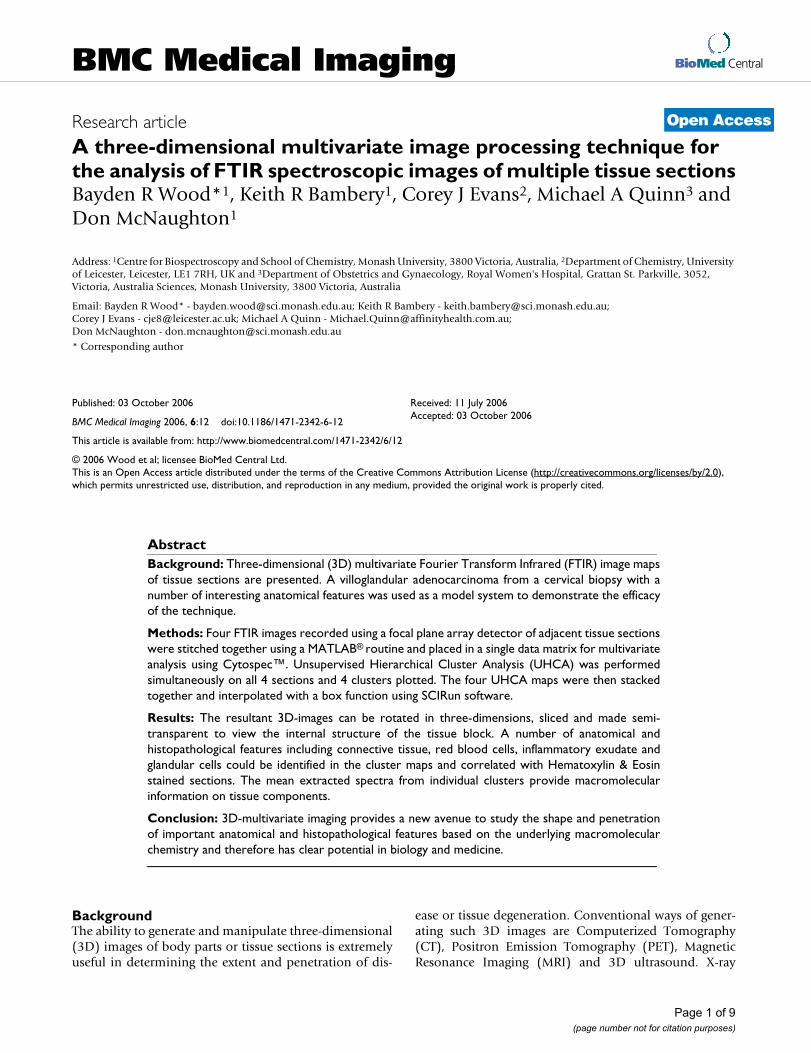
Figure 4 shows the raw and second derivative meanextracted spectra color coded the same as the clusters infigure 3b. The maps and corresponding spectra are verysimilar for each section indicating that the biochemistrybetween the adjacent sections is consistent. The spectraexhibit dramatic changes in the amide I mode both interms of bandwidth and position. The peak center variesfrom approximately 1643 cm-1 to 1659 cm-1. This varia-tion is attributed to physical-chemical changes in the tis-sue matrix. Dramatic variation occurs in areas of thintissue and on the periphery of tissue sections with the netresult a shifting of the amide I mode along with a concom-itant increase in the amide II/amide I ratio. This effect isclearly observed in the mean extracted spectrum from thebrown cluster which shows the amide I mode appearingat 1643 cm-1 and an amide II/amide I ratio that is muchgreater for this spectrum when compared to the otherspectra. Such strong distortions and shifts in band shapewere recently addressed by Romeo et al. [9] who reported
Light micrograph of a labeled H&E stained cervical section exhibiting villoglandular adenocarcinomaFigure 2Light micrograph of a labeled H&E stained cervical section exhibiting villoglandular adenocarcinoma.
Schematic showing steps in the construction of 3D FTIR mul-tivariate imagesFigure 1Schematic showing steps in the construction of 3D FTIR mul-tivariate images.
Page 4 of 9(page number not for citation purposes)

BMC Medical Imaging 2006, 6:12 http://www.biomedcentral.com/1471-2342/6/12
a method to correct for the "dispersion artifact". To mini-mize correlations with physical information the analysiswas carried out using the 1272-950 cm-1 region, whichomits the proteinaceous range (1720-1380 cm-1) that maybe strongly distorted by the dispersion artifact. Spectrafrom lymphocyte exudates and glandular tissue are dom-inated by a band at ~1240 cm-1 which is assigned to theasymmetric phosphodiester stretching vibration ofnucleic acids. This band shows the most variationbetween all 4 mean extracted cluster spectra. The meanextracted spectrum from the stromal areas (light green)has contributions from collagen vibrations although thedistinctive collagen triplet in the 1300-1200 cm-1 cannotbe observed due to infiltration by red blood cells, lym-phocyte exudates and glandular tissue into the connectivelayer.
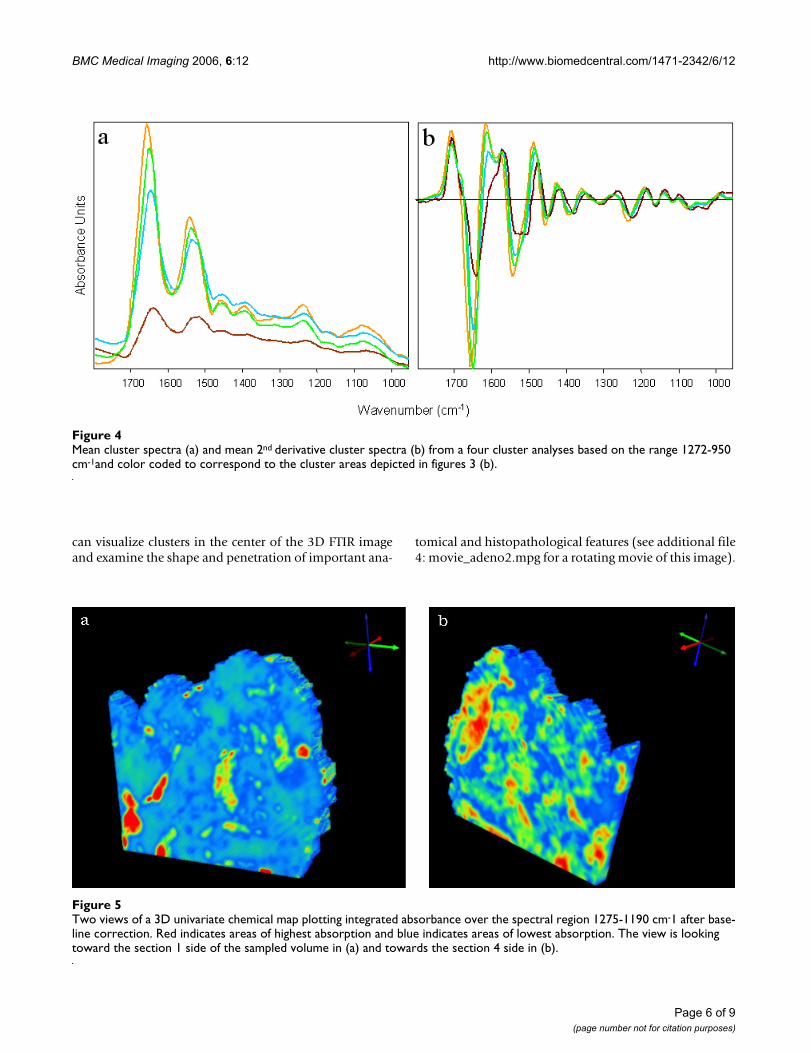
The 3D chemical image constructed from 4 adjacent sec-tions and generated by integrating the area underneaththe peaks in the 1272-950 cm-1 region is presented in fig-ure 5. In figure 5a the image is orientated to show the firstsection of the tissue block (section 1) while in figure 5bthe last section (section 4) is oriented towards the viewer.The darkest orange areas in section 1 (figure 5a) correlatewell with the stroma and glandular tissue while the dark-
est orange area shown in section 4 (figure 5b) is associatedmainly with the stroma.
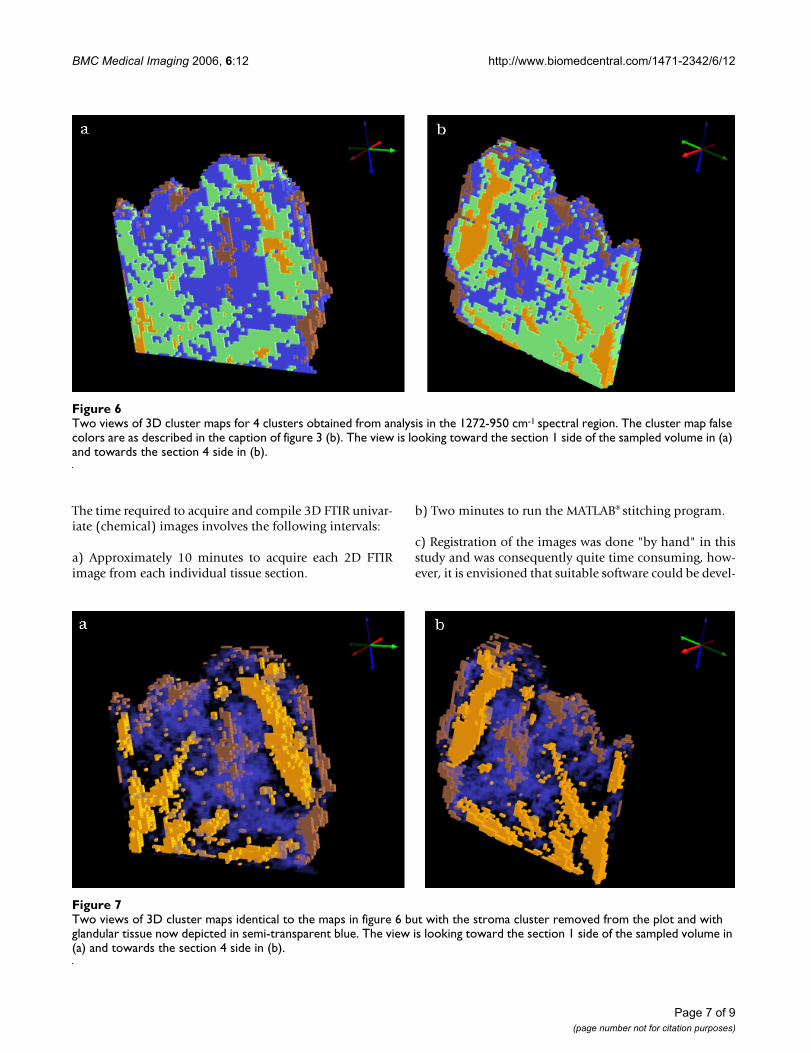
Figure 6 shows a 3D UHCA map performed on the 4 sec-tions simultaneously. The map shows excellent correla-tion with the anatomical and histopathological featuresindicated in figure 2. The cluster colors are the same asthose used in figure 3b. The 3D UHCA map enables oneto visualize the extent of penetration of the anatomicalfeatures and the degree of variation from section to sec-tion (see additional file 3: movie_adeno1.mpg for a rotat-ing movie of this image). Moreover, 3D FTIR multivariateprocessing enables visualization of thick tissue sectionsthat cannot normally be analyzed using conventional midIR spectroscopic techniques due to the limited depth pen-etration of IR radiation. The thin sections (4 μm) requiredfor use with the Kevley slides are less than the thickness ofa single cervical cell consequently multiple sections ena-ble the analysis of whole cells and also minimizes theeffects of orientation artifacts that can arise during tissuesectioning. Individual clusters can be studied by renderingthe image in semi-transparent mode. Figure 7 is identicalto figure 6 but with the stroma cluster removed from theplot and with glandular tissue now depicted in semi-trans-parent blue. By making the image semi transparent one
Hyper-spectral FTIR data processing performed simultaneously on 4 adjacent tissue sections from a cervical biopsy sampleFigure 3Hyper-spectral FTIR data processing performed simultaneously on 4 adjacent tissue sections from a cervical biopsy sample. The numbers 1 through 4 identify the individual sections in the figure. In (a), a univariate chemical image obtained from the integrating the area under the 1275-1190 cm-1 region after baseline subtraction and in (b), a 4 cluster map derived from analysis over the 1272-950 cm-1 spectral window. The cluster map false color scheme corresponds to brown for exudates, blue for inflamed glandular tissue, green for connective tissue and orange for blood filled capillaries as described in the text.
Page 5 of 9(page number not for citation purposes)
BMC Medical Imaging 2006, 6:12 http://www.biomedcentral.com/1471-2342/6/12
can visualize clusters in the center of the 3D FTIR imageand examine the shape and penetration of important ana-
tomical and histopathological features (see additional file4: movie_adeno2.mpg for a rotating movie of this image).
Two views of a 3D univariate chemical map plotting integrated absorbance over the spectral region 1275-1190 cm-1 after base-line correctionFigure 5Two views of a 3D univariate chemical map plotting integrated absorbance over the spectral region 1275-1190 cm-1 after base-line correction. Red indicates areas of highest absorption and blue indicates areas of lowest absorption. The view is looking toward the section 1 side of the sampled volume in (a) and towards the section 4 side in (b).
Mean cluster spectra (a) and mean 2nd derivative cluster spectra (b) from a four cluster analyses based on the range 1272-950 cm-1and color coded to correspond to the cluster areas depicted in figures 3 (b)Figure 4Mean cluster spectra (a) and mean 2nd derivative cluster spectra (b) from a four cluster analyses based on the range 1272-950 cm-1and color coded to correspond to the cluster areas depicted in figures 3 (b).
Page 6 of 9(page number not for citation purposes)
BMC Medical Imaging 2006, 6:12 http://www.biomedcentral.com/1471-2342/6/12
The time required to acquire and compile 3D FTIR univar-iate (chemical) images involves the following intervals:
a) Approximately 10 minutes to acquire each 2D FTIRimage from each individual tissue section.
b) Two minutes to run the MATLAB® stitching program.
c) Registration of the images was done "by hand" in thisstudy and was consequently quite time consuming, how-ever, it is envisioned that suitable software could be devel-
Two views of 3D cluster maps identical to the maps in figure 6 but with the stroma cluster removed from the plot and with glandular tissue now depicted in semi-transparent blueFigure 7Two views of 3D cluster maps identical to the maps in figure 6 but with the stroma cluster removed from the plot and with glandular tissue now depicted in semi-transparent blue. The view is looking toward the section 1 side of the sampled volume in (a) and towards the section 4 side in (b).
Two views of 3D cluster maps for 4 clusters obtained from analysis in the 1272-950 cm-1 spectral regionFigure 6Two views of 3D cluster maps for 4 clusters obtained from analysis in the 1272-950 cm-1 spectral region. The cluster map false colors are as described in the caption of figure 3 (b). The view is looking toward the section 1 side of the sampled volume in (a) and towards the section 4 side in (b).
Page 7 of 9(page number not for citation purposes)

BMC Medical Imaging 2006, 6:12 http://www.biomedcentral.com/1471-2342/6/12
oped to automate the registration process therebyreducing the time required for this to a few minutes.
d) About 1 minute is required for SCIRun to stack, inter-polate and render a single 3D image frame.
A 3D univariate image could be obtained in less than 1hour from commencement of FTIR scanning if a routinedata-handling pipeline was incorporated. In approxi-mately 1 hour a 3D movie, which are composed of a fewhundred individual 3D image frames can be produced inSCIRun.
The production of 3D UHCA cluster images is a signifi-cantly slower process than generating univariate 3D mapsbecause in addition to the steps delineated above for uni-variate maps UHCA must be performed. UHCA is compu-tationally intensive and requires approximately 2 hours(Pentium 4, 3.4 GHz, Hyper-Threading, 2 Gb RAM) forthe processing of four FTIR images stitched together.Compilation of UHCA 2D maps from large collections oftissue sections would be prohibitively slow for the currenttechnique to have value as a rapid diagnostic tool. We arecurrently testing an artificial neural network alternative toUHCA.
FTIR imaging is resolution limited by diffraction to scaleson the order of a few microns and hence, it is not alwayspossible to unambiguously assign the obtained spectro-scopic information as unique to particular sub-cellularstructures. Nevertheless, FTIR imaging does provide valu-able information on the overall biochemical compositionwhen applied to tissue structures that are larger than a fewmicrons in extent. The multivariate spectroscopic 3D-imaging method described in this work could be readilyadapted for use with other emerging biophotonics tech-niques, most particularly Raman spectroscopic mappingwhich can provide macromolecular information on sub-cellular length scales.
ConclusionThe coupling of vibrational spectroscopy with 3D multi-variate processing greatly extends the capabilities of thistechnology in medical diagnostics. From a biomedicalperspective existing pathological and histochemical pro-tocols depend on sample morphology and visualization.Therefore the ability to maintain spatial integrity in threedimensions while assessing precise spectroscopic dataintrinsic to a tissue sample represents an ideal combina-tion. Three-dimensional multivariate processing providesa new way of visualizing tissue blocks based on the under-lying biochemistry of the tissue matrix and will thereforehave significant application in biology and medicine.
Competing interestsThe author(s) declare that they have no competing inter-ests.
Authors' contributionsBRW conceived of the study, and participated in its designand coordination and helped to draft the manuscript. KBRtook the FTIR measurements and performed the imageconstruction and helped draft the manuscript. CE devel-oped the MATLAB® routine for "stitching" multiple tissuesections. MQ provided the samples and did the histology.DM supervised the project and proof read the manuscript.All authors read and approved the final manuscript.
Additional material
AcknowledgementsThe authors thank Dr Virginia Billson (Royal Women's Hospital, Mel-bourne) for histopathology advice and the National Health and Medical Research Council of Australia for grant support. Dr Wood is funded by an Australian Synchrotron Research Program Fellowship Grant and a Monash Synchrotron Research Fellowship. Mr Finlay Shanks is thanked for instru-mental support and Mr Clyde Riley (Royal Women's Hospital, Melbourne) for sectioning.
References1. Lewis EN, Treado PJ, Reeder RC, Story GM, Dowrey AE, Marcott C,
Levin IW: Fourier transform spectroscopic imaging using aninfrared focal-plane array detector. Anal Chem 1995,67:3377-3381.
Additional File 1Proprietary MATLAB® binary format. Program for stitching multiple tis-sue sections together for use in Cytospec™ spectroscopic software.Click here for file[http://www.biomedcentral.com/content/supplementary/1471-2342-6-12-S1.m]
Additional File 2ASCII network file. File containing the 3D image processing program modules and configuration parameters for SCIRun.Click here for file[http://www.biomedcentral.com/content/supplementary/1471-2342-6-12-S2.net]
Additional File 3MPEG movie. Rotating 3D cluster map of adenocarcinoma cervical tissue sample.Click here for file[http://www.biomedcentral.com/content/supplementary/1471-2342-6-12-S3.mpg]
Additional File 4MPEG movie. Rotating 3D cluster map of adenocarcinoma cervical tissue sample with semi-transparent clusters.Click here for file[http://www.biomedcentral.com/content/supplementary/1471-2342-6-12-S4.mpg]
Page 8 of 9(page number not for citation purposes)

BMC Medical Imaging 2006, 6:12 http://www.biomedcentral.com/1471-2342/6/12
Publish with BioMed Central and every scientist can read your work free of charge
"BioMed Central will be the most significant development for disseminating the results of biomedical research in our lifetime."
Sir Paul Nurse, Cancer Research UK
Your research papers will be:
available free of charge to the entire biomedical community
peer reviewed and published immediately upon acceptance
cited in PubMed and archived on PubMed Central
yours — you keep the copyright
Submit your manuscript here:http://www.biomedcentral.com/info/publishing_adv.asp
BioMedcentral
2. Wood BR, McNaughton D, Chirboga L, Yee H, Diem M: Fouriertransform infrared mapping of the cervical transformationzone, and dysplastic squamous epithelium. Gynecol Oncol 2003,93:59-68.
3. Wood BR, Bambery K, Quinn MA, McNaughton D: Infrared imag-ing of normal and diseased cervical tissue sections - a com-parison of FPA and synchrotron imaging. Proceedings of SPIE-Smart Materials, Nano-, and Micro-Smart Systems 2005, 5651:78-84.
4. Diem M, Chiriboga L, Yee H: Infrared spectroscopy of humancells and tissue. VII. Strategies for analysis of infrared tissuemapping data and applications to liver tissue. Biopolymers(Biospectroscopy) 2000, 57:282-290.
5. Kneipp K, Kneipp H, Corio P: Surface enhanced and normalstokes and anti-Stokes and antistokes Raman spectroscopyof single walled carbon nanotubes. Phys Rev Lett 2000,84:3470-3473.
6. Schultz CP, Mantsch HH: Biochemical imaging and 2D classifi-cation of keratin pearl structures in oral squamous cell car-cinoma. Cell Mol Biol 1998, 44:203-210.
7. Jackson M, Ramjiawan B, Hewko M, Mantsch HH: Infrared micro-scopic functional group mapping and spectral clusteringanalysis of hypercholesteramic rabbit liver. Cell Mol Biol 1998,44:89-98.
8. Lasch P, Haensch W, Naumann D, Diem M: Imaging of colorectaladenocarcinoma using FT-IR microspectroscopy and clusteranaysis. Biochim Biophys Acta 2004, 1688:176-186.
9. Mohlenhoff B, Romeo M, Diem M, Wood BR: Mie-type scatteringand non-Beer-Lambert absorption behaviour of human cellsin infrared micro-spectroscopy. Biophys J 2005, 88:3635-3640.
10. Zhang L, Small GW, Haka AS, Kidder LH, Lewis EN: Classificationof Fourier transform infrared microspectroscopic imagingdata of human breast cells by cluster analysis and artificialneural networks. Appl Spectrosc 2003, 57:14-22.
11. Lasch P, Naumann D: FT-IR microspectroscopic imaging ofhuman carcinoma thin sections based on pattern recogni-tion techniques. Cell Mol Biol 1998, 44:189-202.
12. Mansfield JR, McIntosh K, Crowson AN, Mantsch HH, Jackson M: ALDA-guided search engine for the non-subjective analysis ofinfrared microspectroscopic maps. Appl Spectrosc 1999,53:1323-1330.
13. Mansfield JR, Sowa MG, Scarth GB, Somorjai RL, Mantsch HH: Anal-ysis of spectroscopic imaging data by fuzzy C-means cluster-ing. Anal Chem 1997, 69:3370-3374.
14. Lasch P: CytospecTM. A Matlab based application for infrared imagingsee http://www.cytospec.com for details:.
15. Fabian H, Lasch P, Boese M, Haensch W: Infrared microspectro-scopic imaging of benign breast tumour tissue sections. J MolStruct 2003, 661-662:411-417.
16. Lasch P, Haensch W, Lewis EN, Kidder LH, Naumann D: Character-ization of colorectal adenocarcinoma by spatially resolvedFT-IR microspectroscopy. Appl Spectrosc 2002, 56:1-9.
17. Rerek ME, Moore DJ, Mendelsohn R, Paschalis EP: Infrared micro-spectroscopic imaging of skin. Biophys J 2000, 78:250A.
18. Boskey AL, Mendelsohn R: Infrared analysis of bone in healthand disease. J Biomed Opt 2005, 10:31102.
19. Marcott C, Reeder RC, Paschalis EP, Tatakis DN, Boskey AL, Mendel-sohn R: Infrared microspectroscopic imaging of biomineral-ized tissues using a mercury-cadmium-telluride focal-planearray detector. Cell Mol Biol 1998, 44:109-115.
20. German MJ, Pollock HM, Zhao B, Tobin MJ, Hammiche A, Bentley A,Cooper LJ, Martin FL, Fullwood NJ: Characterization of putativestem cell populations in the cornea using synchrotron infra-red microspectroscopy. Invest Ophthal Vis Sci 2006, 47:2417-2421.
21. German MJ, Hammiche A, Ragavan N, Tobin MJ, Cooper LJ, Matanhe-lia SS, Hindley AC, Nicholson CM, Fullwood NJ, Pollock HM, MartinFL: Infrared spectroscopy with multivariate analysis poten-tially facilitates the segregation of different types of prostatecell. Biophys J 2006, 90:3783–3795.
22. Ou-Yang H, Paschalis EP, Boskey AL, Mendelsohn R: Chemicalstructure-based three-dimensional reconstruction of humancortical bone from two-dimensional infrared images. ApplSpectrosc 2002, 56:419-422.
23. Scientific Computing and Imaging Institute (SCI): SCIRun: A Scien-tific Computing Problem Solving Environment. http://soft-waresciutahedu/scirunhtml 2002.
24. http://www.gimp.org. .
25. Novotny DB, Ferlisi P: Villoglandular adenocarcinoma of thecervix: cytologic presentation. Diag Cytopath 1997, 17:383-387.
Pre-publication historyThe pre-publication history for this paper can be accessedhere:
http://www.biomedcentral.com/1471-2342/6/12/prepub
Page 9 of 9(page number not for citation purposes)