a toll choice probability model application to examine travel demand at express and electronic toll...
TRANSCRIPT
A Toll Choice Probability Model Application to Examine Travel Demand at Express and Electronic Toll Lanes in
Maryland
14th TRB Planning Applications ConferenceMay 5-9, 2013
Columbus, Ohio
BySabyasachee Mishra (University of Memphis)
Birat Pandey (Baltimore Metropolitan Council)
Timothy Welch (University of Maryland)
Charles Baber (Baltimore Metropolitan Council)
Subrat Mahapatra (Maryland State Highway Administration)
Motivation
Enhance existing work
Previous toll diversion models: all-or-nothing path
choice decision
Disaggregate VOT in mode choice and traffic
assignment
Binary choice logit (probabilistic) model
Analytical tool capable of producing detailed tolled
facility use
Better decision support tool
Background
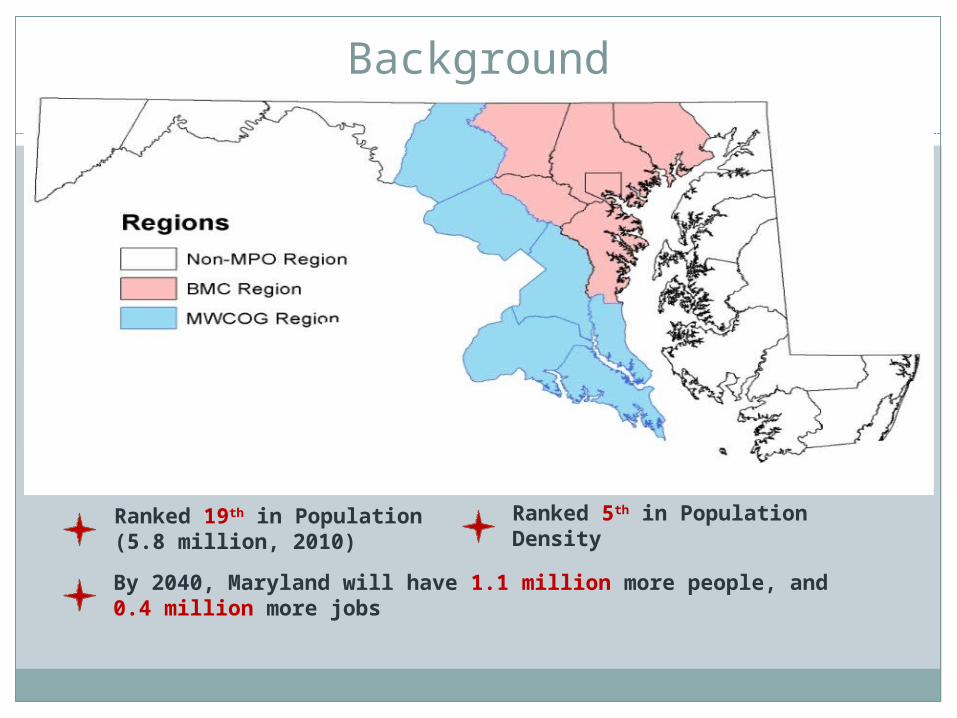
Ranked 19th in Population(5.8 million, 2010)
Ranked 5th in Population Density
By 2040, Maryland will have 1.1 million more people, and 0.4 million more jobs

Agencies Involved
State Counties
MD 24
VA 19
PA 9
WV 8
DE 3
DC 1
Total 64

Toll Facilities

Travel Model Structure
Regional ModelStatewide Model
National/State/MPO Land Use Forecasts
SE Data Reconciliation
Trip Generation
Trip Distribution
Mode Choice
Trip Generation
Trip Distribution
Time of day split
Urban ModelReconciliation
Multiclass Assignment
Disaggregation
TrucksPerson Travel
Flow Estimation
EI/IE/EE tripsEI/IE/EE trips
II trips II trips
PersonLong-Distance Travel Model
NHTS FAF 3
Toll Choice Model Design
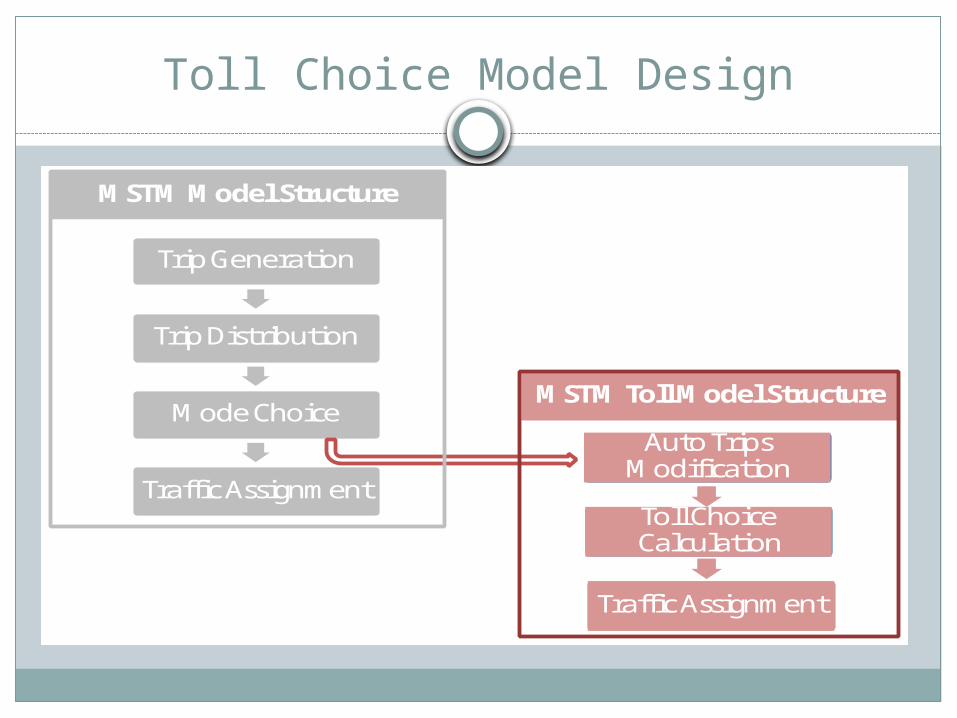
Trip Generation
Trip Distribution
Mode Choice
Traffic Assignment
MSTM Model Structure
Auto TripsModification
Toll Choice Calculation
Traffic Assignment
MSTM Toll Model Structure

Toll Share
Toll Share = 1/ (1 + eα*ΔT + β*Cost/ln(Inc) + c + etcbias) Where e = Base of natural logarithm (ln)
ΔT = time saving between toll road and non-toll road travel, in minutes
Cost = toll cost in dollars
Inc = household annual income (in thousands)
α = time coefficient
β = cost coefficient
c = toll road bias constant
etcbias = bias towards selecting toll routes with ETC payment
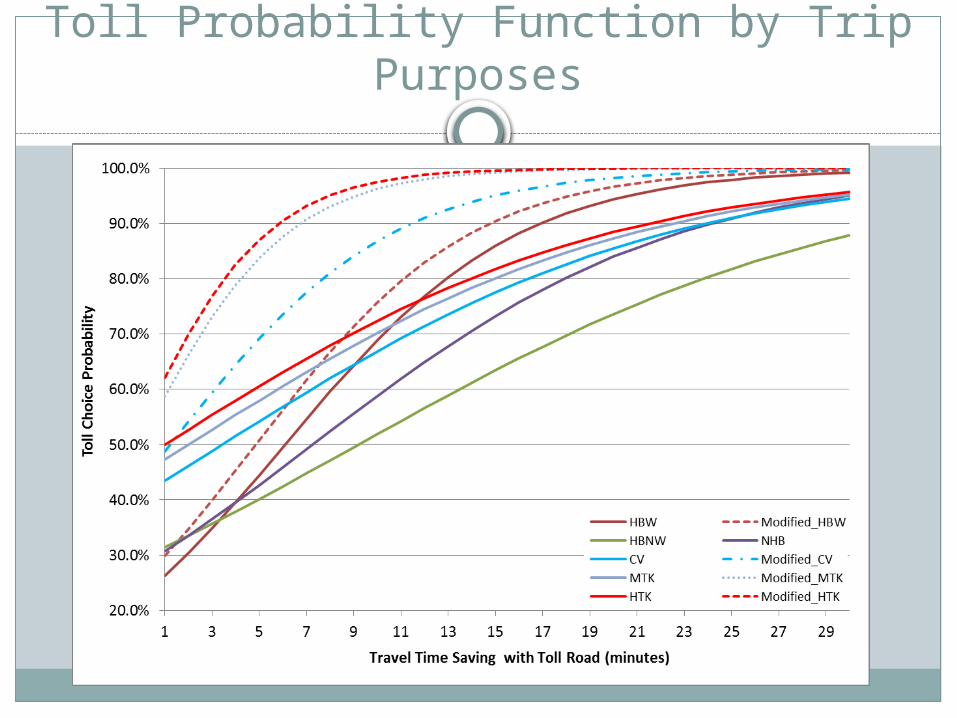
Toll Probability Function by Trip Purposes
Scenarios
Two scenarios are also examined. 20% increase of 2030 50% increase of 2030
Comparison is presented in Toll trip origins Toll trip destinations Elasticity of income classes
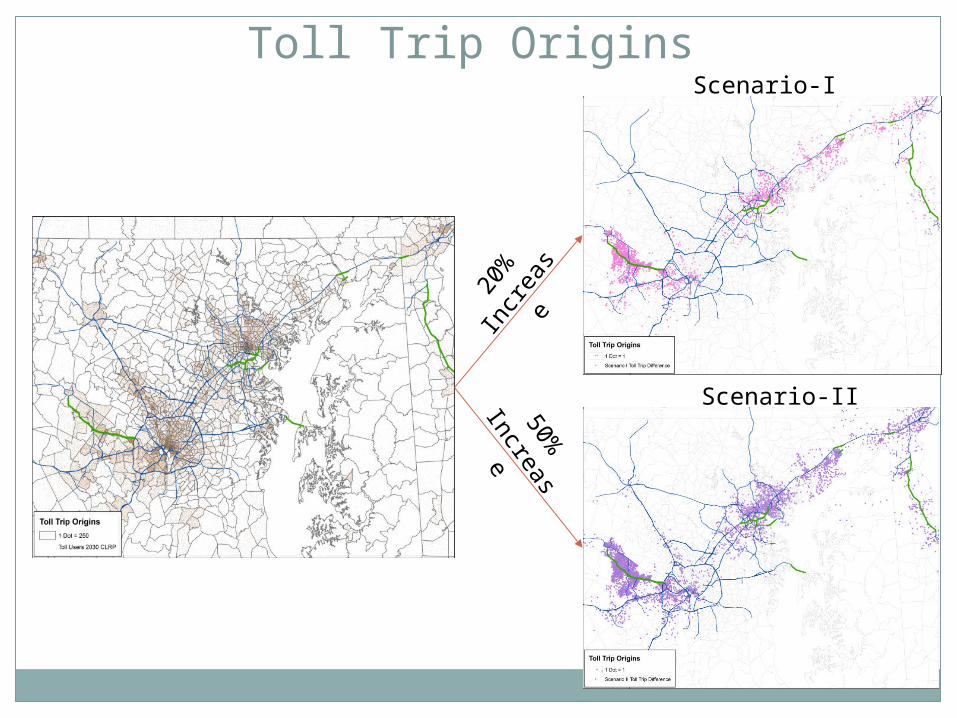
Toll Trip OriginsScenario-I
Scenario-II
20%
In
crea
se
50%
Increas
e

Toll Trip DestinationsScenario-I
Scenario-II
20%
In
crea
se
50%
Increas
e

Demand Elasticity
Income Quintile
Volume Class Quartile Lower Lower-middle Middle Upper-middle Upper
Scenario I INC1 INC2 INC3 INC4 INC5
< 5,000 0.572 0.511 0.534 0.501 0.495
5,000 - 10,000 0.405 0.366 0.449 0.409 0.479
10,000 - 20,000 0.628 0.564 0.430 0.591 0.625
> 20,000 0.538 0.569 0.515 0.640 0.712
Scenario II Lower Lower-middle Middle Upper-middle Upper
< 5,000 0.490 0.451 0.445 0.458 0.479
5,000 - 10,000 0.373 0.333 0.353 0.340 0.364
10,000 - 20,000 0.568 0.511 0.409 0.524 0.544
> 20,000 0.494 0.517 0.483 0.564 0.615

Summary
An enhancement over previous toll diversion models
The proposed model recognizes variations in traveler’s decision to utilize a toll road by incorporating a probabilistic model.
Estimated likely toll road users are assigned to assess the toll traffic as a path choice decision between toll road and non-tolled roads.
The estimated toll traffic on several toll facilities is slightly lower than observed higher sensitivity to toll cost

Thank You
Acknowledgement