a tracer study to evaluate the satisfaction and tracer study to evaluate the satisfaction and ......
TRANSCRIPT


A tracer study to evaluate the satisfaction and employment prospects for graduates of accredited
technical training courses in Timor-Leste

I
Preface
It is a great pleasure for SEPFOPE to present the results of a tracer study that was carried out in September-December 2014. It is the first time that such a study has been commissioned by SEPFOPE. The aim of the study was to assess the results from accredited vocational training programmes, targeting students who graduated in 2012-2013. The tracer study was a collaborative effort between the National Directorate of Vocational Training (DNAFOP), National Labour Force Development Institute (INDMO), and the Department of Labour Market Information (DMIT).
Tracer studies are commonly used by training institutions to get feedback on courses, hear from graduates how training is helping them to develop competencies, and to assess impact from training in terms of job opportunities and continued education for graduates. The 2014 Trace Study surveyed 317 respondents including students who graduated in July 2012 and January 2013.
The report provides a number of interesting findings. SEPFOPE is pleased to note that, overall, graduates found the training courses as relevant and useful in their career development. Generally, the quality of training was rated high. Several graduates after completing their courses have either continued further education or found work. There are, however, areas that graduates have underlined which need improvement. These include more practical sessions combined with theory classes, closer linkages with potential employers, and internships to allow students to gain more work experience.
We expect that in future the number and types of courses delivered will continue to increase. Accredited courses can provide a pathway for students to pursue higher education or enable them to join the labour force with skills and attributes that improves their employability. We hope that in future the number of vocational training graduates who are able to get employment keeps increasing. This will require training providers to work even more closely with private businesses in the country.
Lastly, SEPFOPE would like to thank all the graduates who participated in this survey, training providers for sharing information, Australian Department of Foreign Affairs and Trade, and International Labour Organization for their financial and technical support through the Training and Employment Support Programme (TESP).
Ilidio Ximenes da CostaSecretary of State for Professional Training and Employment Policy

III
Table of Contents
TABLE OF CONTENTS............................................................................................................iii
LIST OF ABBREVIATIONS........................................................................................................v
EXECUTIVE SUMMARY...........................................................................................................vii
1. INTRODUCTION................................................................................................1
1.1 DESIGNING THE STUDY......................................................................................1
2. THE PARTICIPANTS.........................................................................................2
2.1. INDIVIDUAL PROFILE.........................................................................................2
2.2 TRAINING COURSES ATTENDED BY RESPONDENTS......................................4
3. THE TRAINING CENTRE....................................................................................9
4. TRAINING PROGRAM......................................................................................12
4.1 PRACTICAL CLASSES AND INTERNSHIP DURING THE TRAINING...............12
4.2 GRADUATES’ SATISFACTION WITH THE TRAINING COURSES......................15
4.3 EMPLOYMENT & CAREER PROSPECTS POST- TRAINING.............................16
5. EMPLOYMENT AND COMPETENCIES................................................................20
5.1 CURRENT JOB..................................................................................................20
5.2 WORK AND COMPETENCIES............................................................................24
5.3 WORK SATISFACTION AND INTEREST TO WORK ABROAD............................25
6. FURTHER EDUCATION & TRAINING.................................................................29
7. CONCLUSIONS, LESSONS LEARNT & RECOMMENDATIONS...............................31
7.1 Conclusions.......................................................................................................31
7.2. CHALLENGES....................................................................................................31
7.3. LESSONS LEARNT & RECOMMENDATIONS....................................................32


V
List of abbreviations
BAS Business Activity Survey
CEOP District-based Employment and Career Guidance Centers
DFAT Australian Department of Foreign Affairs and Trade
ESS Enterprise & Skills Survey
JICA Japan International Cooperation Agency
DIMT Department of Labour Market Information
IADE Instituto de Apoio ao Desenvolvimento Empresarial
ILO International Labour Organization
INDMO National Labour Force Development Institute
ISIC International Standard of Industry Classification
ISCO International Standard Classification of Occupations
LFS Labour Force Survey
LMI Labour Market Information
SEPFOPE Secretariat of State for Professional Training and Employment
SERVE Serviços de Registo e Verificação Empresarial/ Service for Registration and Verification of Entrepreneurs
TESP Training and Employment Support Project


VII
SUMÁRIU EZEKUTIVU
This 2014 Tracer Study was carried out with the support of the Training and Employment Support Project (TESP) that is funded by the Australian Department of Foreign Affairs (DFAT) and implemented by the Secretariat of State for Professional Training and Employment Policy (SEPFOPE) with technical assistance provided by the International Labour Organization (ILO). The study was undertaken with the following objectives:
• Assess the effectiveness of vocational training courses delivered by accredited training providers;
• Explore the changes in the competencies of graduates;
• Examine the training outcomes in terms of career development of graduates.
The study was designed as a quantitative research which was carried out using a survey with close-ended questions in an interview format. The 317 respondents were selected from the 1,039 graduates of SEFOPE - accredited training centres in Timor Leste, who had graduated between July 2012 and January 2013. The training centres are tertiary level educational centres, offering technical courses in areas ranging from construction, to mechanics, to hospitality and office administration. This Tracer Study survey was conducted from September to December 2014.
Of the 317 total respondents:
• 122 were male and 195 female, between the age of 17 and 45.
• The majority of the respondents (56.15%) were young people aged between 21 and 25.
• They were studying in 11 different training centres in Timor Leste.
• The highest numbers of respondents sampled were graduates from Senai Becora (241) and CT Don Bosco Comoro (162).
• The majority of respondents had undertaken courses in Administration and Finance (43.85%), Hospitality and Tourism (23.66%), Construction (6.94%), Informatics (6.31%). 93.35% respondents were senior high school graduates.
• Respondents chose to attend these training courses instead of long term education (degree or diploma) due to their financial situation (56.59%), desire to take short formal education (11.58%), and family matters (9.65%).
VIII
The Tracer Study shows that the respondents were generally satisfied with the training centres, the program, and the competencies achieved from the training.
• 76.26% of the respondents reported Training Centres provided sufficient learning resources.
• The majority of the respondents, 79.37%, reported being “very satisfied” with the program, whilst 80.63% of respondents were “very satisfied” with their training centre.
• Just over half of the respondents, 56.96%, believed that their competencies developed as a result of the courses were “very high”, while 34.49% believed their competencies were “high”. Most respondents maintained contact and had good relationship with the training centres after graduation.
• The majority of respondents (75.39%) said equal time was allocated between practical classes and theoretical learning.
• Just over half of the respondents, 54.11%, reported receiving 4-8 hours / week of practical lessons, 20.25% of the respondents received 17-20 hours per week.
• Just over half, or 50.53%, of the respondents undertook one internship, while 40.93% of the respondents had two internships.
After the completion of the training, graduates were relatively successful in being called for job interviews and employment. Most graduates (87.62%) applied for jobs.
• In the year following their graduation, 45.65% of the respondents who applied for jobs obtained jobs, while 47.83% of applicants obtained an interview.
• 55.95% of those employed graduates had a 1 year contract, while 20.24% had permanent jobs. The majority of employed graduates (75.58%) had full-time job (40 hours /week) while 23.26% worked part-time (20 - 40 hours/ week).
• Up to two or more years after graduation, when this study was conducted 86 of 317 respondents (27.13%) were still employed ;
• Most employed graduates worked for private companies (47.06%) whereas 35.29% worked for government offices.
• Most respondents worked in the field of administration and finance (52.94%) and 22.35% of them worked in the field of hospitality.
• Graduates who are currently working believed they needed to take further training or studies in order to improve their competences, develop their career, gain a higher salary, or to work abroad.
• Respondents wanted to undertake further training in the following areas: Administration (34.66%), Finance (12.35%), IT (11.55%), and other programs. The major reasons for wanting to undertake further training or education was to improve graduates’ competence (94.78%).

1
1. INTRODUCTION
1.1 Designing the Study
The tracer study was conducted in 2014 in order to investigate the following:
1. Assess the effectiveness of vocational training courses delivered by accredited training providers;
2. Explore the changes in the competencies of graduates;
3. Examine the training outcomes in terms of career development of graduates.
The Tracer Study was carried out with the support of the Training and Employment Support Project (TESP) that is funded by the Australian Department of Foreign Affairs (DFAT) and implemented by the Secretariat of State for Professional Training and Employment Policy (SEPFOPE) with technical assistance provided by the International Labour Organization (ILO).
The study was designed as a quantitative research which was carried out using a survey with close-ended questions in an interview format. The 317 respondents were selected from the 1,039 graduates of SEFOPE - accredited training centres in Timor Leste, who had graduated between July 2012 and January 2013.
From the 1,039 graduates, 317 graduates participated in this study, thus giving a representative sample of 30.51% of the total graduate population. Graduates were selected through simple random sampling. Interviews were carried out with an aid of a questionnaire that had 85 close-ended questions.
Data was taken from eleven training centres, spread out in Dili and surrounding districts in Timor-Leste. Unfortunately, the number of graduates who agreed to participate in the survey were not proportionally distributed across all the training centres. However, this sample is still considered to be broadly representative of all 11 Training Centres. The research interviews were conducted in two months from September to October 2014. Data analysis was conducted from November to December 2014.

2
2. THE PARTICIPANTS
This section consists of two sub-sections, namely individual profile and academic background.
2.1. Individual Profile
Most of the respondents, or 61.51%, were females and 38.49% of them were males.
The majority of the respondents (64.99%) were aged between 17 – 30 years, whilst youth aged 21 to 25 years old comprised 56.15% of the respondents, 19.87% of the respondents were between 36 to 40 years old. Only 2.52% of them were aged between 17 to 20 years old.
The majority of respondents took entry level Certificate 1 (50.63%) with a large number taking the more advanced Certificate 2 (40.82%). Most students were enrolled in one of the four courses: Administration and Finance (43.85%), Hospitality and Tourism (23.66%), Construction (6.94%), Informatics (6.31%). The father of most of the respondent had not completed primary school (48.26%), whilst 66.46% of respondents’ mothers had not completed primary school.
Figure 1
Figure 2
3
Figure 3
Figure 4 Figure 5
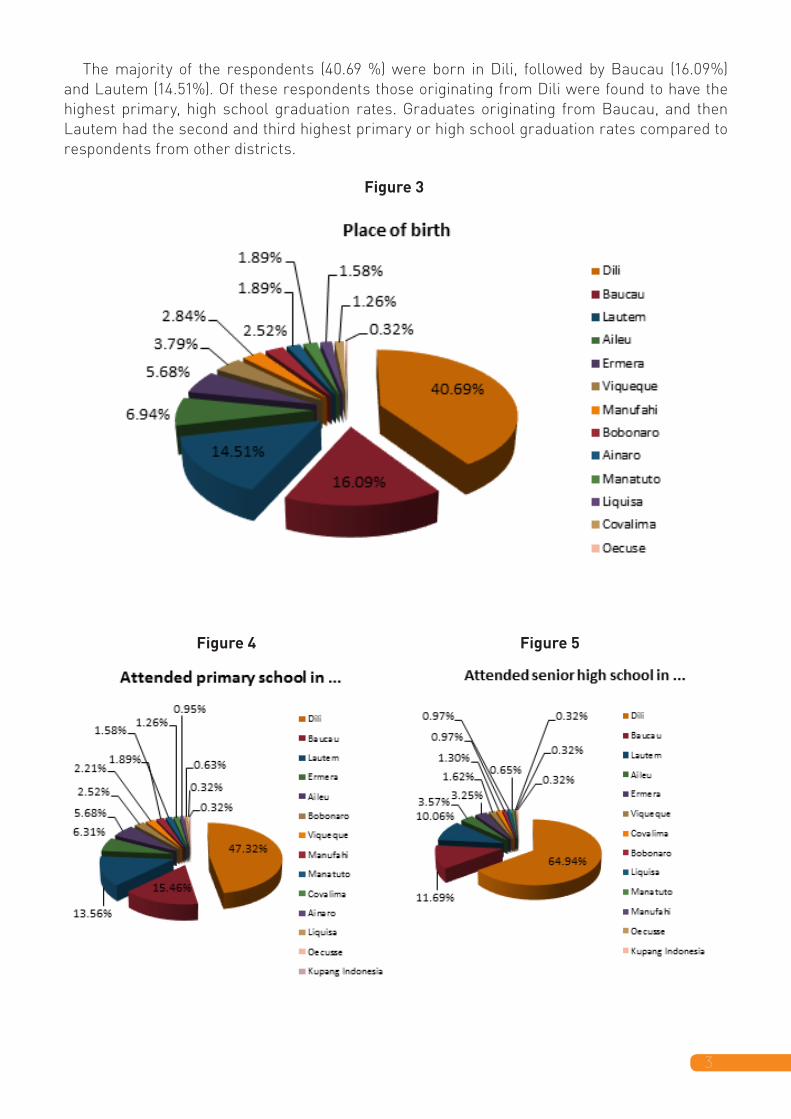
The majority of the respondents (40.69 %) were born in Dili, followed by Baucau (16.09%) and Lautem (14.51%). Of these respondents those originating from Dili were found to have the highest primary, high school graduation rates. Graduates originating from Baucau, and then Lautem had the second and third highest primary or high school graduation rates compared to respondents from other districts.

4
2.2 Training courses attended by respondents
The 317 respondents came from 11 different training centres, with eight of the eleven based in the capital, Dili, or the outskirts of Dili: Senai Becora, STV Bairo Pite, STV Camea, STV Comoro, Centru Visaun Foin-sae’, Secretaria do Magadelena Morano Fuiloro, CNEFP Tibar, CT Dom Bosco Comoro.
The highest number of respondents surveyed were those who had undertaken courses at Don Bosco (19.87%) in Dili, followed by those who trained at Senai Becora, Dili (19.56%), and CTVFS (18.61%). Those who got trained in Tibar were just 0.32% of the total respondents.
Table 1 shows the number of graduates and the proportion of graduates from each of the 11 training providers. The highest number of graduates were from Senai Becora (241 graduates) followed by CT Don Bosco Comoro (162 graduates) and STVJ Camea (116 graduates) while the lowest number of graduates were from STVJ Manatuto (20 graduates) and CTID Canossa Baucau (20 graduates). However, the highest proportion of respondents were from Centru Vizaun Fonsa’e – Dili (56.19%).
Figure 6

5
Respondents of the study were those graduating in the academic year of 2012 – 2013- graduating in either June 2012, or January 2013. Graduates from the two terms were almost equal in number: 53.63% graduated in January 2013 and 46.37% graduated in June 2012.
Respondents took training programs in four different types of qualification. Most respondents took Certificate I (50.63%), followed by Certificate 2 (40.82%). Only a few took Foundation (7.91%) and Certificate 3 (0.063%).
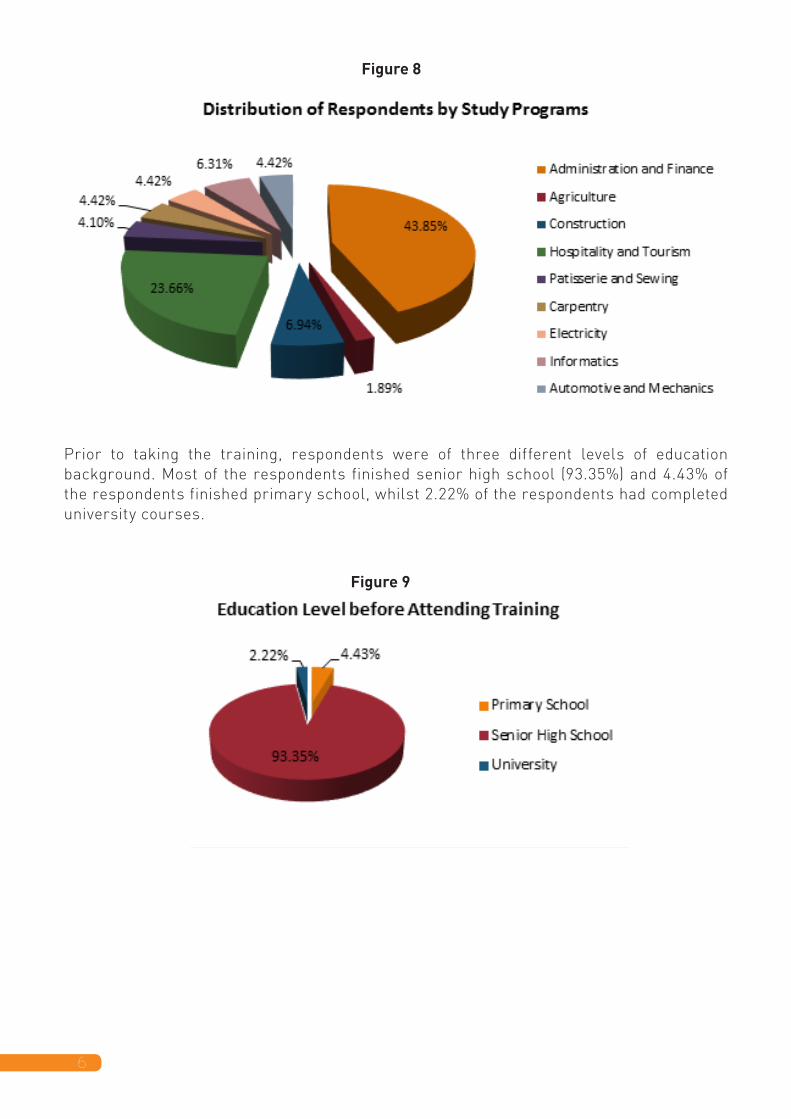
A number of different training programs were offered. Respondents chose the programs based on their interests and the assistance provided by the staff from the Training Centres. The majority of respondents (43.85%) were Administration and Finance course graduates, the second highest number of respondents (23.66%) were graduates of the Hospitality and Tourism program. The third highest number of respondents (6.94%) were Construction graduates, followed by Informatics graduates (6.31%), Automotive & Mechanics graduates (4.42%) and the Electricity graduates (4.42%). However, as mentioned above, there was an over-sampling of Administration and Finance and Hospitality and Tourism graduates, which included a higher percentage of females.
Table 1
Figure 7
Graduates Respondents Percentage
241 62 25.73%
97 32 32.99%
116 37 31.90%
SENAI BECORA
STVJ BairoPite
STVJ Camea
STVJ Comoro
STVJ Manatuto
CentruVizaunFonsa'e– Dili
Secretaria do Magdalena Morano Fuiloro
CNEFP Tibar Ciclo
CT Don Bosco Comoro
CTID Canossa Baucau
STVJ Gleno
47
20
105
56
77
162
20
98
1039
15
9
59
26
1
63
9
4
317
31.91%
45.00%
56.19%
46.43%
1.30%
38.89%
45.00%
4.08%
6
Prior to taking the training, respondents were of three different levels of education background. Most of the respondents finished senior high school (93.35%) and 4.43% of the respondents finished primary school, whilst 2.22% of the respondents had completed university courses.
Figure 8
Figure 9

7
Eight respondents reported they were working while attending the training. One third, or 33%, of respondents worked as security guards, another third, or 33%, worked in electricity installation, 17% worked handling incoming and outgoing mails, and the other 17% worked as waiters. The majority of respondents, or 57.14%, worked in an occupation different to the technical area in which they received training while for the remaining 42.86% their previous occupation was related to the course they undertook.
Respondents gave several different reasons for undertaking technical training courses instead of taking a diploma or higher degree programs. The majority of the respondents, or 56.59%, said their financial condition influenced their decision to undertake a technical course, whilst 11.58% of respondents said they wanted to gain experience outside of formal education, while 9.65 % of respondents reported their family did not allow respondents to take diploma or higher education, and another 8.68% reported not being interested to take diploma or higher programs (8.68%).
Figure 10
Figure11
• TO IHA FIGURE 10

8
Of the respondents who cited financial reasons for not undertaking formal education, 59.66% were female and 40.31% were male. A significant majority, or 76.67%, of those who could not continue formal education due to family reasons were females, while only 23.33% were male. This gender difference suggests that many families do not prioritize the education of young females as much as males in the family. This is most likely owing to widespread perceptions in Timors-Leste that women’s primary role is in the home.
Figure 12

9
3. The Training Centre
Several questions were addressed regarding the training centres. These questions included graduates’ opinion about the quality of learning resources, the adequacy of the practical facilities, the assistance provided by the staff of the training centre in helping graduates choose training courses, and the relation between the training centres and the graduates. Almost all of the respondents (317) responded to these questions.
There was “strong agreement” among the majority of the respondents (55.06%) regarding the quality and adequacy of learning resources provided by training centres such as books, manuals and internet connection. Graduates from Don Bosco (48 respondents) and Senai Becora (41 respondents), expressed the highest levels of satisfaction compared to other Training Centres. However in STVJ Comoro, not many respondents agreed that there were sufficient learning resources. A portion of respondents (13.29%) said they did not agree or disagree that their Training Centre had sufficient learning resources, giving a ‘neutral’ opinion.
Figure 13

10
SENAI BECORA
STVJ BairoPite
STVJ Camea
STVJ Comoro
Santa Isabel Canossa
CTVFS
Secretaria do magdale
Tibar
Don Bosco
CTID Canossa Baucau
STVJ Gleno
Total
Strongly
disagreeDisagree
Strongly
agreeNeutral Agree Total
0
0
0
00
3 3
3
0
0
8
8
0
0
0 0
0
0
0
0
0
4
41
1
1
1
11
2
2
2 2
9
9
9
4
4
1
15 41 62
32
37
15
9
59
25
1
63
9
4
316
19
19
18
2
6
6
12 16
171
1
1
24 42 67 174
48
5
2
4
Training Centres and Sufficiency of Learning Resources
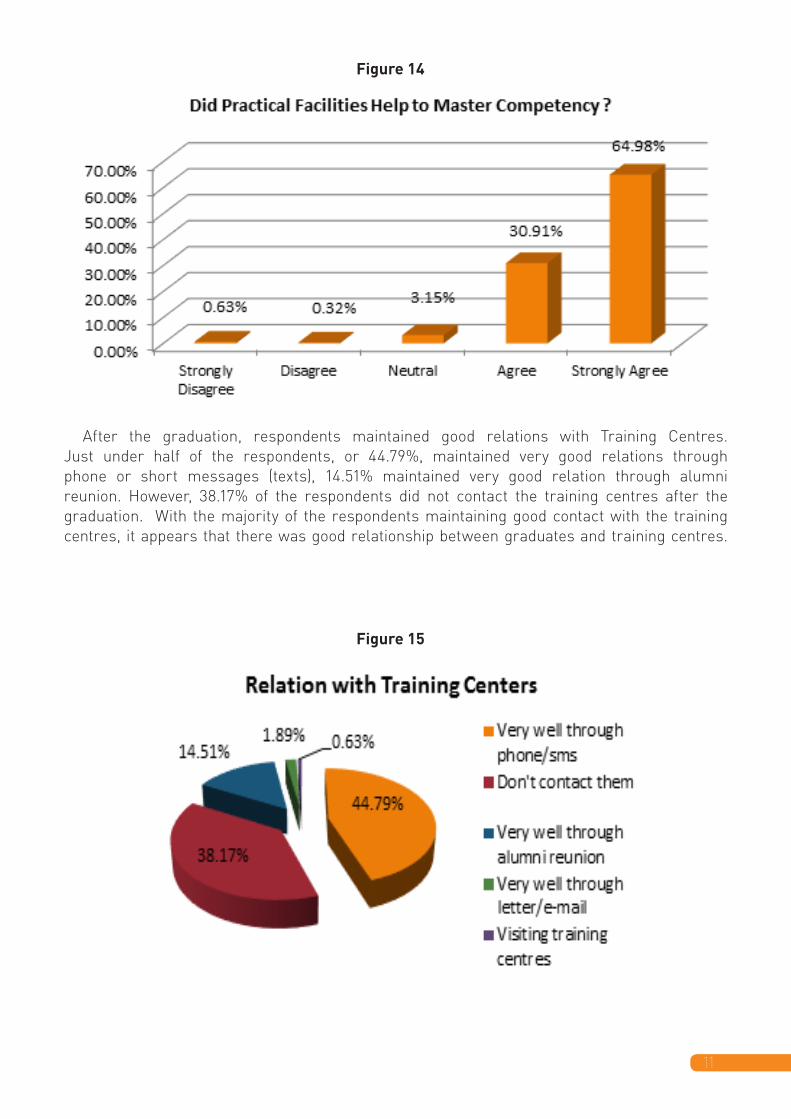
Generally, graduates thought training centres provided adequate and satisfactory practical facilities and this were believed to help students to master competency. Most respondents or 95.8% either “strongly agreed” (64.98%) or “agreed” (30.91%) with the statement that the practical facilities in the training centres helped them to master competencies. Less than 1% of respondents thought the practical facilities in training centres didn’t help them to master competencies.
Tabel 2
11
After the graduation, respondents maintained good relations with Training Centres. Just under half of the respondents, or 44.79%, maintained very good relations through phone or short messages (texts), 14.51% maintained very good relation through alumni reunion. However, 38.17% of the respondents did not contact the training centres after the graduation. With the majority of the respondents maintaining good contact with the training centres, it appears that there was good relationship between graduates and training centres.
Figure 14
Figure 15

12
Figure 16
4. TRAINING PROGRAM
This section consists of several subsections related to training programs. These include practical classes and internship during the training, graduates’ satisfaction of the program, and graduates’ situation after graduation.
4.1 Practical Classes and Internship during the Training
During the training, trainees were provided with in-class activities as well as practical classes. The proportion of practical classes and in-class activities varied, as reported by students. Most respondents (54.11%) claimed they attended 4-8 hours of practical classes per week, while 20.25% of them attended 17-20 hours of practical classes per week. Only 1.58% of the respondents attended 13-16 hours of practical classes per week.
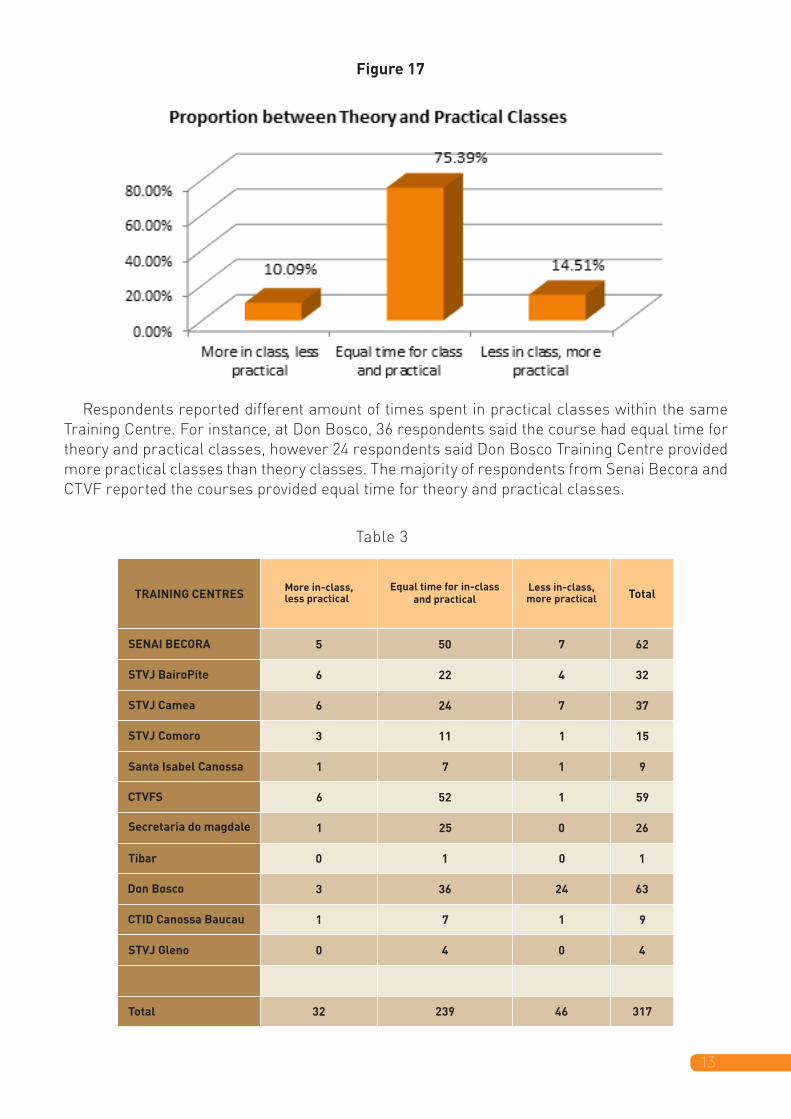
The proportion of practical and theory classes offered by training centres varied. Most respondents claimed that all training centres provided equal time for theory and practical classes.
13
Respondents reported different amount of times spent in practical classes within the same Training Centre. For instance, at Don Bosco, 36 respondents said the course had equal time for theory and practical classes, however 24 respondents said Don Bosco Training Centre provided more practical classes than theory classes. The majority of respondents from Senai Becora and CTVF reported the courses provided equal time for theory and practical classes.
Figure 17
Table 3
SENAI BECORA
STVJ BairoPite
STVJ Camea
STVJ Comoro
Santa Isabel Canossa
CTVFS
Secretaria do magdale
Tibar
Don Bosco
CTID Canossa Baucau
STVJ Gleno
Total
Total
5 50 7 62
6 24 7 37
3 36 24 63
1 7 1 9
0 4 0 4
6 22 4 32
3 11 1 15
1 7 1 9
6 52 1 59
1 25 0 26
0 1 0 1
32 239 46 317
TRAINING CENTRESMore in-class, less practical
Equal time for in-classand practical
Less in-class,more practical
14
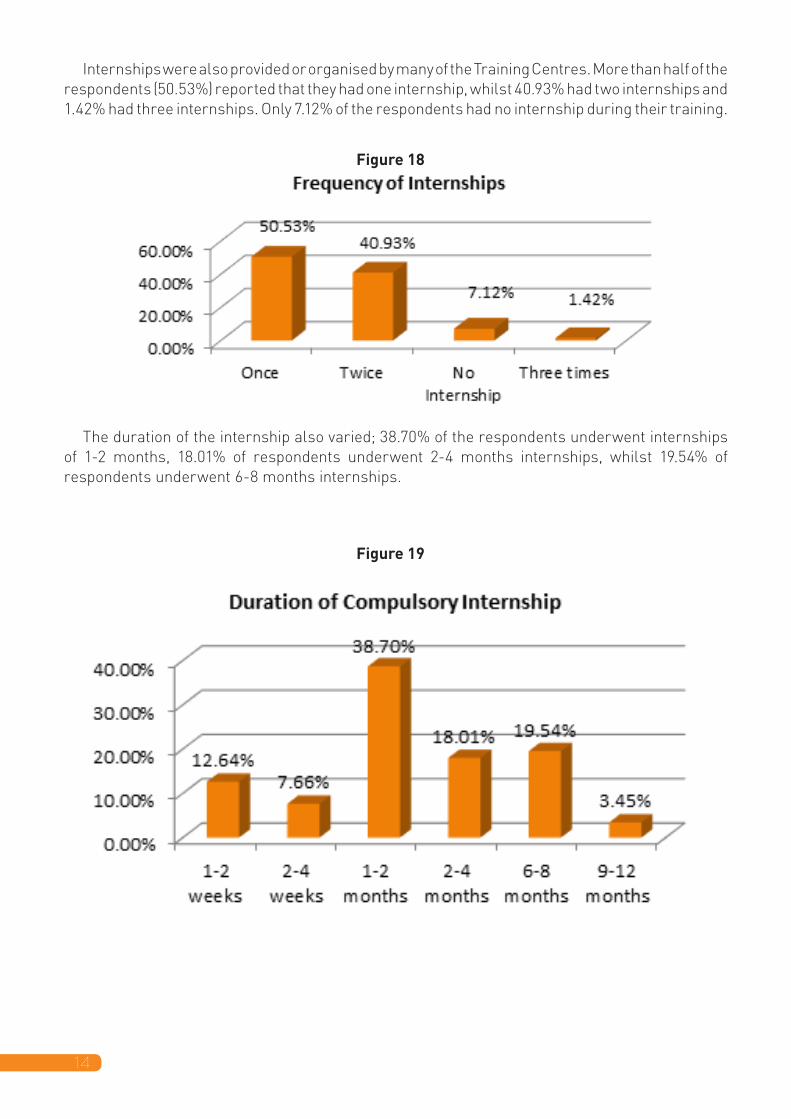
Internships were also provided or organised by many of the Training Centres. More than half of the respondents (50.53%) reported that they had one internship, whilst 40.93% had two internships and 1.42% had three internships. Only 7.12% of the respondents had no internship during their training.
The duration of the internship also varied; 38.70% of the respondents underwent internships of 1-2 months, 18.01% of respondents underwent 2-4 months internships, whilst 19.54% of respondents underwent 6-8 months internships.
Figure 18
Figure 19
15
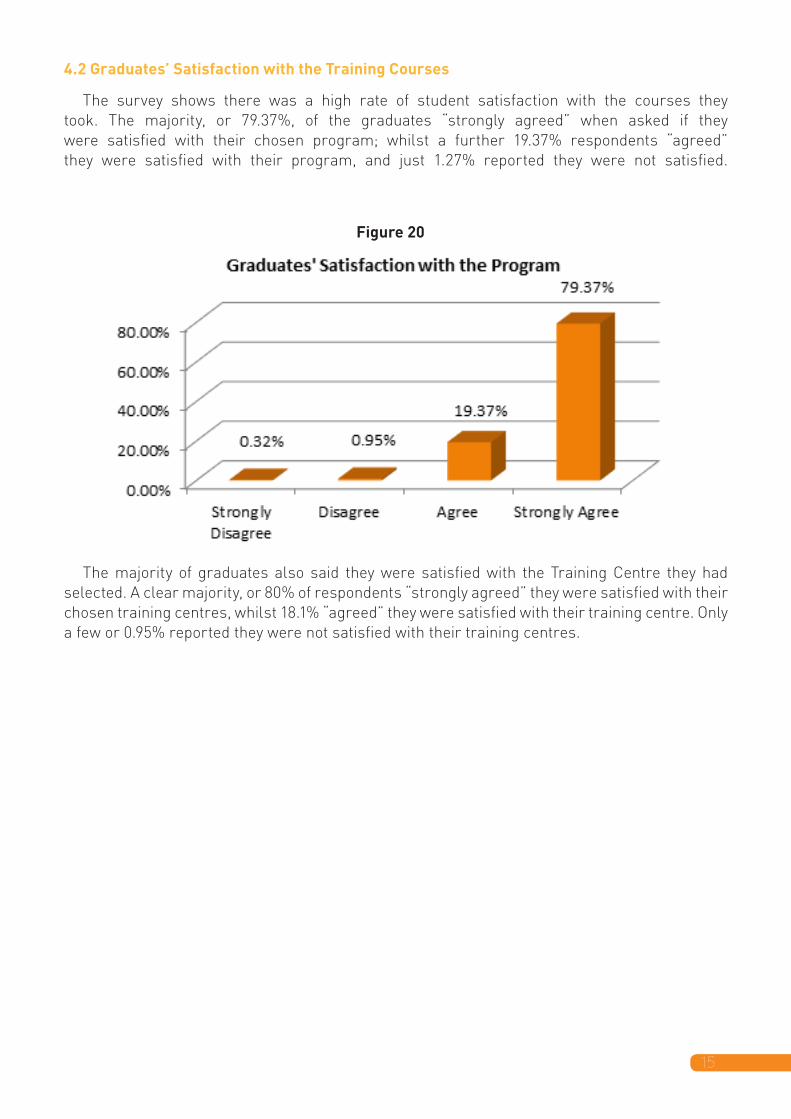
4.2 Graduates’ Satisfaction with the Training Courses
The survey shows there was a high rate of student satisfaction with the courses they took. The majority, or 79.37%, of the graduates “strongly agreed” when asked if they were satisfied with their chosen program; whilst a further 19.37% respondents “agreed” they were satisfied with their program, and just 1.27% reported they were not satisfied.
The majority of graduates also said they were satisfied with the Training Centre they had selected. A clear majority, or 80% of respondents “strongly agreed” they were satisfied with their chosen training centres, whilst 18.1% “agreed” they were satisfied with their training centre. Only a few or 0.95% reported they were not satisfied with their training centres.
Figure 20
16
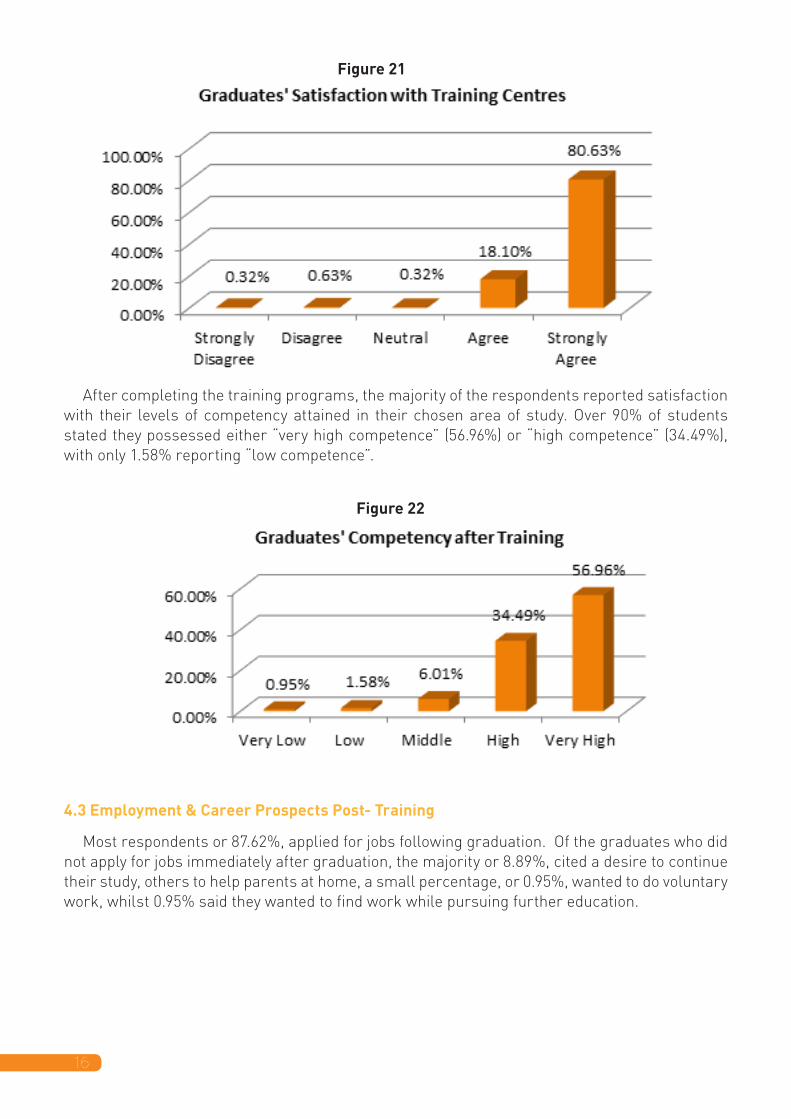
After completing the training programs, the majority of the respondents reported satisfaction with their levels of competency attained in their chosen area of study. Over 90% of students stated they possessed either “very high competence” (56.96%) or “high competence” (34.49%), with only 1.58% reporting “low competence”.
4.3 Employment & Career Prospects Post- Training
Most respondents or 87.62%, applied for jobs following graduation. Of the graduates who did not apply for jobs immediately after graduation, the majority or 8.89%, cited a desire to continue their study, others to help parents at home, a small percentage, or 0.95%, wanted to do voluntary work, whilst 0.95% said they wanted to find work while pursuing further education.
Figure 21
Figure 22

17
Figure 23
Figure 24
The majority of respondents or 57.63 % were able to obtain jobs within the first six months after graduation; 38.14% of respondents obtained jobs within 1-2 month, another 11.02% obtained jobs within three to four months and 8.47% obtained jobs within five to six months. A little under half of the respondents (42.37%) waited for more than 6 months to get a job.
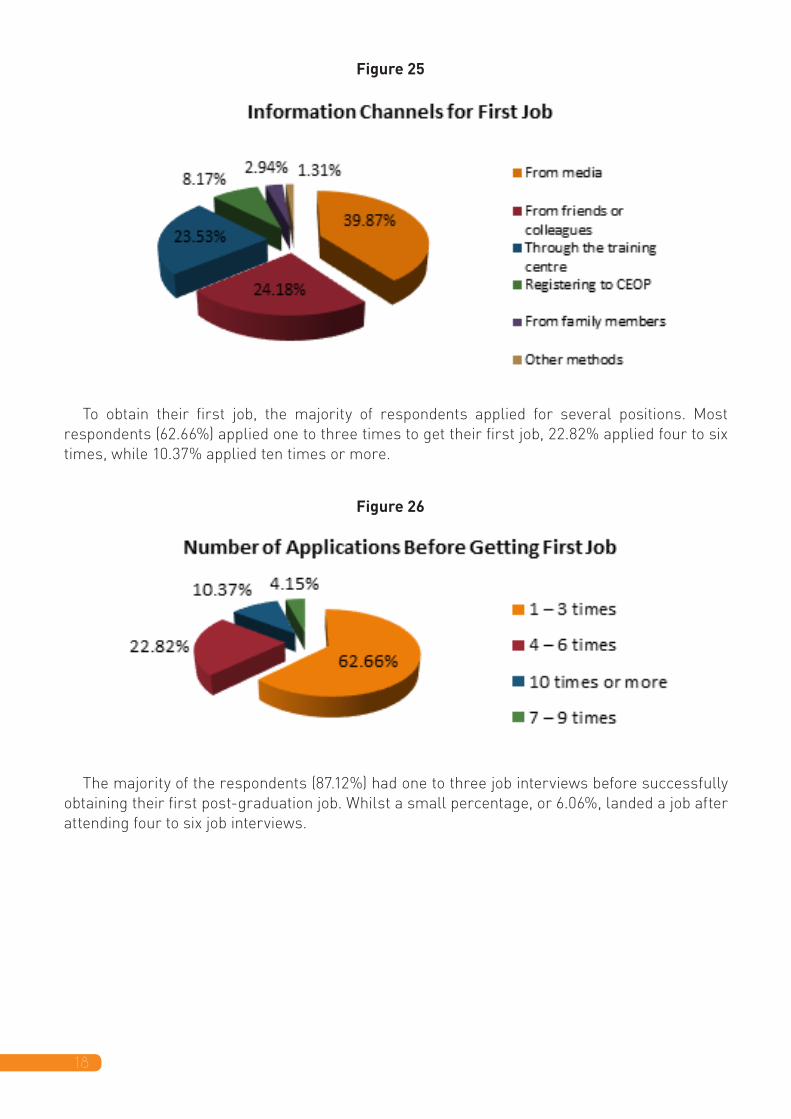
There were several ways respondents heard about job vacancies after graduation; 39.23% heard about the vacancies from media, 23.79% heard about vacancies after registering in a Career Counselling Center (CEOP) and 23.15% heard about vacancies from their Training Centres. Only a few got the information from family members, friends, or in other ways.
18
Figure 25
Figure 26
To obtain their first job, the majority of respondents applied for several positions. Most respondents (62.66%) applied one to three times to get their first job, 22.82% applied four to six times, while 10.37% applied ten times or more.
The majority of the respondents (87.12%) had one to three job interviews before successfully obtaining their first post-graduation job. Whilst a small percentage, or 6.06%, landed a job after attending four to six job interviews.

19
An analysis of job applicants who successfully obtained jobs is presented in the chart below. Almost 90% or 276 respondents (87.62% of all respondents interviewed) applied for jobs, and 132 (47.83%) of the applicants) were called for interviews. A high proportion of those interviewed or 85.45% (126) were able to get a job. Overall, 45.65% from the total who applied for looked for work were able to get a job.
Figure 27
Figure 28
317 Respondents
195 (61.51%) Females 122 (38.49%) Males
276 (87.62% of 315 respondents) applied for jobs
132 (47.83% of applicants) were interviewed
126 (45.65% of applicants) got jobs

20
5. EMPLOYMENT AND COMPETENCIES
This section consists of information regarding employment and competencies of graduates, including current jobs, their professional competencies, work satisfaction, and those who are unemployed. Data for this section was collected by interviewing respondents who were employed at the time of the interview.
5.1 Current Job
Of the 84 respondents currently employed 55.95% had contract work for 1 year; 20.24% had permanent positions, while 17.86% had contracts lasting more than one year. Only 6.02% of the respondents worked voluntarily.
The majority of employed graduates worked full-time (75.58%) working a minimum of 40 hours per week. Just under a quarter, or 23.26%, of respondents worked part-time (20 - 40 hours /week), and only 1.16% worked less than 20 hours per week.
Figure 29

21
Figure 30
Figure 31
Most working graduates or 47.06% worked for private companies, while 35.29% worked for government institutions. Only a few worked for foreign companies, non-government organizations, or public companies.
Using the International Standard Classification of Occupation (ISCO), the current employment of graduates can be categorized as: Clerical Support, Service and Sales, Technical and Associate Professionals, Managers, and Volunteers. A majority of employed graduates, or 86.08%, worked in the field of clerical support, which includes executive assistants and secretaries. The second highest number of graduates, or 7.59% respondents, found work as service and sales workers, followed by managers with 3.80% of respondents, and technicians and associate professionals comprised 1.27% of employed respondents.

22
Some employed graduates received fringe benefits such as accommodation, transportation, health, communication, and so forth. However, the majority of employed graduates (67.09%) did not receive fringe benefits. This could be because the majority had 1-year contracts, and did not have permanent employment. Almost a quarter of employed graduates, or 22.78% of the respondents received transportation benefits, but few graduates received any other kind of benefits such as allowance for communication.
The majority (69.41%) of graduates earned monthly salaries of between $115 and $500, while 30.59% of the respondents earned monthly salaries below $115.
Figure 32
Figure 33

23
The majority (52.94%) of employed graduates worked in administration and finance, whilst 22.35% of the respondents worked in the hospitality sector. Smaller percentages of graduates worked in the field of construction, IT and telecommunication, automotive and electricity, or education and training.
Figure 35
Figure 34

24
5.2 Work and Competencies
Over 80% of respondents believed that the competencies acquired during their training were applicable in their current job. With 70.59% of the respondents reporting they “strongly agreed”, and 14.12% of respondents reporting they “agreed” that their training provided competencies used in their current position .
The majority of the respondents agreed that their current jobs used the skills or matched the training they undertook. About two-thirds, or 66.67% of respondents “strongly agreed” and 17.86% “agreed”, when asked did their current position match their training course. Only 10.71% of the respondents disagreed and 4.76% “strongly disagreed” with the statement that their job matched the skills gained in the training course.
Figure 36
Figure 37
• TO IHA FIGURA 36,, WORD TO IHA TO IHA PAJINA 26

25
Graduates were also asked more specifically, if their training was useful and helpful in their current employment. Almost three-quarters, or 74.39% “strongly agreed”, while 18.29% of the respondents “agreed” with this statement. Thus a total of 92.68% considered the training courses provided useful and helpful skills for their current positions.
Graduates were asked what general competencies they needed in the work place. A majority of respondents mentioned team work (53.49%) and verbal communication (29.07%). Other competencies needed included written communication, work safety, management, problem solving, initiative, technology, and so forth.
5.3 Work Satisfaction and Interest to Work Abroad
A majority of respondents (78.835) were satisfied with their current job, when asked about satisfaction levels, with a majority (54.12%) reporting “high satisfaction” and 24.71% reporting “satisfaction” with their current jobs, while 12.94% of respondents were either “very unsatisfied” or “unsatisfied”.
Figure 38
Figure 39

26
However while expressing satisfaction with their current jobs, when asked if they would change jobs, as many as 62.9% said they would like to find better jobs, whilst 29.03% said they needed to look for other positions as their current contract would expire; 3.23% said they would like to move back to their district, and 3.23% reported they were not happy with the current work (3.23%), and a small percentage, 1.61% of respondents said they were willing to work abroad.
Graduates were asked a separate question about their willingness to work abroad. A majority or over 68% of graduates said they would be willing to work abroad, with 25.53% saying they would “strongly agree” and 33.55% of respondents saying they would “agree” to work abroad. However about one-third or 29.93% of the respondents said they were not interested to work abroad.
Figure 40
Figure 41

27
Interestingly, of the 317 respondents, only 1.63% of the respondents have worked outside Timor-Leste. When respondents were asked about countries where they would like to work, Australia was the preferred destination (38.01%) followed by European countries (27.6%), while Asian and ASEAN countries were ranked as third and fourth respectively as preferred destinations for work.
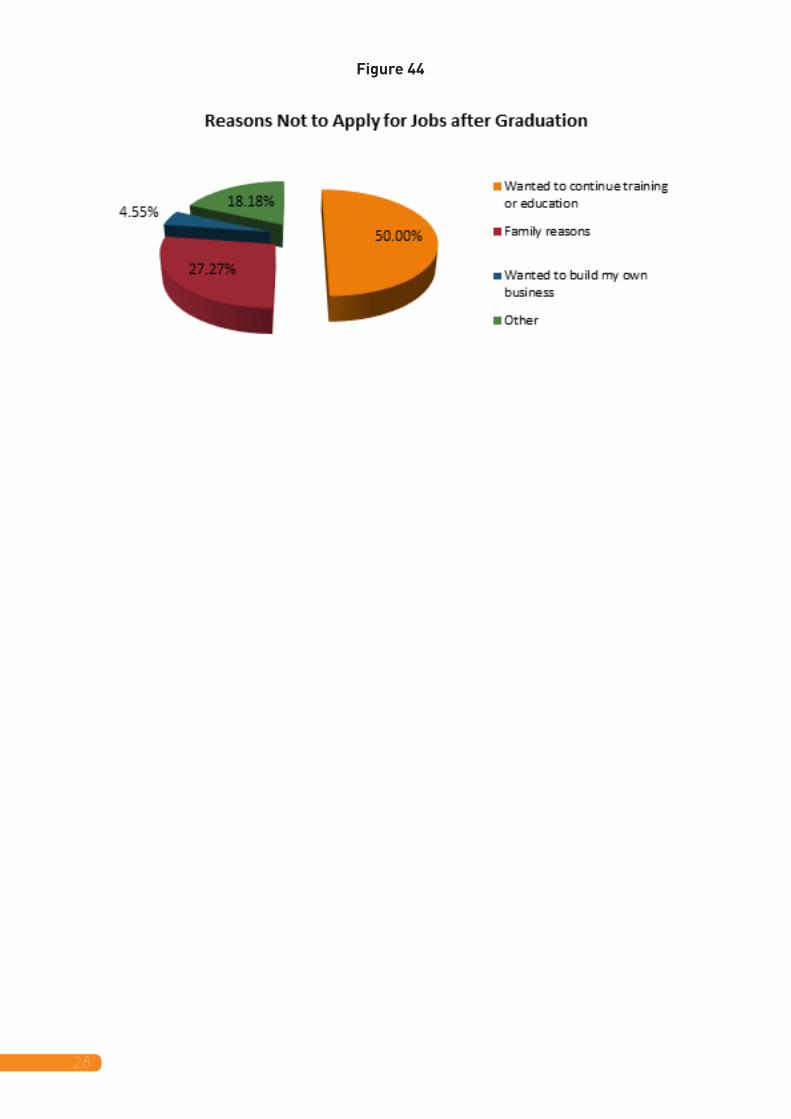
The small percentage of respondents (22 out of 317) who did not apply for jobs were asked to explain why. Half (50%) of this group wanted to continue their education or training, while another 27.27% of the respondents mentioned family responsibilities, and a smaller percentage, or 4.55% wanted to start their own business.
Figure 42
Figure 43
28
Figure 44
29
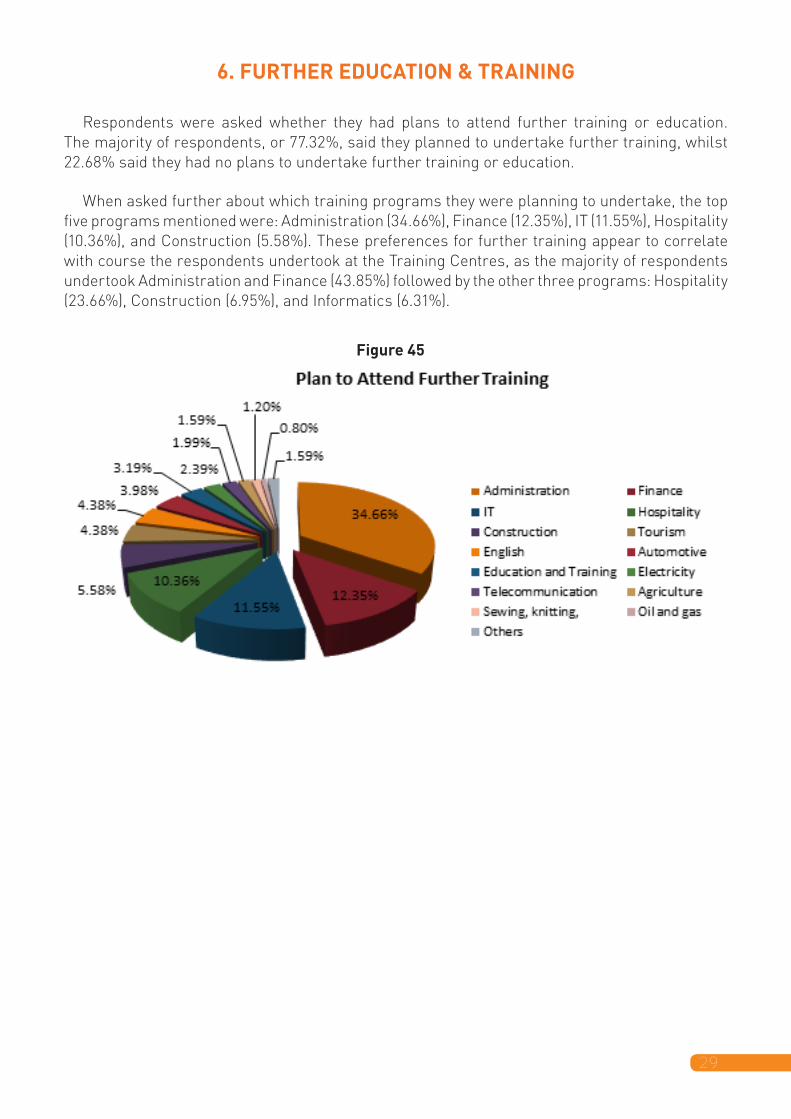
6. FURTHER EDUCATION & TRAINING
Respondents were asked whether they had plans to attend further training or education. The majority of respondents, or 77.32%, said they planned to undertake further training, whilst 22.68% said they had no plans to undertake further training or education.
When asked further about which training programs they were planning to undertake, the top five programs mentioned were: Administration (34.66%), Finance (12.35%), IT (11.55%), Hospitality (10.36%), and Construction (5.58%). These preferences for further training appear to correlate with course the respondents undertook at the Training Centres, as the majority of respondents undertook Administration and Finance (43.85%) followed by the other three programs: Hospitality (23.66%), Construction (6.95%), and Informatics (6.31%).
Figure 45

30
Figure 44
Respondents’ main reason to pursue further study was to improve their competence (94.78%) while a few of the respondents planned to take further study in order to get a promotion (1.61%), to work abroad (1.20%), and to obtain a better salary (1.61%).

31
7. CONCLUSIONS, LESSONS LEARNT & RECOMMENDATIONS
7. 1 Conclusions
• Most of the respondents reported strong satisfaction with the programs they attended as well as the training providers. They were happy with the choice of programs, the learning methods (practical classes and in-class activities), the learning resources, and the facilities provided by the training centres.
• Most respondents believed that their competencies improved after the completion of the training programs, this included respondents who completed foundation, certificate 1, 2, and 3 levels courses. These competencies were found to be suitable with those needed in real work situations. However, many respondents also believed that they needed to take further training or study.
• After the completion of the training, 276 graduates (87.62% of all respondents) applied for jobs and 132 graduates (47.83% of all graduates) got called for interviews, with 95.45% of the graduates who were interviewed (126 graduates) successfully getting jobs. In short, 45.65% of the applicants successfully got jobs after the completion of the training, demonstrating a fairly successful training outcome considering the level of economic development in Timor-Leste.
• Graduates who are currently working believed they needed to take further training or studies in order to get better competencies, improve their career, obtain a higher salary, or to work abroad.
7.2. Challenges
As this was the first tracer study carried out by SEPFOPE, many challenges were faced in planning, implementing, and conducting analysis of the survey data. The first challenge was to introduce to relevant stakeholders within SEPFOPE the concept and benefits of conducting tracer studies. The objective of the tracer study was not only to undertake independent research but also to build capacity in SEPFOPE to conduct similar studies in the future. A working group was established in SEPFOPE with the responsibility of planning, implementing, and analyzing the data. The second challenge was dealing with limited capacity building of members of the working group to plan and implement the study, devising the tools, strategy, and budget for the study.
Conducting a survey targeting graduates is never easy, especially when such a study sets out to interview those who had graduated two years ago. Researchers had difficulties contacting many of the graduates, as their phone numbers had changed. The final challenge was analyzing data with a team who are still learning data management and analysis. This process invariably took longer than expected.

32
7.3. Lessons Learnt & Recommendations
As this tracer study was the first tracer study conducted by SEPFOPE in Timor Leste, there are several lessons which can be useful starting points for any future tracer studies.
1. Future tracer studies should be designed using a shorter, more focused questionnaire. Respondents as well as interviewers can get tired and long questionnaires can also affect the accuracy of responses.
2. Other instruments for data collection such as in-depth interviews or focus group discussion should be considered, as they will complement the existing data and provide for triangulation. If a shorter interview questionnaire is used, then more detailed issues can be explored via focus groups, or in-depth interviews.
3. More time should be allowed for conducting the tracer study in order to obtain more valid and reliable data. In particular more time should be allocated for preparing and testing the data collection instruments. More time should also be allocated for interviewing as many graduates may have changed their contact numbers, or moved to other or districts. An ideal period for the study would be 5 months.
4. Selection of respondents also needs to be conducted more carefully. Considering the large graduate population with different strata (from different socio-economic backgrounds and undertaking different courses areas), stratified random sampling may be a good choice in future, provided information is available. The researchers should consider different approaches to inviting more graduates to participate in the study.
5. The research should also include the Training Centres and companies employing the graduates. The satisfaction of companies with the competences of graduates should also be evaluated. This would allow an objective assessment graduate’s competencies. Responses from “end-users” regarding their expectations and requirement at the work place would further improve training programs. The interviews with employers could be included as a separate module in the Enterprise Skills Surveys (ESS).
Generally, this study demonstrated high levels of satisfaction among graduates with the technical courses offered at the 11 Training Centres surveyed, and with their competencies as a result of the training courses. However, there are a few recommendations on how the Training Centres can further improve their courses, and support they can provide to graduates after the training.
• Training Centres have provided valuable links between employers, and graduates but should continue to act as referral centres for employment linking graduates to employment possibilities, and continue to keep graduates up to date with employment prospects. Training Centres should be able to promote their graduates as well trained, and providing a competitive edge over non-skilled, or informally skilled people looking for jobs.
• Training Centres should provide training in general competencies, in particular team work, management & communication skills, in order to prepare graduates for the world of work.
• Graduates valued internships, and they are a valuable to prepare graduates for work. Thus, if Training Centres can provide more internships for trainees, and longer internships, this would assist in preparing graduates for work.

