a traffic impact analysis - ruidoso · a traffic impact analysis prepared for: conquest ......
TRANSCRIPT

A Traffic Impact Analysis
Prepared for:
Conquest Investments, LLC Alto, NM
Capitan Trading Post
MP 86 US 380
East of Capitan, NM
Prepared by:
Occam Consulting Engineers, Inc. Albuquerque Office
10010 Indian School Rd. NE; Suite 104 Albuquerque, NM 87112
Occam Consulting Engineers, Inc.
Roswell Office 200 E. Fourth St. Suite 100
Roswell, NM 88201

2
2
TABLE OF CONTENTS
I. Introduction………...……………………..…………………………..……….…………………..……………….3 II. Description of Proposed Development…………………………..………………………….…………………..3 III. Study Area Conditions………………………………………...…….……...………………………..………….6 IV. Analysis of Existing Conditions…………………………………...…....……………………………………...6 V. Implementation Year Traffic Analysis…………………...………………….……..…………..……………….7 VI. Unit 1 Traffic Analysis………………………………………………...………………………………………9 VII. Unit 2 Traffic Analysis………………………………………………………………………………………11 VIII. Summary and Recommendations…………………………….……………..………………………..….…..8 IX. Appendix……………………………………………….……………………………….……..………………..14

3
3
TRAFFIC IMPACT ANALYSIS I. Introduction The purpose of this report is to analyze and evaluate the traffic impact a proposed development will have upon the roadway network within the defined study area along US 380 east of Capitan, NM. This report also offers site access recommendations to accommodate the projected traffic in a safe and efficient manner. The project is located within Lincoln County approximately 1/2 mile east of the Village of Capitan and north of US 380. The development is proposed for construction on approximately twenty (20) acres of undeveloped land east of Capitan. The property encompasses two major drainage arroyos that include Magado Creek and a secondary drainage arroyo near the east end of the development. A vicinity map is provided below in Figure 1.
Figure 1. Vicinity Map
II. Description of Proposed Development Land use and intensity The proposed development consists of a new commercial subdivision, called the Capitan Trading Post. Development of the trading post is proposed in two units for a total development area of approximately 20 acres. Development lots are proposed in 1/2 acre sizes. Approximately twelve (12) acres is proposed in Unit 1 (west of Magado Creek) followed by approximately eight and a half (8.5) acres in Unit 2. A site Layout Plan is provided in Figure 2.
NM246
NM48
Project Location North

1
2
3
4
JK
L
M
N
O
PQ
R
ST
a
b
c
d
e
i
iiiii
iv
vi
vii
3

5
5
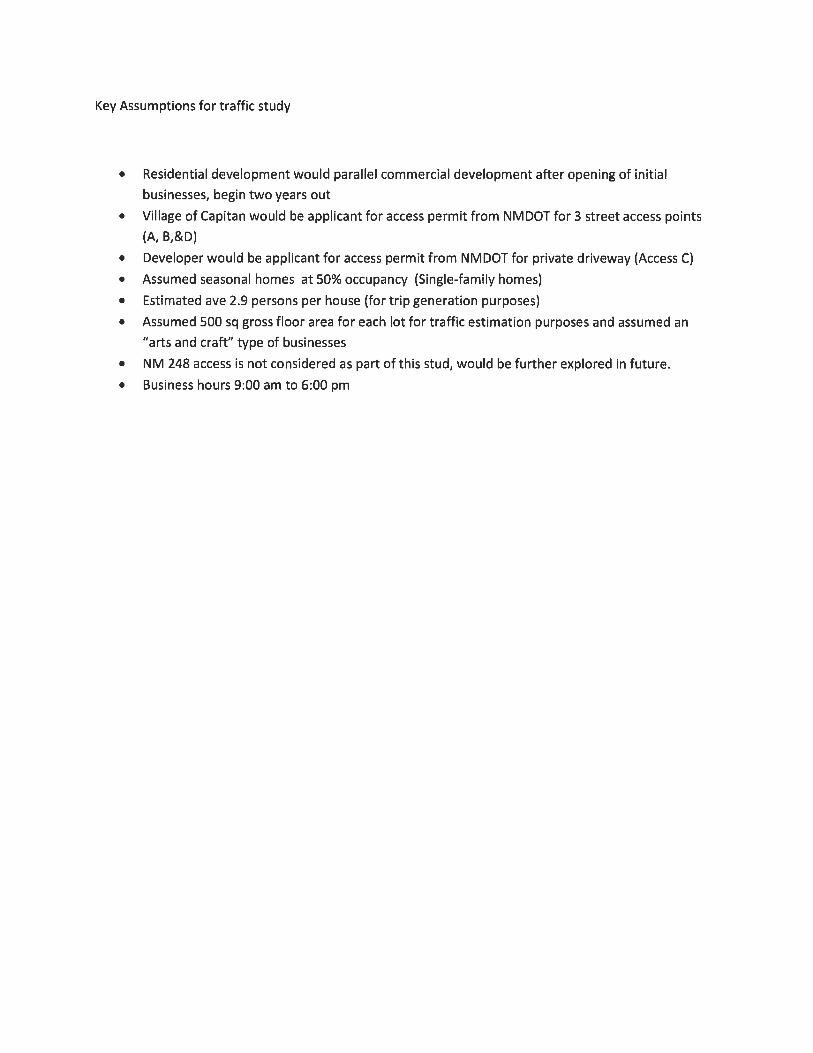
For traffic generation purposes, it is assumed that the type of business would be the equivalent of an arts/craft store and assumes 500 square feet of floor space for each lot. This study also considers traffic projections for future residential north of the subject property. While the residential development is not part of this project, traffic projections are included for it in this study. The residential development plan consists of 400 seasonal homes. Proposed residential access onto US 380 will be internal to the Capitan Trading Post through Heritage Trail and onto US 380 via Creekside Drive, and Rivulet Trail. A second residential access is anticipated in the future onto NM 248 north of Capitan. The location of the second residential access on NM 248 has yet to be determined. Ingress and Egress to the subject development is proposed onto US 380 through four accesses points labeled as Access A, B, C, & D on the site layout plan. Accesses A,B,&D are proposed as public Village of Capitan streets, while Access C is proposed as a shared private driveway to two lots. The proposed assess points are summarized below in Table 1.
Commencement of Unit 1 is scheduled to begin in early 2012 with build-out of this unit to occur over the next fifteen (15) years. Unit 2 is programmed for build-out in Year 16-30, subject to the build-out pace of Unit 1. A residential home development is anticipated in the future, north of the site and north of US 380. Access for the residential development is proposed through two locations. The first access location is on US 380 through the proposed commercial subdivision (Access A & B depicted on the site layout plan). A secondary ingress/egress point is proposed off NM 248 north of Capitan at a yet to be determined location. The vicinity of the residential with respect to this project is shown on Figure 1.
Access Material Width Turning Radii Unit
A (Public) Asphalt Concrete
24 feet 25 feet Unit 1
B (Public) Asphalt Concrete
24 feet 25 feet Unit 1
C (Private) Asphalt Concrete
24 feet 20 feet Unit 2
D (Public) Asphalt Concrete
24 feet 25 feet Unit 2
Table 1. Proposed Access for Development

6
6
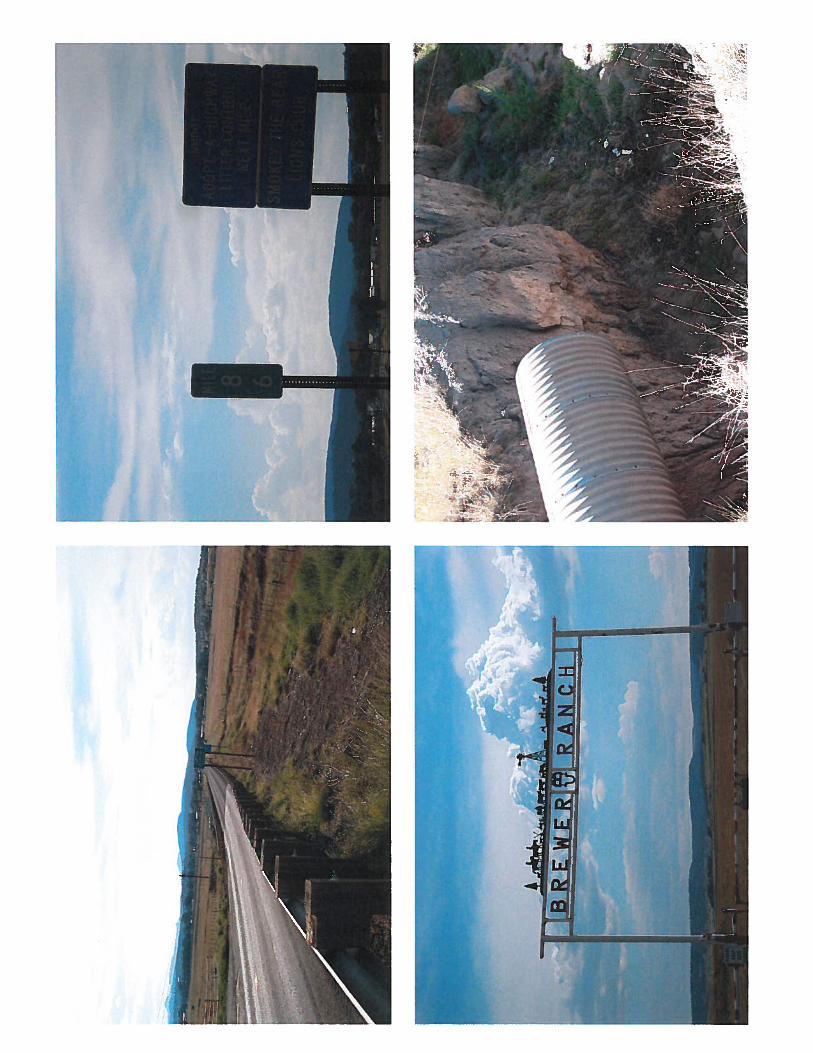
III. Study Area Conditions The area of study for tis development encompasses the site and includes approximately 2500 FT of frontage on US 380. This study includes projected traffic from this future residential north of the development based upon what is known at this time. There are two large drainage arroyos that pass under US 380. Property is currently vacant in the vicinity of the project. The Village is located west of the property. A ranch entrance (Brewer) is located across US 380 south of the proposed development. US 380 is an existing east/west two-lane rural principal arterial route. US 380 is constructed with standard width (12 FT) driving lanes in each travel direction and at the time of this study the roadway is currently being resurfaced. Permanent striping has not been replaced at the time of this study. Existing overhead power poles are located in the vicinity of the project The posted speed limit along US 380 within the study area is 45 mph eastbound and 55 mph westbound leaving the Village. The 45 mph sign (westbound) is located on a portable sign support, implying that this may be a temporary speed limit. The speed limit drops to 40 mph (westbound) as traffic enters the Village. IV. Analysis of Existing Conditions Traffic counts were collected for this study during the AM (morning) and PM (evening ) peak hours on US 380. Traffic data were collected on Thursday, September 1, 2011 on US 380 during the hours from 6:30 am to 9:30 am and from 4:30 pm to 6:30 pm. Daily counts were obtained from the New Mexico Department of Transportation (NMDOT Consolidated Highway Database for the years 2008-2010. The project area is located at Mile Marker 86 (approx.) on US 380 and has an AADT of 1010 in 2010. NMDOT traffic data are included in the appendix. The AM peak hour occurred from 7:00 AM to 8:00 AM, while the PM peak hour
US 380 Eastbound Westbound Total
AM Peak Hour 7:00 am-8:00 am (Directional Distribution
33 vehicles 50%
33 vehicles 50%
66 vehicles 100%
PM Peak Hour 5:15 pm-6:15 pm Directional Distribution
36 vehicles 43%
47 vehicles 57%
83 vehicles 100%
Table 2. Existing Peak Hour Traffic Summary

7
7
occurred from 5:15 PM to 6:15 PM. Traffic was distributed 43% in the eastbound and 57% in the westbound direction during the PM Peak hour. Traffic was evenly distributed in the AM, 50% in the eastbound direction and 50% in the westbound direction. A summary of the existing traffic data is provided in Table 2. Average Daily Traffic (ADT) and detailed traffic count data are provided in the appendix. V. Analysis of Implementation Year Conditions A. Traffic Projections and Analysis Traffic projections were evaluated for the proposed development using the Institute of Transportation Engineers (ITE) Trip Generation Manual (7th Ed). The ITE charts were used to project future development traffic. The ITE Land use code (879) Arts and
EXISTING PM PEAK HOUR TRAFFIC COUNTS 2011 PM Peak Hour 5:15-6:15
US 380 47
36
NORTH
IMPLEMENTATION YEAR PROJECTED PEAK HOUR
US 380 48
37
ACCESS A
Table 3. Trip Generation Projections and Distribution
Development Size PM Peak Hour Trip Ends
Enter WB
Enter EB
Exit WB
Exit EB
Unit 1 (Partial) 1.5 acres (3 lots) 9 2 3 2 2
2 2
3
2

8
8
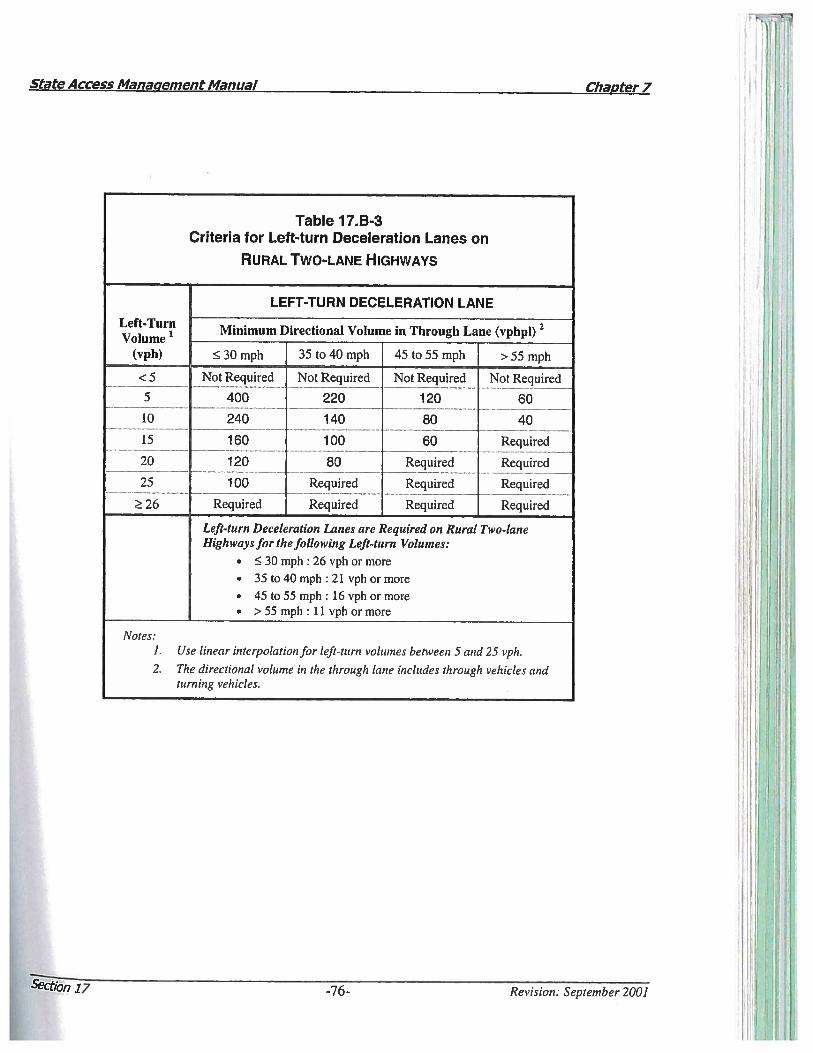
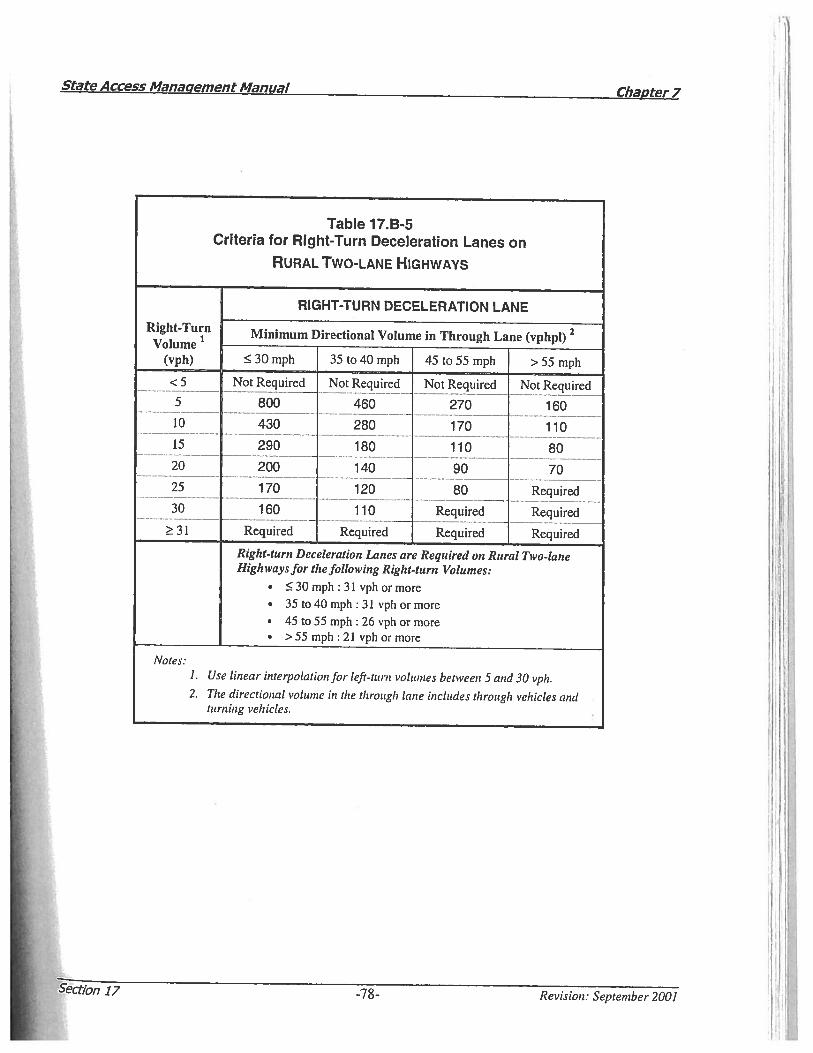
Crafts store charts were used for purposes of the projected trading post traffic. ITE Land Use Code (210) Single-Family Detached Housing charts were used for the residential traffic projections. Copies of the ITE charts are included for reference in the appendix. The peak traffic hour for the development is projected during the PM peak hour. The total project number of “trip ends” are used for analysis purposes. A trip end is defined as either an arrival to the site or a departure from the site. A 50%/50% enter exit traffic distribution was used for the trading post traffic during the peak hour. Residential construction is projected to begin after the implementation year. Therefore no residential traffic is anticipated at opening. The implementation year (opening) is projected to occur two years out in the year 2013. It is assumed that three (3) lots will be developed at the time of opening. The beginning of construction is anticipated for the beginning of 2012 with opening of the first trading post business sometime in 2013. Regular business hours will be from 9:00 am to 6:00 pm. Traffic during the Implementation year will have ingress and egress through Access A. B. Access Design Specifications Speed-change lanes are auxiliary lanes used for acceleration or deceleration between mainline traffic and driveways or intersections. Guidelines for a rural two lane principal route were utilized for both left turn deceleration (eastbound), and right turn deceleration lanes (westbound) for this analysis. Auxiliary lanes warrants are satisfied when the combination of traffic (through traffic) and turning traffic exceed the thresholds found in Table 4: Copies of the access design guideline charts are provided in the appendix.

9
9
Based upon the traffic conditions for the Implementation year conditions, auxiliary lanes are not warranted for Access A on US 380 at implementation. VI. Analysis of Horizon Year Conditions Unit 1 The first unit (west of Magado Creek) is projected for build-out over the next fifteen years. The first phase will contain the build-out of twenty-two lots. It is estimated that approximately 1/2 of the proposed residential lots (200) would be built during Unit 1 and Unit 2. A summary of the Horizon Year Conditions build out (through Unit 2) is provided in Table 5.
Table 4. Auxiliary Lane Warrants (Implementation)
Minimum Left Turning Flow Criteria for to satisfy warrant (55 MPH posted Speed)
Projected Left Turn-ing Flow
Minimum Through
Volume for Left Turn-
ing Warrant
Actual Through
Traffic Vol-ume
Warrant Satisfied?
y/n
5 5 120 45 N
5 5 275 47 N
Minimum Right Turning Flow Criteria for to satisfy warrant (45 MPH posted Speed)
Projected Right Turn-
ing Flow
Minimum Through
Volume for Right turn-ing warrant
Actual through
traffic vol-ume
Warrant Satisfied?
y/n

10
10
Table 5. Trip Generation Projections (Projected number of “trip ends”) during PM Peak Hour for Unit 1
Development Size Traffic Projection Year 15
Commercial Unit 1 12 acres (22 lots) 46% enter-ing/54% exiting
68 31 enter/37 exit
Commercial Unit 2 8 acres (15 lots) 0
North Residential Unit 1 200 Seasonal Homes @ 50% oc-cupancy @ 2.9 persons/home
*0.28 trip ends per person 66% entering/34% exiting
81 53 enter/28 exit
North Residential Unit 2 200 Seasonal Homes @ 50% oc-cupancy @ 2.9 persons/
home*0.28 trip ends per person
0
Totals number of trip ends 149
Total Entering (-3 internal trips est) 84-3=81
Total Exiting (-5 internal trips est) 65-5=60
US 380
22
24
ACCESS A ACCESS B
RESIDENTIAL
8
21
16
25 11
14 60
60
28 53
NORTH
HORIZON YEAR Unit 1 & 2 PROJECTED PEAK HOUR TRAFFIC FLOW 2031
Ingress/egress for Unit 1 will be provided though Access A and Access B. Residential traffic would be provided access from internal streets to the trading post. It is projected that half (1/2) of the trips generated to the trading post will be generated from the residential development. The peak hour traffic diagram below depicts the peak hour traffic during the build out of Unit 1. An analysis was conducted to determine the internal capture rate for the multi-use of

11
11
residential and retail space. The internal capture rate (internal trips) was calculated to be a total reduction of 11 external trips. This detailed analysis (and supporting material) is provided in the appendix. B. Access Design Specifications The warrants for auxiliary lanes for Unit 1 are provided below: Based upon the access design analysis, the projected flows do not warrant auxiliary left turning or right turning deceleration lanes for Unit 1. VII. Analysis of Horizon Year Conditions Unit 2 The Unit 2 analysis considers the full build out of all 37 lots and includes build out of the residential development. The build out timeframe for purposes of this analysis is 30 years. Traffic projections for Unit 2 were based on preliminary lot lines shown on the Site Layout Plan. Table 7 summarizes the development and traffic projections
Table 6. Auxiliary Lane Warrants (Unit 1)
Minimum Left Turning Flow Criteria for to satisfy warrant (55 MPH posted Speed)
Projected Left Turn-ing Flow
Minimum Through
Volume for Left Turn-
ing Warrant
Actual Through
Traffic Vol-ume
Warrant Satisfied?
y/n
25 24 100 60 n
30 25 30 80 n
Minimum Right Turning Flow Criteria for to satisfy warrant (45 MPH posted Speed)
Projected Right Turn-
ing Flow
Minimum Through
Volume for Right turn-ing warrant
Actual through
traffic vol-ume
Warrant Satisfied?
y/n

12
12
Table 7. Trip Generation Projections (Projected number of “trip ends”) Total Build out
Development Size Traffic Projection Year 30
Commercial Unit 1 12 acres (22 lots) 46% entering/54% exiting
68 31 enter/37 exit
Commercial Unit 2 8 acres (15 lots) 46% entering/54% exiting
47 22 enter/25 exit
North Residential Unit 1 200 Seasonal Homes @ 50% occupan-cy @ 2.9 persons/home *0.28 trip ends
per person 66%entering 34% exiting
81 54 enter/27 exit
North Residential Unit 2 200 Seasonal Homes @ 50% occupancy @ 2.9 persons/home*0.28
trip ends per person 64% entering/ 34% exiting
81 54 enter/27 exit
Totals number of trip ends (Before internal Trip Reduction 277
Total Entering 161-17internal trips= 144 (after reduc-tion)
144
Total Exiting 116-17 internal trips =99 (after reduc-tion)
99
during the horizon year as follows: Traffic distribution for build out of Unit 2 is based upon the four access points. For this development, an analysis of internal trips was conducted and it was determined that the external trips are reduced by 17 trips. The internal trips are trips that occur between the residential and the retail businesses and thus not external (NM 248 or US 380). Copies of the Internal trip analysis is included in the appendix.

13
13
HORIZON YEAR UNIT BUILDOUT PROJECTED PEAK HOUR TRAFFIC FLOW 2046
US 380
13 12
ACCESS A ACCESS B ACCESS C ACCESS D
RESIDENTIAL
28 11
27
54
TO NM 248
11
70
11 11 11
16
16
16
16
2 2
2
3
11
11 70
VII. Access Design Specifications The following table is provided to determine if auxiliary lanes are warranted for the build out of the project as follows:
NORTH
Table 8. Auxiliary Lane Warrants (Unit 2)
Minimum Left Turning Flow Criteria for to satisfy warrant (55 MPH posted Speed)
Projected Left Turn-ing Flow
Minimum Through
Volume for Left Turn-
ing Warrant
Actual Through
Traffic Vol-ume
Warrant Satisfied?
y/n
15 16 60 70 Y
16 16 106 70 N
Minimum Right Turning Flow Criteria for to satisfy warrant (45 MPH posted Speed)
Projected Right Turn-
ing Flow
Minimum Through
Volume for Right turn-ing warrant
Actual through
traffic vol-ume
Warrant Satisfied?
y/n