a trillion dollar question: what predicts student loan ... · 1 introduction over the past ten...
TRANSCRIPT

Finance and Economics Discussion SeriesDivisions of Research & Statistics and Monetary Affairs
Federal Reserve Board, Washington, D.C.
A Trillion Dollar Question: What Predicts Student LoanDelinquencies?
Alvaro A. Mezza and Kamila Sommer
2015-098
Please cite this paper as:Mezza, Alvaro A., and Kamila Sommer (2015). “A Trillion Dollar Question:What Predicts Student Loan Delinquencies?,” Finance and Economics Discussion Se-ries 2015-098. Washington: Board of Governors of the Federal Reserve System,http://dx.doi.org/10.17016/FEDS.2015.098.
NOTE: Staff working papers in the Finance and Economics Discussion Series (FEDS) are preliminarymaterials circulated to stimulate discussion and critical comment. The analysis and conclusions set forthare those of the authors and do not indicate concurrence by other members of the research staff or theBoard of Governors. References in publications to the Finance and Economics Discussion Series (other thanacknowledgement) should be cleared with the author(s) to protect the tentative character of these papers.
A Trillion Dollar Question: What Predicts StudentLoan Delinquencies?∗
Alvaro Mezza† Kamila Sommer‡
October 2015
Abstract
The recent significant increase in student loan delinquencies has generated inter-est in understanding the key factors predicting the non-performance of these loans.However, despite the large size of the student loan market, existing analyses havebeen limited by data. This paper studies predictors of student loan delinquencies us-ing a nationally representative panel dataset that anonymously combines individualcredit bureau records with Pell Grant and Federal student loan recipient information,records on college enrollment, graduation and major, and school characteristics. Weshow that borrower-level credit characteristics are important predictors of student loandelinquencies. In particular, credit scores of young borrowers are highly predictive offuture student loan delinquencies, even when measured well before borrowers enterrepayment. In marked contrast, our results point to only a limited power of studentdebt levels in predicting future student loan credit events. Our findings have poten-tially useful practical implications. For example, access to credit file information whenborrowers exit school could help to more effectively target student loan borrowers whomight benefit from enrolling in income-driven repayment or loan modification plans.
∗We would like to thank to Rodney Andrews, Moshe Buchinsky, Rohit Chopra, Susan Dynarski, JenniferHunt, Sarena Goodman, Michael Palumbo, Karen Pence, Daniel Ringo, Shane Sherlund, and to the partici-pants of the Research Symposium on Student Loans at Suffolk University Law School and of the Associationfor Education Finance and Policy’s (AEFP) 40th Annual Conference for helpful feedback. Amanda N’guyenprovided excellent research assistance. The analysis and conclusions contained in this paper are those of theauthors and do not necessarily reflect the views of the Board of Governors of the Federal Reserve System,its members, or its staff.†Federal Reserve Board, email: [email protected]‡Federal Reserve Board, email: [email protected]
1 Introduction
Over the past ten years, the real amount of student debt owed by American households more
than doubled, from about $450 billion to more than $1.1 trillion, with average real debt per
borrower increasing from about $19,000 to $27,000. As a result of this increase, student loan
debt surpassed credit card debt as the largest class of non-housing consumer debt in 2010.
A potential consequence of the higher reliance on student debt to finance higher education,
coupled with the adverse effects of the Great Recession, is difficulty in meeting these debt
obligations. As a possible reflection, the share of balances 90 or more days delinquent past
increased from 6.7 percent to 11.7.1
Given the unprecedented rise in student loan debt and delinquencies, the trillion dollar
question is: “What predicts student loan delinquencies?” Popular commentary has frequently
linked greater odds of repayment difficulties to high student loan debt burdens but, given the
scarcity of comprehensive data, such statements have been mostly based on press anecdotes.2
Using a new, unique data set, this paper studies which individual educational, credit, and
school characteristics predict student loan delinquencies. Our nationally representative panel
data anonymously combine individual credit bureau records with Pell Grant and Federal
student loan recipient information, records on college enrollment, graduation and major,
and school characteristics. The data are based on a sample of individuals who were 23 to 31
years old in 2004 and span the period 1997-2010.
Using a probability model framework designed to estimate the likelihood with which a
student loan borrower becomes 120 or more days delinquent on her student loans within five
years of entering repayment, we show that borrower-level credit characteristics are impor-
tant predictors of future student loan delinquencies. In particular, despite the notion that
credit histories of young student loan borrowers are not necessarily well established and,
consequently, less likely to be predictive of future credit behavior, we show that credit scores
of young borrowers are highly predictive of future student loan delinquencies, even when
measured prior to borrowers’ entering repayment. In marked contrast, and perhaps contrary
to the popular narrative, student loan balances are generally not a significant predictor of
1Figures are based on authors’ calculations from the NYFed CPP/Equifax data set for 2005:Q2 and2015:Q2. Nominal amounts are deflated by CPI-U into constant 2015:Q2 dollars.
2See, for example, “Graduating College with $120K in Student Loan Debt,” Here and Now, NPR, May15, 2012; “The $555,000 Student-Loan Burden,” Wall Street Journal, February 13, 2010; “Finding Debt aBigger Hurdle than Bar Exam”, New York Times, July 1, 2009.
1

student loan delinquency risk, both in statistical and economic terms.
Our analysis offers additional interesting insights. In particular, other credit indicators
remain highly predictive of future student loan delinquencies, even after controlling for bor-
rower credit scores. For example, and perhaps counter to simple intuition, borrowers with
credit card or mortgage debt prior to entering repayment are less likely to become delinquent
on their student loans than borrowers with no such debts, potentially because borrowers with
less risky underlying credit profiles are more likely to qualify for such debt while in school.
Moreover, in our regression specifications that exclude credit variables, degree completion
and for-profit attendance (see Looney and Yannelis (2015) for supporting evidence) are some
of the strongest predictors of future student loan delinquencies, both in statistical and eco-
nomic terms. However, once credit controls are included in the regression specification, their
statistical and economic significance declines (though the dropout indicator remains highly
statistically significant), suggesting that credit variables—and credit scores in particular—are
correlated with degree completion and attendance of for-profit institutions. These findings,
coupled with the low predictive power of student loan debt, corroborate the notion that the
observed rise in student loan delinquencies in general may not be driven by large levels of stu-
dent loan debt, but rather by other factors that correlate with a borrower’s ability to repay
it (see, for example, Dynarski and Kreisman (2013) and Hylands (2014)).3 Finally, similar to
other studies (see Gross et al. (2009) for a comprehensive review of the existing literature and
Looney and Yannelis (2015) for a recent analysis of defaults on federal student loans), we
confirm that other factors such as Pell Grant controls—which partly proxy for a borrower’s
socio-economic background—are important predictors of student loan delinquencies.
Our findings that credit characteristics are salient predictors of future student loan delin-
quencies, even when measured before borrowers enter repayment, have important practical
implications. Coinciding with the rapid increase in student debt and delinquencies, a num-
ber of initiatives have been put forth to help borrowers manage their debt.4 For example,
new plans tied to borrowers’ incomes (so-called “income-driven” repayment plans) were in-
troduced to help borrowers lower monthly payments to manageable levels relative to their
3Some of these factors likely are future employment prospects and realized incomes relative to debtincurred to fund one’s post-secondary education.
4For an example of such initiatives, see the DoEd press release “U.S. Departments of Education andTreasury Announce Collaboration with Intuit Inc. to Raise Awareness about Income-Driven RepaymentOptions for Student Loans” from January 24, 2014 at www.ed.gov.
2

incomes.5,6 While income-driven repayment plans are a potentially promising way to alleviate
student loan burdens for borrowers who might otherwise be at risk of delinquency, a limited
number of tools—such as high student loan balances and troubled status of the loans—has
made it difficult for policy makers to efficiently target the at-risk population.7 While our
results point to a limited explanatory power of the level of student loan debt in predicting
future student loan delinquency risk, our results also suggest that borrowers’ credit scores
could be used to identify at-risk borrowers. In particular, even the most rudimentary regres-
sion specification that includes credit scores and student loan balances is able to capture 60
percent of all student loan delinquencies among the 25 percent of borrowers most likely to
become delinquent. Furthermore, the riskiest 15 and 30 percent of borrowers (as predicted
by the model) account for 40 and 70 percent of all student loan delinquencies, respectively.
The purpose of this study is not to devise a method that could be used to underwrite
student loans at the time a borrower applies for college. Rather, we aim to identify vari-
ables that policy makers could use to effectively target at-risk borrowers for enrollment in
programs designed to mitigate delinquency risk and potentially increase student loan debt
manageability at the time when these borrowers exit school or enter repayment. To this end,
we use a probability model to estimate the likelihood with which a student loan borrower be-
comes delinquent on their student loans using a set of predictive variables that are observed
at or shortly before exiting school or entering repayment.8
This paper is organized as follows. Section 2 describes the newly constructed, core data
5Two such recently introduced plans are the Income-Based Repayment (IBR) plan—available since 2009—and the (ii) Pay-As-You-Earn (PAYE) repayment plan—available since 2012. While the two plans vary insome of the eligibility requirements, they both offer low income-based payments tied to discretionary incomeover a long amortization periods (from 20 to 25 years, depending on the specific plan). Additionally, theIncome-Contingent Repayment (ICR) plan has been available for Direct Loan Program (DLP) loan borrowerssince the inception of the DLP in 1994.
6Income-driven repayment plans are intended to make student loan debt more manageable by reducingmonthly payment amounts. While we are not able to measure debt manageability in our data per se, thereis likely a link between borrowers’ ability to manage their student loan debt and delinquency risk. For ananalysis of student debt manageability, see Thompson and Bricker (2014).
7As of 2015:Q2, about 19 percent of borrowers and 33.5 percent of outstanding federal Direct stu-dent loan balances are enrolled in income-driven repayment plans (https://studentaid.ed.gov/about/data-center/student/portfolio). These figures include those enrolled in ICR, IBR, and PAYE plans. Interestingly,the enrollment figures indicate that those currently enrolled have higher balances, on average, than theaverage DLP loan borrower (about $50,000 versus $28,000), suggesting that a significant number of borrow-ers taking advantage of these plans are borrowers with high balances. As we will show, these are not theborrowers that are most frequently associated with delinquencies and defaults.
8Student loan borrowers do not have to start repaying their student loans right away after school exit, ingeneral. The “waiting” period after school exit and before repayment begins is known as the grace period,and typically lasts six months.
3

set from which the final subsample used in the analysis is drawn. Section 3 discusses the
sub-sampling criteria used for construction of the final estimation sample and provides basic
summary statistics. Section 4 briefly describes the empirical design, interprets the regression
output, and uses a cumulative delinquency curve framework to assess the predictive power
of various model specifications. Section 5 concludes the paper.
2 Data
Our data are pooled from several sources.9 Appendix A.1. discusses the details of the data,
checks the representativeness of the merged data set against alternative data sources, and
provides caveats relevant for the analysis.
By way of summary, the data set starts with a nationally representative random sample
of credit bureau records picked and provided by TransUnion, LLC, for a cohort of 34,891
young individuals who were between ages 23 and 31 in 2004, and spans the period 1997
through 2010. Individuals are followed biannually between June 1997 and June 2003, and
then in December 2004, June 2007, and December 2008 and 2010. The data contain all
major credit bureau variables, including credit scores, tradeline debt levels, and delinquency
and severe derogatory records. In the next step, individual educational records through
2007 are merged from the DegreeVerify (for degrees) and Student Tracker (for enrollments)
programs by the National Student Clearinghouse (NSC) on the TransUnion data. The NSC
educational institution identifiers are then used to further merge school-level information
from the Integrated Postsecondary Education Data System (IPEDS), as well as the historical
school-level 2-year cohort default rates (CDR) from the Federal Student Aid (FSA).10,11
Finally, individual-level information about Pell Grants and Federal loans—sourced from the
National Student Loan Data System (NSLDS)—is merged onto the data for Pell Grant and
Federal student loan recipients.
9All the merges of individual-level information have been performed by TransUnion, LLC, in conjunctionwith the National Student Clearinghouse, and the Department of Education. The merges have been donebased on a combination of Social Security number, date of birth, and individuals’ first and last names. Noneof the variables used to merge individuals across sources is available in our data set.
10The IPEDS includes school-level information such as tuition, sector (e.g., public, private for-profit andnot-for-profit, open admission), and SAT and ACT scores.
11The school-level CDR is computed as the percentage of borrowers at a given school who enter repaymenton federal loans during a particular federal fiscal year and default on their student loan(s) prior to the endof the next fiscal year.
4
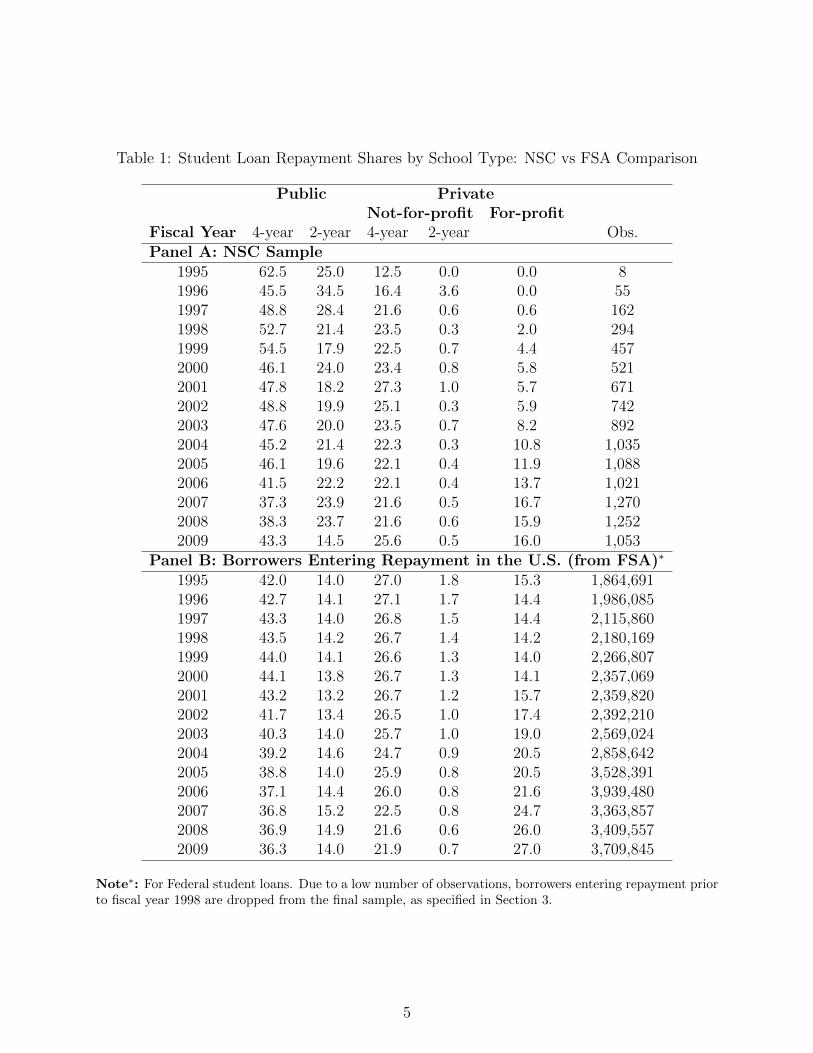
Table 1: Student Loan Repayment Shares by School Type: NSC vs FSA Comparison
Public PrivateNot-for-profit For-profit
Fiscal Year 4-year 2-year 4-year 2-year Obs.Panel A: NSC Sample
1995 62.5 25.0 12.5 0.0 0.0 81996 45.5 34.5 16.4 3.6 0.0 551997 48.8 28.4 21.6 0.6 0.6 1621998 52.7 21.4 23.5 0.3 2.0 2941999 54.5 17.9 22.5 0.7 4.4 4572000 46.1 24.0 23.4 0.8 5.8 5212001 47.8 18.2 27.3 1.0 5.7 6712002 48.8 19.9 25.1 0.3 5.9 7422003 47.6 20.0 23.5 0.7 8.2 8922004 45.2 21.4 22.3 0.3 10.8 1,0352005 46.1 19.6 22.1 0.4 11.9 1,0882006 41.5 22.2 22.1 0.4 13.7 1,0212007 37.3 23.9 21.6 0.5 16.7 1,2702008 38.3 23.7 21.6 0.6 15.9 1,2522009 43.3 14.5 25.6 0.5 16.0 1,053
Panel B: Borrowers Entering Repayment in the U.S. (from FSA)∗
1995 42.0 14.0 27.0 1.8 15.3 1,864,6911996 42.7 14.1 27.1 1.7 14.4 1,986,0851997 43.3 14.0 26.8 1.5 14.4 2,115,8601998 43.5 14.2 26.7 1.4 14.2 2,180,1691999 44.0 14.1 26.6 1.3 14.0 2,266,8072000 44.1 13.8 26.7 1.3 14.1 2,357,0692001 43.2 13.2 26.7 1.2 15.7 2,359,8202002 41.7 13.4 26.5 1.0 17.4 2,392,2102003 40.3 14.0 25.7 1.0 19.0 2,569,0242004 39.2 14.6 24.7 0.9 20.5 2,858,6422005 38.8 14.0 25.9 0.8 20.5 3,528,3912006 37.1 14.4 26.0 0.8 21.6 3,939,4802007 36.8 15.2 22.5 0.8 24.7 3,363,8572008 36.9 14.9 21.6 0.6 26.0 3,409,5572009 36.3 14.0 21.9 0.7 27.0 3,709,845
Note∗: For Federal student loans. Due to a low number of observations, borrowers entering repayment priorto fiscal year 1998 are dropped from the final sample, as specified in Section 3.
5
Out of the 34,891 individuals in the TransUnion sample, 54 percent (or 18,748 individ-
uals) have existing NSC postsecondary education enrollment records, indicating that these
individuals have at least some college education. While this “college-going” rate broadly
matches the comparable rate of 58 percent in the nationally representative 2007 American
Community Survey (ACS), it understates the rate slightly.12 In particular, besides never en-
rolling in college (a factor that accounts for the preponderance of the cases with missing NSC
records), a NSC record might be missing because the postsecondary education institution
in which an individual was/is enrolled does not participate in the NSC Student Tracker and
DegreeVerify programs. The non-participating institutions being disproportionately more
likely to be concentrated among the private for-profit schools (Dynarski et al. (2013)).13
To address the NSC coverage issues, we proceed in two steps. First, whenever available,
we augment the NSC enrollment information with enrollment data from the NSLDS for
Federal student loan recipients.14 Second, we develop yearly sample weights designed to
correct for the underrepresentation of certain school sectors in the NSC data. Panels A and
B in Table 1 show the yearly shares of borrowers entering repayment across school sectors in
our NSC sample and the nationally representative FSA data, respectively.15 For each sector,
the weights are constructed as the ratio of these yearly shares in the NSC sample and the FSA
data by fiscal year.16 As seen in the panels, private not-for-profit and for-profit institutions
are underrepresented throughout the NSC sample relative to the nationally representative
FSA data, though their coverage increases significantly in later years of the NSC sample.
The coverage issues are particularly severe prior to fiscal year 1998, leading us to eliminate
individuals who entered repayment for the last time before fiscal year 1998 from the final
sample. We discuss the final data selection next.
12The ACS estimate is based on a cohort of individuals between ages 25 to 34 in 2007. In our sample,individuals were between ages 26 to 34 in 2007.
13An additional reason for why an enrollment record may not be present in our data is due to datatruncation related to the 2007 NSC data collection cutoff that is specific to our data set. However, thischannel has no effect on comparability of the college-going rate in the NSC sample with the ACS estimate.
14The NSLDS contains information on enrollment spells that have been funded by Federal student loans.15The FSA data are available for download at: http://www.ifap.ed.gov/DefaultManagement/press/. Un-
fortunately, the FSA data do not account for those borrowers entering repayment who exclusively hold privatestudent loan debt. However, according to our data, less than 2 percent of borrowers hold only private studentloan debt, and no Federal student loans, by the time they enter their last repayment spell observed in oursample.
16Fiscal year is defined as the period between October 1 of a given year and September 30 of the followingyear.
6

3 Estimation data set and Summary Statistics
In this section, we describe the final subsample used in the analysis. We focus on the
population of individuals with positive student loan debt in the original “college-going” NSC
sample: 11,766 individuals. The fraction of individuals with student debt in the NSC sample
suggests that approximately 60 percent of college-goers use student loans to fund their post-
secondary education.17 We next drop 1,231 individuals with zero student loan balances at the
time when they entered their last repayment observed in the sample, with the last repayment
defined as starting 200 days after a borrower leaves school for the last time in our sample.
The 200-day period between school completion and the beginning of the repayment spell
reflects the six-month grace period.18 Next, consistent with our above discussion on sample
weighting, we drop 3,808 borrowers who entered their most recently observed repayment
spell either before fiscal year 1998 or after fiscal year 2006. Additionally, due to the very
small sample and corresponding issues with weight adjustments, we drop 34 individuals
who last attended a private not-for-profit 2-year school, as well as 6 individuals who last
attended a private for-profit school in fiscal year 1998. Furthermore, we drop 5 borrowers who
entered their last repayment spell before age 19 and additional 31 individuals with missing
information on the CDR or school sector associated with the last institution attended. The
final sample thus contains 6,651 student loan borrowers with existing educational records.
All dollar-nominated variables are deflated into 2010 dollars using the CPI-U.
Table 2 shows the age distribution when entering repayment in our final sample. As
shown, about 8 percent of student loan borrowers were age 21 or younger when entering
repayment for the last time in the sample. These borrowers generally represent those with
completed one- or two-year degrees, dropouts, or—in rare instances—very young 4-year
degree college graduates. The next 42 percent of student loan borrowers with at least some
college entered repayment for the last time between ages 22 and 24. The remaining 50 percent
entered their final repayment spell between ages 25 and 33. These borrowers generally
represent individuals with advanced degrees, as well as individuals who were either older
17Even though not perfectly comparable, about 60 percent of individuals who earned Bachelor’s degrees in2011-12 from a non-profit institution at which they began their studies graduated with debt (CollegeBoard(2013)). This fraction has fluctuated only in a narrow range since 1999.
18In the credit bureau data, we cannot identify borrowers who entered deferment or forbearance after aschool exit. This potentially reduces the observed delinquency rate in our sample, and potentially biases ourresults if borrowers’ decisions to exercise these options are correlated with their characteristics.
7

Table 2: Age Distribution when Entering Last RepaymentAge N Percent Cum.
19 85 1.28 1.2820 177 2.66 3.9421 267 4.01 7.9522 771 11.59 19.5523 1,100 16.54 36.0824 938 14.10 50.1925 787 11.83 62.0226 712 10.71 72.7327 567 8.53 81.2528 457 6.87 88.1229 308 4.63 92.7530 233 3.50 96.2631 150 2.26 98.5132 84 1.26 99.7733 15 0.23 100.00Total 6,651 100.0 100.0
when entering college, or those with longer or interrupted educational histories.
Given the focus on credit variables as predictors of student loan delinquencies, Table 3
shows the distribution of credit scores by age of a student loan borrower.19 At least in theory,
and in particular for FICO scores, any individual with at least one credit tradeline account
that is open for six months and that is also reported to the credit bureau agency should
have a credit score.20 To the extent that the need for credit increases with age, one would
expect that the fraction of individuals with credit scores will be increasing with age. In our
final sample, only 30 percent of individuals have a credit score at age 18, but 70 percent
have a credit score by age 19, and 93 percent by age 22. For those age 26 or above, close
to 100 percent have a credit score. Moreover, the age profile of the average credit score for
those with scores follows a U-shape. The average credit score starts at about 650 at age
18 but—perhaps somewhat counter to initial intuition—declines monotonically by about 80
points to 567 at age 26 before rising again to about 600 at age 31. Additionally, the variance
19The credit score used in this analysis is the TU TransRisk AM Score and it ranges from 270 to 900points.
20Additional criteria for a FICO score apply. The borrower also has to have at least one undisputedaccount that has been reported to the credit bureau within the past six month, and there must be no in-dication that individual(s) associated with the credit record is/are deceased. For more information, seehttp://www.myfico.com/CreditEducation/questions/requirement-for-fico-score.aspx. Scores developed byother companies, such as the score used in this analysis, may differ slightly in the criteria used to scoreindividuals.
8
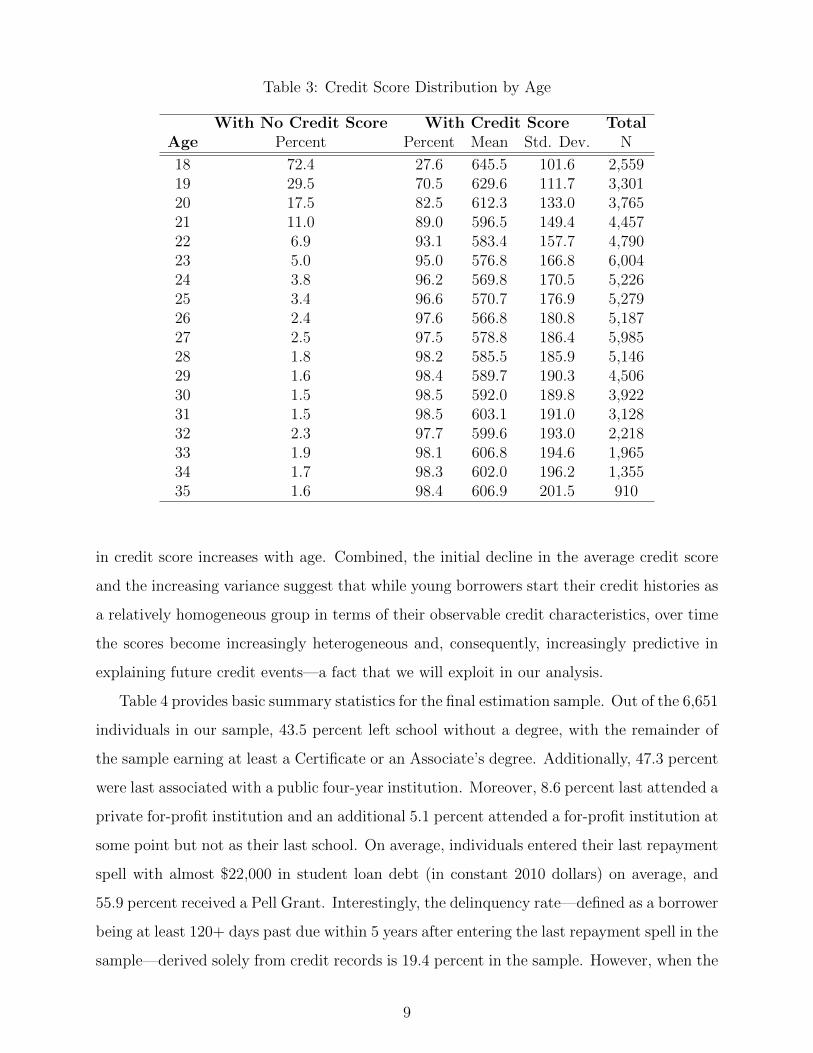
Table 3: Credit Score Distribution by Age
With No Credit Score With Credit Score TotalAge Percent Percent Mean Std. Dev. N
18 72.4 27.6 645.5 101.6 2,55919 29.5 70.5 629.6 111.7 3,30120 17.5 82.5 612.3 133.0 3,76521 11.0 89.0 596.5 149.4 4,45722 6.9 93.1 583.4 157.7 4,79023 5.0 95.0 576.8 166.8 6,00424 3.8 96.2 569.8 170.5 5,22625 3.4 96.6 570.7 176.9 5,27926 2.4 97.6 566.8 180.8 5,18727 2.5 97.5 578.8 186.4 5,98528 1.8 98.2 585.5 185.9 5,14629 1.6 98.4 589.7 190.3 4,50630 1.5 98.5 592.0 189.8 3,92231 1.5 98.5 603.1 191.0 3,12832 2.3 97.7 599.6 193.0 2,21833 1.9 98.1 606.8 194.6 1,96534 1.7 98.3 602.0 196.2 1,35535 1.6 98.4 606.9 201.5 910
in credit score increases with age. Combined, the initial decline in the average credit score
and the increasing variance suggest that while young borrowers start their credit histories as
a relatively homogeneous group in terms of their observable credit characteristics, over time
the scores become increasingly heterogeneous and, consequently, increasingly predictive in
explaining future credit events—a fact that we will exploit in our analysis.
Table 4 provides basic summary statistics for the final estimation sample. Out of the 6,651
individuals in our sample, 43.5 percent left school without a degree, with the remainder of
the sample earning at least a Certificate or an Associate’s degree. Additionally, 47.3 percent
were last associated with a public four-year institution. Moreover, 8.6 percent last attended a
private for-profit institution and an additional 5.1 percent attended a for-profit institution at
some point but not as their last school. On average, individuals entered their last repayment
spell with almost $22,000 in student loan debt (in constant 2010 dollars) on average, and
55.9 percent received a Pell Grant. Interestingly, the delinquency rate—defined as a borrower
being at least 120+ days past due within 5 years after entering the last repayment spell in the
sample—derived solely from credit records is 19.4 percent in the sample. However, when the
9

credit data is augmented with information on Federal student loan defaults, this delinquency
rate rises to 25.7 percent, suggesting that not all Federal student loan defaults recorded by
the DoEd can be identified in the credit data.21 Moreover, among the 1,707 borrowers who
became 120+ days past due on their student loans within five years after entering the last
repayment spell, 1,094 (or 64 percent) ended up defaulting on their Federal student loans in
those 5 years. For additional descriptive statistics for the final sample, see Appendix A.3.
4 Results
4.1 Bivariate Analysis
This section summarizes several insightful bivariate relationships between student loan delin-
quencies and some of their correlates. Our delinquency measure takes a value of one if a
borrower was ever 120 or more days delinquent within five years after entering her last
repayment spell; zero otherwise.22
To start with, Table 5 and Figure 1 show the distribution of student loan balances for
delinquent vs. non-delinquent student loan borrowers. As can be seen, delinquent borrowers
are on average associated with lower (rather that higher) student loan balances than non-
delinquent borrowers.
Since the results in Table 5 and Figure 1 do not account for borrowers’ attained education,
the negative coefficient on student loan debt should not be too surprising: those with lower
educational attainment levels are more likely to become delinquent but, at the same time,
tend to have lower levels of student loan debt. Table 6 illustrates this point by tabulating
the average student loan debt and delinquency rate by the highest attained degree. The
average delinquency rate and student loan balance among those who did not complete their
degree are 43.5 percent and $12,524, compared to 6.8 percent and $48,260 of those with
a Master’s degree or above. To further illustrate this point, Figure 2 repeats the analysis
shown in Figure 1 but separates borrowers by the highest degree attained. Indeed, once
21Severe derogatory events associated with student loan debt, such as Federal student debt defaults, areincluded in our definition of 120+ dpd delinquency measure. Due to federal law, negative information hashistorically been removed from the credit file after seven years.
22Some borrowers have interrupted educational spells, meaning that they enter repayment but later re-enroll and continue their education. Our dependent variable is thus defined with respect to the last timewhen a borrower enters repayment in our sample.
10

Table 4: Characteristics of Borrowers in the Final SampleVariable N Mean Std. Dev. Min Max
Age at Last Repayment 6,651 25.4 2.8 19 33Highest Degree Attained
Dropout 2,892 0.435Certificate/Associate’s Degree 373 0.056Bachelor’s 2,108 0.317Master’s or Above 604 0.091Graduated but Degree Unknown 674 0.101
Last AttendedPublic 4-Year 3,143 0.473Public 2-Year 1,375 0.207Private Not-for-profit 4-Year 1,560 0.235Private For-profit 573 0.086
Additional Sectors Attended (if Different from School Type Last Attended)Public 4-Year 1,169 0.176Public 2-Year 1,597 0.240Private Not-for-profit 4-Year 797 0.120Private For-profit 340 0.051
Ever Had (Prior to Entering Repayment)Auto Loans 2,393 0.360Mortgage Loans 836 0.126Credit Card Loans 5,284 0.794
Ever Delinquent on (Prior to Entering Student Loan Repayment)Auto Loans 18 0.003Mortgage Loans 11 0.002Credit Card Loans 374 0.056Any Debt (different than student loans) 398 0.060
Student Loans (in $1,000)Balance at Repayment 6,184 22.4 29.3 0.003 366.9With Student Loans but Missing Balance 467 0.3Fraction of Borrowers With Only Private Student Debt 129 0.019
Pell GrantsEver Had 3,720 0.559Mean Pell Grants (> 0, in $1,000) 3,720 2.3 1.0 0.4 4.31
Credit Score (Prior to Leaving School)Credit Score 6,056 599.3 156.4 271 866Missing Credit Score Indicator 595 0.29Days Lagged (w.r.t. Timing of School Exit) 6,056 376.7 197.9 1 731
Cohort Default Rate 6,168 4.90 3.90 0 100Delinquency Rates by Repayment Calendar Year Cohort
FY-1998 Cohort 285 0.272FY-1999 Cohort 453 0.249FY-2000 Cohort 511 0.296FY-2001 Cohort 660 0.225FY-2002 Cohort 734 0.253FY-2003 Cohort 882 0.261FY-2004 Cohort 1,031 0.265FY-2005 Cohort 1,082 0.247FY-2006 Cohort 1,013 0.266Overall 1,707 0.257Overall, based on TU information 1,293 0.194Overall In Default on their Federal Student Loans 1,094 0.164
Note: Dollar-nominated variables are expressed in 2010 dollars using the CPI-U.
11

0.0
2.0
4.0
6P
erce
nt o
f Dis
trib
utio
n
0 10 20 30 40 50Student Loan Debt at Repayment (in Thousands of 2010 $)
Delinquent Current
Student Debt Distribution by Delinquency Status
®
Figure 1: Distribution of Student Debt at Repayment, by Delinquency Status
Note: Plotted for student loan balances at last repayment below $50,000.
Table 5: Distribution of Student Loan Debt in the Final Sample, by Delinquency StatusNot Delinquent Delinquent
Student Loan Debt % Cum. % Obs % Cum. % Obs(0;10,000] 34.7 34.7 1,595 51.8 51.8 823(10,000;20,000] 24.7 59.4 1,135 21.1 72.9 335(20,000;30,000] 17.9 77.3 821 11.8 84.7 187(30,000;50,000] 12.1 89.4 556 9.4 94.1 150(50,000;75,000] 5.4 94.7 246 3.8 98.0 61More than 75,000 5.3 100.0 243 2.0 100.0 32Total 4,596 1,588
the highest degree attained is considered, the cumulative student loan balances associated
with delinquent and non-delinquent borrowers are similar, with little discernible difference
between the two groups.
Table 7 summarizes student loan delinquency rates by degree completion as well as the
school sector last attended. The table shows that, not controlling for other factors, delin-
quency rates are generally much higher for those who did not complete a degree, irrespective
of the sector attended. Still, even among this population, student loan borrowers who last
attended a private for-profit school or a public 2-year school are associated with relatively
higher delinquency rates (54.3 and 46.4 percent, respectively) than borrowers who last at-
12

0.0
2.0
4.0
6.0
8P
erce
nt o
f Dis
trib
utio
n
0 10 20 30 40 50Student Loan Debt at Repayment (in $1,000)
Delinquent Current
No Degree
0.0
2.0
4.0
6.0
8P
erce
nt o
f Dis
trib
utio
n
0 10 20 30 40 50Student Loan Debt at Repayment (in $1,000)
Delinquent Current
Certificate/Associate’s Degree0
.02
.04
.06
.08
Per
cent
of D
istr
ibut
ion
0 10 20 30 40 50Student Loan Debt at Repayment (in $1,000)
Delinquent Current
Bachelor’s Degree
0.0
2.0
4.0
6.0
8P
erce
nt o
f Dis
trib
utio
n0 10 20 30 40 50Student Loan Debt at Repayment (in $1,000)
Delinquent Current
Master’s or Above
Student Debt Distribution by Delinquency Status
®
Figure 2: Distribution of Student Debt at Repayment, by Delinquency Status
Notes: Plotted for student loan balances at last repayment below $50,000.
Table 6: Student Loan Balances and Delinquency Rate by Attained Degree
Max. Degree Attained Avg. Student Loan Balances ($) Delinquency RateNo Degree 12,524 0.435Certificate/Associate’s Degree 12,307 0.228Bachelor’s Degree 24,133 0.111Master’s or Above 48,260 0.068
Note: Tabulations reflect the highest reported attained degree in the sample.
13

Table 7: Delinquency Rate by School Type and Degree Completion
With Degree With No DegreeSector Type Rate N Rate NPublic 4-year 0.103 2,149 0.409 994Public 2-year 0.166 361 0.464 1,014Private 4-year not-for-profit 0.116 1,094 0.328 466Private For-profit 0.265 155 0.543 418Total 0.119 3,759 0.435 2,892
Note: Tabulations are based on the most recent school sector affiliation. Individuals most recently affiliatedwith private, 2-year institutions are dropped from the analysis due to limited number of observations.
tended a public 4-year school (40.9 percent). The differences in delinquency rates are perhaps
even more striking among those who earned a degree: 26.5 and 16.6 percent at private for-
profit and public 2-year schools vs. 10.3 percent at public 4-year schools.
Finally, Table 8 shows the delinquency rate by borrowers’ credit score categories and
their Pell Grant recipient status. To avoid the confounding effects of student loan repay-
ment behavior on credit scores, a lagged credit score measure relative to school exit is used
in the analysis. In particular, scores are lagged on average by one year relative to school
exit (as reported in Table 4), depending on when we observe TransUnion records and when
the school exit occurs for each individual in our sample. Not controlling for other factors,
the table shows that the likelihood of a student loan delinquency following the school exit
declines monotonically and steeply with borrowers’ pre-school-exit credit scores. In particu-
lar, the delinquency rate for student loan borrowers with credit scores between 500 and 599
is 21 percentage points higher than for borrowers with credit scores between 680 and 729.
Moreover, the table shows that, Pell Grant recipients are significantly more likely to become
delinquent on their student loans than those who never received Pell Grants: 34.1 percent
vs. 14.9 percent, respectively.
4.2 Multivariate Analysis
In this section, we estimate a probability model (probit) of student loan delinquency on the
final estimation sample described in Section 3. The binary dependent variable corresponds
to our delinquency measure defined in Section 4.1. Columns (1)–(7) in Table 9 display the
final estimation output for seven baseline regression specifications that are based on the
entire sample. Columns (1)–(6) are adjusted for the NSC school type underrepresentation
14

Table 8: Delinquency Rate by Borrower Credit Score and Pell Grant Recipient Indicators
Credit Score Avg. Student Loan Balances ($) Delinquency Rate Obs270–499 18,927 0.592 1,342500–599 22,504 0.301 935600–679 23,704 0.175 1,255680–729 27,454 0.090 808730–900 25,540 0.041 1360Missing Score 11,372 0.341 484Ever Pell Grants Avg. Student Loan Balances ($) Delinquency Rate ObsNo 23,444 0.149 2,930Yes 18,790 0.340 3,721
Note: Tabulations are based on borrowers’ credit scores that are on average lagged by one year relative toborrowers’ school exit.
with FSA-based weights (previously discussed in Section 2), while column (7) is unweighted.
Column (8) restricts the analysis to those with a Bachelor’s degree or less, also adjusting by
the FSA-based weights. Coefficients in all regressions represent marginal effects, with the
effects being evaluated at the means of the continuous variables. Standard errors are clustered
at the school level.23 Columns (6)–(8) capture our preferred regression specifications.
Column (1) provides estimates for the model with explanatory variables restricted to
borrower’s age when entering the last repayment spell, whether a borrower has received Pell
Grants, the average amount of Pell Grants received, cumulative student loan balances when
entering the last repayment spell, and yearly time effects (with the time dummy variables
taking on a value of one for the fiscal year in which a borrower entered her last repayment
spell). The omitted category is entering repayment in fiscal year 1998. In line with the
bivariate relationship shown in Figure 1, the negative and highly statistically significant
regression coefficient on the (logged) student loan debt in Column (1) illustrates that, not
controlling for additional factors such as degree attainment, borrowers delinquent on their
student loan debt tend to be associated with significantly lower cumulative student loan
balances than non-delinquent borrowers.24 This stylized finding challenges the popular press
narrative that frequently links borrowers with high student loan debt burdens (and often
advanced degrees) to student loan debt repayment difficulties. While such anecdotes un-
23Our decision to cluster at the school level is motivated by the fact that the CDR varies by school. Thesignificance of our regression estimates is essentially unchanged when standard errors are not clustered.
24We include an indicator variable that takes a value of one (zero otherwise) for 467 individuals who holdstudent loan debt when entering repayment but the balance amount is missing in the data.
15
doubtedly capture repayment experiences of some borrowers, the data show that they are
not generally representative of the typical student loan borrower experience.25
The Federal Pell Grant program is a means-tested program that offers financial aid to
low-income students. The program is large: the total Pell expenditures for the school year
2013–14 are estimated at about $34 billion, with over one-third of undergraduate students
receiving a Pell Grant in that year.26 While the indicator for Pell Grant recipients is not
statistically significant on its own, the average amount of Pell Grants received—itself a func-
tion of family resources for dependent students and own resources for students who are
independent, as well as enrollment intensity and educational expenses—is highly significant
and positively correlated with future student loan delinquency at a one percent level. While
the economic significance falls when additional controls are included in the regressions in
Columns (2)–(8), the statistical significance is unchanged, suggesting that borrowers from
underprivileged socio-economic backgrounds are significantly more likely to become delin-
quent on their student loan debt.
Column (2) adds information on attained degrees and college majors, with the omitted
categories being an Associate’s degree/Certificate for degrees and engineering for majors.27,28
A comparison of coefficients in Columns (1) and (2) illustrates the important role of degree
completion as a correlate of future student loan delinquencies. When educational controls are
added in Column (2), the college dropout indicator becomes the most economically significant
predictor of future student loan delinquency.29 In contrast, having a degree beyond an
Associate’s degree or a Certificate mitigates delinquency risk. Additionally, when schooling
25We are not the first to point this out; see, for example, “Student Loans and Defaults: The Facts” bySusan Dynarski, New York Times, Jun 11, 2015. For a profile overview of high-debt borrowers, see “WhoGraduates College with Six-Figure Student Loan Debt?” by Mark Kantrowitz from Aug 1, 2012.
26Source: College Board (https://bigfuture.collegeboard.org/pay-for-college/grants-and-scholarships/what-is-a-pell-grant and http://trends.collegeboard.org/student-aid/figures-tables/pell-grants-total-expenditures-maximum-average-grant-recipients-time).
27We group degrees into the following categories: dropouts (i.e., those with at least some college but noattained degree), Associate’s or Certificate degree holders, Bachelor’s degree holders, holders of a Master’sdegree or more, and those with a completed degree for which the degree type is unknown due to NSCreporting issues. College majors are available only for those with completed degrees and we aggregate theminto 15 different categories; for details, see Appendix A.2. Additionally, 138 borrowers with degree have nomajor information. Thus, the regression specifications include an indicator variable that takes a value of one(zero otherwise) if the individual has a major of an unknown type.
28Additionally, we considered an alternative specification where student loan balances were interacted withthe degree indicators. Given the low predictive power of these interaction terms, we excluded them from thefinal analysis.
29Given the non-causal nature of our analysis, this result does not necessarily imply that pushing dropoutsto finish their degrees will help them repaying their debt.
16

variables are included in the regression, the effect of the average Pell Grants received drops
roughly by a third (although it remains statistically significant at a one percent level), largely
because Pell Grant controls are positively correlated with the dropout indicator. Indeed,
Pell Grant recipients are more frequently associated with socioeconomic characteristics and
educational experiences that suggest statistically greater chances of dropping out of college
(Wei and Horn (2002, 2009)).30 Importantly, once educational controls are added, student
loan debt becomes positively correlated with student loan delinquency risk. However, the
estimated partial correlation between student loan debt and delinquency is economically
small and statistically insignificant, and this result holds even as additional controls are added
in Columns (3)–(8). This weak correlation between student loan balances and delinquency
odds reflects that student loan balances—once educational backgrounds are considered—are
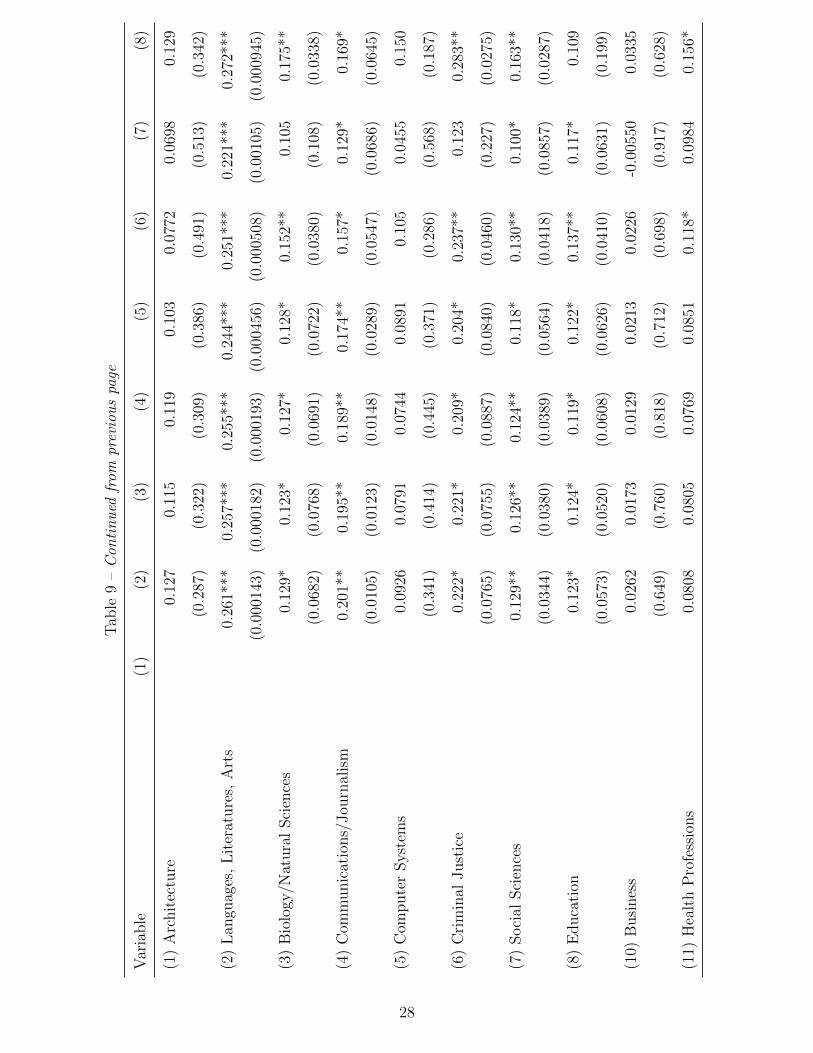
a poor predictor of student loan delinquency risk.31 Onto majors, all the coefficients are
positive, indicating that among those with an attained degree, engineering majors are less
likely to become delinquent on their student debt than other majors, and several of these
coefficients are significant at standard significance levels.32
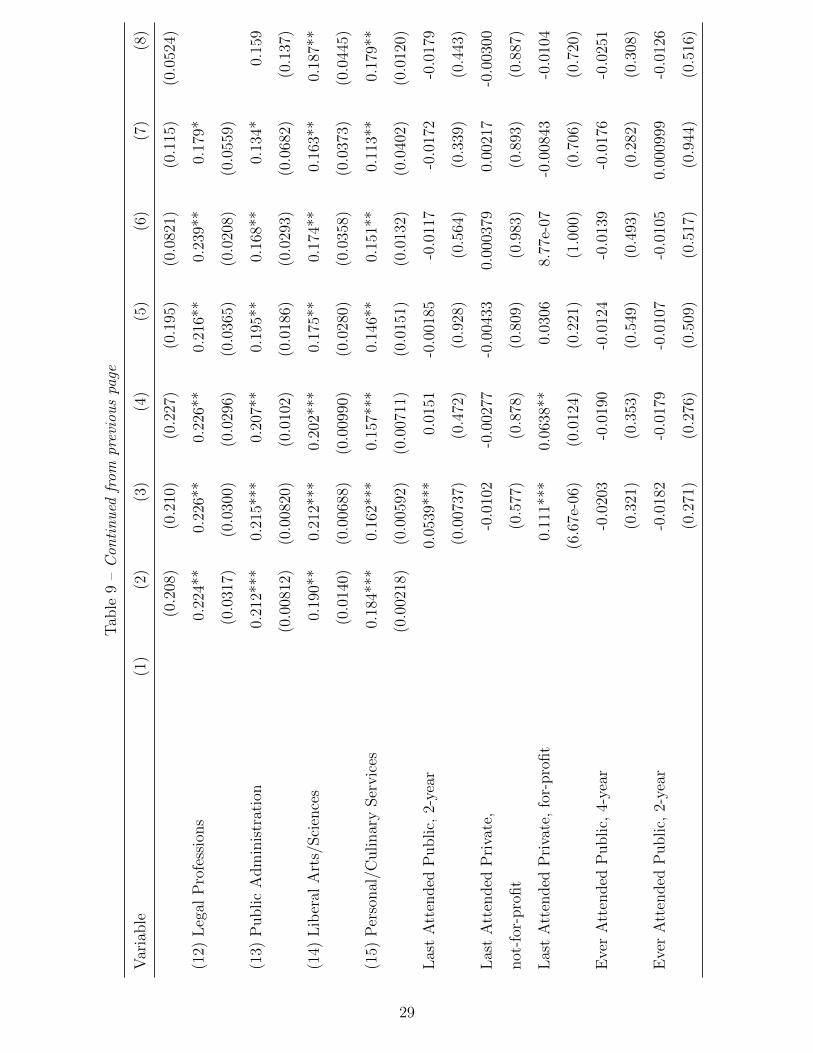
Column (3) incorporates information on school sectors: public 2-year, public 4-year, pri-
vate 4-year not-for-profit, and private for-profit. Individual educational histories are often
complicated. While some borrowers attend only one sector, many borrowers attend multiple
sectors through a series of lateral, upward or downward moves. Therefore, besides control-
ling for the school sector with which a borrower was most recently associated (with public
4-year schools being the omitted sector), we also control for other schools sectors previously
attended.33,34 Consistent with the bivariate evidence in Table 7, having both last or ever
attended a for-profit institution is positively and significantly associated with higher delin-
30Examples include delayed postsecondary enrollment, having an independent status and dependents,being a single parent, working full-time, or attending part-time.
31We further demonstrate this result in Section 4.3.32Those with degrees in languages, literatures or visual arts; social sciences; education; legal professions;
public administration; liberal arts and sciences; communications and journalism; criminal justice; and per-sonal and culinary services are significantly more likely to become delinquent on their student debt relativeto engineering majors, all else equal.
33For example, if a borrower was last associated with a private 4-year not-for-profit institution, but pre-viously also attended a public 2-year school and a for-profit school, the total effect of her sector attendancedecisions on student loan delinquency risk can be calculated by adding up the coefficients on Private 4-yearnot-for-profit, Ever Public 2-year, and Ever Private for-profit indicator variables in Table 9.
34Additionally, we considered an alternative specification where student loan balances were interacted withthe indicators for the last school sector attended. Given the low predictive power of these interaction terms,we excluded them from the final analysis.
17

quency risk at one and five percent significance levels, respectively, even after controlling for
several other factors. Similarly, attending a public 2-year institution just before entering the
last repayment spell is also positively associated with future student loan delinquency risk.35
Column (4) adds information on school-level 2-year cohort default rates (CDR) for the
last institution attended. The CDR is a metric constructed by the DoEd and it is mainly
used to sanction schools with high student loan default rates. If the school’s CDR exceeds
a given threshold, the school becomes Title IV ineligible for a period of time, thereby losing
access to federal funds in the form of grants and student loans.36 To be consistent with
CDR information that might be available to the DoEd at the moment when the borrower
enters repayment and to avoid contaminating the CDR by the borrower’s own delinquency
behavior, we lag the school-level CDR by three years with respect to the year in which the
borrower enters her last repayment spell. Not surprisingly, the school CDR is highly pre-
dictive of individual future student loan delinquency. Moreover, introducing this measure
takes power away from the school sector coefficients. In particular, the statistical signifi-
cance of attending a public 2-year institution just before entering the last repayment spell
dissipates, and the value of the coefficient drops by roughly two thirds, while the economic
importance of attending a private for-profit school just before entering repayment decreases
almost by a half. The reduction in the predictive power of the last school sector attended
variables once the CDR is included is due to the combination of two factors. First, there is
a significant correlation between school sectors and CDRs, as reflected in Figure 3. Second,
even among the sectors where delinquencies are prevalent, there is significant heterogeneity
in CDRs among schools within those sectors, which is why the CDR is a better predictor of
future student loan delinquencies than a more generic indicator for school sector.
Column (5) includes a first subset of credit variables. More specifically, the regression
controls for whether the borrower had other types of debt (i.e., auto, mortgage, and credit
card debt) just before entering repayment, and whether the borrower was delinquent on any
debt different from student loans prior to entering repayment. Interestingly, having credit
card and mortgage debt before entering repayment is associated with a lower likelihood of
35As was the case with dropouts, the positive relationship between delinquency risk and attending a for-profit institution is not necessarily causal. However, for the purpose of identifying characteristics predictingfuture credit risk, for-profit institution attendance is a relevant variable to consider.
36For sanctions and benefits for schools with high and low CDRs, respectively, see Section 2.4 ofhttps://ifap.ed.gov/DefaultManagement/guide/attachments/CDRMasterFile.pdf.
18

0.1
.2.3
0 10 20 30 40School Cohort Default Rate
Public 4−yr Public 2−yrPrivate Not−for−profit 4−yr Private for−profit
Distribution of Cohort Default Rate by Last Sector Attended
®
Figure 3: Distribution of School Sector CDRs
future student loan delinquencies, while having auto debt is statistically insignificant. The
lower incidence of student loan delinquencies among those with mortgage or credit card debt
prior to entering repayment might in part reflect that borrowers with less risky underlying
credit profiles might be more likely to qualify for such debts while in school. Simultaneously,
the statistical insignificance of having auto debt prior to entering repayment might reflect
that auto debt is generally more widely available to borrowers with less pristine credit records
than other types of debt. Finally, being delinquent on other types of debt prior to entering
repayment is highly correlated with future student loan delinquency odds.
Our preferred regression specification in column (6) includes (logged) credit scores. As
described in Section 4.1, credit scores are lagged relative to the school exit. Finally, a dummy
variable set to unity for those with missing credit scores (zero otherwise) is included.37 Once
credit variables are introduced in Columns (5) and (6), the economic effects associated
with dropping out and Pell Grants received decline in value (although remain significant),
suggesting that credit variables—and credit scores in particular—are correlated with degree
completion and socio-economic backgrounds. At the same time, lagged credit score becomes
the most economically predictive correlate of student loan delinquency odds. The highly
37Credit scores for this group are coded as zero.
19
0.00
0.10
0.20
0.30
0.40
0.50
0.60
0.70
0.80
0.90
1.00
300 400 500 600 700 800 900
Credit Score
0.00
0.10
0.20
0.30
0.40
0.50
0.60
0.70
0.80
0.90
1.00
300 400 500 600 700 800 900
Predicted Probability
Credit Score
Prediction: No DegreePrediction: Bachelor’s
*
*
No degree and no credit score
Bachelor’s degree holderwith no credit score
Notes: Calculations assume that the borrower entered repayment in 2005 at the age of 25, and received a Bachelors Degreewith an Engineering major. It is also assumed the borrower only studied at a Public 4-year school, received no Pell Grants,had a credit score core of 700 prior to entering repayment, had no additional debt besides student loans, and the lastreported cohort default rate for the school he last attended before entering repayment was 5.8%. Dashed lines represent 10% confidence intervals
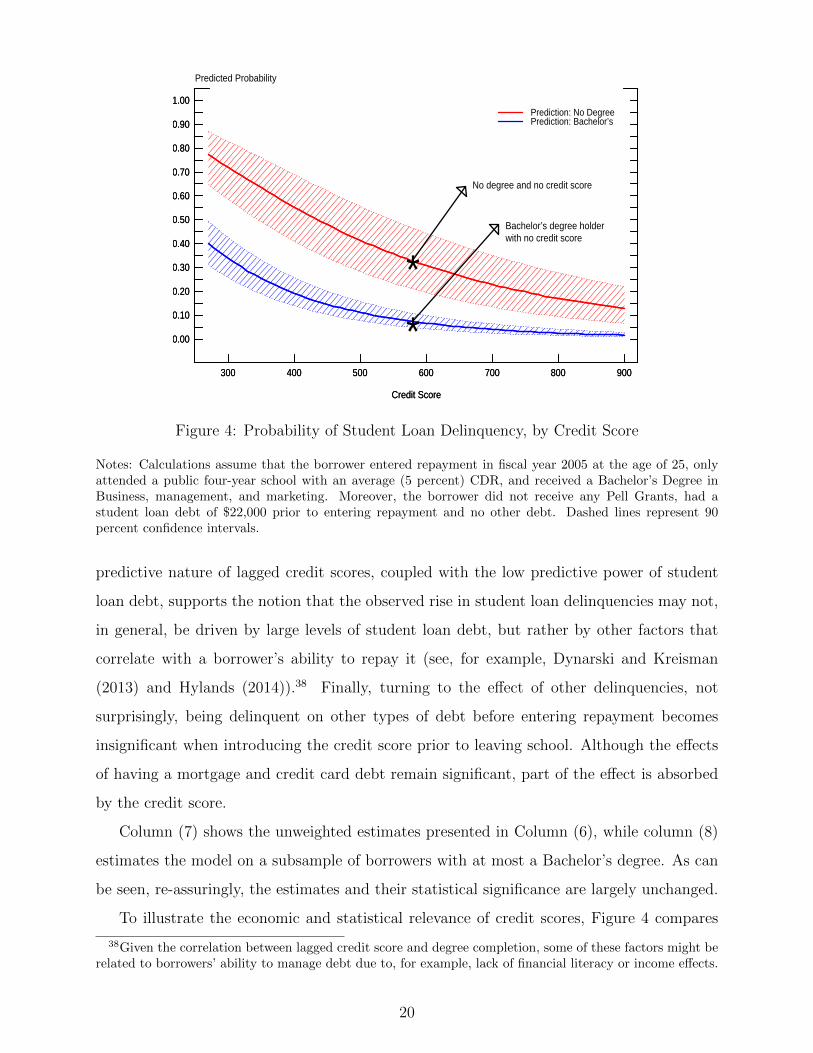
Figure 4: Probability of Student Loan Delinquency, by Credit Score
Notes: Calculations assume that the borrower entered repayment in fiscal year 2005 at the age of 25, onlyattended a public four-year school with an average (5 percent) CDR, and received a Bachelor’s Degree inBusiness, management, and marketing. Moreover, the borrower did not receive any Pell Grants, had astudent loan debt of $22,000 prior to entering repayment and no other debt. Dashed lines represent 90percent confidence intervals.
predictive nature of lagged credit scores, coupled with the low predictive power of student
loan debt, supports the notion that the observed rise in student loan delinquencies may not,
in general, be driven by large levels of student loan debt, but rather by other factors that
correlate with a borrower’s ability to repay it (see, for example, Dynarski and Kreisman
(2013) and Hylands (2014)).38 Finally, turning to the effect of other delinquencies, not
surprisingly, being delinquent on other types of debt before entering repayment becomes
insignificant when introducing the credit score prior to leaving school. Although the effects
of having a mortgage and credit card debt remain significant, part of the effect is absorbed
by the credit score.
Column (7) shows the unweighted estimates presented in Column (6), while column (8)
estimates the model on a subsample of borrowers with at most a Bachelor’s degree. As can
be seen, re-assuringly, the estimates and their statistical significance are largely unchanged.
To illustrate the economic and statistical relevance of credit scores, Figure 4 compares
38Given the correlation between lagged credit score and degree completion, some of these factors might berelated to borrowers’ ability to manage debt due to, for example, lack of financial literacy or income effects.
20
0 5 10 15 20 25 30 35 400.000.010.020.030.040.050.060.070.080.090.100.110.120.130.14
Predicted Probability
Student Debt, in 2010 dollars, in thousands
Credit Score: 700
0 5 10 15 20 25 30 35 400.000.010.020.030.040.050.060.070.080.090.100.110.120.130.14
Predicted Probability
Student Debt, in 2010 dollars, in thousands
Credit Score: 550
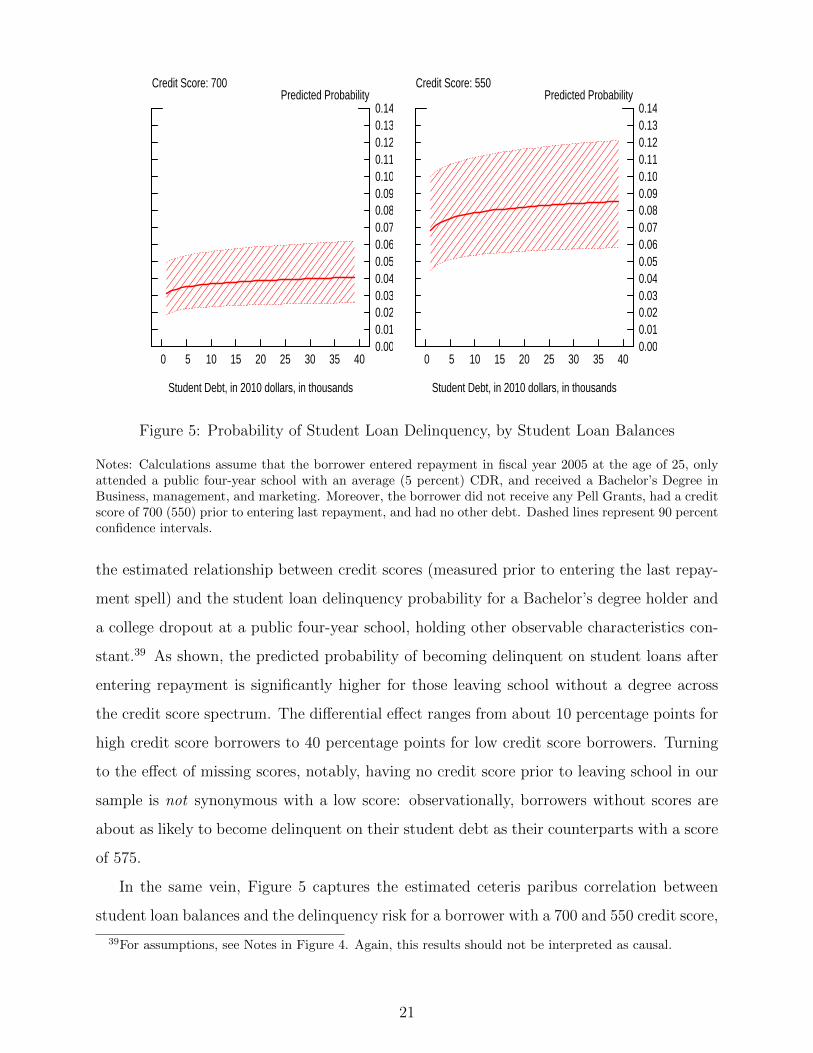
Figure 5: Probability of Student Loan Delinquency, by Student Loan Balances
Notes: Calculations assume that the borrower entered repayment in fiscal year 2005 at the age of 25, onlyattended a public four-year school with an average (5 percent) CDR, and received a Bachelor’s Degree inBusiness, management, and marketing. Moreover, the borrower did not receive any Pell Grants, had a creditscore of 700 (550) prior to entering last repayment, and had no other debt. Dashed lines represent 90 percentconfidence intervals.
the estimated relationship between credit scores (measured prior to entering the last repay-
ment spell) and the student loan delinquency probability for a Bachelor’s degree holder and
a college dropout at a public four-year school, holding other observable characteristics con-
stant.39 As shown, the predicted probability of becoming delinquent on student loans after
entering repayment is significantly higher for those leaving school without a degree across
the credit score spectrum. The differential effect ranges from about 10 percentage points for
high credit score borrowers to 40 percentage points for low credit score borrowers. Turning
to the effect of missing scores, notably, having no credit score prior to leaving school in our
sample is not synonymous with a low score: observationally, borrowers without scores are
about as likely to become delinquent on their student debt as their counterparts with a score
of 575.
In the same vein, Figure 5 captures the estimated ceteris paribus correlation between
student loan balances and the delinquency risk for a borrower with a 700 and 550 credit score,
39For assumptions, see Notes in Figure 4. Again, this results should not be interpreted as causal.
21
respectively.40 As illustrated, and consistent with our previous discussion, the economic
contribution of student loan debt plays only a relatively small role in predicting future
delinquency and is only imprecisely estimated. In particular, the predicted probability of
future student loan delinquency is relatively flat across the student loan debt spectrum, with
sizable 90 percent confidence intervals bounding the estimated effects, indicating the limited
usefulness of student loan balances in identifying borrowers in a high risk of future student
loan delinquency.41
4.3 Predictive Power and Policy Implications
In this section, we assess the in-sample ability of our preferred specification in Column
(5) to identify borrowers in high risk of becoming delinquent on their student loans within
five years after entering their last repayment spell—our dependent variable. To this end,
we construct cumulative delinquency curves—an analytical metric commonly used in the
mortgage industry to gauge performance of credit risk statistical models. First, we use our
model to predict the probability of becoming delinquent on student loans for each borrower.
Second, we calculate the cumulative delinquency curve, defined as a function L(P ), where
P (represented by the horizontal axis) is the cumulative portion of the population ranked
by delinquency risk in a descending order, and L (represented by the vertical axis) is the
cumulative portion of student loan delinquencies in the sample.
The black line in Figure 6 tracks a perfect prediction for our sample and shows that
roughly 25 percent of borrowers become delinquent on their student loans in our sample.
Theoretically, a perfect model would assign these borrowers the highest predicted probabil-
ity of student loan delinquency and would thus allot them to the bottom quartile of the
population ranked by the delinquency risk in descending order, P . In practice, an estimated
model is unlikely to fit the perfect prediction line exactly. However, the model’s fit rela-
tive to the perfect prediction provides a gauge for assessing how well the model separates
40To consider the maximum impact that student loan debt could have on predicting future student loandelinquency risk, unweighted results—reported in Column (7)—were used for this exercise. For additionalassumptions, see Notes in Figure 5.
41The predictive power of student loans is the largest at low levels of student loan debt. For example,in the panel to the right of Figure 5, an increase in student loan debt from $1,000 to $10,000 dollars isassociated with a 15 percent increase in the baseline probability of future student loan delinquency (from6.8 to 7.9 percent). At higher student loan levels, the contribution of additional $10,000 dollars of studentloan debt is much smaller. For example, an increase in student loan debt from $30,000 to $40,000 increasesthe baseline probability by 1.6 percent (from 8.4 to 8.5 percent).
22

borrowers in a high risk of student loan delinquency from their lower risk counterparts. Fig-
ure 6 shows that our fully specified model (represented by the red line) captures 60 percent
of all student loan delinquencies among the riskiest 25 percent of student loan borrowers
ranked by the model-predicted delinquency risk (relative to a 100 percent of all delinquen-
cies under the perfect prediction). Furthermore, the bottom 15 and 30 percent of riskiest
borrowers (as predicted by the model) account for 40 and 70 percent of all student loan
delinquencies, respectively. While our results point to the fact that a significant amount
of heterogeneity related to student loan repayment behavior exists even after controlling
for the available observable characteristics, we view the ability of our model to capture an
appreciable amount of student loan delinquencies in the bottom tail of the predicted risk
distribution as encouraging.
At this point, it is helpful to compare the predictions of our preferred model against
alternative models that could be used by the DoEd to target borrowers in high risk of stu-
dent loan delinquency after entering repayment. In particular, the DoEd has a number of
initiatives through which it attempts to reach student loan borrowers who might benefit
from enrolling in income-driven repayment plans. Unfortunately, only a limited number
of tools are currently available to the DoEd to help identify these borrowers, such as high
student loan balances or an existing delinquency status of these loans.42 Thus, the figure
also shows the explanatory power of several (simpler) alternative models that could be po-
tentially adopted by the DoEd to predict future delinquency risk. As illustrated, a model
that uses only student loan balances—the blue line—closely tracks a 45 degree line and, as
such, is associated with a minimal explanatory power. The green line shows a version of the
model that complements student loan balances with additional information potentially read-
ily available to the DoEd: the 2-year school cohort default rates and Pell Grants controls.43
Including such information greatly improves the fit of the model over the specification that
exclusively relies on student loan balances; however, even such specification is far inferior in
terms of its in-sample predictive power to our preferred specification.
Given the statistically and economically significant effect of credit scores in our preferred
specification, it is interesting to explore whether augmenting the above regressions (which
42Borrowers with loans in deferment or forbearance—other indicators that might point to a troubledstatus—could also be targeted.
43As in our final specification, the Pell Grant controls include the binary indicator for Pell Grant recipientsas well as the average Pell Grants received.
23

0 10 20 30 40 50 60 70 80 90 100
0
10
20
30
40
50
60
70
80
90
100
Cumulative Percent
Percentile
Full ModelStudent Loan BalancesStudent Loan Balances, CDR & Pell GrantsStudent Loan Balances, CDR, Pell Grants & Credit ScoreStudent Loan Balances & Credit ScorePerfect Prediction
Figure 6: Cumulative Delinquency Distribution, by Model-predicted Student Loan Delin-quency Risk
only control for risk factors currently observable by the DoEd) might appreciably increase the
models’ predictive power. The purple line captures the predictive power of a re-estimated
model which only includes student loan balances and credit scores (measured prior to a
borrower’s entering repayment). Introducing borrowers’ credit scores greatly improves the
model’s performance relative to the specifications which rely exclusively on student loan bal-
ances, as well as student loan balances, CDRs and Pell Grant controls. Moreover, once credit
scores are introduced, a further inclusion of CDRs and Pell Grants—in addition to student
loan balances and credit scores (the orange line)—leads only to a marginal improvement
in predictive power of the model and has essentially no discernible effect on the model’s
ability to predict student loan delinquencies at the bottom of the risk distribution where
the efficiency gains of an improvement in predictive power would be the greatest. Taken
together, our results suggest that individuals’ credit scores are a potent predictor of student
loan delinquency risk. Moreover, once credit scores are included, the contribution of CDRs
and Pell Grant controls to the model’s explanatory power is somewhat limited. Indeed, once
credit scores are included, even the most rudimentary regression specification that relies
exclusively on student loan balances and credit score performs comparably to our preferred,
24
fully specified model. In particular, a simple model that includes only student loan balances
and credit scores captures about 57 percent of all student loan delinquencies among the
bottom quartile of the riskiest borrowers, essentially the same fraction as the fully specified
model but nearly doubles the fraction of delinquencies captured by its analog that does not
employ credit scores.
5 Conclusions
The increase in student loan delinquencies and defaults in recent data, coupled with increased
borrowing volumes, have raised concerns about students’ ability to repay their student loan
debt obligations. Coinciding with these increases, new income-driven repayment plans were
introduced by the DoEd to help borrowers lower monthly payments to manageable levels
relative to their incomes. While enrollment in and general awareness of these programs
have been on the rise, efficient targeting of borrowers who might benefit from these plans
appears to have been difficult, in part due to data limitations.44 This paper contributes to
the literature on predictors of student loan delinquency, with a novel application to credit
bureau data.
Using new and unique data, we build a series of statistical models designed to predict
the probability that a borrower becomes delinquent on her student loans within the first 5
years after entering the last repayment spell. We show that, unlike student loan balances,
individual credit scores are highly predictive of future student loan delinquencies, even when
measured well before borrowers’ entry into repayment. In particular, even the most rudi-
mentary probit specification that controls only for student loan balances and lagged credit
scores captures about 60 percent of all student loan delinquencies in the sample among the
model-predicted riskiest quartile of the student loan borrower distribution. In contrast, a
specification based solely on student loan balances—a risk factor that, in absence of other
viable alternatives, is readily available to the DoEd—is associated with minimal explanatory
44As of 2015:Q1, about 17.5 percent of borrowers and 31.5 percent of outstanding federal Direct stu-dent loan balances are enrolled in income-driven repayment plans (https://studentaid.ed.gov/about/data-center/student/portfolio). These figures include those enrolled in ICR, IBR, and PAYE plans. Interestingly,the enrollment figures indicate that those currently enrolled have higher balances, on average, than the av-erage DLP loan borrower (about $50,000 versus $28,000), suggesting that a significant number of borrowerstaking advantage of these plans are borrowers with high balances. As indicated above, these are not theborrowers that are most frequently associated with delinquencies and defaults.
25

power and is, therefore, of minimal use for achieving the objective of efficient targeting.
Our findings have practical implications. First, exploiting borrower credit information
could vastly improve the efficacy of the borrower-targeting process. Second, our analysis
used credit scores that were significantly lagged relative to the borrowers’ last repayment
entry in order to avoid confounding feedback effects of repayment behavior on observed credit
controls. Practically, using the most recent credit score available at the moment of targeting
is likely to boost the targeting’s effectiveness relative to our results. While credit scores are
generally not available to the DoEd, they could be potentially acquired by making borrowers
sign a credit score disclosure form when applying for a loan. Incorporating such disclosure
into the standard student loan application process could thus provide the DoEd with the
ability to access borrowers’ credit score at a future time, when these borrowers exit school or
enter repayment. As discussed in the Introduction, our analysis is not designed nor should
be interpreted as suggesting that credit scores be used for student loan underwriting; doing
so could undermine the objective of equalizing college access opportunities.
26

Tab
le9:
Pro
bit
Reg
ress
ion
Outp
ut
Var
iable
(1)
(2)
(3)
(4)
(5)
(6)
(7)
(8)
Age
atL
ast
Rep
aym
ent
-0.1
46**
*-0
.062
6*-0
.060
8*-0
.056
9*-0
.050
7-0
.089
9**
-0.0
917*
**-0
.074
0*
(1.8
6e-0
5)(0
.056
7)(0
.063
3)(0
.085
8)(0
.131
)(0
.010
9)(0
.002
86)
(0.0
741)
(Age
atL
ast
Rep
aym
ent)
20.
0026
2***
0.00
113*
0.00
105*
0.00
0961
0.00
0907
0.00
152*
*0.
0015
8***
0.00
116
(5.6
4e-0
5)(0
.070
2)(0
.090
0)(0
.126
)(0
.155
)(0
.023
3)(0
.007
18)
(0.1
42)
Ln(S
tuden
tD
ebt/
1,00
0)-0
.037
7***
2.88
e-05
0.00
686
0.00
742
0.00
672
0.00
585
0.00
904
0.00
453
(1.0
1e-0
9)(0
.996
)(0
.283
)(0
.251
)(0
.315
)(0
.383
)(0
.114
)(0
.576
)
Eve
rR
ecei
ved
Pel
lG
rants
-0.0
200
-0.0
0124
0.01
060.
0134
0.01
970.
0112
0.01
760.
0168
(0.4
00)
(0.9
57)
(0.6
35)
(0.5
50)
(0.3
74)
(0.6
09)
(0.3
74)
(0.5
23)
Avg.
Pel
lG
rants
Rec
eive
d0.
0962
***
0.07
04**
*0.
0632
***
0.05
96**
*0.
0479
***
0.03
56**
*0.
0314
***
0.03
98**
*
(0)
(0)
(0)
(0)
(3.6
1e-0
9)(1
.66e
-05)
(2.3
2e-0
5)(7
.03e
-05)
Dro
pou
t0.
279*
**0.
278*
**0.
266*
**0.
233*
**0.
217*
**0.
201*
**0.
237*
**
(6.4
2e-0
7)(9
.18e
-07)
(2.2
9e-0
6)(4
.39e
-05)
(0.0
0013
9)(0
.000
146)
(0.0
0014
4)
Wit
hB
achel
orD
egre
e-0
.116
***
-0.0
838*
**-0
.079
5**
-0.0
842*
**-0
.070
1**
-0.0
706*
**-0
.082
0**
(0.0
0011
6)(0
.009
26)
(0.0
139)
(0.0
0759
)(0
.031
3)(0
.008
66)
(0.0
308)
Wit
hM
AD
egre
eor
Mor
e-0
.131
***
-0.1
07**
*-0
.098
7***
-0.0
966*
**-0
.060
9-0
.064
2**
(5.3
3e-0
5)(0
.002
46)
(0.0
0604
)(0
.006
44)
(0.1
06)
(0.0
494)
Wit
hD
egre
e(T
yp
eU
nknow
n)
-0.1
20**
*-0
.098
0***
-0.0
946*
**-0
.098
0***
-0.0
832*
*-0
.076
4**
(0.0
0040
1)(0
.006
05)
(0.0
0869
)(0
.006
15)
(0.0
301)
(0.0
121)
27
Tab
le9
–Con
tinued
from
previouspage
Var
iable
(1)
(2)
(3)
(4)
(5)
(6)
(7)
(8)
(1)
Arc
hit
ectu
re0.
127
0.11
50.
119
0.10
30.
0772
0.06
980.
129
(0.2
87)
(0.3
22)
(0.3
09)
(0.3
86)
(0.4
91)
(0.5
13)
(0.3
42)
(2)
Lan
guag
es,
Lit
erat
ure
s,A
rts
0.26
1***
0.25
7***
0.25
5***
0.24
4***
0.25
1***
0.22
1***
0.27
2***
(0.0
0014
3)(0
.000
182)
(0.0
0019
3)(0
.000
456)
(0.0
0050
8)(0
.001
05)
(0.0
0094
5)
(3)
Bio
logy
/Nat
ura
lSci
ence
s0.
129*
0.12
3*0.
127*
0.12
8*0.
152*
*0.
105
0.17
5**
(0.0
682)
(0.0
768)
(0.0
691)
(0.0
722)
(0.0
380)
(0.1
08)
(0.0
338)
(4)
Com
munic
atio
ns/
Jou
rnal
ism
0.20
1**
0.19
5**
0.18
9**
0.17
4**
0.15
7*0.
129*
0.16
9*
(0.0
105)
(0.0
123)
(0.0
148)
(0.0
289)
(0.0
547)
(0.0
686)
(0.0
645)
(5)
Com
pute
rSyst
ems
0.09
260.
0791
0.07
440.
0891
0.10
50.
0455
0.15
0
(0.3
41)
(0.4
14)
(0.4
45)
(0.3
71)
(0.2
86)
(0.5
68)
(0.1
87)
(6)
Cri
min
alJust
ice
0.22
2*0.
221*
0.20
9*0.
204*
0.23
7**
0.12
30.
283*
*
(0.0
765)
(0.0
755)
(0.0
887)
(0.0
840)
(0.0
460)
(0.2
27)
(0.0
275)
(7)
Soci
alSci
ence
s0.
129*
*0.
126*
*0.
124*
*0.
118*
0.13
0**
0.10
0*0.
163*
*
(0.0
344)
(0.0
380)
(0.0
389)
(0.0
564)
(0.0
418)
(0.0
857)
(0.0
287)
(8)
Educa
tion
0.12
3*0.
124*
0.11
9*0.
122*
0.13
7**
0.11
7*0.
109
(0.0
573)
(0.0
520)
(0.0
608)
(0.0
626)
(0.0
410)
(0.0
631)
(0.1
99)
(10)
Busi
nes
s0.
0262
0.01
730.
0129
0.02
130.
0226
-0.0
0550
0.03
35
(0.6
49)
(0.7
60)
(0.8
18)
(0.7
12)
(0.6
98)
(0.9
17)
(0.6
28)
(11)
Hea
lth
Pro
fess
ions
0.08
080.
0805
0.07
690.
0851
0.11
8*0.
0984
0.15
6*
28
Tab
le9
–Con
tinued
from
previouspage
Var
iable
(1)
(2)
(3)
(4)
(5)
(6)
(7)
(8)
(0.2
08)
(0.2
10)
(0.2
27)
(0.1
95)
(0.0
821)
(0.1
15)
(0.0
524)
(12)
Leg
alP
rofe
ssio
ns
0.22
4**
0.22
6**
0.22
6**
0.21
6**
0.23
9**
0.17
9*
(0.0
317)
(0.0
300)
(0.0
296)
(0.0
365)
(0.0
208)
(0.0
559)
(13)
Public
Adm
inis
trat
ion
0.21
2***
0.21
5***
0.20
7**
0.19
5**
0.16
8**
0.13
4*0.
159
(0.0
0812
)(0
.008
20)
(0.0
102)
(0.0
186)
(0.0
293)
(0.0
682)
(0.1
37)
(14)
Lib
eral
Art
s/Sci
ence
s0.
190*
*0.
212*
**0.
202*
**0.
175*
*0.
174*
*0.
163*
*0.
187*
*
(0.0
140)
(0.0
0688
)(0
.009
90)
(0.0
280)
(0.0
358)
(0.0
373)
(0.0
445)
(15)
Per
sonal
/Culinar
ySer
vic
es0.
184*
**0.
162*
**0.
157*
**0.
146*
*0.
151*
*0.
113*
*0.
179*
*
(0.0
0218
)(0
.005
92)
(0.0
0711
)(0
.015
1)(0
.013
2)(0
.040
2)(0
.012
0)
Las
tA
tten
ded
Public,
2-ye
ar0.
0539
***
0.01
51-0
.001
85-0
.011
7-0
.017
2-0
.017
9
(0.0
0737
)(0
.472
)(0
.928
)(0
.564
)(0
.339
)(0
.443
)
Las
tA
tten
ded
Pri
vate
,-0
.010
2-0
.002
77-0
.004
330.
0003
790.
0021
7-0
.003
00
not
-for
-pro
fit
(0.5
77)
(0.8
78)
(0.8
09)
(0.9
83)
(0.8
93)
(0.8
87)
Las
tA
tten
ded
Pri
vate
,fo
r-pro
fit
0.11
1***
0.06
38**
0.03
068.
77e-
07-0
.008
43-0
.010
4
(6.6
7e-0
6)(0
.012
4)(0
.221
)(1
.000
)(0
.706
)(0
.720
)
Eve
rA
tten
ded
Public,
4-ye
ar-0
.020
3-0
.019
0-0
.012
4-0
.013
9-0
.017
6-0
.025
1
(0.3
21)
(0.3
53)
(0.5
49)
(0.4
93)
(0.2
82)
(0.3
08)
Eve
rA
tten
ded
Public,
2-ye
ar-0
.018
2-0
.017
9-0
.010
7-0
.010
50.
0009
99-0
.012
6
(0.2
71)
(0.2
76)
(0.5
09)
(0.5
17)
(0.9
44)
(0.5
16)
29
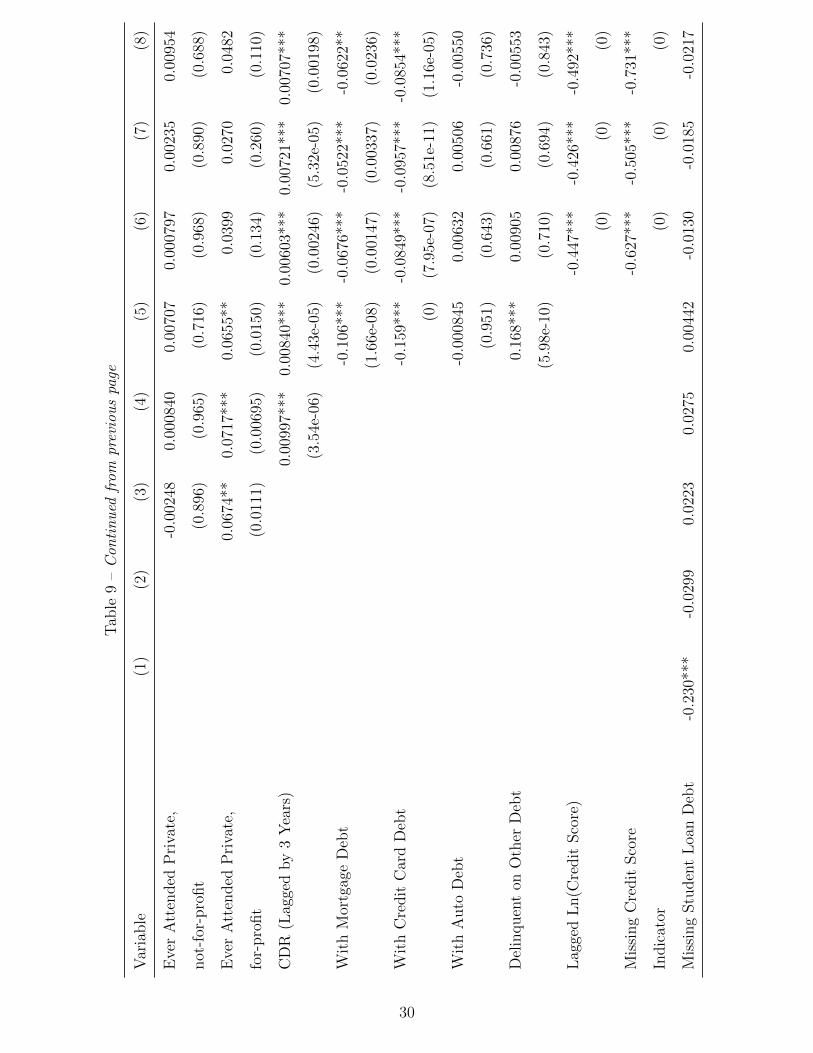
Tab
le9
–Con
tinued
from
previouspage
Var
iable
(1)
(2)
(3)
(4)
(5)
(6)
(7)
(8)
Eve
rA
tten
ded
Pri
vate
,-0
.002
480.
0008
400.
0070
70.
0007
970.
0023
50.
0095
4
not
-for
-pro
fit
(0.8
96)
(0.9
65)
(0.7
16)
(0.9
68)
(0.8
90)
(0.6
88)
Eve
rA
tten
ded
Pri
vate
,0.
0674
**0.
0717
***
0.06
55**
0.03
990.
0270
0.04
82
for-
pro
fit
(0.0
111)
(0.0
0695
)(0
.015
0)(0
.134
)(0
.260
)(0
.110
)
CD
R(L
agge
dby
3Y
ears
)0.
0099
7***
0.00
840*
**0.
0060
3***
0.00
721*
**0.
0070
7***
(3.5
4e-0
6)(4
.43e
-05)
(0.0
0246
)(5
.32e
-05)
(0.0
0198
)
Wit
hM
ortg
age
Deb
t-0
.106
***
-0.0
676*
**-0
.052
2***
-0.0
622*
*
(1.6
6e-0
8)(0
.001
47)
(0.0
0337
)(0
.023
6)
Wit
hC
redit
Car
dD
ebt
-0.1
59**
*-0
.084
9***
-0.0
957*
**-0
.085
4***
(0)
(7.9
5e-0
7)(8
.51e
-11)
(1.1
6e-0
5)
Wit
hA
uto
Deb
t-0
.000
845
0.00
632
0.00
506
-0.0
0550
(0.9
51)
(0.6
43)
(0.6
61)
(0.7
36)
Del
inquen
ton
Oth
erD
ebt
0.16
8***
0.00
905
0.00
876
-0.0
0553
(5.9
8e-1
0)(0
.710
)(0
.694
)(0
.843
)
Lag
ged
Ln(C
redit
Sco
re)
-0.4
47**
*-0
.426
***
-0.4
92**
*
(0)
(0)
(0)
Mis
sing
Cre
dit
Sco
re-0
.627
***
-0.5
05**
*-0
.731
***
Indic
ator
(0)
(0)
(0)
Mis
sing
Stu
den
tL
oan
Deb
t-0
.230
***
-0.0
299
0.02
230.
0275
0.00
442
-0.0
130
-0.0
185
-0.0
217
30

Tab
le9
–Con
tinued
from
previouspage
Var
iable
(1)
(2)
(3)
(4)
(5)
(6)
(7)
(8)
(1.1
3e-0
8)(0
.609
)(0
.723
)(0
.666
)(0
.945
)(0
.836
)(0
.729
)(0
.769
)
Mis
sing
Ma
jor
Info
rmat
ion
0.30
2***
0.29
8***
0.28
8***
0.27
8***
0.26
8***
0.21
8***
(0.0
0022
1)(0
.000
251)
(0.0
0038
9)(0
.000
873)
(0.0
0207
)(0
.005
77)
Tim
eD
um
my
Var
iable
sY
esY
esY
esY
esY
esY
esY
esY
es
Obse
rvat
ions
6,65
16,
651
6,65
16,
651
6,65
16,
651
6,65
15,
362
Pse
udoR
20.
0879
0.16
10.
168
0.17
30.
204
0.26
10.
270
0.23
7
P-v
alu
esin
par
enth
eses
.**
*p<
0.01
,**
p<
0.05
,***p<
0.1.
Dep
end
ent
vari
able
defi
ned
asev
er12
0+d
ays
del
inqu
ent
on
stu
den
tlo
an
deb
tw
ith
in5
yea
rsaft
eren
teri
ng
the
last
rep
aym
ent
spel
l.
31

References
CollegeBoard, “Trends in Higher Education 2013,” Tech. Rep. 140108, 2013.
Dynarski, S., S. Hemelt and J. Hyman, “The Missing Manual: Using National Student
Clearninghouse Data to Track Postsecondary Outcomes,” NBER Working Paper 19522,
2013.
Dynarski, S. and D. Kreisman, “Loans for Educational Opportunity: Making Borrowing
Work for Today’s Students,” Hamilton Project Discussion Paper, 2013.
Gross, J. P. K., O. Cekic, D. Hossler and N. Hillman, “What Matters in Student Loan
Default: A Review of the Research Literature,” Journal of Student Financial Aid, 2009.
Hylands, T., “Student Loan Trends in the Third Federal Reserve District,” Cascade Focus,
2014.
Looney, A. and C. Yannelis, “A Crisis in Student Loans? How Changes in the Characteristics
of Borrowers and in the Institutions They Attended Contributed to Rising Loan Defaults,”
Brookings Papers on Economic Activity, 2015.
Thompson, J. and J. Bricker, “Does Education Loan Debt Influence Household Financial
Distress? An Assessment Using the 2007-09 SCF Panel,” FEDS Working Paper Series,
(90), 2014.
Wei, C. and L. Horn, “Persistence and Attainment of Beginning Students with Pell Grants,”
U.S. Department of Education, National Center for Education Statistics, 2002.
—, “A Profile of Successful Pell Grant Recipients: Time to Bachelor’s Degree and Early
Graduate School Enrollment,” U.S. Department of Education, National Center for Edu-
cation Statistics, 2009.
32

A Appendix
A.1 The Data Set
Our data set pools data from several sources.45 The data set starts with a nationally repre-
sentative random sample of credit bureau records picked and provided by TransUnion, LLC,
for a cohort of 34,891 young individuals who were between ages 23 and 31 in 2004, and spans
the period 1997 through 2010. Individuals are followed biannually between June 1997 and
June 2003, and then in December 2004, June 2007, and December 2008 and 2010. The data
set contains all major credit bureau variables, including credit scores, tradeline debt levels,
and delinquency and severe derogatory records.
In order to capture information on enrollment spells and the institutional-level charac-
teristics associated with each spell, in the next step individual educational records through
2007 are sourced from the DegreeVerify (for degrees) and Student Tracker (for enrollments)
programs by the National Student Clearinghouse (NSC). The NSC educational institution
identifiers allow us to further merge institutional records from the Integrated Postsecondary
Education Data System (IPEDS), such as tuition, sector (e.g., public, private for-profit and
not-for-profit, open admission), and SAT and ACT scores that are summarized at a school
level. In addition, the NSC school identifiers allow us to also merge the historical school-
level 2-year cohort default rates (CDR) collected by the Federal Student Aid (FSA). Finally,
individual-level information about Pell Grants and Federal loans—sourced from the National
Student Loan Data System (NSLDS)—is merged onto the data for Pell Grant and Federal
student loan recipients.
Given that only a subset of individuals in the core TransUnion sample have existing
postsecondary education records, there are important differences between the TransUnion
sample and its NSC subsample. As illustrated in Table 10, out of the 34,891 individuals in the
TransUnion sample, 54 percent (or 18,748 individuals) have an existing NSC postsecondary
education enrollment record. While this college-going rate broadly matches the comparable
rate of 58 percent in the nationally representative American Community Survey (ACS) 2007
45All the merges of individual-level information have been performed by TransUnion, LLC in conjunctionwith the National Student Clearinghouse, the CollegeBoard, and the Department of Education. The mergeshave been done based on a combination of Social Security number, date of birth, and individuals’ first andlast names. None of the variables used to merge individuals across sources is available in our data set .
33

public files, it understates the rate slightly.46 In particular, besides never enrolling in college,
a NSC record might be missing because the postsecondary education institution in which an
individual was/is enrolled does not participate in the NSC Student Tracker or DegreeVerify
programs (see Dynarski et al. (2013)).47 To the extent that the NSC program participation
issues could be systematic, it is helpful to next examine the differences in baseline variables
between the two samples.
Turning to the differences in credit data indicators between the two samples, individuals
represented in the NSC subsample are more frequently associated with student loan balances
(62.8 versus 44.5 percent in the core TransUnion sample) as well as other types of debt,
including auto debt (77.7 vs 72.8 percent), mortgage debt (50.8 vs 44.4 percent), and credit
card debt (95.5 vs 87.9 percent). Mostly in line with expectations, 120 or more days past
due delinquency rates on auto and mortgage debt are lower in the NSC (or college-going)
subsample but, perhaps surprisingly, are higher for credit card debt: 1.1 vs 1.5 percent for
auto loans, 4.3 vs 5.0 percent for mortgages, and 13.3 vs 12.7 percent for credit card debt.
Consistent with these findings, the average maximum credit score per borrower is 36 points
greater in the NSC subsample than in the core credit bureau data (712 vs 676). Taken
together, the observed differences are in line with those one would expect when comparing
the population with a subsample of individuals with at least some post-secondary education.
Table 10: Comparison of the Core Sample with the NSC Subsample
Variable N Mean Std. Dev. Min Max
Age in 2004
All 34,891 27.5 2.6 23 31
NSC 18,748 27.2 2.5 23 31
Ever Attended
Public 4-year (All) 11,022 0.316
Public 2-year (All) 11,805 0.338
Private 4-year Not-for-profit (All) 5,656 0.162
Private For-profit (All) 4,025 0.115
46The ACS estimate is based on a cohort of individuals between ages 25 to 34 in 2007. In our sample,individuals were between ages 26 to 34 in 2007.
47An additional reason for why an enrollment record may not be present in our data is due to datatruncation related to the 2007 NSC data collection cutoff that is specific to our data set . However, thischannel has no effect on comparability of the college-going rate in the NSC sample with the ACS estimate.
34

Table 10 – Continued from previous page
Variable N Mean Std. Dev. Min Max
Private 2-year Not-for-profit (All) 336 0.010
Public 4-year (NSC) 9,643 0.514
Public 2-year (NSC) 10,331 0.551
Private 4-year Not-for-profit (NSC) 4,275 0.228
Private For-profit (NSC) 955 0.051
Private 2-year Not-for-profit (NSC) 120 0.006
Public 4-year (NSC/NSLDS) 10,252 0.547
Public 2-year (NSC/NSLDS) 10,765 0.574
Private 4-year Not-for-profit (NSC/NSLDS) 5,055 0.270
Private For-profit (NSC/NSLDS) 2,245 0.120
Private 2-year Not-for-profit (NSC/NSLDS) 228 0.012
Highest Degree Attained
Dropout 10,337 0.551
Associate’s or Certificate 997 0.053
Bachelor’s 4,338 0.231
Master’s or More 1,217 0.065
With Degree, but Level Unknown 1,859 0.099
Ever Had
Student Debt (All) 15,526 0.445
Auto Debt (All) 25,416 0.728
Mortgage Debt (All) 15,497 0.444
Credit Card Debt (All) 30,683 0.879
Student Debt (NSC) 11,766 0.628
Auto Debt (NSC) 14,558 0.777
Mortgage Debt (NSC) 9,528 0.508
Credit Card Debt (NSC) 17,897 0.955
Ever Delinquent On
Student Debt (All) 4,643 0.299
Auto Debt (All) 527 0.021
Mortgage Debt (All) 1,736 0.112
Credit Card Debt (All) 4,439 0.145
Student Debt (NSC) 3,207 0.273
Auto Debt (NSC) 210 0.014
Mortgage Debt (NSC) 800 0.084
Credit Card Debt (NSC) 2,489 0.139
35

Table 10 – Continued from previous page
Variable N Mean Std. Dev. Min Max
Pell Grants
Ever Had (All) 11,191 0.321
Mean Pell Grants (All) 11,191 2,542.2 1,017.3 400 4,310
Ever Had (NSC) 8,453 0.451
Mean Pell Grants (NSC) 8,453 2,491.3 1,013.7 400 4,310
Maximum Level of Debt in Sample (in 2010 dollars, in Thousands)
Student Debt (All) 14,522 26.6 35.2 0.001 438.6
Auto Debt (All) 23,370 22.5 15.9 0.048 528.8
Mortgage Debt (All) 15,069 212.9 175.1 0.164 3976.3
Credit Card Debt (All) 27,172 6.8 9.2 0.000 253.7
Student Debt (NSC) 11,240 29.9 37.5 0.001 438.6
Auto Debt (NSC) 13,632 22.0 14.8 0.067 528.8
Mortgage Debt (NSC) 9,355 228.2 177.6 2.704 3976.3
Credit Card Debt (NSC) 16,756 7.4 9.4 0.000 253.7
Maximum Credit Score in the Sample
ALL 33,950 670.7 136.9 271 897
NSC 18,641 706.6 124.5 276 897
Not in NSC, with Student Debt 3,725 628.3 141.6 271 887
Students in Delinquency Status
All 4,643 0.299
Based on TransUnion Information (All) 3,486 0.225
In Default on their Federal Loans (All) 2,858 0.184
NSC 3,207 0.273
Based on TransUnion Information (NSC) 2,488 0.211
In Default on their Federal Loans (NSC) 1,912 0.163
Diving deeper into the potential systematic bias due to reporting issues, we next turn
to the group of 3,760 borrowers (or fully 24 percent of all student loan borrowers in our
sample) who have existing student loan debt records in the credit bureau files and/or student
loan records in the NSLDS, but no NSC records. Comparing the characteristics of these
borrowers (shown in Table 11) with characteristics of student loan borrowers with existing
NSC records (shown in Table 10) provides the best available gauge of the type of bias posed
in our data set by the NSC reporting issues. As can be seen, in our sample, student loan
36
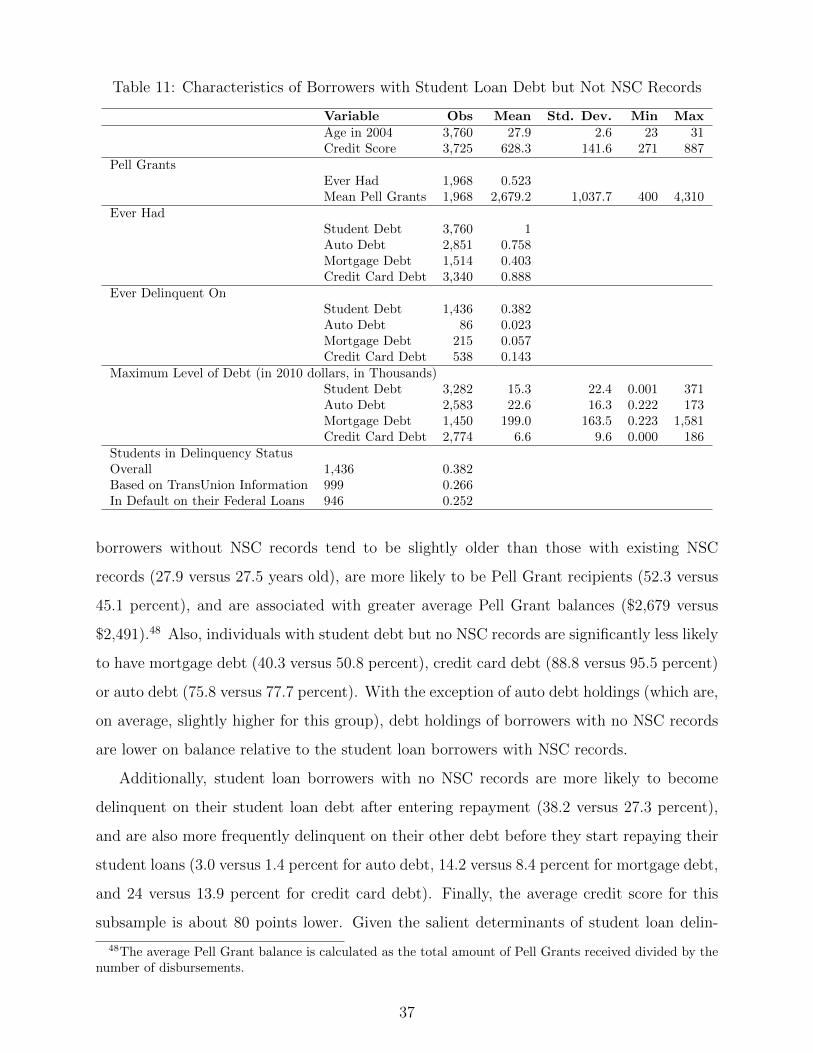
Table 11: Characteristics of Borrowers with Student Loan Debt but Not NSC Records
Variable Obs Mean Std. Dev. Min MaxAge in 2004 3,760 27.9 2.6 23 31Credit Score 3,725 628.3 141.6 271 887
Pell GrantsEver Had 1,968 0.523Mean Pell Grants 1,968 2,679.2 1,037.7 400 4,310
Ever HadStudent Debt 3,760 1Auto Debt 2,851 0.758Mortgage Debt 1,514 0.403Credit Card Debt 3,340 0.888
Ever Delinquent OnStudent Debt 1,436 0.382Auto Debt 86 0.023Mortgage Debt 215 0.057Credit Card Debt 538 0.143
Maximum Level of Debt (in 2010 dollars, in Thousands)Student Debt 3,282 15.3 22.4 0.001 371Auto Debt 2,583 22.6 16.3 0.222 173Mortgage Debt 1,450 199.0 163.5 0.223 1,581Credit Card Debt 2,774 6.6 9.6 0.000 186
Students in Delinquency StatusOverall 1,436 0.382Based on TransUnion Information 999 0.266In Default on their Federal Loans 946 0.252
borrowers without NSC records tend to be slightly older than those with existing NSC
records (27.9 versus 27.5 years old), are more likely to be Pell Grant recipients (52.3 versus
45.1 percent), and are associated with greater average Pell Grant balances ($2,679 versus
$2,491).48 Also, individuals with student debt but no NSC records are significantly less likely
to have mortgage debt (40.3 versus 50.8 percent), credit card debt (88.8 versus 95.5 percent)
or auto debt (75.8 versus 77.7 percent). With the exception of auto debt holdings (which are,
on average, slightly higher for this group), debt holdings of borrowers with no NSC records
are lower on balance relative to the student loan borrowers with NSC records.
Additionally, student loan borrowers with no NSC records are more likely to become
delinquent on their student loan debt after entering repayment (38.2 versus 27.3 percent),
and are also more frequently delinquent on their other debt before they start repaying their
student loans (3.0 versus 1.4 percent for auto debt, 14.2 versus 8.4 percent for mortgage debt,
and 24 versus 13.9 percent for credit card debt). Finally, the average credit score for this
subsample is about 80 points lower. Given the salient determinants of student loan delin-
48The average Pell Grant balance is calculated as the total amount of Pell Grants received divided by thenumber of disbursements.
37
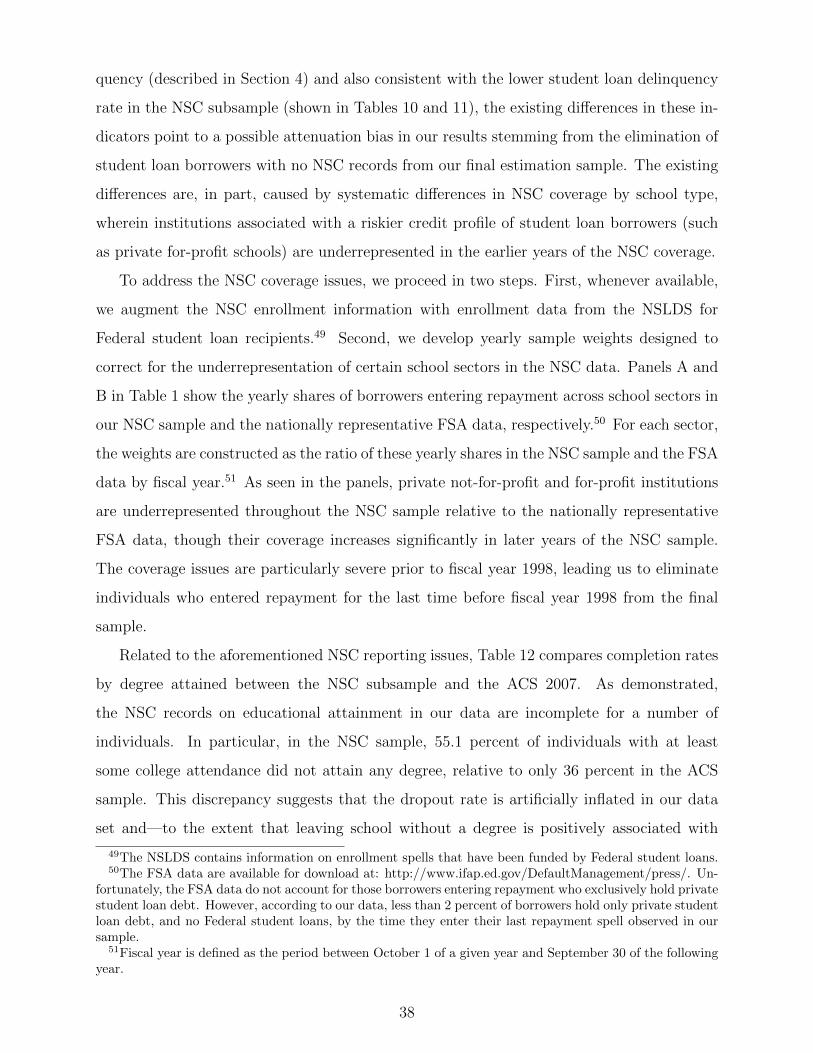
quency (described in Section 4) and also consistent with the lower student loan delinquency
rate in the NSC subsample (shown in Tables 10 and 11), the existing differences in these in-
dicators point to a possible attenuation bias in our results stemming from the elimination of
student loan borrowers with no NSC records from our final estimation sample. The existing
differences are, in part, caused by systematic differences in NSC coverage by school type,
wherein institutions associated with a riskier credit profile of student loan borrowers (such
as private for-profit schools) are underrepresented in the earlier years of the NSC coverage.
To address the NSC coverage issues, we proceed in two steps. First, whenever available,
we augment the NSC enrollment information with enrollment data from the NSLDS for
Federal student loan recipients.49 Second, we develop yearly sample weights designed to
correct for the underrepresentation of certain school sectors in the NSC data. Panels A and
B in Table 1 show the yearly shares of borrowers entering repayment across school sectors in
our NSC sample and the nationally representative FSA data, respectively.50 For each sector,
the weights are constructed as the ratio of these yearly shares in the NSC sample and the FSA
data by fiscal year.51 As seen in the panels, private not-for-profit and for-profit institutions
are underrepresented throughout the NSC sample relative to the nationally representative
FSA data, though their coverage increases significantly in later years of the NSC sample.
The coverage issues are particularly severe prior to fiscal year 1998, leading us to eliminate
individuals who entered repayment for the last time before fiscal year 1998 from the final
sample.
Related to the aforementioned NSC reporting issues, Table 12 compares completion rates
by degree attained between the NSC subsample and the ACS 2007. As demonstrated,
the NSC records on educational attainment in our data are incomplete for a number of
individuals. In particular, in the NSC sample, 55.1 percent of individuals with at least
some college attendance did not attain any degree, relative to only 36 percent in the ACS
sample. This discrepancy suggests that the dropout rate is artificially inflated in our data
set and—to the extent that leaving school without a degree is positively associated with
49The NSLDS contains information on enrollment spells that have been funded by Federal student loans.50The FSA data are available for download at: http://www.ifap.ed.gov/DefaultManagement/press/. Un-
fortunately, the FSA data do not account for those borrowers entering repayment who exclusively hold privatestudent loan debt. However, according to our data, less than 2 percent of borrowers hold only private studentloan debt, and no Federal student loans, by the time they enter their last repayment spell observed in oursample.
51Fiscal year is defined as the period between October 1 of a given year and September 30 of the followingyear.
38
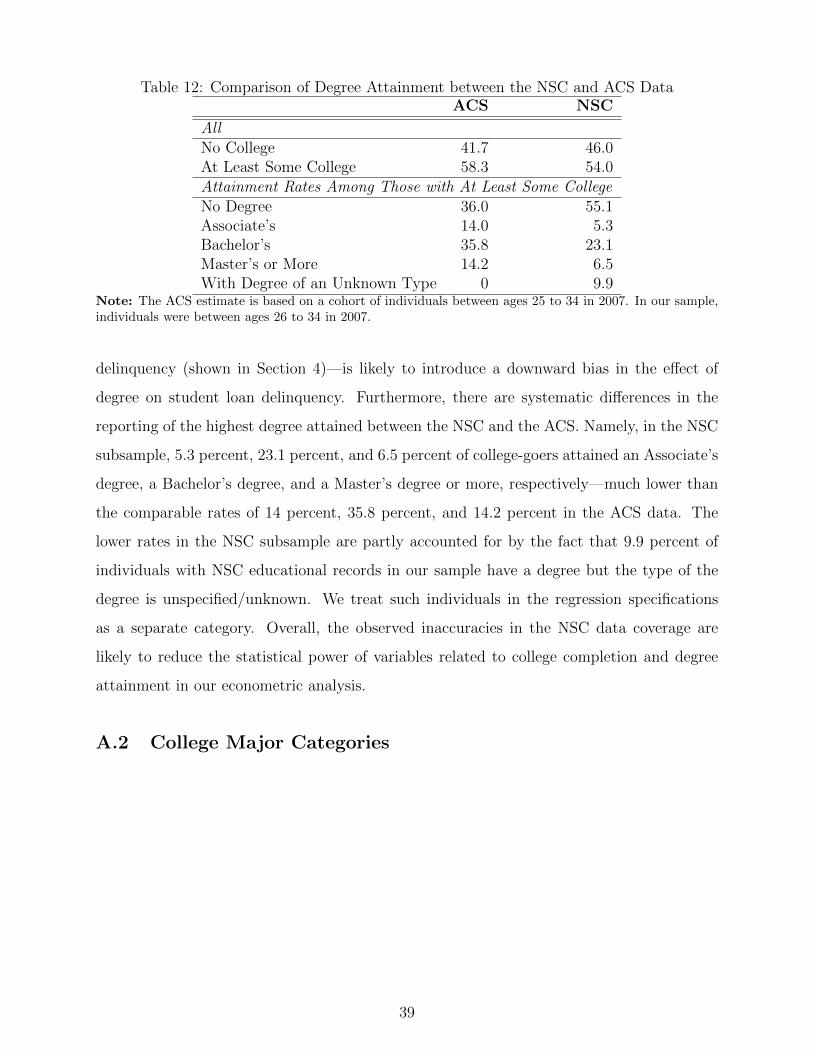
Table 12: Comparison of Degree Attainment between the NSC and ACS DataACS NSC
AllNo College 41.7 46.0At Least Some College 58.3 54.0Attainment Rates Among Those with At Least Some CollegeNo Degree 36.0 55.1Associate’s 14.0 5.3Bachelor’s 35.8 23.1Master’s or More 14.2 6.5With Degree of an Unknown Type 0 9.9
Note: The ACS estimate is based on a cohort of individuals between ages 25 to 34 in 2007. In our sample,individuals were between ages 26 to 34 in 2007.
delinquency (shown in Section 4)—is likely to introduce a downward bias in the effect of
degree on student loan delinquency. Furthermore, there are systematic differences in the
reporting of the highest degree attained between the NSC and the ACS. Namely, in the NSC
subsample, 5.3 percent, 23.1 percent, and 6.5 percent of college-goers attained an Associate’s
degree, a Bachelor’s degree, and a Master’s degree or more, respectively—much lower than
the comparable rates of 14 percent, 35.8 percent, and 14.2 percent in the ACS data. The
lower rates in the NSC subsample are partly accounted for by the fact that 9.9 percent of
individuals with NSC educational records in our sample have a degree but the type of the
degree is unspecified/unknown. We treat such individuals in the regression specifications
as a separate category. Overall, the observed inaccuracies in the NSC data coverage are
likely to reduce the statistical power of variables related to college completion and degree
attainment in our econometric analysis.
A.2 College Major Categories
39

Major Category Obs(1) Architecture and urban planning; construction trades 35(2) English, foreign languages and literatures; visual and performing arts;
philosophy, religion, and theology223
(3) Biological, biomedical, and nature conservation studies; natural sciences;agriculture
220
(4) Communications and journalism; communications technologies and tech-nicians
152
(5) Computer and information systems 72(6) Criminal justice 49(7) Economics; geography, history, political science, sociology, and social
sciences; psychology; area, ethnic, and gender studies; parks, recreation,and leisure studies; family and consumer sciences
436
(8) Education 259(9) Engineering; engineering technologies and trades; mechanic and repair
technologies; precision production151
(10) Business, management, and marketing 547(11) Health professions and related sciences 311(12) Legal professions and studies 75(13) Public administration and social work 59(14) Liberal arts and sciences 74(15) Personal and culinary services; transportation and materials moving;
other958
Total 3,621
40
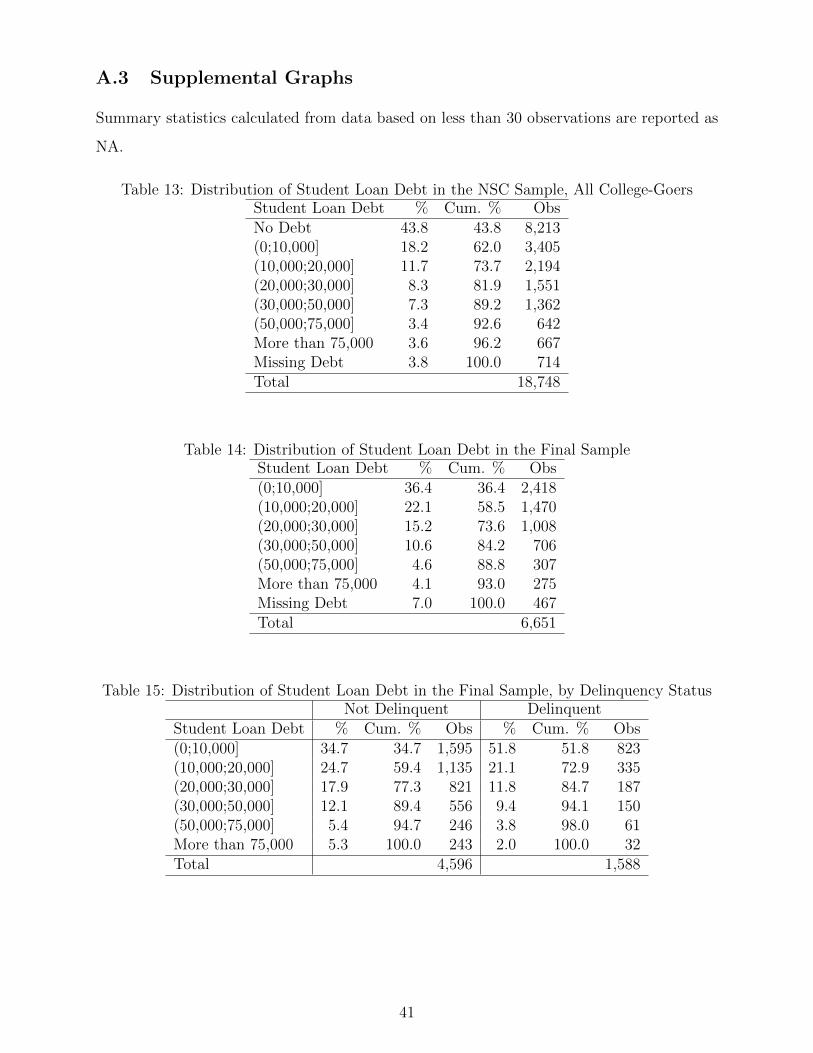
A.3 Supplemental Graphs
Summary statistics calculated from data based on less than 30 observations are reported as
NA.
Table 13: Distribution of Student Loan Debt in the NSC Sample, All College-GoersStudent Loan Debt % Cum. % ObsNo Debt 43.8 43.8 8,213(0;10,000] 18.2 62.0 3,405(10,000;20,000] 11.7 73.7 2,194(20,000;30,000] 8.3 81.9 1,551(30,000;50,000] 7.3 89.2 1,362(50,000;75,000] 3.4 92.6 642More than 75,000 3.6 96.2 667Missing Debt 3.8 100.0 714Total 18,748
Table 14: Distribution of Student Loan Debt in the Final SampleStudent Loan Debt % Cum. % Obs(0;10,000] 36.4 36.4 2,418(10,000;20,000] 22.1 58.5 1,470(20,000;30,000] 15.2 73.6 1,008(30,000;50,000] 10.6 84.2 706(50,000;75,000] 4.6 88.8 307More than 75,000 4.1 93.0 275Missing Debt 7.0 100.0 467Total 6,651
Table 15: Distribution of Student Loan Debt in the Final Sample, by Delinquency StatusNot Delinquent Delinquent
Student Loan Debt % Cum. % Obs % Cum. % Obs(0;10,000] 34.7 34.7 1,595 51.8 51.8 823(10,000;20,000] 24.7 59.4 1,135 21.1 72.9 335(20,000;30,000] 17.9 77.3 821 11.8 84.7 187(30,000;50,000] 12.1 89.4 556 9.4 94.1 150(50,000;75,000] 5.4 94.7 246 3.8 98.0 61More than 75,000 5.3 100.0 243 2.0 100.0 32Total 4,596 1,588
41
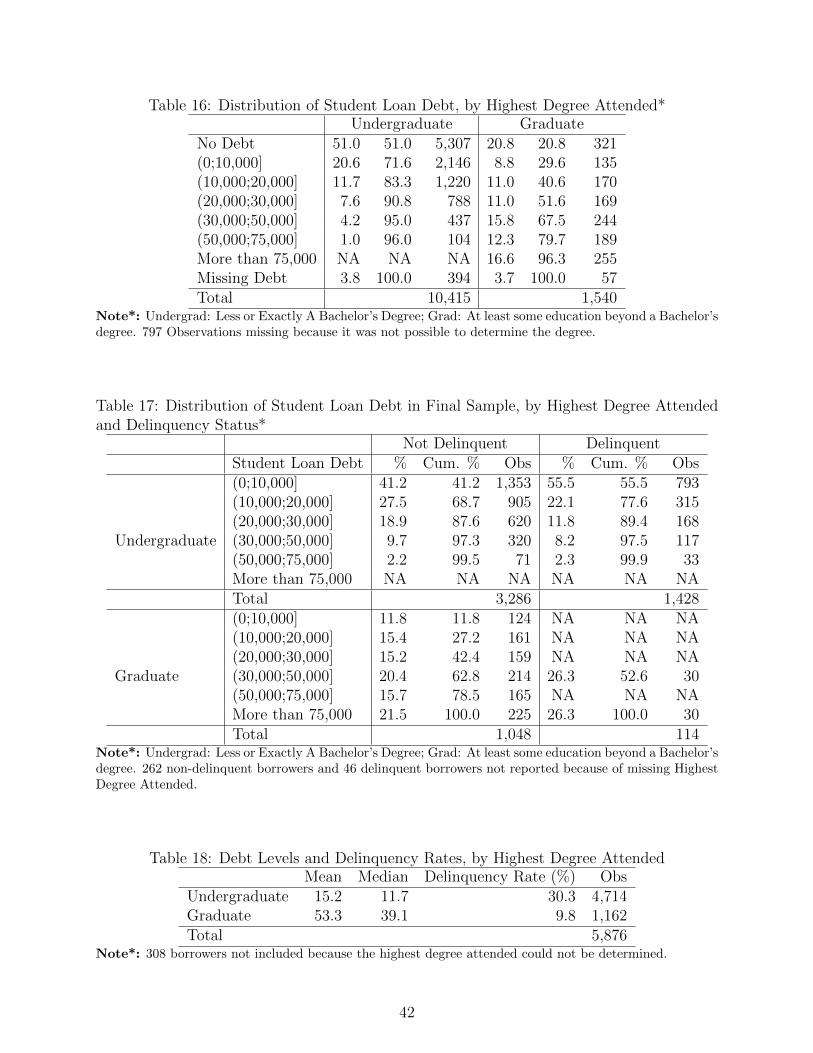
Table 16: Distribution of Student Loan Debt, by Highest Degree Attended*Undergraduate Graduate
No Debt 51.0 51.0 5,307 20.8 20.8 321(0;10,000] 20.6 71.6 2,146 8.8 29.6 135(10,000;20,000] 11.7 83.3 1,220 11.0 40.6 170(20,000;30,000] 7.6 90.8 788 11.0 51.6 169(30,000;50,000] 4.2 95.0 437 15.8 67.5 244(50,000;75,000] 1.0 96.0 104 12.3 79.7 189More than 75,000 NA NA NA 16.6 96.3 255Missing Debt 3.8 100.0 394 3.7 100.0 57Total 10,415 1,540
Note*: Undergrad: Less or Exactly A Bachelor’s Degree; Grad: At least some education beyond a Bachelor’sdegree. 797 Observations missing because it was not possible to determine the degree.
Table 17: Distribution of Student Loan Debt in Final Sample, by Highest Degree Attendedand Delinquency Status*
Not Delinquent DelinquentStudent Loan Debt % Cum. % Obs % Cum. % Obs
Undergraduate
(0;10,000] 41.2 41.2 1,353 55.5 55.5 793(10,000;20,000] 27.5 68.7 905 22.1 77.6 315(20,000;30,000] 18.9 87.6 620 11.8 89.4 168(30,000;50,000] 9.7 97.3 320 8.2 97.5 117(50,000;75,000] 2.2 99.5 71 2.3 99.9 33More than 75,000 NA NA NA NA NA NATotal 3,286 1,428
Graduate
(0;10,000] 11.8 11.8 124 NA NA NA(10,000;20,000] 15.4 27.2 161 NA NA NA(20,000;30,000] 15.2 42.4 159 NA NA NA(30,000;50,000] 20.4 62.8 214 26.3 52.6 30(50,000;75,000] 15.7 78.5 165 NA NA NAMore than 75,000 21.5 100.0 225 26.3 100.0 30Total 1,048 114
Note*: Undergrad: Less or Exactly A Bachelor’s Degree; Grad: At least some education beyond a Bachelor’sdegree. 262 non-delinquent borrowers and 46 delinquent borrowers not reported because of missing HighestDegree Attended.
Table 18: Debt Levels and Delinquency Rates, by Highest Degree AttendedMean Median Delinquency Rate (%) Obs
Undergraduate 15.2 11.7 30.3 4,714Graduate 53.3 39.1 9.8 1,162Total 5,876
Note*: 308 borrowers not included because the highest degree attended could not be determined.
42

Table 19: Distribution of Student Loan Debt, by Highest Degree Obtained*With College, No Bachelor’s With At Least Bachelor’s
No Debt 56.6 56.6 4,250 31.3 31.3 1,401(0;10,000] 22.8 79.4 1,716 12.7 44.0 567(10,000;20,000] 9.0 88.4 679 16.0 60.0 716(20,000;30,000] 4.2 92.7 318 14.3 74.3 641(30,000;50,000] 2.6 95.2 194 10.9 85.2 488(50,000;75,000] 0.8 96.0 57 5.3 90.5 237More than 75,000 NA NA NA 5.9 96.4 263Missing Debt 3.9 100.0 290 3.6 100.0 162Total 7,515 4,475
Note*: With college, No B.A.: dropouts, Certificates, Associate’s Degree holders; With at least B.A.:B.A. and advanced degrees. 762 observations not reported because highest degree obtained could not bedetermined.
Table 20: Distribution of Student Loan Debt in Final Sample, by Highest Degree Obtainedand Delinquency Status*
Not Delinquent DelinquentStudent Loan Debt % Cum. % Obs % Cum. % Obs
With College, No BA
(0;10,000] 54.6 54.6 952 62.0 62.0 764(10,000;20,000] 23.5 78.2 410 21.8 83.8 269(20,000;30,000] 11.9 90.1 208 8.9 92.7 110(30,000;50,000] 7.5 97.6 130 5.2 97.9 64(50,000;75,000] 1.8 99.4 32 NA NA NAMore than 75,000 NA NA NA NA NA NATotal 1,742 1,233
With At Least BA
(0;10,000] 20.2 20.2 527 12.9 12.9 40(10,000;20,000] 25.4 45.6 661 17.8 30.7 55(20,000;30,000] 22.0 67.7 573 22.0 52.8 68(30,000;50,000] 15.6 83.2 405 26.9 79.6 83(50,000;75,000] 7.9 91.1 205 10.4 90.0 32More than 75,000 8.9 100.0 232 10.0 100.0 31Total 2,603 309
Note*: With college, No B.A.: dropouts, Certificates, Associate’s Degree holders; With at least B.A.: B.A.and advanced degrees. 251 non-delinquent borrowers and 46 delinquent borrowers because highest degreeobtained could not be determined.
Table 21: Debt Levels and Delinquency Rates in the Final Sample, by Highest DegreeObtained
Mean Median Delinquency Rate (%) ObsWith College, No BA 12.5 8.0 41.4 2,975With At Least BA 33.2 22.0 10.6 2,912Total 5,887
Note*: 297 borrowers not included because highest degree obtained could not be determined.
43

Table 22: Distribution of Student Loan Debt in Final Sample (Most Disaggregated), byHighest Degree Obtained and Delinquency Status*
Not Delinquent DelinquentStudent Loan Debt % Cum. % Obs % Cum. % Obs
Dropouts
(0;10,000] 54.9 54.9 811 63.0 63.0 725(10,000;20,000] 22.5 77.4 333 20.4 83.4 235(20,000;30,000] 12.3 89.7 182 9.3 92.7 107(30,000;50,000] 7.6 97.3 112 5.2 97.9 60(50,000;75,000] 2.1 99.4 31 NA NA NAMore than 75,000 NA NA NA NA NA NATotal 1,478 1,151
Associate’s/Certificate
(0;10,000] 53.4 53.4 141 47.6 47.6 39(10,000;20,000] 29.2 82.6 77 41.5 89.0 34(20,000;30,000] NA NA NA NA NA NA(30,000;50,000] NA NA NA NA NA NA(50,000;75,000] NA NA NA NA NA NAMore than 75,000 NA NA NA NA NA NATotal 264 82
Bachelor’s
(0;10,000] 24.1 24.1 426 14.5 14.5 33(10,000;20,000] 29.8 53.9 526 20.7 35.2 47(20,000;30,000] 25.3 79.2 447 26.9 62.1 61(30,000;50,000] 13.4 92.6 236 28.6 90.7 65(50,000;75,000] 4.8 97.3 84 NA NA NAMore than 75,000 2.7 100.0 47 NA NA NATotal 1,766 227
More than Bachelor’s
(0;10,000] 15.1 15.1 80 NA NA NA(10,000;20,000] 16.0 31.1 85 NA NA NA(20,000;30,000] 16.8 47.8 89 NA NA NA(30,000;50,000] 19.6 67.4 104 NA NA NA(50,000;75,000] 14.3 81.7 76 NA NA NAMore than 75,000 18.3 100.0 97 NA NA NATotal 531 41
Note*: 557 non-delinquent and 87 delinquent borrowers not reported because not able to determine theexact degree obtained.
Table 23: Debt Levels and Delinquency Rates in the Final Sample(Most Disaggregated), byHighest Degree Obtained
Mean Median Delinquency Rate (%) ObsDropouts 12.5 7.9 43.8 2,629Associate’s/Certificate 12.3 9.2 23.7 346Bachelor’s 24.1 19.6 11.4 1,993More than Bachelor’s 48.3 34.2 7.2 572Total 5,540
Note*: 664 borrowers not reported because the exact highest degree obtained could not be determined.
44

0.0
2.0
4.0
6
0 20 40 60 80 100Student Loan Debt
All Delinquent
Current
0.2
.4.6
.81
0 50 100 150 200debt
All Delinquent
Current
CDF
Debt in Thousands of 2010 Dollars
Student Loan Debt Distribution
®
Figure 7: Student Loan Debt Distribution: Final Sample
0.0
1.0
2.0
3.0
4.0
5
0 50 100 150 200Student Loan Debt
Undergraduate Graduate
0.2
.4.6
.81
0 50 100 150 200 250debt
Undergraduate Graduate
CDF
Debt in Thousands of 2010 Dollars
Student Loan Debt Distribution by Highest Degree Attended
®
Figure 8: Student Loan Debt Distribution by Highest Degree Attended : Final Sample
45

0.0
2.0
4.0
6
0 20 40 60 80 100Student Loan Debt
Delinquent Current
PDF−Undergraduates
0.0
05
.01
.01
5
0 50 100 150 200 250Student Loan Debt
Delinquent Current
PDF−Graduates
0.2
.4.6
.81
0 20 40 60 80 100debt
Delinquent Current
CDF−Undergradutes
0.2
.4.6
.81
0 50 100 150 200 250debt
Delinquent Current
CDF−Gradutes
Debt in Thousands of 2010 Dollars
St. Loan Debt Dist. by Delinq. Status & Highest Degree Attended
®
Figure 9: Student Loan Debt Distribution by Delinquency Status and Highest Degree At-tended : Final Sample
0.0
2.0
4.0
6.0
8
0 50 100 150 200Student Loan Debt
College, No BA At Least BA
0.2
.4.6
.81
0 50 100 150 200 250debt
College, No BA At Least BA
CDF
Debt in Thousands of 2010 Dollars
St. Loan Debt Dist. by Highest Degree Obtained
®
Figure 10: Student Loan Debt Distribution by Highest Degree Obtained : Final Sample
46

0.0
2.0
4.0
6.0
8
0 20 40 60 80 100Student Loan Debt
Delinquent Current
PDF−College, No BA
0.0
1.0
2.0
3
0 50 100 150 200 250Student Loan Debt
Delinquent Current
PDF−At Least BA
0.2
.4.6
.81
0 20 40 60 80 100debt
Delinquent Current
CDF−College, No BA
0.2
.4.6
.81
0 50 100 150 200 250debt
Delinquent Current
CDF−At Least BA
Debt in Thousands of 2010 Dollars
St. Loan Debt Dist. by Delinq. Status & Highest Degree Obtained
®
Figure 11: Student Loan Debt Distribution by Highest Degree Obtained : Final Sample
47