a true picture - h&awoa · pdf filemaking a tally sheet .....8 making a map ... a true...
TRANSCRIPT

A TRUE PICTURETaking Inventory of Your Woodlot
EASTERN ONTARIOMODEL FOREST

ISBN 1-896392-48-2
Published by:Eastern Ontario Model ForestP.O. Bag 2111Kemptville, OntarioK0G 1J0Tel. (613) 258-8241, Fax (613) 258-8363Email: [email protected]
© 1997, Eastern Ontario Model Forest

A TRUE PICTURETaking Inventory of Your Woodlot
EASTERN ONTARIOMODEL FOREST
ACKNOWLEDGEMENTSThis publication was prepared as a co-operative effort between thefollowing partners:
• Jon Williams, forest consultant, Pembroke, was the primary author ofthis report.
Editorial and technical reviews were provided by:
• Jim Brown, Dendron Resource Surveys, Inc., Ottawa• Martin Streit, Domtar Inc., Cornwall• Jamie Fortune, Wildlife Habitat Canada, Ottawa• Lynn McIntyre, Ontario Woodlot Association, Manotick• Eric Boysen, Ontario Ministry of Natural Resources, Kemptville• Patti Story, Eastern Ontario Model Forest, Kemptville• Bruce Wells, Windfall Communications, Morrisburg
Desktop publishing services were provided by Laurie Dool andDiane Downey of the LandOwner Resource Centre in Manotick.

▲ ▲ ▲ ▲ ▲ ▲ ▲ ▲ ▲ ▲ ▲ ▲ ▲ ▲ ▲ ▲ ▲ ▲ ▲ ▲ ▲ A TRUE PICTURE — Taking Inventory of Your Woodlot
INTRODUCTION
This is a guide for those who require a detailed inventory of theirwoodlot in order to develop a woodlot management plan. Aninventory provides information on the composition, quality and
quantity of timber and other natural features. Conducting a forest inventoryis an essential step in the development of a woodlot management plan.
When using this manual, consider your needs and abilities, and howyou can develop a woodlot inventory that will best meet yourrequirements. The product of the work described here is a managementinventory that will provide a guide for decision making in an ongoingwoodlot management program.
Two case studies will lead you through the process of planning andexecuting a forest inventory or “cruise” (as it’s known in the forestindustry). The text outlines steps for obtaining or creating a base map. Itgives pointers on field work and compilation procedures. It will help youdesign the cruise including objectives, plot size and configuration, plotinterval, cruise line pattern, data collection, measurement precision, tallysheets and compilation forms.
This manual is based, in part, on a course outline prepared byGary Murchison of Formetrics Consulting in Thunder Bay, Ontario.


▲ ▲ ▲ ▲ ▲ ▲ ▲ ▲ ▲ ▲ ▲ ▲ ▲ ▲ ▲ ▲ ▲ ▲ ▲ ▲ ▲ A TRUE PICTURE — Taking Inventory of Your Woodlot
TABLE OF CONTENTS
The Management Process................................................................................1Case Studies .....................................................................................................2Do-It-Yourself Inventory — Mike’s Story.........................................................3
Sampling System...................................................................................3Field Measurements...............................................................................5Measuring Equipment ...........................................................................5Quality Assessment................................................................................7Collecting Other Data ...........................................................................8Making a Tally Sheet .............................................................................8Making a Map.....................................................................................10
Base Map ........................................................................................10Preliminary Woodlot Map ...............................................................10
Field Work ...........................................................................................12Compass Skills.................................................................................12Boundary Location ..........................................................................12Cruising ..........................................................................................13Compilation ....................................................................................14
Hiring a Professional — Bill’s Story................................................................20Finding the Right Person .....................................................................20Working with a Consultant..................................................................20
Summary ........................................................................................................23References Cited ............................................................................................25Resources that Complement this Manual .....................................................25Further Reading .............................................................................................25Appendix 1 .....................................................................................................27Appendix 2 .....................................................................................................28
Making and Using Your Own Cruising Stick .................................................28Calibrations of a Biltmore Stick ....................................................................30Calibration of a Merrit Staff Hypsometer ......................................................31
Appendix 3 .....................................................................................................32Sample Tally Sheets
Appendix 4 .....................................................................................................33Code for Tree Species Names
Appendix 5 .....................................................................................................34Summary of Sample Heights
Appendix 6 .....................................................................................................35Compartment Summary Sheet
Appendix 7a ...................................................................................................36Appendix 7b ...................................................................................................37Appendix 7c ...................................................................................................38Appendix 8 .....................................................................................................39Appendix 9 .....................................................................................................40


▲ ▲ ▲ ▲ ▲ ▲ ▲ ▲ ▲ ▲ ▲ ▲ ▲ ▲ ▲ ▲ ▲ ▲ ▲ ▲ ▲ A TRUE PICTURE — Taking Inventory of Your Woodlot
1
THE MANAGEMENT PROCESS
The management of any enterprise, whether it’s a large corporation, afamily picnic, or a woodlot, can be described as a simple, three-stepprocess. First, where do you want to go? Set a clear goal of practical
and achievable objectives. Second, how are you going to get there? Developstrategies that will help you reach your objectives. Third, do it! Build yourstrategy into an action plan and put it to work.
All too often, the last step in this process is the one taken first. A burst ofenthusiasm creates all sorts of activity without producing a clear idea ofwhat is to be achieved. The result is usually a series of frustratingexperiences that waste time, money and effort. Action must be directed byobjectives which are carefully thought out.
In managing a woodlot, taking stock by conducting a forest inventoryhas to be the first part of the process. It is not possible to set realisticobjectives without having a clear understanding of what you have to workwith. You may foresee the production of pine sawlogs, but if a closerexamination of your woodlot reveals that the bulk of your timber is notpine, then you need to rethink your objectives.
Unlike a store, a forest has no aisles or product labels. Taking stock of awoodlot is a process that requires a great deal of preparation and effort.Specialized skills and knowledge are needed to develop a clear picture of thetype and quantity of growing stock available.

A TRUE PICTURE — Taking Inventory of Your Woodlot ▲ ▲ ▲ ▲ ▲ ▲ ▲ ▲ ▲ ▲ ▲ ▲ ▲ ▲ ▲ ▲ ▲ ▲ ▲ ▲ ▲
2
CASE STUDIES
We will review case studies involving two woodlot owners and thedifferent approaches they use in taking stock of their forest holdings.Each has his own set of circumstances, needs and objectives.
Mike has been a carpenter for nearly twenty years. He recently inheritedthe farm that has been in his family for generations. The neighbours oftensaid, “It was never much of a farm, but it has a good bush on it.” In fact,over the years, it was often the logs and pulp from the woodlot that kept thefamily solvent during hard times.
In spite of the opportunity for quick money, his father and grandfathernever yielded to the temptation to liquidate the woodlot. Now Mike hastaken on the responsibility for the family heritage. The stewardship roleappeals to him, and the profit from the woodlot will help to supplement hisincome during the slow winter season. However, before he can make any bigplans to become a forest manager, Mike needs to know more about what hehas to work with.
Our second case study involves Bill, a retired engineer. After 37 years inthe petro-chemical industry, he has finally retired and followed his dream,buying about 30 hectares of land near his home.
Bill has been reading everything he can about trees and woodlots. Herealizes that he needs some kind of documented plan for his property if hisefforts are to have any hope of bearing fruit in the future. Again, the first stepin developing his plan is to get some kind of understanding of his resources.
The job of conducting a cruise, or woodlot inventory, sounds prettyrigorous — a physically demanding task. In addition, Bill probably doesn’thave all the knowledge he needs to do the job. For example, he knows thatthere is a big difference in the value of sugar maple and red maple, but he isnot sure that he could tell them apart. And Bill has spent a whole careeranalyzing numbers and using information; he is very aware of all the pitfallsand errors that are possible in data collection and analysis.
Both Bill and Mike realize that there is much more to the managementof a woodlot than making dreams come true. It is a business venture withfixed overhead costs, such as taxes and boundary maintenance.Individually, these items may be small, but they get very large as theycompound over time, especially if the woodlot goes through an extendedperiod when it produces no income. As in any other business venture, theold saying is true, “If you are not going forward, you are going backward.” Aregular income is necessary if the property is to produce a profit.
▲ ▲ ▲ ▲ ▲ ▲ ▲ ▲ ▲ ▲ ▲ ▲ ▲ ▲ ▲ ▲ ▲ ▲ ▲ ▲ ▲ A TRUE PICTURE — Taking Inventory of Your Woodlot
3
DO-IT-YOURSELF INVENTORY — MIKE’S STORY
Mike began reading about how to conduct a forest inventory. Some ofthe material was confusing to say the least. The text was sprinkledwith long mathematical formulae and strange terms like
“randomness” and “point sampling.” Finally, he decided to look at this jobone step at a time, starting with the simplest approach possible.
As a carpenter, Mike was well aware of the importance of planning hiswork in clear and logical steps. His first step in planning an inventory was todetermine what exactly he should have when the job was done. The forestrybooks indicated that some specific inventory products are required to planand manage a woodlot.
Mike would need a map of his property which would show the boundariesof his woodlot, and smaller internal compartments called stands. (These areareas where the type, age and density of tree cover are similar and can bemanaged in the same way.)
For each stand he would need information on the species, size, quantityand quality of trees. This information should allow him to determine thevolume of timber he had of each species. He would also need someorganized method of recording and summarizing all this information so thatit made sense and could be used in making plans and decisions.
SAMPLING SYSTEMIf Mike only had to inventory that little patch of timber between the creekand the fence on the west side of his property, it wouldn’t be difficult. Hecould simply measure all of the trees. While this approach is fine for smallareas, it can’t be applied to entire woodlots as it would take too long.Perhaps the solution was to measure part of the area (a sample) and multiplythe findings to get an estimate for the whole stand.
Mike thought about the work involved in marking out a one-hectarepatch of his forest. It would be quite a job to measure all of the distancesand angles. In most places the entire length of a one-hectare square wouldnot be visible. And what if that one hectare was a little different from therest of the stand, perhaps a bit wetter or drier? It would throw the estimateoff. What Mike really needed was many small samples from stands scatteredthroughout his woodlot. He took one of the basic plans he found in aforestry book, called a plot sampling, and made a few minor changes thatwould allow him to sample all of his property.

A TRUE PICTURE — Taking Inventory of Your Woodlot ▲ ▲ ▲ ▲ ▲ ▲ ▲ ▲ ▲ ▲ ▲ ▲ ▲ ▲ ▲ ▲ ▲ ▲ ▲ ▲ ▲
4
PLOT SAMPLINGThe plot sampling method provides a simple and effectivemeans of sampling trees for a small woodlot inventory. In itssimplest form, it involves collecting tree measurements withinfixed area plots located at regular intervals along a series ofuniformly spaced transect lines. All plots are the same size andshape. All the trees within each plot that are larger than aminimum size are measured. Below are instructions on how todevelop a sampling plan:• Lay out a series of parallel cruise lines 80 metres apart running
from one end of your woodlot to the other end. If the treecover in your woodlot varies considerably, reduce the intervalbetween lines to 60 metres. If it is very uniform, increase theinterval to 100 metres. Use a consistent interval throughout theproject. Orient the lines to run against the contours (up anddown the hills rather than along the ridges).
• Draft the cruise lines on a map of your woodlot before goingout to the field. You can then use a protractor, or your compass,to determine the compass bearing before walking the line.Later, the map will become a record of where each plotwas located in your inventory.
• Every 80 metres on each cruise line, mark a plot centre.If the terrain or tree cover in your woodlot is highlyvariable, you may choose to reduce the plot interval to60 metres. Use the same plot interval for all plots.
• The first line is one half of the line interval from the propertyboundary (40 metres) and the first plot is one half of the plotinterval from the start of the line (40 metres).
• Plots are 400 square metres in area and are square (each side is 20metres long). They are oriented diagonally on the cruise line, so thattwo corners fall on the lines. The other corners are found at right angles to the line,opposite the plot centre.
• In the field, use a compass and measuring tape (or a rope with lengths marked on it) to locatethe centre of each plot. From the plot centre, measure 14.14 metres in each direction of thecruise line to locate the corners that fall on the line. If you mark the measuring tape (or rope)that you use to measure your progress on the cruise line at 14.14 metres, and again at28.28 metres, you can find those two points by simply continuing down the cruise line untilthe 14.14 metres mark reaches the plot centre. Use your compass to locate the line that lies atright angles to your cruise line from the plot centre, and measure out 14.14 metres in eachdirection to locate the other two corners. If the four corners are marked with flagging tape, youwill be able to see the plot boundaries.
Tip: If squares plots are too difficult to lay out because of the terrain or density of the woodlot,circular plots may be easier. To lay out a circular plot with an area of 400 square metres, holdone end of the measuring tape at the plot centre, and measure out 11.28 metres in as manydirections as possible, and tie a ribbon at these points. You should have a well defined circularplot by the time you make a full rotation.

▲ ▲ ▲ ▲ ▲ ▲ ▲ ▲ ▲ ▲ ▲ ▲ ▲ ▲ ▲ ▲ ▲ ▲ ▲ ▲ ▲ A TRUE PICTURE — Taking Inventory of Your Woodlot
5
FIELD MEASUREMENTSMike’s next task was to decide what he was going to measure. Since he hadthought about selling sawlogs, pulpwood or fuelwood, he would need toknow about the volume of timber in his woodlot.
The forestry books and guides that he had collected told him that therewere a few basic measurements he would need to take at each of his sampleplots in order to come up with a good picture of his woodlot. These samemeasurements would also allow him to estimate the volume of timber.
Many books contain tables of timber volumes for individual trees.Typically, these provide estimates of timber volumes of trees of differentdiameter and height. Mike realized that if he knew the number of each kindof tree, sorted by trunk diameters, and knew how tall each species was, hecould estimate timber volumes for his whole woodlot using these tables.
Measuring tree diameters is relatively easy, and Mike thought he shouldbe able to measure the diameters of every tree in his plots. Tree heights werea different matter. Mike wondered if he needed to measure the height ofevery tree. After further reading, he realized that he only had to measure asample of trees (of each type, diameter, and height), and he could use theseaverage measurements for all the trees of that type and size.
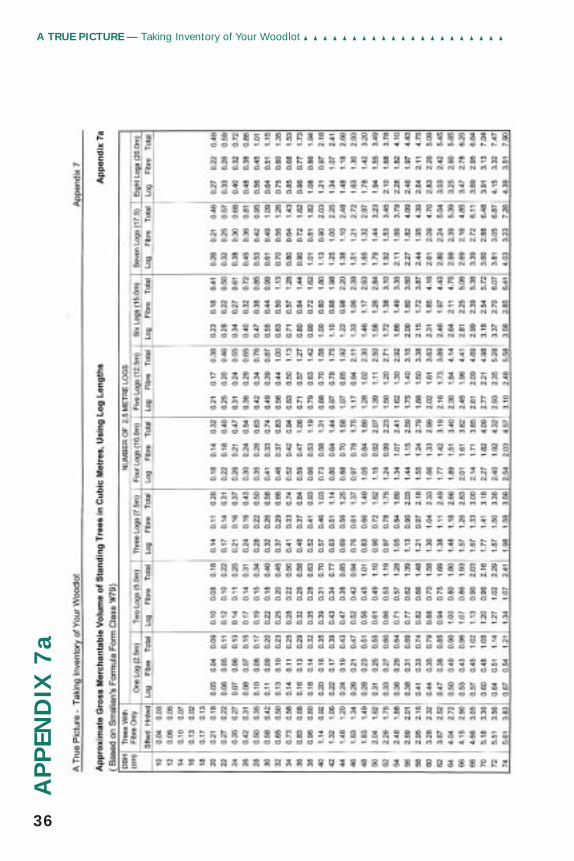
He also thought he could streamline the measuring process by carefullynoting the heights of a few trees in each plot; he could use this data as areference to estimate the heights of other trees. Instead, Mike decided to usea table that relied on the height to the top of the highest sawlog and used asimple factor to allow for the fibre that was in the rest of the tree (this tableis presented in Appendix 7a). Therefore, he needed only to measure treeheights to the nearest log length.
In his research, Mike encountered the term “basal area,” a measurementused to describe the area, in square metres per hectare, of the cross-sectionof all the trees measured 1.3 metres above the ground. Mike knew thatdensity is a good indication of whether the forest is ready for some cutting.He decided that since he was already collecting diameters anyway,calculating basal area was well worth the extra effort.
MEASURING EQUIPMENT — TREE HEIGHT AND DIAMETERMike had made progress in figuring out how to do an inventory of hiswoodlot. He knew how to organize himself efficiently and what numbers heneeded to collect. The next question was how to collect those numbers?
The forestry books refer to diameter tapes and tree calipers (costlyequipment), but they also mention something called a “biltmore stick.” Thisdevice is cheap, easy to use, and you can make it yourself. Similarly, there is awhole range of tools for measuring heights. However, a simple staff hypsometeris something you can make yourself. It gives reasonably accurate data, if youtake the time to learn how to use it properly and are careful in your work.
A TRUE PICTURE — Taking Inventory of Your Woodlot ▲ ▲ ▲ ▲ ▲ ▲ ▲ ▲ ▲ ▲ ▲ ▲ ▲ ▲ ▲ ▲ ▲ ▲ ▲ ▲ ▲
6
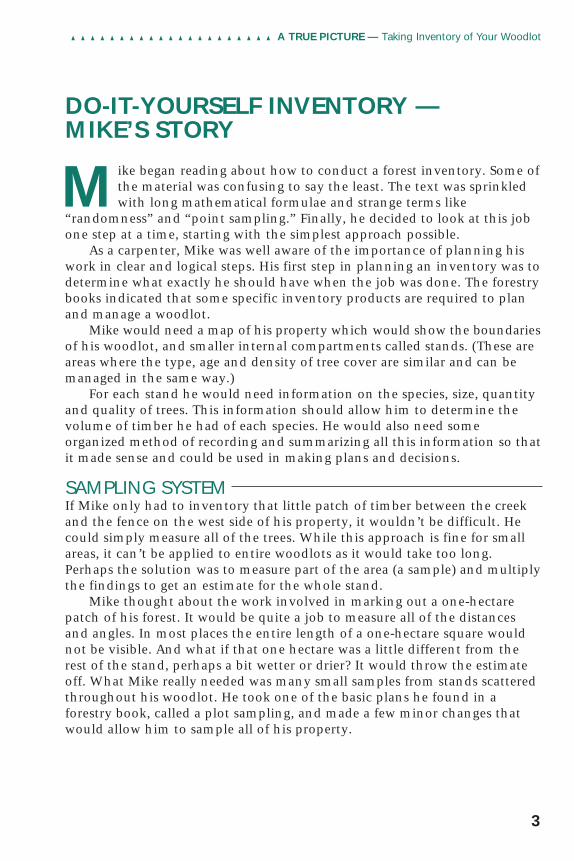
TREE MEASUREMENTSIn systematic plot sampling, all trees within the plots that are larger than a certain minimumsize are measured. The most common threshold is 10 centimetre trunk diameter measuredat a height of 1.3 metres off the ground. For each tree sampled, there are several basicpieces of information that should be collected in any woodlot inventory. These are:
• Tree Species Record the species of tree, such as sugar maple or red maple. In some casesseparating the species may be difficult or not important, (willows forexample). In these cases you may choose to record the tree family(genus) only.
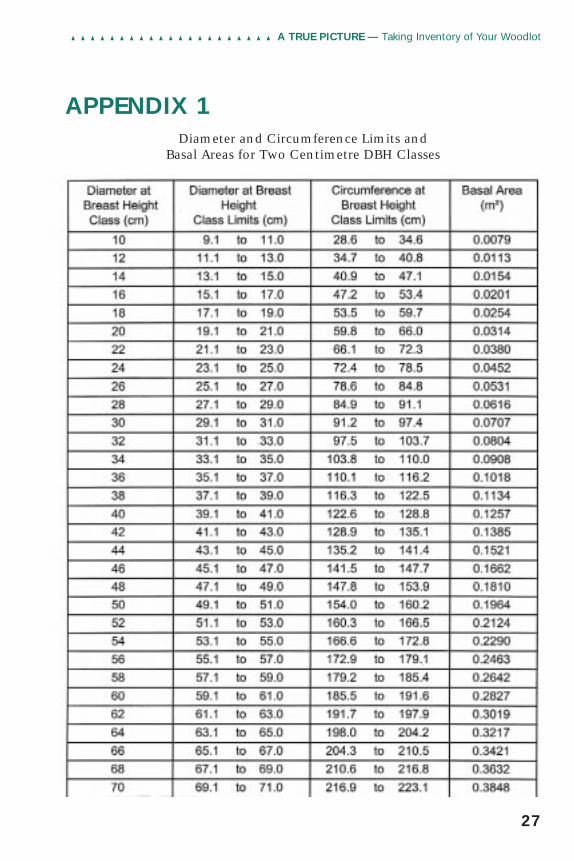
• Tree Diameter Tree diameters are always measured at a standard height of 1.3 metres(breast height). Diameter at Breast Height (DBH) is often recorded in twoclasses (trees from 9.1 to 11.0 centimetres in class 10, trees from 11.1 to13.0 centimetres in class 12, etc.). Appendix 1 contains a table of all thetwo centimetre DBH class limits and their equivalent circumferencemeasures. DBH can be measured using a tape graduated for diametermeasurement, tree calipers or other tools such as a biltmore stick (seeAppendix 2 to learn how to make and use a biltmore stick).
• Tree Height The height of the whole tree may be measured, or alternatively, the heightof the merchantable portion of the tree may be measured. Whole treeheights are often recorded to the nearest one metre. Merchantable heightis recorded to either the nearest one metre, or in sawlog lengths(2.5 metres). A variety of tools are available for measuring heights(generally called hypsometers). Appendix 2 contains instructions onmaking and using a staff hypsometer.
• Tree Quality Individual trees have qualities or defects that may make them less suitablefor specific products, or indicate that they are in decline. Others may haveattributes that may make them valuable for timber or syrup production, oras nesting sites. Thequality or special featuresof each tree should beassessed and classified.The type of classificationused will depend on theobjectives of theinventory (for example,where timber value isimportant you may classtrees simply asacceptable, if you thinkthat their future valuewill increase over time,or unacceptable, if youthink that their value willnot increase over time).

▲ ▲ ▲ ▲ ▲ ▲ ▲ ▲ ▲ ▲ ▲ ▲ ▲ ▲ ▲ ▲ ▲ ▲ ▲ ▲ ▲ A TRUE PICTURE — Taking Inventory of Your Woodlot
7
QUALITY ASSESSMENTAlthough Mike had made a good start, he still felt he needed moreinformation. The dimensions of a piece of lumber are important, but theyare not the whole story. Mike needed some kind of a quality description. Hesettled on a fundamental method — simply looking at a tree and deciding ifit would gain or lose value in the future.
A straight, healthy tree with enough leaves to make it grow, and no signof rot or major injuries, is considered “Acceptable Growing Stock.” Treeswith poor crowns, broken limbs, conks, cat faces or bumpy stems will losevalue in the future and are “Unacceptable Growing Stock.” This simple, two-class system will tell Mike what kind of values he has in his forest, and
Appendix 2 includes instructions on how to build and use a cruising stick which combines abiltmore stick with a staff hypsometer.
BASAL AREAIf you cut a tree off at breastheight (1.3 metres), andmeasure the surface area of thestump, that is the basal area ofthe tree. It is usually expressed inunits of square metres (m2). Thesum of the basal areas of all thetrees on one hectare is the basalarea per hectare for that spot. Itis usually expressed in squaremetres per hectare (m2/ha).
Basal area per hectare (BA) isa useful measure of the levels ofcrowding of trees in a stand.The BA of a stand can becompared to an optimum BAfigure. If the stand BA isgreater than the optimum, thestand may be overcrowdedand need thinning. It isimportant to note that standsof different species and ageshave different optimum BAvalues. Appendix 1 contains atable of basal areas for trees ofdifferent DBH.

where he needs to do some work. It would also be a useful way to measurethe relative improvement in his forests health and quality after anymanagement work has been conducted.
COLLECTING OTHER DATAMike also thought it would be a good idea to record information aboutother features of his woodlot while he conducted his tree tally. He knew thatonce he actually began to develop his management plan, he would needinformation about the general forest canopy, soil types and understoryvegetation. Mike was also interested in preserving habitat for wildlife. Heknew that the shrubs and herbs growing beneath the trees were importantfor many different types of animals, so he included a space to describe theseplants on his tally sheet. He would also use the Notes section on his tallysheet to record the location of good nest or den trees, or other places wherebirds or animals had made their homes in the woodlot.
MAKING A TALLY SHEETMike spent an entire evening designing his tally sheet so that it wouldcontain all of the information that he wanted, but would still be easy to use(see his design in Appendix 3).
A TRUE PICTURE — Taking Inventory of Your Woodlot ▲ ▲ ▲ ▲ ▲ ▲ ▲ ▲ ▲ ▲ ▲ ▲ ▲ ▲ ▲ ▲ ▲ ▲ ▲ ▲ ▲
8
QUALITY CLASSESAcceptable Growing Stock are trees that appear to have a future. If left to grow, they willincrease in value over time. They may be any size or species. Acceptable Growing Stock isusually referred to as “AGS” or tallied as simply “A.”
“Unacceptable Growing Stock” are trees that do not appear to have a future, often dueto disease, die back in the crown or old age. Whatever the reason, if a tree appears to belosing vigour, it is coded as “UGS” or simply “U.”
TALLY SHEETA concise easy-to-use tally sheet is an important tool needed to complete a woodlotinventory. You may choose to use an existing sheet, or customize your own. An example ofa completed tally sheet from Mike’s cruise is shown on the next page. A blank copy for youto use in your own woodlot is included in Appendix 3.
• Mike’s tally sheet allows him to fit the data for as many as three plots on one sheet.• The first line has a place to identify what property was surveyed, in what compartment
the plots were located, who did the work and when. There is a place to number thesheet and record the total number of sheets used in each compartment.
• There is a section to write in the plot number and location.• Cover type is a list of the main species in the stand in order of predominance.• Before Mike circles the “coarse” or “fine” designation under “soil texture,” he digs

▲ ▲ ▲ ▲ ▲ ▲ ▲ ▲ ▲ ▲ ▲ ▲ ▲ ▲ ▲ ▲ ▲ ▲ ▲ ▲ ▲ A TRUE PICTURE — Taking Inventory of Your Woodlot
9
down to themineral soil andrubs some of itbetween hisfingers. If it feelsgritty or sandy,he will call it acoarse soil. If itfeels slippery, itis a fine texture.
• “Aspect” refersto the direction aslope is facing(north or south).
• Mike’s tree tallyspace has fourcolumns. He hasa column wherehe labels eachtree he measureswith a number,just to be able tokeep track of itwhen he is doinghis compilation.To record treespecies, he usesthe two-lettercodes found inAppendix 4. Inthe qualitycolumn, he willwrite in “A” forAcceptable Growing Stock or “U” for Unacceptable Growing Stock. In the “DBH” and“No. logs” columns, he will record the tree measurements collected using his cruisingstick and estimating eye.
• If Mike has too many trees on a plot to fit into the space allowed, he will simplycontinue tallying into the next plot space and use two sections of his tally sheet forone plot.
• Near the bottom of the sheet there is space for a description of shrubs and herbs. Thethree main species will be listed in order of predominance, and their density rated. Thenumber of saplings of various tree species will be included in the shrub tally to indicate theyoung trees growing in the stand. The presence and density of various herbs and shrubscan indicate site quality, difficulty of regeneration, and potential for attracting wildlife.
• Mike left space at the bottom of the sheet for short notes to record other usefulinformation.

A TRUE PICTURE — Taking Inventory of Your Woodlot ▲ ▲ ▲ ▲ ▲ ▲ ▲ ▲ ▲ ▲ ▲ ▲ ▲ ▲ ▲ ▲ ▲ ▲ ▲ ▲ ▲
10
MAKING A MAPMike had figured out his sampling system. He knew what numbers he wasgoing to collect and how he was going to get them. All he needed now was awoodlot map. The map would be used to lay out his cruise lines and tolocate the boundaries of the compartments within the woodlot.
PREPARING YOUR MAPLand survey maps are normally attached to the title documents of most properties. Mosttownship offices will have assessment maps that are accurately drawn to scale, and havenecessary survey information on them. They may also have copies of surveyors’ maps,prepared for municipal projects such as drains or road construction. These maps oftencontain useful information such as fence and building locations, in addition to the basicsurvey lines. If the township office doesn’t have any maps, try the county or regional officeof planning, assessment or registry.
BASE MAPMike knew that maps are available from a number of government sources.The federal government sells topographic maps, and the provincialgovernment produces large forest inventory maps. However, due to thescales used on these maps, his property appears to be about the size of apostage stamp. After thinking about it, Mike came up with a plan to makehis own map to suit his needs.
There are a number of information sources around to help with the job.The provincial government has aerial photos of the countryside which arefairly detailed. Survey maps prepared for land transactions can be useful.Mike also obtained a copy of a map produced by the municipality fortaxation purposes. He converted the scale on the township map from1:2,400 to 1:2,000 so that it would be simpler to use (see the next page forinstructions on doing this).
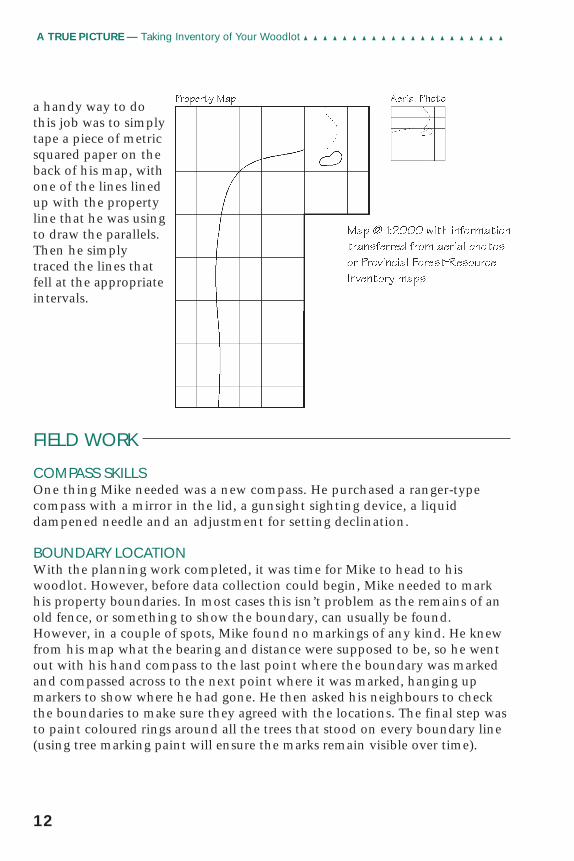
PRELIMINARY WOODLOT MAPNow Mike had his base map. He used light paper because he knew he wouldbe tracing a number of things from one map to another. Mike made aphotocopy transparency of the provincial forest-resource inventory mapthat covered his property. Then he used the overhead projector to transferinformation from it to his woodlot map, as he had done for his base map.The provincial map gave him a good starting point for filling in informationon his preliminary map.
Next he examined the aerial photos of his property. He located thebeaver pond and checked to see if it was on his map. Sure enough, theinventory map had shown the same pond, but the more recent aerial photoshowed it to be much larger than it appeared on the older map. After
▲ ▲ ▲ ▲ ▲ ▲ ▲ ▲ ▲ ▲ ▲ ▲ ▲ ▲ ▲ ▲ ▲ ▲ ▲ ▲ ▲ A TRUE PICTURE — Taking Inventory of Your Woodlot
11
drawing grid lines on both maps, Mike transferred the new, larger picture ofthe pond from the photo to his map. He was also able to pick out the oldbush road and he drew tentative lines around some of the timber standswhich he knew the large-scale map had not separated out. He used thistechnique to fill in as much on his map as he could; in pencil only, sinceeverything was tentative and still needed to be checked by walking throughthe woodlot.
The last thing Mike did to his map was to lay out his cruise lines. Hepicked out one of the property boundaries that tended to run across thecontours (up and down the hills rather than along the ridge tops) and put inhis cruise lines parallel to it. This way, he would cover all the major sitechanges on each line and be less likely to miss something because it hadfallen between the cruise lines. His cruise lines were 100 metres apart, andhe marked the plot centres at 80-metre intervals on each line. He found that
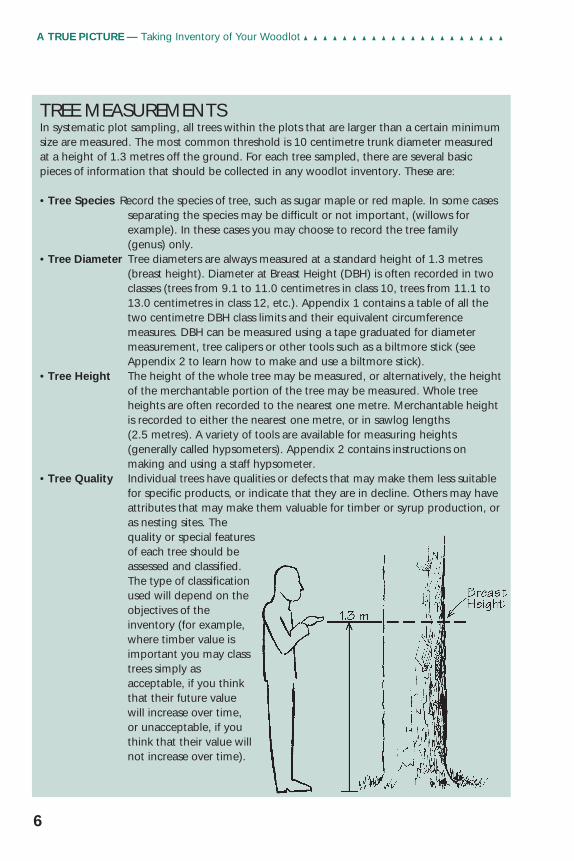
GETTING YOUR MAP TO THE SCALE YOU WANTMaps need to be drawn toscale. A scale of 1:2,000 isgenerally suitable for woodlotmapping. This means that onecentimetre on the map willrepresent 2,000 centimetres(or 20 metres) on the ground.Maps that are available asinformation sources will oftenbe at a much smaller scalesuch as 1:15,000.
A transparency of thesource map, projected ontoyour map sheet with aborrowed over-head projector, can be used to enlarge the source map to the scale youwant. Pick two parallel straight lines, or ones at right angles to each other in oppositecorners of the source map, for reference points. Calculate how long they will be, and howfar apart, on your woodlot map.
Draw them accurately on your woodlot map. Project the transparency of the source maponto the woodlot map sheet so that reference lines in both maps match. All otherinformation will then be at the correct scale and orientation. Transfer any notations onbearings or distances since they will provide references when laying out your cruise lines.Don’t forget to transfer the north arrow and scale ladder. Measure the scale ladder to checkyour work.
For a map that has only a few lines on it, use the following formula:
Dimension on Source Map = Dimensions on New Map
Scale of Source Map Scale of New Map
A TRUE PICTURE — Taking Inventory of Your Woodlot ▲ ▲ ▲ ▲ ▲ ▲ ▲ ▲ ▲ ▲ ▲ ▲ ▲ ▲ ▲ ▲ ▲ ▲ ▲ ▲ ▲
12
FIELD WORK
COMPASS SKILLSOne thing Mike needed was a new compass. He purchased a ranger-typecompass with a mirror in the lid, a gunsight sighting device, a liquiddampened needle and an adjustment for setting declination.
BOUNDARY LOCATIONWith the planning work completed, it was time for Mike to head to hiswoodlot. However, before data collection could begin, Mike needed to markhis property boundaries. In most cases this isn’t problem as the remains of anold fence, or something to show the boundary, can usually be found.However, in a couple of spots, Mike found no markings of any kind. He knewfrom his map what the bearing and distance were supposed to be, so he wentout with his hand compass to the last point where the boundary was markedand compassed across to the next point where it was marked, hanging upmarkers to show where he had gone. He then asked his neighbours to checkthe boundaries to make sure they agreed with the locations. The final step wasto paint coloured rings around all the trees that stood on every boundary line(using tree marking paint will ensure the marks remain visible over time).
a handy way to dothis job was to simplytape a piece of metricsquared paper on theback of his map, withone of the lines linedup with the propertyline that he was usingto draw the parallels.Then he simplytraced the lines thatfell at the appropriateintervals.

▲ ▲ ▲ ▲ ▲ ▲ ▲ ▲ ▲ ▲ ▲ ▲ ▲ ▲ ▲ ▲ ▲ ▲ ▲ ▲ ▲ A TRUE PICTURE — Taking Inventory of Your Woodlot
13
SOME NEEDED COMPASS SKILLSSetting a Compass Course With a ranger-type compass, or any compass with a rotatabledial, you set the bearing that you are going to follow opposite the “direction of travel”arrow, or the line on the mirror in the compass lid. When you align the compass needle andthe arrow on the compass face, your gunsight (or the direction of travel arrow) will point inthe direction that you want to go.
Following a Compass Course Be sure that the declination is set correctly or that you arerunning magnetic bearings. Set the bearing that you will be following. Sight on the farthestobject that you can pick out through the gunsight (while lining up the needle and the arrowin the mirror). Travel in a straight line to the object and repeat the procedure. Be careful tohold the compass level, and ensure that you don’t have any iron or steel (a jackknife forexample) in your shirt pocket.
Finding a Bearing Cruise lines will be easier to work with if they run parallel, or at rightangles, to a property line with a known bearing. If however, this approach doesn’t work well,lay out your compass line and then use a protractor to measure the angle between your lineand the north line. That value, or the difference between it and 360 degrees is your compassbearing. Adding 90 degrees to the bearing of the cruise line with give you the bearing of aline at right angles to the right of the surveyed line; sub-tracting 90 degrees will give you oneto the left. Adding or subtracting 180 degrees will give you the opposite direction.
Declination The north that the needle of the compass points to, and the direction to thenorth pole, are not quite the same. The legend of a topographic map of your area will tellyou how much different they are. Read the note carefully; the discrepancy changes overtime. Think carefully when making the correction. If you correct the wrong way you aredoubling your error. West declination means that the compass needle is pointing to thewest of true north, therefore you need to adjust your direction of travel to the east therequired amount. If you are using a compass that allows you to set the declination, makethe correction, then set your direction of travel at 360 degrees, or north. The compassneedle should be pointing slightly to the west (left) of travel direction. If your compass doesnot allow you to adjust for declination, note the magnetic directions on your map and makethem the working bearings.
CRUISINGWhile he was out marking the boundaries, Mike measured out and markedthe points where the cruise lines would end on the north fence line. This gavehim a place to start his lines and a check on the accuracy of his compassing.
Finally, Mike was ready to start putting in plots and measuring trees.One of his children helped. With one person compassing and tallying, andthe other measuring trees, things went smoothly. Corners were marked withplastic flagging tape. Any plots that fell on clearly visible stand boundarieswere skipped. Diameters were measured, and one or two heights were takenwith the cruising stick. Height estimates were made for each diameter classof each species. For species names, abbreviated codes were used. (Thesecodes are listed in Appendix 4.)

A TRUE PICTURE — Taking Inventory of Your Woodlot ▲ ▲ ▲ ▲ ▲ ▲ ▲ ▲ ▲ ▲ ▲ ▲ ▲ ▲ ▲ ▲ ▲ ▲ ▲ ▲ ▲
14
An important part of the job is mapping. Observations made along eachcruise line should be added to the map. Note things such as seasonal watercourses, beaver ponds, rock outcrops, etc.
The cruise line gave a reference for mapping, and distances off the linewere estimated by pacing. Mike determined that 13 of his strides covered20 metres. As the distance between plots was measured, Mike was careful tonote on the map any distinct changes in the type, size and density of thetrees. Later, he used these marks to determine where to draw the boundariesbetween the compartments (or stands) in the woodlot.
One of the things that Mike considered when deciding the location ofcompartment boundaries was operational efficiency. Often it made sense toput a stand boundary along a trail or natural break, even if the timber wasthe same on both sides. It was just a handier unit to work with over the longterm. Each compartment would be treated as a unit, with logging,silvicultural, and other management work carried out the same way, at thesame time, on the whole compartment area. He would complete this processas he compiled his final woodlot map.
Another consideration was compartment size. He found it was easy toget carried away by splitting out every little pocket of different tree speciesso he tried to keep his minimum compartment size to one hectare. But, ifsome smaller patch was particularly significant, like the clump of huge oldtrees down on the edge of the marsh, he kept it separate.
Mike carefully organized the information that he collected. Beforeleaving each plot, he thoroughly reviewed the tally sheet to make sure thathe hadn’t missed anything. An example of one of Mike’s completed tallysheets is provided on page 9.
COMPILATIONWhen the cruise was finished, Mike had a stack of tally sheets plus a handfulof map sheets. The first thing he did was to transfer all of the informationfrom his field maps to his permanent woodlot map. At that time, he made thedecision on where to place the final compartment boundaries. When drawinghis compartment lines, Mike reviewed his field notes on the density, age andspecies of trees, soil type and the location of natural features. His lines oftenfollowed roads or natural boundaries such as streams or ridge tops. Henumbered each compartment and copied the compartment numbers on thetally sheets. He used a sheet of graph paper to determine the area of eachcompartment. One square on the graph paper covered an area of twomillimetres by two millimetres (4 mm2). He traced the outline of thecompartment onto his sheet and then did a count of the squares by marking alarge “x” through each block of 25 full squares, and a dot on all remaining fullsquares. He then added one half of all partial squares to the count of fullsquares. Since his map was at a scale of 1:2,000, each full square represented a
▲ ▲ ▲ ▲ ▲ ▲ ▲ ▲ ▲ ▲ ▲ ▲ ▲ ▲ ▲ ▲ ▲ ▲ ▲ ▲ ▲ A TRUE PICTURE — Taking Inventory of Your Woodlot
15
ground area of four metres by four metres (16 m2) or 625 squares to onehectare. The area of each compartment was marked on the map.
Now Mike had to deal with that big pile of data sheets. He sorted thepile by compartments, so that all of the tally sheets for each compartmentwere in one bundle. Quite a few tally sheets ended up cut in two so that one
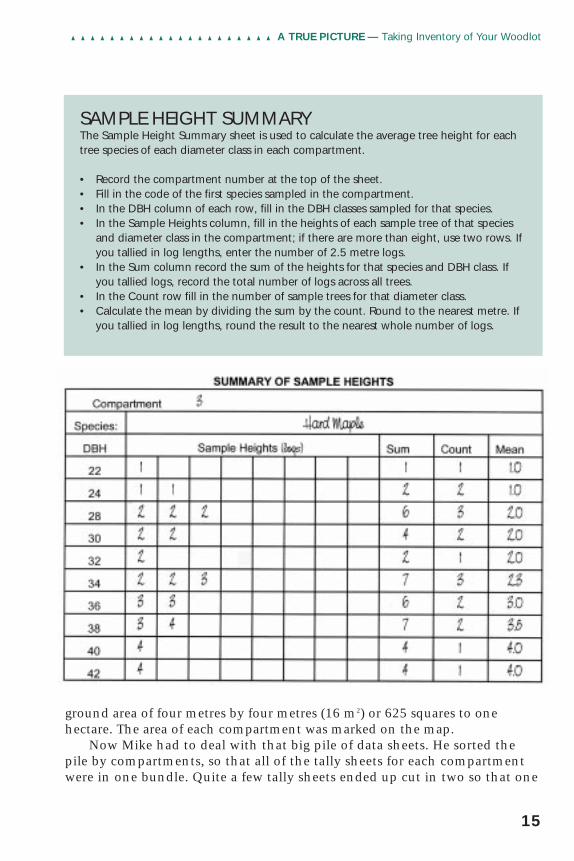
SAMPLE HEIGHT SUMMARYThe Sample Height Summary sheet is used to calculate the average tree height for eachtree species of each diameter class in each compartment.
• Record the compartment number at the top of the sheet.• Fill in the code of the first species sampled in the compartment.• In the DBH column of each row, fill in the DBH classes sampled for that species.• In the Sample Heights column, fill in the heights of each sample tree of that species
and diameter class in the compartment; if there are more than eight, use two rows. Ifyou tallied in log lengths, enter the number of 2.5 metre logs.
• In the Sum column record the sum of the heights for that species and DBH class. Ifyou tallied logs, record the total number of logs across all trees.
• In the Count row fill in the number of sample trees for that diameter class.• Calculate the mean by dividing the sum by the count. Round to the nearest metre. If
you tallied in log lengths, round the result to the nearest whole number of logs.

A TRUE PICTURE — Taking Inventory of Your Woodlot ▲ ▲ ▲ ▲ ▲ ▲ ▲ ▲ ▲ ▲ ▲ ▲ ▲ ▲ ▲ ▲ ▲ ▲ ▲ ▲ ▲
16
plot could go in the bundle for one compartment, and the otherssomewhere else. Any plots that fell exactly on one of the final compartmentboundaries were discarded.
The next task was to come up with an average height for each diameterclass of each species in each compartment. An example of the SampleHeight worksheet Mike used to calculate average heights is shown below. Ablank copy of the same sheet is included in Appendix 5.
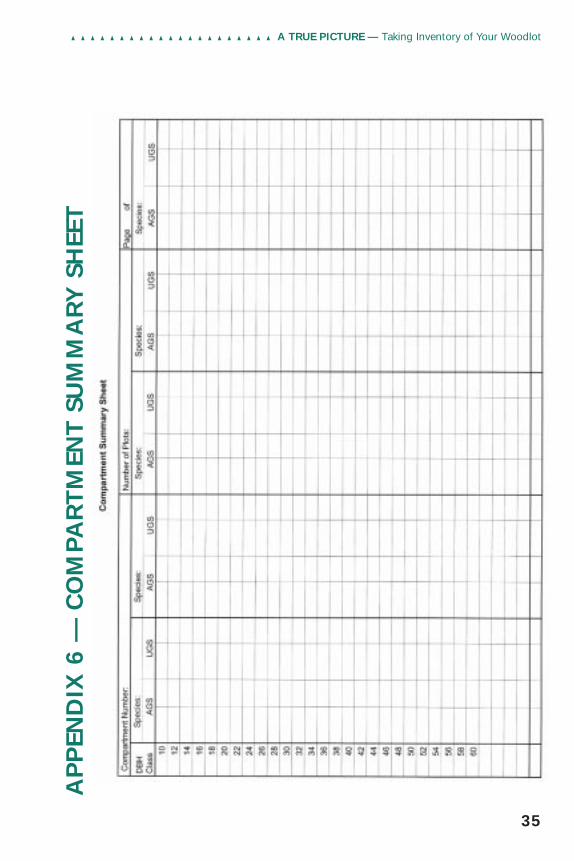
Next, Mike used a Compartment Summary sheet to summarize the treecount in each plot by compartment number. A copy of this sheet is providedin Appendix 6. Instructions on how to complete it are provided below.
Mike then turned to the Data Compilation sheets (Appendix 8). Filling outthese sheets is mainly a matter of taking information from existing sources, orfrom a table, and multiplying to get answers for the appropriate boxes. In orderto complete this step, Mike needed a volume table that provided estimates ofthe merchantable timber volume for each tree size class in his sample.
The table which Mike used to determine volumes is from a book onwoodlot management. This one table is for all species and splits the volumeinto sawlog and fibre components. There is a supplementary table that hasthe same information in board feet and cords (see Appendix 7).
Mike finished his compilation work by completing summary sheets foreach compartment (Appendix 9). The information on soils, topography,saplings and minor vegetation was summarized by scanning the field sheetsand picking out trends.
Mike now had all of the information required to develop annual workplans for his woodlot. He could use the data and his knowledge of currentmarkets to guide him in deciding what tasks to undertake. He could estimatethe volumes of wood involved and monitor changing conditions. And hehas all the information he needs for future decision making. As a result, hisinventory is a dynamic, ever-changing record of his woodlot.
COMPARTMENT SUMMARY SHEET• Fill in the compartment number at the top of the sheet.• Gather all the tally sheets for plots in that compartment.• Count the number of trees in each species, quality class and DBH class for all plots. Use a
dot tally to do this. A dot tally is a simple method of writing numbers as the count buildsup without having to erase or cross out the previous number. It looks like this:
• Record the plot number from each sheet in the far right column.• Once all sheets have been summarized, write out the number of trees counted in
each cell.
1 2 3 4 5 6 7 8 9 10
▲ ▲ ▲ ▲ ▲ ▲ ▲ ▲ ▲ ▲ ▲ ▲ ▲ ▲ ▲ ▲ ▲ ▲ ▲ ▲ ▲ A TRUE PICTURE — Taking Inventory of Your Woodlot
17
COMPILATION SHEETAll of the information on tree samples is brought together on the Compilation Sheets.One or more sheets are completed for each species in each compartment by using thefollowing instructions:
1. At the top of the sheet, identify the woodlot compartment to be summarized.2. In the Sample Size box, enter the total number of valid sample plots within the
compartment and the sample area in hectares.3. Each sheet is divided into two columns; Acceptable Growing Stock (AGS) trees are
summarized on one side and the Unacceptable Growing Stock (UGS) on the other.4. Enter the number of trees in each DBH class for AGS and UGS from the Compartment
Summary sheets dot tally in the No. Trees column.5. For each DBH and Quality class, multiply the No. Trees by the BA/tree (basal area per
tree) figure and enter the product in the BA sample column.6. Enter the average height from each DBH and quality class in the Avg. Ht. column from
the calculations made on the Sample Height Summary sheet (if log heights were tallied,enter the average number of 2.5 metre logs).
7. Using one of the volume tables in Appendix 7, look up the figure that corresponds to theDBH class and average height row on the Compilation Sheet. If you tallied height to thenearest metre, use the Merchantable Height Volume Table. If you tallied heights by loglength, use the Log Lengths Volume Table. Enter the figures in the Vol./tree column.
8. Multiply the Vol./tree figure by the No. Trees figure for each DBH and quality class andenter the result in the Vol. sample column.
9. Divide the No. Trees figure in each DBH and Quality class by the Sample Size (written in atthe top of the page), and enter the result in the Stems Per Hectare column. This is thestems per hectare for trees of that species, DBH class and quality class in the compartment.
10. Divide the BA Sample figure in each DBH and quality class by the Sample Size andenter the results in the BA Per Hectare column. This is the basal area per hectare fortrees of that species, DBH class and quality class in the compartment.
11. Divide the Vol. Sample figure in each DBH and quality class by the Sample Size andenter the result in the Volume per Hectare column. This is the merchantable volumeper hectare for trees of that species, DBH class and quality class in the compartment.
12. Sum the per hectare values for number of stems, basal area and volume for DBH andquality classes from 10 through 24 and enter the result in the Poles row.
13. Similarly, sum the per hectare values for number of stems, basal area and volume forDBH classes from 26 through to 38 and enter the results in the Small Logs row. Sumvalues for DBH classes from 38 to 48 and enter the results in the Medium Logs row.Sum values for DBH classes from 50 to 60 and enter the results in the Large Logs row.Sum all values over 60 centimetres DBH and enter the result in the Oversize row. Sumvalues for poles, small logs, medium logs, large logs and oversize and enter the resultsin the row.
14. At the bottom of each column, enter the total area of the compartment in hectares(determined for your map).
15. Calculate the total number of stems, basal area and volume for the compartment bymultiplying the per hectares value by the compartment areas, and enter the results inthe Total/Stand row.

A TRUE PICTURE — Taking Inventory of Your Woodlot ▲ ▲ ▲ ▲ ▲ ▲ ▲ ▲ ▲ ▲ ▲ ▲ ▲ ▲ ▲ ▲ ▲ ▲ ▲ ▲ ▲
18

▲ ▲ ▲ ▲ ▲ ▲ ▲ ▲ ▲ ▲ ▲ ▲ ▲ ▲ ▲ ▲ ▲ ▲ ▲ ▲ ▲ A TRUE PICTURE — Taking Inventory of Your Woodlot
19
A TRUE PICTURE — Taking Inventory of Your Woodlot ▲ ▲ ▲ ▲ ▲ ▲ ▲ ▲ ▲ ▲ ▲ ▲ ▲ ▲ ▲ ▲ ▲ ▲ ▲ ▲ ▲
20
HIRING A PROFESSIONAL —BILL’S STORY
Bill, a retired engineer, put a great deal of thought into the problem ofobtaining an inventory for his woodlot. Part of the reason he hadacquired the property was to keep himself active; he realized,
however, that after 35 years of sitting at a desk, he wasn’t physicallyprepared to walk through his woodlot every day.
Bill also knew that many mistakes could be made during a timber cruise.Some species, for example, are difficult to identify. During the winter it ishard to differentiate between a tamarack and a dead black spruce. Also, whatwould happen if height measurements were consistently inaccurate? Bill dida few calculations to test the consequences of these errors and the resultsfrightened him. Finally, after a lot of soul-searching, he decided that thebest way was to hire a professional to do the job.
FINDING THE RIGHT PERSONThis did not mean Bill looked in the telephone book under “forestryconsultants” and hired the first person listed. He knew that somebackground knowledge would allow him to “speak the language” and getbetter value from his consultant. He made himself familiar with conceptslike basal area, sampling systems and volume tables. He also did a lot of hisown preliminary work, such as finding his property boundaries. In his case,he didn’t have to dig far to find survey information, as an accuratedescription of the property was required when he had bought it.
Once Bill felt comfortable with his new forestry knowledge, he began to askabout consultants. The local woodlot owners’ association and the provincialnatural resources office provided him with names. Bill chose the consultantwho seemed to have the most experience on private land in his area.
WORKING WITH A CONSULTANTThe first thing Bill and the consultant did was sit down to talk about whatBill expected, and what the consultant could do for him. The consultantexplained that his usual method of setting up a cruise was to randomlyselect ten coordinates in each stand and do a “prism sweep” at each one. Heexplained that the point sampling system that uses prism sweeps is based onmathematical approaches that make it possible to get the same value ofinformation from less measuring than using the fixed-area plot method.
The consultant had a set of three local volume tables which coveredthe site conditions in the area. Therefore, he only had to measure theheights of a small number of trees in each stand to determine which tablehe should be use.

▲ ▲ ▲ ▲ ▲ ▲ ▲ ▲ ▲ ▲ ▲ ▲ ▲ ▲ ▲ ▲ ▲ ▲ ▲ ▲ ▲ A TRUE PICTURE — Taking Inventory of Your Woodlot
21
Bill’s next question was about the stand boundaries the consultant wasusing to separate different types of forest. “Where did they come from,” heasked? The consultant’s reply was that he normally used the standboundaries from the provincial inventory maps. Bill wanted to know howgood those lines were. “Well, in this area, not too bad, for stand boundaries,although they sometimes tended to throw an awful lot of different stuff inone stand,” replied the consultant.
Bill wanted to know if there was any way he could get a better “typingjob” done on his woodlot before the whole inventory was done on the basisof stand designations that were too broad to be of much use to him. Theconsultant offered to retype the photos himself if Bill was interested inpaying the extra costs. Bill decided that it would be money well spent, andthe consultant suggested that perhaps they should do it together so that Billwould get a better idea of the nature of his property. This impressed Bill andhe knew that he had picked the right person for the job.
As he watched his consultant work on the photos, drawing grease pencillines and explaining what he was doing, Bill realized that some of the standson his woodlot were a lot bigger than he was prepared to deal with at onetime. He asked that the stands be divided into smaller units that would beeasier to handle, based on convenient boundaries and some relatively minorshifts in stand composition. These would be the compartments that wouldprovide the framework for Bill’s management activity.
By the time they were finished, Bill felt that he was now much morefamiliar with his property, even if there were parts of it that he had neverseen. Bill was now comfortable with his inventory project and very glad thathe had spent some time learning about forest inventory.
A couple of weeks later the consultant arrived at Bill’s door with acomplete woodlot inventory, a map and an invoice. This map was not asdetailed as the one Mike had done; a similar map would have beenprohibitively expensive. But it told Bill enough that he could make his planswith confidence. The inventory data had a page for each of thecompartments that Bill and his consultant had designated. Eachcompartment had a description of the soil, the topography, the shrubs andherbs and the timber. The timber in Bill’s inventory was described by speciesand size using three quality classes that gave him an idea of what kind ofproduct each tree would produce. He was able to do his planning each yearusing his map and compartment descriptions to set priorities forenvironmental protection, wildlife habitat and timber, knowing that hewasn’t missing any areas that were badly in need of attention, or anyopportunities to optimize his benefit.
Bill was convinced that hiring someone to do his woodlot inventory hadbeen a wise decision. Not only had he avoided the risk of generating inaccurateinformation, he had saved himself a great deal of work and a lot of time.

A TRUE PICTURE — Taking Inventory of Your Woodlot ▲ ▲ ▲ ▲ ▲ ▲ ▲ ▲ ▲ ▲ ▲ ▲ ▲ ▲ ▲ ▲ ▲ ▲ ▲ ▲ ▲
22
MAKING EFFECTIVE USE OF A CONSULTANT1. Develop a clear idea, in your own mind, of what you expect a consultant to do for you.2. Shop around. Look for someone with experience in woodlot work and a good reputation
among his clients. Remember that you tend to get what you pay for, and that you aren’tlikely to find your consultant in an advertising section. Most good consultants don’t needto advertise very much.
3. Stay in touch with your consultant, particularly in the planning stages of the work. Heneeds a thorough understanding of your needs. Once the field work begins, things aremore or less on automatic and there really isn’t much opportunity to make changes.

▲ ▲ ▲ ▲ ▲ ▲ ▲ ▲ ▲ ▲ ▲ ▲ ▲ ▲ ▲ ▲ ▲ ▲ ▲ ▲ ▲ A TRUE PICTURE — Taking Inventory of Your Woodlot
23
SUMMARY
Mike and Bill both wanted to manage their woodlots carefully withthoughtful goals and objectives, based on a good knowledge of theirresources. Just as the successful retailer needs to know what’s on the shelves,and the number and nature of his potential customers, the manager of aforest needs to know what he has in the woods, and the nature andpotential of his markets.
Similarly, Mike and Bill can use their inventories to identify areas intheir woodlots where there are a lot of trees whose value is static ordecreasing, and devise means of replacing them with vigorous, fast growingtrees for which there is a market demand. They both know that the value oftrees of high-value species will increase at a rate comparable to any othergood investment.
Woodlot management is a business that is similar to any other; thereare, however, a few important differences. The return is over the long term,often extending over two or more generations. Unlike the usual factory orstore, a woodlot is a fully integrated enterprise that will produce a range ofbenefits: timber, wildlife, recreation and natural environment, for a numberof markets, some of which are not used to paying for the benefit.
In addition, the system that generates these products is extremelycomplex. It requires a special effort to understand and benefit from yourwoodlot without endangering its ability to maintain production. The manyorganisms and nonliving factors interacting with each other create anextremely complex system that never stops changing. In order to seeopportunities or problems as they emerge, it is necessary to have a clear,unbiased record of what’s in your woodlot. For Mike and Bill, theirinventory is a large step towards developing some of the necessaryunderstanding of this complex and fragile system.

A TRUE PICTURE — Taking Inventory of Your Woodlot ▲ ▲ ▲ ▲ ▲ ▲ ▲ ▲ ▲ ▲ ▲ ▲ ▲ ▲ ▲ ▲ ▲ ▲ ▲ ▲ ▲
24
SUMMARY
PlanningA good inventory plan should specify expected end products are and clearly define thesequence of tasks necessary to produce these products.1. What is the inventory expected to show? What are the expected products?2. How much time and money do you have available to conduct the inventory? Are you
willing to do the work yourself or are you more comfortable hiring a consultant?3. What are the basic steps you will follow to complete the inventory and what methods
will be used to complete each step?4. What tools and resources are needed (maps, aerial photos, field equipment, tally
sheets, reference material, etc.)? What are the tools and resources you have availableto you?
Steps in Doing a Plot Cruise1. Determine desired results;
a) intensity of sample; b) plot size and configuration; c) cruise line and plot interval; d) cruise line pattern (orientation); e) data to be collected and how much, diameters, heights, quality information, new
growth, wildlife factors, minor vegetation, site information, tombstone data; f) precision of data to be collected, size classes, measurement, controlled estimate,
visual estimate, subjective appraisal; g) design tally sheet and make copies; h) plan compilation procedures, how information will be organized and computed to
yield the required information. 2. Obtain a good base map, accurately drawn to scale, that shows property boundaries,
a north arrow (or equivalent), major water features, roads and other significant man-made features.
3. Pencil in, on the map, any information obtainable from aerial photos or other sourcesthat will help to give a complete picture of the forest: stand boundaries, roads, trails,any water features, barren areas, etc.
4. Decide on minimum stand size.5. Plan the field cruise. Organize the field work. Carry out the cruise, collecting field data
and add information to the map.6. Produce final map.7. Compile cruise data and report it in a usable format.
Woodlot Inventory UpdateForests are constantly changing and human activity in the forest generally accelerates therate of change. As time passes your inventory, if left alone, will eventually become out-of-date and inaccurate. Once you have completed a woodlot inventory, you may wish toconsider how you will maintain and periodically update the information in the future.Every five years should be sufficient for most woodlots.

▲ ▲ ▲ ▲ ▲ ▲ ▲ ▲ ▲ ▲ ▲ ▲ ▲ ▲ ▲ ▲ ▲ ▲ ▲ ▲ ▲ A TRUE PICTURE — Taking Inventory of Your Woodlot
25
REFERENCES CITEDMurchison, H. Gary. Forest Mensuration Model: Basic Forest Inventory.
Formetrics, Thunder Bay, Ontario. 1995.
Honer, T. G., et al. Metric Timber Tables for the Commercial Tree Species ofCentral and Eastern Canada. Canadian Forestry Service, Information ReportM-X-140. 1983.
Phillips, H., and F. Luckai. Mensuration Field School Manual. LakeheadUniversity, School of Forestry, Thunder Bay, Ontario. 1983.
Staley, R.N. Wood . . . Take a Stand and Make it Better. Ontario Ministry ofNatural Resources, Toronto, Ontario. 1991.
RESOURCES THAT COMPLEMENTTHIS MANUALLandOwner Resource Centre. A Woodlot Management Plan. Box 599,
Manotick, Ontario K4M 1A5. 1996. ISBN 0-9680992-0-3.
Eastern Ontario Model Forest. Eastern Ontario Model Forest; Code of ForestryPractice. P.O. Box 2111, Kemptville, Ontario, K0G 1J0. 1996.
Ontario Ministry of Natural Resources. Extension Notes, LandOwner ResourceCentre, Box 599, Manotick, Ontario K4M 1A5. (This series includes anumber of notes on a wide range of topics related to forestry, wildlife,trees and property management.)
FURTHER READING
Anderson, H.W., and J.A. Rice. A Tree Marking Guide for the TolerantHardwood Working Group in Ontario. Ministry of Natural Resources,Toronto, Ontario. 1993.
Baughman, Melvin J. et al. Woodland Stewardship: A Practical Guide forMidwestern Landowners. University of Minnesota, St Paul, MN 55108. ISBN 0-9623116-6-9. 1993.
Beattie, M., C. Thompson and L. Lavine. Working with Your Woodlot — ALandowner Guide. University Press of New England. 1989.

A TRUE PICTURE — Taking Inventory of Your Woodlot ▲ ▲ ▲ ▲ ▲ ▲ ▲ ▲ ▲ ▲ ▲ ▲ ▲ ▲ ▲ ▲ ▲ ▲ ▲ ▲ ▲
26
Canadian Forestry Service. Successful Forestry; A Guide to Private ForestManagement, Supply and Services Canada, Ottawa, Ontario K1A 0S9.1988. Cat. No. Fo29-17/1988E. ISBN 0-660-12893-4.
Decker, D.J., J. W. Kelley, W. Seamans and R. R. Roth. Wildlife and Timberfrom Private Lands: A Landowner's Guide to Planning. Cornell CooperativeExtension Publication Information Bulletin 193, Cornell University,Ithaca, NY 14853. 1990.
Farrar, J. L. Trees in Canada. Fitzhenry and Whiteside, Markham, Ontario1995. ISBN 1-55041-199-3.
Fazio, James R. The Woodland Steward — A Practical Guide to the Managementof Small Private Forests. University of Idaho Press. 1994.ISBN 0-9615031-0-6.
Hadley, M. J. Managing Your Woodland. A Non-forester's Guide to Small ScaleForestry in British Columbia. Ministry of Forests, Victoria, B.C. 1990. ISBN 0-7718-8652-7.
Husch, B., C. I. Miller, and T. W. Beers. Forest Mensuration. John Wiley &Sons, 1992.
McKay, S. M. and P. M. Catling. Trees, Shrubs and Flowers to Know in Ontario,J. M. Dent and Sons, Ltd. 1979. ISBN 0-460-95304-4.
Newcomb, l. Newcomb’s Wildflower Guide. Little Brown and Co, Toronto,Ontario. 1977.
Nova Scotia Department of Lands and Forests. The Trees Around Us; A Manualof Good Forest Practice for Nova Scotia. 1980. ISBN 0-8887-004-6
Soper, J. H. and Heimburger, M. L. Shrubs of Ontario. Royal Ontario Mus.,Publ. In Life Sci., Toronto, Ontario. 1982.
▲ ▲ ▲ ▲ ▲ ▲ ▲ ▲ ▲ ▲ ▲ ▲ ▲ ▲ ▲ ▲ ▲ ▲ ▲ ▲ ▲ A TRUE PICTURE — Taking Inventory of Your Woodlot
27
APPENDIX 1Diameter and Circumference Limits and
Basal Areas for Two Centimetre DBH Classes

A TRUE PICTURE — Taking Inventory of Your Woodlot ▲ ▲ ▲ ▲ ▲ ▲ ▲ ▲ ▲ ▲ ▲ ▲ ▲ ▲ ▲ ▲ ▲ ▲ ▲ ▲ ▲
28
APPENDIX 2 — MAKING AND USINGYOUR OWN CRUISING STICK
A cruising stick is simply a strip of hardwood with biltmore stickgraduations on one side and markings for a staff hypsometer on the otherside. Exactly how far apart the graduations will be depend on somethingcalled your “arm’s reach.” If you stand with your shoulders squared andreach out in front of you with your hand held at breast height, the fistlightly clenched and the thumb on top, the distance from the first joint ofyour thumb to your eye on the same side of your body is your arm’s reach.
A cruising stick should probably be about a metre long. It will need to besanded clean and smooth. Measure your arm’s reach and use the tables ofcalibrations provided at the end of this Appendix.
The graduations on the biltmore stick show the boundaries of twocentimetre diameter classes. The space between 9.1 and 11.0 centimetres, forinstance, is the 10 centimetre diameter class. The 22 centimetres diameterclass runs from 21.1 centimetres to 23.0 centimetres.
On the hypsometer, similarly, the nearest mark indicates the height ofthe tree. The zero point for the biltmore stick will likely be at one end of thestick, so you simply need to hook the end of your metric tape over the endof the stick and carefully mark the graduations in progression up the stick asindicated by the table.
For the hypsometer, mark the scales for both 10 and 15 metres from thetree on the stick. This will give you the flexibility of measuring heights fromeither distance. Some people prefer to have the zero end of the scale a littledistance up the stick so they can hold their hand at the zero point and sightover their thumb to the base of the tree. Apply a couple of coats of varnishto protect your cruising stick.
To use a biltmore stick, simply hold your stick against the tree at breastheight, parallel to the ground and stand back at arm's reach. Be sure to keepyour shoulder square. Sighting with one eye, line up the zero point of thebiltmore stick with the edge of the tree. Using the same eye, sight across thestick to the other edge of the tree stem. Be careful not to move your head.The line from eye to edge of tree will cross the stick on the correct diameterclass designation.
The staff hypsometer is used by simply standing 10 or 15 metres backfrom the tree (15 metres for taller trees), lining up the bottom of the treewith the 0 point on the staff and reading off the section of the appropriatescale that lines up with the top of the top log. The nearest number belowthe top of the highest log is the number of logs. If you are measuring in onemetre height classes, select the nearest graduation. The staff must be heldvertical, your shoulder kept square to your body and your head held still, in

▲ ▲ ▲ ▲ ▲ ▲ ▲ ▲ ▲ ▲ ▲ ▲ ▲ ▲ ▲ ▲ ▲ ▲ ▲ ▲ ▲ A TRUE PICTURE — Taking Inventory of Your Woodlot
29
order to get accuratemeasurements and avoid therepeated type of error thatwill badly affect the accuracyof your data.
Both the staff hypsometerand the Biltmore stick areconsidered to be suitable formaking rough estimates only.Their inaccuracies stem fromthe fact that it is very easy tomake an error that is repeatedover and over again if you donot concentrate on holdingyour arm and body in thesame position, and on keepingyour head still each time youmake a measurement.

A TRUE PICTURE — Taking Inventory of Your Woodlot ▲ ▲ ▲ ▲ ▲ ▲ ▲ ▲ ▲ ▲ ▲ ▲ ▲ ▲ ▲ ▲ ▲ ▲ ▲ ▲ ▲
30
CALIBRATIONS OF BILTMORE STICKDistance from the zero point on the stick to the point marking the lowerlimit of a given diameter class.

▲ ▲ ▲ ▲ ▲ ▲ ▲ ▲ ▲ ▲ ▲ ▲ ▲ ▲ ▲ ▲ ▲ ▲ ▲ ▲ ▲ A TRUE PICTURE — Taking Inventory of Your Woodlot
31
CALIBRATION OF AMERRIT STAFF HYPSOMETER
The two tables below provide the distance from the zero point to pointmarking top of the uppermost log on the staff for various arm reaches. Thedifference between the tables is the distance from the tree that the heightswill be measured from.

A TRUE PICTURE — Taking Inventory of Your Woodlot ▲ ▲ ▲ ▲ ▲ ▲ ▲ ▲ ▲ ▲ ▲ ▲ ▲ ▲ ▲ ▲ ▲ ▲ ▲ ▲ ▲
32
APPENDIX 3 — SAMPLE TALLY SHEETS

▲ ▲ ▲ ▲ ▲ ▲ ▲ ▲ ▲ ▲ ▲ ▲ ▲ ▲ ▲ ▲ ▲ ▲ ▲ ▲ ▲ A TRUE PICTURE — Taking Inventory of Your Woodlot
33
APPENDIX 4 — CODES FOR TREESPECIES NAMES
HARDWOODStrembling aspen Ptlargetooth aspen Plbalsam poplar Pbpoplar, all Powhite birch Bwyellow birch Bygrey birch Bgsugar maple Msred maple Mrsilver maple Msimaple, all Mbeech Bebasswood Bdironwood Iwhickory Hiwhite elm Ewwhite ash Awblack ash Abash Ablack cherry Chred oak Orwhite oak Owbur oak Oboak, all Oblack walnut Wnbutternut Bn
SOFTWOODSwhite pine Pwred pine Prjack pine PjScots pine Pspine, all Pblack spruce Sbwhite spruce Swred spruce Srspruce, all Slarch Lahemlock Hebalsam fir Bfcedar Ceconifers, all C

A TRUE PICTURE — Taking Inventory of Your Woodlot ▲ ▲ ▲ ▲ ▲ ▲ ▲ ▲ ▲ ▲ ▲ ▲ ▲ ▲ ▲ ▲ ▲ ▲ ▲ ▲ ▲
34
APPENDIX 5 — SUMMARY OFSAMPLE HEIGHTS
▲ ▲ ▲ ▲ ▲ ▲ ▲ ▲ ▲ ▲ ▲ ▲ ▲ ▲ ▲ ▲ ▲ ▲ ▲ ▲ ▲ A TRUE PICTURE — Taking Inventory of Your Woodlot
35
AP
PEN
DIX
6 —
CO
MPA
RT
MEN
T S
UM
MA
RY
SH
EET
A TRUE PICTURE — Taking Inventory of Your Woodlot ▲ ▲ ▲ ▲ ▲ ▲ ▲ ▲ ▲ ▲ ▲ ▲ ▲ ▲ ▲ ▲ ▲ ▲ ▲ ▲ ▲
36
AP
PEN
DIX
7a

▲ ▲ ▲ ▲ ▲ ▲ ▲ ▲ ▲ ▲ ▲ ▲ ▲ ▲ ▲ ▲ ▲ ▲ ▲ ▲ ▲ A TRUE PICTURE — Taking Inventory of Your Woodlot
37
AP
PEN
DIX
7b

A TRUE PICTURE — Taking Inventory of Your Woodlot ▲ ▲ ▲ ▲ ▲ ▲ ▲ ▲ ▲ ▲ ▲ ▲ ▲ ▲ ▲ ▲ ▲ ▲ ▲ ▲ ▲
38
AP
PEN
DIX
7c

▲ ▲ ▲ ▲ ▲ ▲ ▲ ▲ ▲ ▲ ▲ ▲ ▲ ▲ ▲ ▲ ▲ ▲ ▲ ▲ ▲ A TRUE PICTURE — Taking Inventory of Your Woodlot
39
APPENDIX 8

A TRUE PICTURE — Taking Inventory of Your Woodlot ▲ ▲ ▲ ▲ ▲ ▲ ▲ ▲ ▲ ▲ ▲ ▲ ▲ ▲ ▲ ▲ ▲ ▲ ▲ ▲ ▲
40
APPENDIX 9

▲ ▲ ▲ ▲ ▲ ▲ ▲ ▲ ▲ ▲ ▲ ▲ ▲ ▲ ▲ ▲ ▲ ▲ ▲ ▲ ▲ A TRUE PICTURE — Taking Inventory of Your Woodlot
NOTES

A TRUE PICTURE — Taking Inventory of Your Woodlot ▲ ▲ ▲ ▲ ▲ ▲ ▲ ▲ ▲ ▲ ▲ ▲ ▲ ▲ ▲ ▲ ▲ ▲ ▲ ▲ ▲


Printed on recycled paper