a vulnerability assessment method for wetlands in the
TRANSCRIPT

Support for the Conservation of High Altitude Wetlands through Application of the Asian Wetland Inventory Approach and Stakeholder-led Catchment Management in Bhutan, China, India and Nepal
A vulnerability assessment method for wetlands in the Himalayan Region
By
Charlie Stratford, Mike Acreman, Gwyn Rees
and Rajendra Shilpakar
Prepared by Centre for Ecology and Hydrology
in collaboration with
International Centre for Integrated Mountain Development Wetlands International
Co-funded by
Asia Pro Eco Programme of European Commission

2

3
Contents
1. Introduction.......................................................................................................... 1
2. The development process ................................................................................... 2
3. Methodology ........................................................................................................ 2
4. Assessment of wetland values............................................................................. 3
5. Assessment of threats to the wetland .................................................................. 8
6. Links between threats and values...................................................................... 10
7. The finished assessment ................................................................................... 11
8. Production of an action plan .............................................................................. 12
References............................................................................................................... 13
Annexes - Wetland vulnerability assessments of selected sites............................... 14
1
1. Introduction Himalayan mountain wetlands are located in the headwaters of many of the region’s most important rivers. They can support a variety of services ranging from providing habitat for endangered species and provision of fertile agricultural land to mitigating against downstream flooding and drought. However, these wetlands are vulnerable to a wide range of human and environmentally driven threats including overgrazing by livestock, increasing pollution and climate change. Therefore, if the values that these wetlands provide are to be conserved, identification and management of threats must be undertaken. This document describes a method that has been developed by The Centre for Ecology and Hydrology (CEH) for the assessment of the vulnerability of wetlands in the Himalayan region. The method aims to provide a simple and easy to use assessment tool suitable for application to a range of wetland types with differing values and experiencing a range of threats. Each assessment will clearly present the main values that the wetland provides, the threats that the wetland is under, and will show which threats impact on which values. The data requirements of the vulnerability assessment are designed to tie in with the Greater Himalayan Wetland Inventory (GHWI) approach so that once the inventory process has been completed for a wetland; the vulnerability assessment can also be carried out. It is understood that there is a trade-off between certainty and accuracy, and practicality and ease of use and in order for this method to be applied successfully, a balance of these conflicting demands will have to be adopted. Data availability is a common issue in many areas of research and this method is designed so that an assessment can still be produced in situations where data are limited or missing. In these cases, the finished assessment will highlight missing data and the future data needs. It is also understood that assessments of this type will contain some subjectivity. The general criteria developed here aim to bring consistency to the assessment process. Reference to the case studies will aid consistency as well as give examples of how the method has been applied to wetlands with differing data availability. This method will help to prepare management action plans to target where resources should be directed both between wetlands and within a wetland. This will help to ensure that the most effective steps to safeguard the wetland site from the identified threats are taken, and that the important values that the wetland provides are protected. It is hoped that as a series of assessments and resulting action plans is built up for the region, sites with similar issues will share their experiences of successful and unsuccessful management, and that this will help to refine the process. Vulnerability assessment should mark the beginning of an ongoing process for wetland protection. The success of a management plan should be evaluated at some time after implementation and the assessment should be revisited as conditions, and

2
consequently values and threats, change. Suitable amendments to the management plan can then be made.
2. The development process
The first stage of development involved a review of relevant literature. General guidance on valuing ecosystems as water infrastructure has been produced by The World Conservation Union (Emerton and Bos, 2004) and The International Convention on Wetlands (RAMSAR) has published guidelines on how to assess wetland values (De Groot et al., 2006). RAMSAR are currently reviewing techniques for assessing the vulnerability of wetlands to changes in ecological character. Work carried out in the UK proposed a 12 level hydrological classification system to classify wetland systems according to their hydrology. Results of trials in East Anglia showed that although the method could give general information, it was not adequate for providing site-specific information about vulnerability (Gilvear at al., 1994). Various recent studies have looked at the vulnerability of wetland systems to climate change in various regions of the world (Johnson et al., Hartig et al., and van Dam et al.). This review provided much useful background information but also highlighted the need for development of a method specific to the Himalayan region. The second stage of development involved field testing, which was carried out by CEH, the International Centre for Integrated Mountain Development (ICIMOD), and Department of National Parks and Wildlife Conservation (DNPWC), Nepal in May 2007 at two wetland sites near Pokhara, Nepal. In addition, a stakeholder workshop held in Kathmandu in May 2007 identified general criteria for identification of threats to the wetlands. Following these investigations, the method was revised and applied at Gokyo and associated wetlands site in Nepal. Final adjustments were made to the method before the final version was presented at a project meeting in Delhi, March 2008.
3. Methodology
The vulnerability assessment method is split up into four main sections; assessment of wetland values, assessment of threats to wetland, links between threats to wetland and wetland values, and vulnerability assessment (Figure 1). Data collected through the GHWI process or collected specifically for the vulnerability assessment are used in the assessment of wetland values and threats to the wetland. These two areas are then bought together via the ‘Links between threats and values’ section which will use both field data and existing literature. Once these steps have been carried out, each value and threat will have been assigned a High, Medium, Low (H/M/L), None or Unknown score, and these can be inputted directly to the vulnerability assessment spreadsheet.
It is recognised that although some there will be some values and threats that will occur at many sites, there is always the possibility that unanticipated values or threats are present. For this reason each table includes space for ‘other

3
values/threats’ in which the user can write in their own value or threat (or both) and these will appear in the subsequent worksheets.
Figure 1. Outline of the vulnerability assessment methodology.
4. Assessment of wetland values
Wetland values are subdivided into ecological, economic, hydrological and social and each is dealt with in more detail below. Where data have not already been collected in the GHWI, examples of data sources are given and an indication of the intensity of data collection is given. It should be noted that in some cases all the necessary data will be available using the suggested low intensity method whereas in other cases it will be necessary to conduct the medium or high intensity methods. Low intensity data collection often refers to existing national data sets and would be suitable for a desk study approach. Medium intensity data collection typically refers to local level data sets and would be likely to involve some travelling and organising of meetings. The high intensity data collection will involve collection of field data and is therefore likely to include site visits and the use of monitoring equipment/techniques. It is likely that in all cases the low intensity data should be collected before the medium intensity data and both should be collected before the high intensity data. It should also be noted that scores of N (none) or U (unknown) can be entered for any wetland value. The important difference is that N indicates that data about that value has been collected but no value was found whereas U indicates that sufficient data has not been collected. In addition, if either one of the value assessments (e.g. economic value or community value in the case of economic value) is known but not both then the assessment value for the known category should be used as the final assessment value. A note should be made that further data collection is required.
4
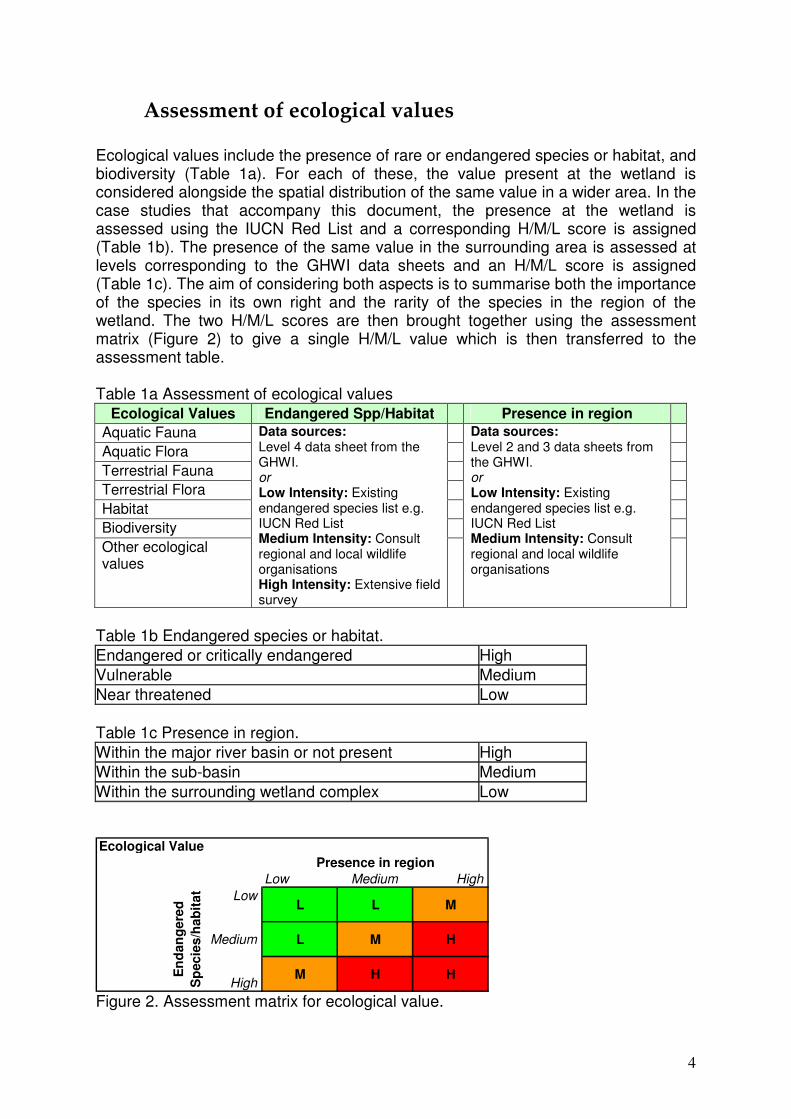
Assessment of ecological values Ecological values include the presence of rare or endangered species or habitat, and biodiversity (Table 1a). For each of these, the value present at the wetland is considered alongside the spatial distribution of the same value in a wider area. In the case studies that accompany this document, the presence at the wetland is assessed using the IUCN Red List and a corresponding H/M/L score is assigned (Table 1b). The presence of the same value in the surrounding area is assessed at levels corresponding to the GHWI data sheets and an H/M/L score is assigned (Table 1c). The aim of considering both aspects is to summarise both the importance of the species in its own right and the rarity of the species in the region of the wetland. The two H/M/L scores are then brought together using the assessment matrix (Figure 2) to give a single H/M/L value which is then transferred to the assessment table. Table 1a Assessment of ecological values
Ecological Values Endangered Spp/Habitat Presence in region Aquatic Fauna Aquatic Flora Terrestrial Fauna Terrestrial Flora Habitat Biodiversity Other ecological values
Data sources: Level 4 data sheet from the GHWI. or Low Intensity: Existing endangered species list e.g. IUCN Red List Medium Intensity: Consult regional and local wildlife organisations High Intensity: Extensive field survey
Data sources: Level 2 and 3 data sheets from the GHWI. or Low Intensity: Existing endangered species list e.g. IUCN Red List Medium Intensity: Consult regional and local wildlife organisations
Table 1b Endangered species or habitat.
Endangered or critically endangered High
Vulnerable Medium
Near threatened Low
Table 1c Presence in region.
Within the major river basin or not present High
Within the sub-basin Medium
Within the surrounding wetland complex Low
Ecological Value
Low Medium High
LowL L M
Medium L M H
HighM H HE
nd
an
ge
red
Sp
ec
ies
/ha
bit
at
Presence in region
Figure 2. Assessment matrix for ecological value.

5
Assessment of economic values Economic values include tourism, fisheries, agriculture and additional goods and services (Table 2a). Each of these is considered in terms of the proportion of wetland income that the value provides (Table 2b) and the percentage of the adult community that are involved in the value (Table 2c). By considering both of these aspects, the monetary and community importance of the value are represented and the dependency of the community on a wetland value is reflected. Table 2a Assessment of economic values
Economic Values Economic Value Community Value
Tourism
Fisheries
Agriculture
Additional goods and services
Other economic values
Data sources: Level 4 data sheet from the GHWI. or Low Intensity: Nationally held data sets e.g. government ministry Medium Intensity: Locally held data sets e.g. Local government departments. High Intensity: Discussion with local government departments in conjunction with interviews with people involved directly with value e.g. farmers, fishermen and tour guides.
Data sources: Level 4 data sheet from the GHWI. or Low Intensity: Nationally held data sets e.g. government ministry Medium Intensity: Locally held data sets e.g. Local government departments. High Intensity: Discussion with local government departments in conjunction with interviews with people involved directly with value e.g. farmers, fishermen and tour guides.
Table 2b Percentage of wetland derived income provided by value
> 40 % High
10 to 40 % Medium
< 10 % Low
Table 2c Percentage of adult community involved in value
> 40 % High
10 to 40 % Medium
< 10 % Low
The two H/M/L scores are then brought together using the assessment matrix (Figure 3) to give a single H/M/L value which is then transferred to the assessment table.
6
Economic Value
Low Medium High
LowL L M
Medium L M H
HighM H H
Ec
on
om
ic
Va
lue
Community Value
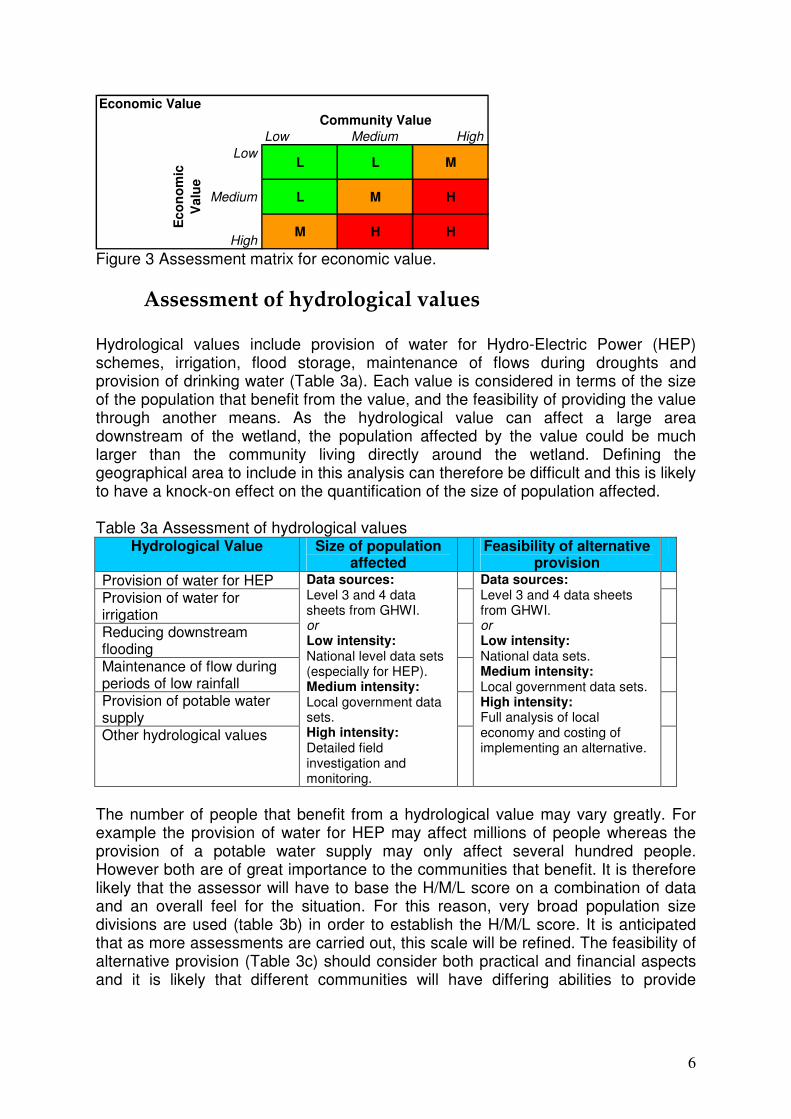
Figure 3 Assessment matrix for economic value.
Assessment of hydrological values
Hydrological values include provision of water for Hydro-Electric Power (HEP) schemes, irrigation, flood storage, maintenance of flows during droughts and provision of drinking water (Table 3a). Each value is considered in terms of the size of the population that benefit from the value, and the feasibility of providing the value through another means. As the hydrological value can affect a large area downstream of the wetland, the population affected by the value could be much larger than the community living directly around the wetland. Defining the geographical area to include in this analysis can therefore be difficult and this is likely to have a knock-on effect on the quantification of the size of population affected. Table 3a Assessment of hydrological values
Hydrological Value Size of population affected
Feasibility of alternative provision
Provision of water for HEP Provision of water for irrigation
Reducing downstream flooding
Maintenance of flow during periods of low rainfall
Provision of potable water supply
Other hydrological values
Data sources: Level 3 and 4 data sheets from GHWI. or Low intensity: National level data sets (especially for HEP). Medium intensity: Local government data sets. High intensity: Detailed field investigation and monitoring.
Data sources: Level 3 and 4 data sheets from GHWI. or Low intensity: National data sets. Medium intensity: Local government data sets. High intensity: Full analysis of local economy and costing of implementing an alternative.
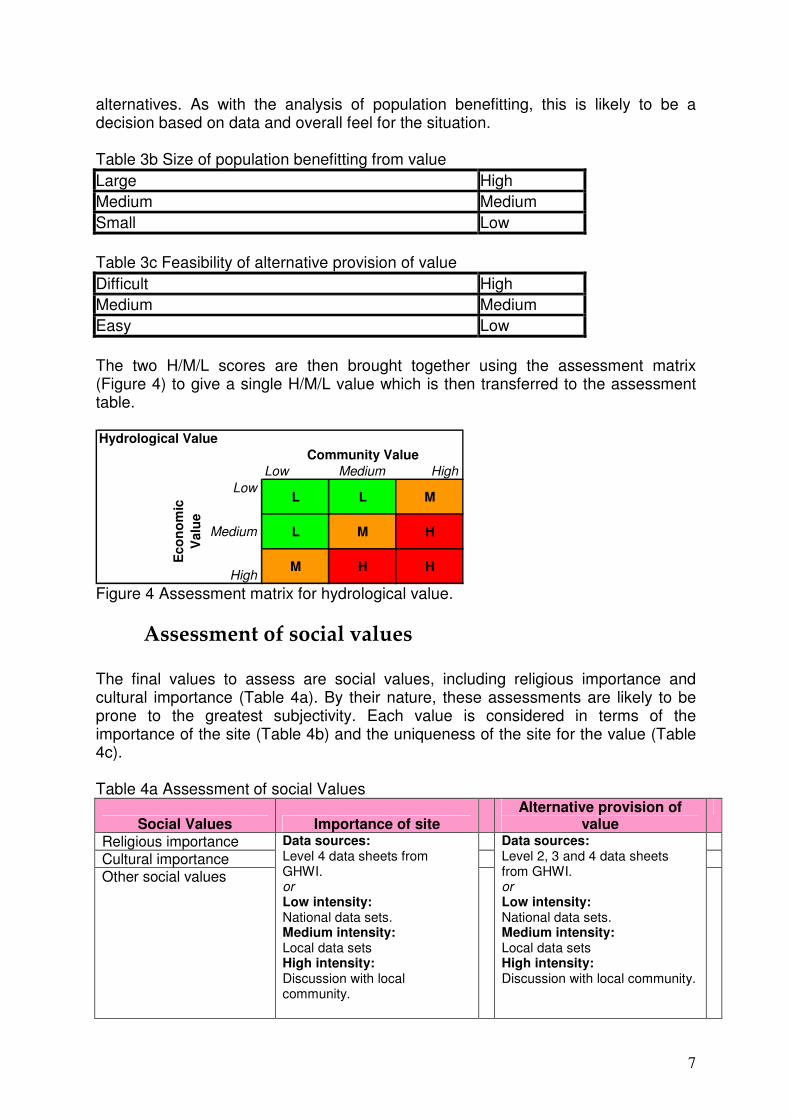
The number of people that benefit from a hydrological value may vary greatly. For example the provision of water for HEP may affect millions of people whereas the provision of a potable water supply may only affect several hundred people. However both are of great importance to the communities that benefit. It is therefore likely that the assessor will have to base the H/M/L score on a combination of data and an overall feel for the situation. For this reason, very broad population size divisions are used (table 3b) in order to establish the H/M/L score. It is anticipated that as more assessments are carried out, this scale will be refined. The feasibility of alternative provision (Table 3c) should consider both practical and financial aspects and it is likely that different communities will have differing abilities to provide
7
alternatives. As with the analysis of population benefitting, this is likely to be a decision based on data and overall feel for the situation. Table 3b Size of population benefitting from value
Large High
Medium Medium
Small Low
Table 3c Feasibility of alternative provision of value
Difficult High
Medium Medium
Easy Low
The two H/M/L scores are then brought together using the assessment matrix (Figure 4) to give a single H/M/L value which is then transferred to the assessment table. Hydrological Value
Low Medium High
LowL L M
Medium L M H
HighM H H
Community Value
Ec
on
om
ic
Va
lue
Figure 4 Assessment matrix for hydrological value.
Assessment of social values The final values to assess are social values, including religious importance and cultural importance (Table 4a). By their nature, these assessments are likely to be prone to the greatest subjectivity. Each value is considered in terms of the importance of the site (Table 4b) and the uniqueness of the site for the value (Table 4c). Table 4a Assessment of social Values
Social Values Importance of site Alternative provision of
value
Religious importance Cultural importance Other social values
Data sources: Level 4 data sheets from GHWI. or Low intensity: National data sets. Medium intensity: Local data sets High intensity: Discussion with local community.
Data sources: Level 2, 3 and 4 data sheets from GHWI. or Low intensity: National data sets. Medium intensity: Local data sets High intensity: Discussion with local community.
8
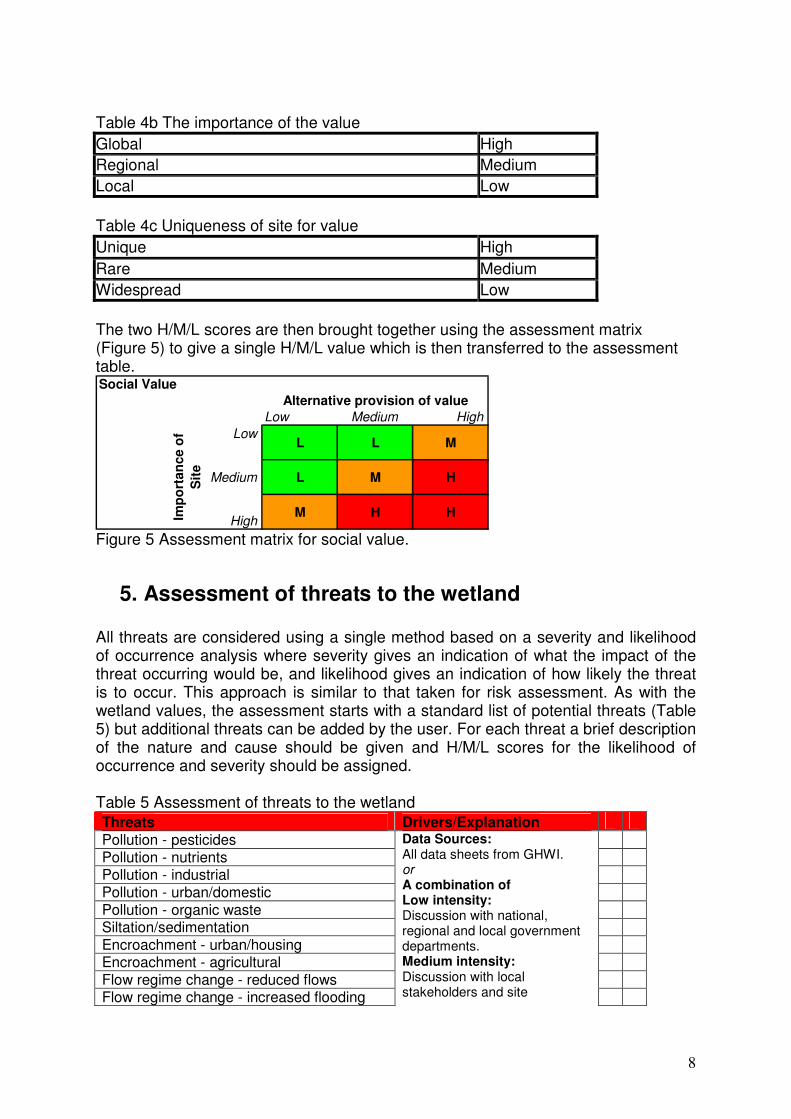
Table 4b The importance of the value
Global High
Regional Medium
Local Low
Table 4c Uniqueness of site for value
Unique High
Rare Medium
Widespread Low
The two H/M/L scores are then brought together using the assessment matrix (Figure 5) to give a single H/M/L value which is then transferred to the assessment table. Social Value
Low Medium High
LowL L M
Medium L M H
HighM H H
Alternative provision of value
Imp
ort
an
ce o
f
Sit
e
Figure 5 Assessment matrix for social value.
5. Assessment of threats to the wetland All threats are considered using a single method based on a severity and likelihood of occurrence analysis where severity gives an indication of what the impact of the threat occurring would be, and likelihood gives an indication of how likely the threat is to occur. This approach is similar to that taken for risk assessment. As with the wetland values, the assessment starts with a standard list of potential threats (Table 5) but additional threats can be added by the user. For each threat a brief description of the nature and cause should be given and H/M/L scores for the likelihood of occurrence and severity should be assigned. Table 5 Assessment of threats to the wetland
Threats Drivers/Explanation
Pollution - pesticides Pollution - nutrients Pollution - industrial Pollution - urban/domestic Pollution - organic waste Siltation/sedimentation Encroachment - urban/housing Encroachment - agricultural Flow regime change - reduced flows Flow regime change - increased flooding
Data Sources: All data sheets from GHWI. or A combination of Low intensity: Discussion with national, regional and local government departments. Medium intensity: Discussion with local stakeholders and site
9
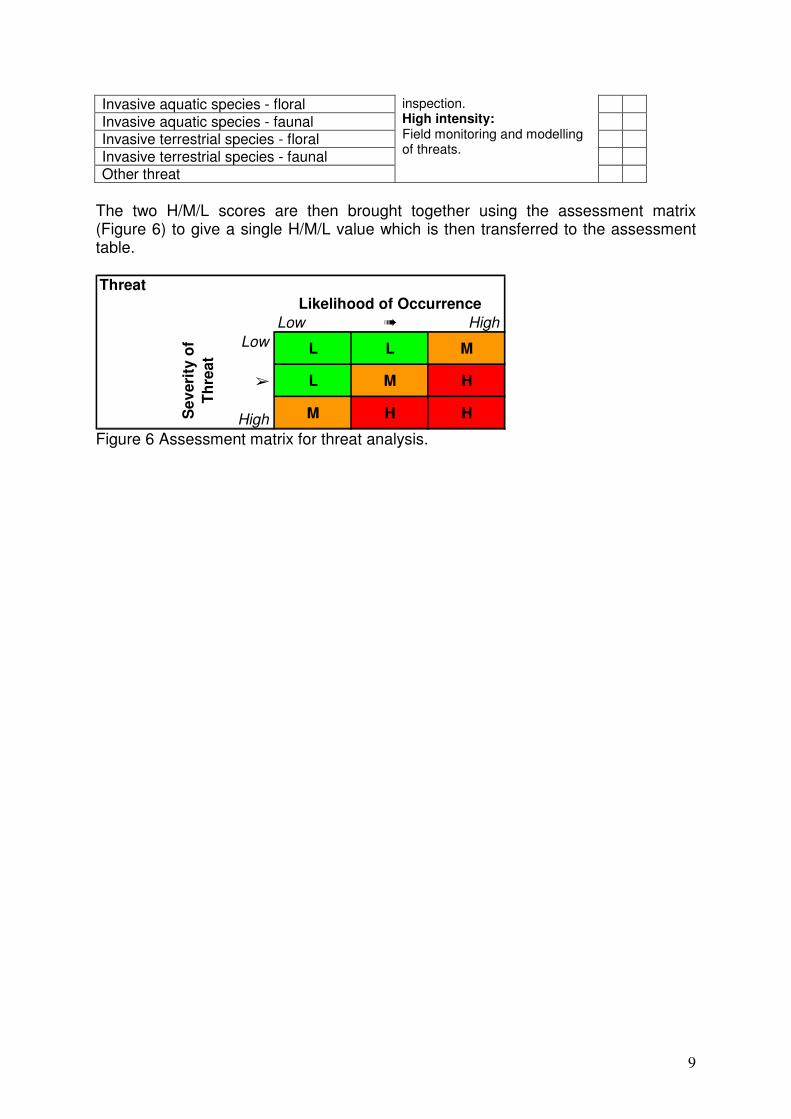
Invasive aquatic species - floral Invasive aquatic species - faunal Invasive terrestrial species - floral Invasive terrestrial species - faunal Other threat
inspection. High intensity: Field monitoring and modelling of threats.
The two H/M/L scores are then brought together using the assessment matrix (Figure 6) to give a single H/M/L value which is then transferred to the assessment table. Threat
Low à High
Low L L M
â L M H
High M H HSe
veri
ty o
f
Th
reat
Likelihood of Occurrence
Figure 6 Assessment matrix for threat analysis.

10
6. Links between threats and values The next stage of the assessment process is to establish how the threats will impact on the values. An H/M/L is given to each interaction. If no interaction occurs then N is entered into the matrix. As the interactions at different sites may be similar, this worksheet contains default values. The user must remember to change the default values if the circumstances at their site differ from the case study examples. An example of the interaction matrix is shown in figure 7. THREAT ON IMPACT MASTER CROSS REFERENCE
Pollu
tion
- p
esticid
es
Pollu
tion
- n
utr
ien
ts
Pollu
tion
- ind
ustr
ial
Pollu
tion
- u
rban
/dom
estic
Pollu
tion
- o
rgan
ic w
aste
Silt
ation/s
ed
imenta
tion
Encro
ach
ment
- u
rba
n/h
ou
sin
g
Encro
ach
ment
- a
gricultura
l
Flo
w r
egim
e c
ha
nge -
reduced
flo
ws
Flo
w r
egim
e c
ha
nge -
incre
ased flo
odin
g
Invasiv
e a
quatic s
pecie
s -
flo
ral
Invasiv
e a
quatic s
pecie
s -
fauna
l
Invasiv
e t
err
estr
ial specie
s -
flo
ral
Invasiv
e t
err
estr
ial specie
s -
fauna
l
Ecological Impact
Loss of rare fauna (aquatic) H H H H H M L L L L L H N N
Loss of rare flora (aquatic) H H H H H M L L L L H M N N
Loss of rare fauna (terrestrial/avian) M M M M M L L L L L N N L H
Loss of rare flora (terrestrial) M M M M M L L L L L N N H M
Loss of important habitat M M M M M M M M M M M M M M
Loss of biodiversity M M M M M M M M M M M M M M
Other ecological impact
Other ecological impact
Other ecological impact
Economic Impact
Loss of tourism L L L L L M L L L L L L L L
Loss of fisheries H H H H H M L L L L L H N N
Loss of agriculture M M M M M M M N M M N N M M
Loss of additional goods and services M M M M M M M M M M M M M M
Other economic impact
Other economic impact
Other economic impact
Hydrological Impact
Loss of HEP N N N N N M L L H N L N N N
Loss of irrigation M M M M M L L L H N L N N N
Increase in downstream flooding N N N N N M M M N H N N N N
Reduced flows in lean period N N N N N M M M H N N N N N
Loss of potable water supply H M H H H M L L M N L L N N
Other hydrological impact
Other hydrological impact
Other hydrological impact
Social Impact
Degredation of religious site L L L L L M L L L L L L L L
Loss of cultural heritage L L L L L M L L L L L L L L
Other social impact
Other social impact
Other social impact Figure 7 Impact of threats on wetland values. An example of how the interaction matrix would be used is the effect of pollution from nutrients, which may be considered to have a direct impact on loss of rare aquatic flora and fauna (both therefore given a value of H) compared to the less direct effect that it might have on tourism where some tourists may be deterred by the algal

11
blooms that accompany eutrophication (and would therefore be given a value of L). The case studies will be useful in guiding the values used in the matrix.
7. The finished assessment Once all the values have been entered into the correct worksheets, the finished assessment will automatically be produced. An example output from the assessment tool is shown in figure 8.
Figure 8 An example output from the assessment tool. In the finished assessment, the wetland values are listed in rows down the left hand side of the spreadsheet and the threats are shown in columns across the top of the spreadsheet. The assessment aims to summarise a large amount of information and may therefore appear complicated at first, however the following simple colour codes and symbols are used:
• Green, amber or red square in the main body of the assessment indicates a threat having an impact on a value (Low, medium or high impact respectively).
• A zero value indicates no impact/effect of threat.

12
• *** indicates that there is unknown information about a threat that could have an impact on a value. Information on this threat should be collected.
• /// indicates that there is unknown information about a value that is likely to be under threat. Information about the value should be collected.
• */* indicates that information about the threat and value are both missing but an interaction between the two has been identified. Information about both should be collected.
• If either a value or threat are shaded red then this indicates that information is lacking.
This coding system should simplify the putting together of an action plan by highlighting the values that are under most threat, and the threats that are impacting on the most values. Resources can therefore be assigned to tackle these issues. In addition, future data requirements are identified and can be addressed.
8. Production of an action plan
The final step in the process is to produce an action plan based on the finished assessment. The action plan consists of 3 main areas:
1. Identification of the values that are under threat, subdivided according to high/medium/low score.
2. Steps that should be taken in order to address the threats that impact on those values.
3. Requirements for further data collection. The values that are under threat are extracted from the assessment by reading down the values on the left hand side of the worksheet and picking out those that have red, amber or green squares in their corresponding rows. The colours present will determine which of high/medium/low vulnerability classes the value should be placed in. Identifying the steps necessary to address the threats starts with reading along the columns at the top of the sheet and seeing which columns contain red, amber or green squares. Again, the colours present will determine which of high/medium/low the value should be placed in. From this, a suitable mitigation measure is proposed. The mitigation at this stage is likely to be overview of how the threat can be dealt with rather than a detailed site management plan. The requirements for future data collection are identified by checking the rows and columns for boxes shaded red, and these are then listed in the action plan. It is highly recommended that the user refers to the 3 case studies for examples of how to produce an action plan from the assessment worksheet.

13
References De Groot, R.S., Stuip, M.A.M., Finlayson, C.M. and Davidson, N. 2006. Valuing
wetlands: guidance for valuing the benefits derived from wetland ecosystem services, Ramsar Technical Report No. 3/CBD Technical Series No. 27. Ramsar Convention Secretariat, Gland, Switzerland & Secretariat of the Convention on Biological Diversity, Montreal, Canada. ISBN 2-940073-31-7.
Emerton, L. and Bos, E. 2004. Value. Counting Ecosystems as an Economic Part of
Water Infrastructure. IUCN, Gland, Switzerland and Cambridge, UK. 88pp. Gilvear, D.J., Tellam, J.H., Lloyd, J.W. and Lerner, D.N. 1994. Wetland vulnerability
in East Anglia – The range of validity of a generalised classification approach. Aquatic Conservation – Marine and Freshwater Ecosystems, 4(2): 105-124.
Hartig, E.K., Grozev, O. and Rosenzweig, C. 1997. Climate change, agriculture and
wetlands in Eastern Europe: Vulnerability, adaptation and policy. Climatic Change, 36(1-2): 107-121.
Johnson, W.C., Millett, B.V., Gilmanov, T., Voldseth, R.A., Guntenspergen, G.R. and
Naugle, D.E. 2005. Vulnerability of Northern Prairie Wetlands to Climate Change. Bioscience, 55(10), 863-872.
van Dam, R.A., Finlayson, C.M. and Watkins, D. (eds). 1999. Vulnerability
assessment of two major wetlands in the Asia-Pacific region to climate change and sea level rise. Supervising Scientist Report 149, Supervising Scientist, Darwin.
Annexes – Wetland vulnerability assessments of selected sites

i
Annex 1: Wetland Vulnerability Assessments Wetland Name: Phewa Lake, Pokhara
Assess Wetland Values
Ecological Value
Table 1 Ecological Values
Ecological Values Endangered Spp/Habitat Presence in region
Aquatic Fauna None recorded N N
Aquatic Flora None recorded N N
Terrestrial Fauna None recorded N N
Terrestrial Flora Podocapus neriifolia, Shorea robusta, Bombax ceiba, as well as several Orchid and Lichen species, are all on the HMG/Nepal list of protected species, banned for cutting and export.
M Present at sub-basin level M
Habitat None recorded N N
Biodiversity 7 vegetation types 104 bird species 34 mammal species 16 fish species 14 reptile species 6 amphibian species 39 aquatic macrophytes
H High biodiversity value H
Other ecological values
Notes:
Economic Value Table 2 Economic Values
Economic Values Economic Value
Community Value
Tourism 90,000 to 100,000 tourists visit Pokhara each year. 387 hotels in Pokhara. 53 tourist agencies 47 trekking agencies 504 trekking guides 722 boats operate on the lake 500 NRs/day without boatman 1000 NRs/day with boatman 200 NRs/hour with boatman There are 350 boatmen They typically earn 4000 to 5000 NRs per month.
M
Tourism contributes 16% of the total income of Pokhara.
L
Fisheries The average wage of a fisherman is 100,000 NRs to 150,000 NRs/year In 2005, the contract for all the fish caught in the year was worth 4 million NRs. Fish are purchased from the fisherman for 240 NRs/kg and is sold to the market for 260 NRs/kg. The rate for farmed fish is 150 NRs/kg.
M
80 households (each of 5 to 6 people) are dependent on fishing and fish farming.
L
Agriculture The cattle that graze the area around the lake are sold at market. The bulls typically fetch 10,000 NRs, Black and white cows fetch 2000 NRs The others fetch 700 NRs. (Diary) Economically important species of aquatic plants include; Hydrilla as feed for Grass Carp.
M
Relatively low concentration of farmers in relation to size of city.
L

ii
Edible nuts of water chestnut/Trapa Bispinosa, Cutgrass/Leersia hexandra and Wild Rice/Oryza Rufipogon as fodder. The following have economic and commercial significance; Swertia chirayita, Bergenia cillata, Choreospondias axillaries, Elaeocarpus sphaericus.
Additional goods and services
Other economic values
Notes:
Hydrological Value
Table 3 Hydrological Values Hydrological Value Size of population affected Feasibility of alternative provision
Provision of water for HEP The HEP scheme is 2 km downstream of Phewa and has a design power of 1 MW. Due to ageing it now only operates at 200 kW.
L
This is costly compared to the cost of importing electricity.
L
Provision of water for irrigation Originally the water from the lake fed 8 km of irrigation channels and irrigated an area of 750 ha. Now approx. 320 ha is irrigated however the high soil infiltration rates mean that the agriculture is not considered sustainable.
L
50% of the land is being developed and urbanised and agricultural production will gradually move elsewhere.
M
Reducing downstream flooding Determined by dam operation U U
Maintenance of flow during periods of low rainfall
Determined by dam operation U
U
Provision of potable water supply Water is abstracted from the lake for domestic purposes however this is unmonitored.
U Unmonitored.
U
Other hydrological values
Notes:
Social Value Table 4 Social Values
Social Values Importance of site
Alternative provision of value
Religious importance Barahi temple (a shrine to the water goddess), is located on an island in the middle of Phewa Lake. It is an important religious monument and attracts many people. It is accessible only through boats available at the shores of the lake. Regional Importance.
M
Unique/rare
M
Cultural importance N N
Other social values
Notes:

iii
Assess Threats to Wetlands Table 5 Sources of data for threat identification.
Threats Drivers/Explanation
Pollution - pesticides Pesticide use around the lake is impacting on aquatic spp. and on fish farming.
M M
Pollution - nutrients Fertiliser application for vegetable production is putting some load on the lake. Total phosphorus and total nitrogen are above dangerous levels and eutrophication is possible. A previous algal bloom in the early 90s (as a result of destruction of ecotone or buffer zone) resulted in mass fish kills combined with health impacts on swimmers (skin rash, itching and conjunctivitis). This had a direct negative impact on tourism based economies.
H H
Pollution - industrial None identified N N
Pollution - urban/domestic Development along the lakeside is putting pressure on the lake however > 90% of homes have septic tanks and even the very poor are being given grants to help them install septic tanks. Compared with 30 years ago there is now very little sewage entering the river.
M L
Pollution - organic waste None identified N N
Siltation/sedimentation Large problem of siltation especially over the last 20 years. In approx. the last 50 years, 1 to 2 km of the northern end of the lake have been lost. The lake area has decreased by approx. 2 ha/yr due to siltation. The villagers around Phewa are trying to build small dams to hold back the sediment.
H M
Encroachment - urban/housing None identified N N
Encroachment - agricultural None identified N N
Flow regime change - reduced flows There has been a decrease in rainfall. L M
Flow regime change - increased flooding None identified N N
Invasive aquatic species - floral Species include; “Jalkumbhii”, Water hyacinth/Eichornia crassipes, Coon Tail/Ceratophyllum demersum and Torpedo Grass/Panicum repens.
M M
Invasive aquatic species - faunal None identified N N
Invasive terrestrial species - floral Species include; “ban mara” Crofton weed/Eupatorium adenophorum, “Masino kande” Lantana/Lantana camera.
M M
Invasive terrestrial species - faunal None identified N N
Other threat
Notes:

iv
Define links Between Threats and Values
Pollu
tion -
pesticid
es
Pollu
tion -
nutr
ients
Pollu
tion -
industr
ial
Pollu
tion -
urb
an/d
om
estic
Pollu
tion -
org
anic
waste
Silt
ation/s
edim
enta
tion
Encro
achm
ent -
urb
an/h
ousin
g
Encro
achm
ent -
agricultura
l
Reduced f
low
s
Incre
ased f
loodin
g
Invasiv
e a
quatic s
pecie
s -
flo
ral
Invasiv
e a
quatic s
pecie
s -
faunal
Invasiv
e t
err
estr
ial specie
s -
flo
ral
Invasiv
e t
err
estr
ial specie
s -
faunal
Ecological Impact
Loss of rare fauna (aquatic) H H H H H M L L L L L H 0 0
Loss of rare flora (aquatic) H H H H H M L L L L H M 0 0
Loss of rare fauna (terrestrial/avian) M M M M M L L L L L 0 0 L H
Loss of rare flora (terrestrial) M M M M M L L L L L 0 0 H M
Loss of important habitat M M M M M M M M M M M M M M
Loss of biodiversity M M M M M M M M M M M M M M
Economic Impact
Loss of tourism L L L L L M L L L L L L L L
Loss of fisheries H H H H H M L L L L L H 0 0
Loss of agriculture M M M M M M M 0 M M 0 0 M M
Loss of additional goods and services
Hydrological Impact
Loss of HEP 0 0 0 0 0 M L L H 0 L 0 0 0
Loss of irrigation M M M M M L L L H 0 L 0 0 0
Increase in downstream flooding 0 0 0 0 0 M M M 0 H 0 0 0 0
Reduced flows in lean period 0 0 0 0 0 M M M H 0 0 0 0 0
Loss of potable water supply H M H H H M L L M 0 L L 0 0
Social Impact
Degredation of religious site L L L L L M L L L L L L L L
Loss of cultural heritage L L L L L M L L L L L L L L

v
Assessment

vi
Action Plan for Phewa Lake, Pokhara, Nepal.
The following values are under threat: High None Medium Terrestrial flora Biodiversity Tourism Religious importance Low Fisheries Agriculture Provision of water for HEP Provision of water for irrigation The following steps should be taken:
• Agricultural pesticide and fertiliser application practices should be changed to minimise inputs to the lake.
• Upstream land-use practices should be changed to minimise soil erosion and reduce sediment inputs to the lake.
• Steps should be taken to control the proliferation of aquatic and terrestrial invasive species.
• Monitoring of domestic sewage discharges from properties around the lake should be periodically carried out.
• A hydrological study of the lake should be carried out to understand the effect of decreasing rainfall on inputs to the lake, and mitigation measures (if any) should be identified.
The following areas require further data collection:
• The effect of the lake on the downstream hydrology (both reducing flooding and maintaining low flows).
• The value of lake water as a potable water supply is currently unknown.
i
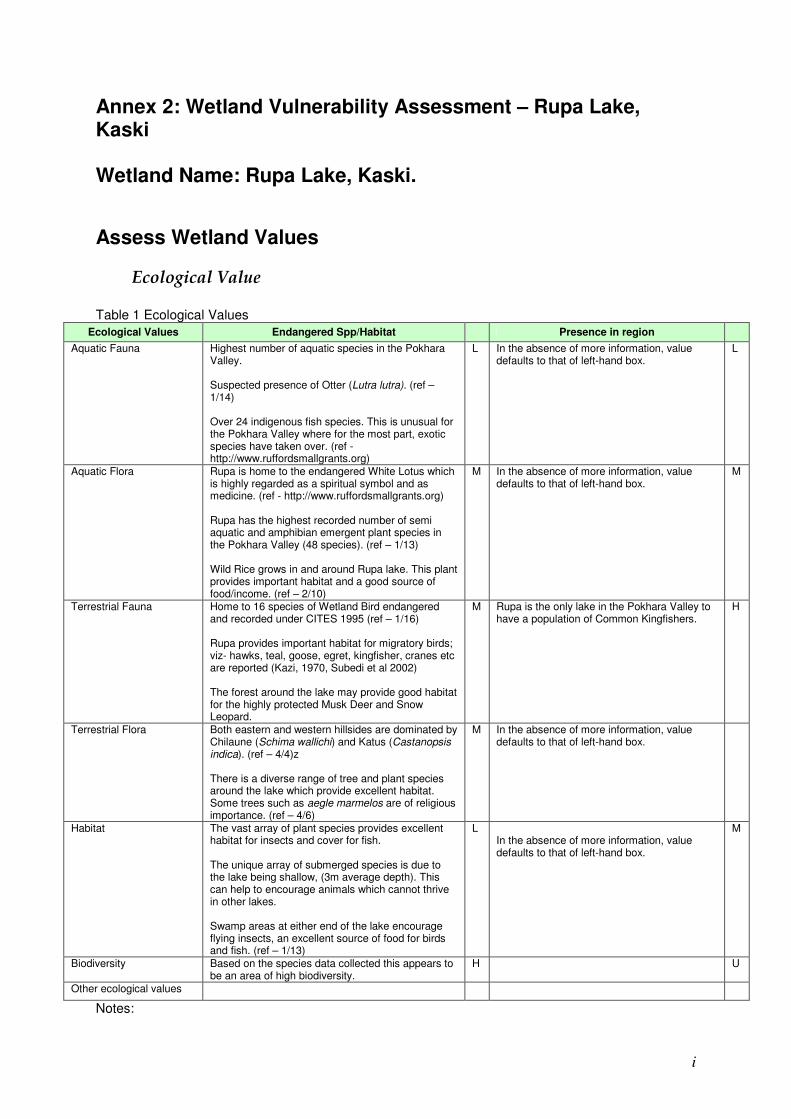
Annex 2: Wetland Vulnerability Assessment – Rupa Lake, Kaski Wetland Name: Rupa Lake, Kaski.
Assess Wetland Values
Ecological Value
Table 1 Ecological Values
Ecological Values Endangered Spp/Habitat Presence in region
Aquatic Fauna Highest number of aquatic species in the Pokhara Valley. Suspected presence of Otter (Lutra lutra). (ref – 1/14) Over 24 indigenous fish species. This is unusual for the Pokhara Valley where for the most part, exotic species have taken over. (ref - http://www.ruffordsmallgrants.org)
L In the absence of more information, value defaults to that of left-hand box.
L
Aquatic Flora Rupa is home to the endangered White Lotus which is highly regarded as a spiritual symbol and as medicine. (ref - http://www.ruffordsmallgrants.org) Rupa has the highest recorded number of semi aquatic and amphibian emergent plant species in the Pokhara Valley (48 species). (ref – 1/13) Wild Rice grows in and around Rupa lake. This plant provides important habitat and a good source of food/income. (ref – 2/10)
M In the absence of more information, value defaults to that of left-hand box.
M
Terrestrial Fauna Home to 16 species of Wetland Bird endangered and recorded under CITES 1995 (ref – 1/16) Rupa provides important habitat for migratory birds; viz- hawks, teal, goose, egret, kingfisher, cranes etc are reported (Kazi, 1970, Subedi et al 2002) The forest around the lake may provide good habitat for the highly protected Musk Deer and Snow Leopard.
M Rupa is the only lake in the Pokhara Valley to have a population of Common Kingfishers.
H
Terrestrial Flora Both eastern and western hillsides are dominated by Chilaune (Schima wallichi) and Katus (Castanopsis indica). (ref – 4/4)z There is a diverse range of tree and plant species around the lake which provide excellent habitat. Some trees such as aegle marmelos are of religious importance. (ref – 4/6)
M In the absence of more information, value defaults to that of left-hand box.
Habitat The vast array of plant species provides excellent habitat for insects and cover for fish. The unique array of submerged species is due to the lake being shallow, (3m average depth). This can help to encourage animals which cannot thrive in other lakes. Swamp areas at either end of the lake encourage flying insects, an excellent source of food for birds and fish. (ref – 1/13)
L In the absence of more information, value defaults to that of left-hand box.
M
Biodiversity Based on the species data collected this appears to be an area of high biodiversity.
H U
Other ecological values
Notes:

ii
Economic Value Table 2 Economic Values
Economic Values Economic Value
Community Value
Tourism 2,000 – 3,000 internal tourists visit the lake each year, along with 400 – 500 foreigners. The annual Rupa festival attracts thousands more visitors. (ref - Stratford 2007)
M Tourism is not responsible for a great deal of income in the region
L
Fisheries 200-300kg of fish caught per day and taken to market. Fishing on the lake also serves 345 households. (ref – Stratford 2007) Various large Carp species introduced and bred in cage culture. There are eight enclosures in the lake covering 16.2 ha area with a total yield of 10425 kg of fish per year.
H
Fish are a major source of food for the area and provide the second greatest income after arable farming.
H
Agriculture Oranges, Bananas and vegetables are grown as cash crops. Coffee is being grown under the shade of Orange Trees and some farmers have taken to growing all 4 of the above on one unit of land. Buffalo are farmed for milk. Organic farming is now popular in the area, and some farmers are now cross breeding wild and regular rice, which can fetch up to 5000NR per 100m2 A number of locals have taken to subsistence farming on terraced slopes as they find it more economically viable. The women’s group collect White Lotus seeds. In 2006, 6000 NR worth of seeds were sold.
H
The people that live around Rupa lake rely on agriculture for income and for personal consumption. Around 95.5% of people are involved in farming.
H
Additional goods and services Some wetland area is given to the local school for education and food production. Any produce harvested helps to pay for teachers and resources. Whilst 95.5% of people are employed in agriculture, the other 4.5% are employed in the services industry.
M The school is very important to the community as a significant number of medium wealth and poor people are illiterate. Improved facilities may improve literacy and make schooling available to the poor.
H
Other economic values
Notes:

iii
Hydrological Value
Hydrological Value Size of population affected Feasibility of alternative provision
Provision of water for HEP Not known U Not known U
Provision of water for irrigation The majority of farmers have some form of irrigation. Most Khetlands of the villages are irrigated by kulo, a local method. The majority of irrigation systems are community managed, whilst only the more wealthy farmers have private systems.
H
95% Of local population involved in farming.
M
Reducing downstream flooding Not known U Not known U
Maintenance of flow during periods of low rainfall
Not known
U Not known
U
Provision of potable water supply Not known although likely to be medium/high.
H Likely to be medium/high
M
Other hydrological values
Notes:
Social Value Table 3 Social Values
Social Values Importance of site
Alternative provision of value
Religious importance A temple named Barahi is located in the central part of the eastern side of the lake. Major festivals are celebrated here and help to bring people in from surrounding areas and abroad. Activities such as Bratabandha (Pabitra thread ceremony) are celebrated throughout the year. Several species of trees are said to be of religious importance in the area, along with the rare White Lotus.
M There are other religious sites within the Pokhara Valley.
M
Cultural importance Rupa is considered a sacred lake, owing to the story compiled by Anirudra Adhikari of Begna Kaski.
M To the people of Rupa the cultural importance is high, however this perhaps doesn’t extend outside of the immediate catchment.
L
Other social values
Notes:

iv
Assess Threats to Wetlands Table 4 Sources of data for threat identification.
Threats Drivers/Explanation S L
Pollution - pesticides Chemical insecticides and pesticides are not used. N N
Pollution - nutrients 40% of farmers use chemical fertilizers. In Khetland and Bariland Urea is being used. Some resource rich farmers use DAP in their paddy fields, and overall the use of inorganic fertilizers is increasing. Of course, much of the fertiliser used on the slopes around the lake will und up in the water leading to eutrophication. All farmers use manure as a fertilizer. Populations of large fish, both native and introduced contribute to nutrient loading.
M M
Pollution - industrial No major industry in the area. N N
Pollution - urban/domestic Homes in the area have been fitted with their own sewage treatment facility. Unless these malfunction, domestic pollution is minimal.
L L
Pollution - organic waste Unusually high plant growth and a major population of large fish (some introduced) contribute to a greater biological load. The breakdown of this organic waste increases the biological oxygen demand.
M M
Siltation/sedimentation Siltation is a major problem for Rupa lake and means it has become ever shallower. Over time it is predicted that the lake might disappear. The watershed area of Dovan Khola stream is large and is the major source of sedimentation in lake Rupa. The vegetation cover around the lake is very good But the Dovhan Khola collects sediments from Talbesi, Dhademere, Kuraudikhet, Tilar, Ramkot, Syaklun, Paurakhe, Chaur and Sahukuna. Because of this, the sediment load in the stream is always heavy. Another stream, the Bhangara, brings a high load of stones, gravels and debris into the lake. The construction of a road nearby has caused heavy erosion and mudflows have been observed along it. Intensive cultivation practices on the slopes and upstream have caused heavy siltation also, causing an overall reduction in surface area and volume of water. Many flora and fauna have been adversely affected.
H M
Encroachment - urban/housing Little or no development around the lake. N N
Encroachment - agricultural The cultivation of paddy fields at the inlet and on the marshy shores of the lake has replaced much of the important wetland area. This causes loss of wildlife, a decrease in water level and an increased run-off of fertilizers.
M L
Flow regime change - reduced flows Not known U U
Flow regime change - increased flooding Not known
U U
Invasive aquatic species - floral Infestations of Vallesneria, water chestnuts and water Hyacynths. L M
Invasive aquatic species - faunal Several species of large fish have been introduced for fishing purposes. These fish need to be controlled to favour native species.
L M
Invasive terrestrial species - floral Not known U U
Invasive terrestrial species - faunal Not known U U
Other threat

v
Define links Between Threats and Values
Pollu
tion -
pesticid
es
Pollu
tion -
nutr
ients
Pollu
tion -
industr
ial
Pollu
tion -
urb
an/d
om
estic
Pollu
tion -
org
anic
waste
Silt
ation/s
edim
enta
tion
Encro
achm
ent -
urb
an/h
ousin
g
Encro
achm
ent -
agricultura
l
Reduced f
low
s
Incre
ased f
loodin
g
Invasiv
e a
quatic s
pecie
s -
flo
ral
Invasiv
e a
quatic s
pecie
s -
faunal
Invasiv
e t
err
estr
ial specie
s -
flo
ral
Invasiv
e t
err
estr
ial specie
s -
faunal
Ecological Impact
Loss of rare fauna (aquatic) H H H H H M L L L L L H 0 0
Loss of rare flora (aquatic) H H H H H M L L L L H M 0 0
Loss of rare fauna (terrestrial/avian) M M M M M L L L L L 0 0 L H
Loss of rare flora (terrestrial) M M M M M L L L L L 0 0 H M
Loss of important habitat M M M M M M M M M M M M M M
Loss of biodiversity M M M M M M M M M M M M M M
Economic Impact
Loss of tourism L L L L L M L L L L L L L L
Loss of fisheries H H H H H M L L L L L H 0 0
Loss of agriculture M M M M M M M 0 M M 0 0 M M
Loss of additional goods and services M M M M M M H M M M M M M M
Hydrological Impact
Loss of HEP 0 0 0 0 0 M L L H 0 L 0 0 0
Loss of irrigation M M M M M L L L H 0 L 0 0 0
Increase in downstream flooding 0 0 0 0 0 M M M 0 H 0 0 0 0
Reduced flows in lean period 0 0 0 0 0 M M M H 0 0 0 0 0
Loss of potable water supply H M H H H M L L M 0 L L 0 0
Social Impact
Degredation of religious site L L L L L M L L L L L L L L
Loss of cultural heritage L L L L L M L L L L L L L L

vi
Assessment

vii
Action Plan
The following values are under threat: High None Medium Aquatic flora
Terrestrial fauna Biodiversity Fisheries Agriculture Additional goods and services Religious Importance Low Aquatic fauna
Tourism Cultural importance
The following steps should be taken:
• Agricultural fertiliser application practices should be changed to minimise inputs to the lake.
• Care should be taken not to overstock the lake area with fish as the resulting waste matter may result in a high biological oxygen demand.
• Upstream land-use practices should be changed to minimise soil erosion and reduce sediment inputs to the lake.
• Monitoring of domestic sewage discharges from properties around the lake should be periodically carried out.
• Local farmers should be discouraged from farming practices that involve encroaching on the wetland area.
• Steps should be taken to control the proliferation of aquatic invasive species. The following areas require further data collection:
• The effect of the lake on the downstream hydrology (both reducing flooding and maintaining low flows).
• The value of lake water for production of HEP.
• The potential for flow regime change either from natural or anthropogenic causes.
• The presence of terrestrial invasive species (both flora and fauna).

i
Annex 3: Wetland Vulnerability Assessment – Gokyo and associated wetlands Wetland Name: Gokyo.
Assess Wetland Values
Ecological Value
Table 1 Ecological Values
Ecological Values Endangered Spp/Habitat Presence in region
Aquatic Fauna Data not available U Data not available U
Aquatic Flora Data not available U Data not available U
Terrestrial Fauna Snow Leopard (Uncia uncia) Musk deer (Muschus chryogasterI) Gallinago nemoricola (Wood Snipe)
H The region is habitat for the endangered species listed in previous column
M
Terrestrial Flora Neopicrrohiza scrophulariifolia (Rare) Saussurea gossipiphora (Rare) Meconopsis horridula (Vulnerable) Swertia multicaulis
M Above 80 species of flowering plants have been recorded from Gokyo catchment including 4 endemic species of plants species.
M
Habitat Data not available U Data not available U
Biodiversity Data not available U Data not available U
Other ecological values – Presence of ethnobotanically useful plant species.
Neopicrrohiza scrophulariifolia (M) Ephedra geradiana (M) Swertia multicaulis (M) Cortia hookeri (M) Selinum wallichiana (M) Rhododendron anthopogon (M) Rheum acuminatum (M) R. australe (M) Aconitum spicatum (M) Oxyria digyna (P) Rheum acuminatum (P) R. australe (P) Rhododendron anthopogon (I) Juniperous indica (I)
M A number of Ethnobotanically useful plant species are under threats some are due to excessive local use & some are naturally rare in occurrence.
M
Notes:

ii
Economic Value Table 2 Economic Values
Economic Values Economic Value
Community Value
Tourism - Gokyo is one of the major tourists destinations in SNP (average of 7,000 tourists visit every yr) - Pilgrims (about 500) visit each year during local festival (Janai Purnima) Due to Spectacular landscape, unique flora & fauna including cultural and lifestyle of local people, famous tourist destinations in Nepal.
H Hotels and lodge are totally dependent on the tourist who visits the Gokyo lake. People are not much seen to be dependent on the daily livelihood directly, tourism based economy is partially dependent. Catchments used as grazing by yak-naks of locals.
H
Fisheries No evidence of fish in the lake N No evidence of fish in the lake N
Agriculture No agriculture practice in the catchment N No agriculture practice in the catchment N
Additional goods and services Catchments seasonally serve grazing (about 100 cattle graze for 8 months) pasture land
M Provision of grazing land. M
Other economic values
Notes:
Hydrological Value
Hydrological Value Size of population affected Feasibility of alternative provision
Provision of water for HEP None N None N
Provision of water for irrigation None N None N
Reducing downstream flooding Information unavailable U Information unavailable U
Maintenance of flow during periods of low rainfall
Information unavailable U Information unavailable U
Provision of potable water supply The domestic water user’s use for the drinking purpose. Lake water is used for bathing & washing clothes.
H The hotels ( Gokyo area has 8 hotels) use lake water
H
Other hydrological values – Sediment trapping
Sediment from the catchment is trapped in the lakes.
M Provision of Clear & non turbid water to the D/S dwellers
M
Other hydrological values – Water for mills Used by few traditional water mills L Major source of energy for running traditional water mills.
M
Notes:
Social Value Table 3 Social Values
Social Values Importance of site
Alternative provision of value
Religious importance -During Janaipurnima festival, about 500 people visit to take holy bath & perform puja. -Site is respected as place of lord shiva and visnu. -The faith of no harms to the birds in the lakes provides shelter to the wetlands birds.
M Unknown
Cultural importance The people of Namche celebrates Janai Purnima festival in Gokyo, the snake god is celebrated by all the devotees any time they visit there.
M Unknown
Other social values
Notes:

iii
Assess Threats to Wetlands Table 4 Sources of data for threat identification.
Threats Drivers/Explanation
Pollution - pesticides No information U U
Pollution - nutrients Pilgrimage offer flowers, leaves & grains which increases nutrients content
L L
Pollution - industrial Not at all N N
Pollution - urban/domestic Domestic sewages from the 8 hotels M H
Pollution - organic waste Garbage produced by tourists & their supporting team. M M
Siltation/sedimentation Information Unavailable U U
Encroachment - urban/housing One of the hotels has been reported to encroach the lake by erecting stone walls upto margins of lakes.
L L
Encroachment - agricultural Not at all N N
Flow regime change - reduced flows Information Unavailable U U
Flow regime change - increased flooding Information Unavailable U U
Invasive aquatic species - floral Unknown (Not reported) U U
Invasive aquatic species - faunal Unknown (Not reported) U U
Invasive terrestrial species - floral Unknown (Not reported) U U
Invasive terrestrial species - faunal Unknown (Not reported) U U
Other threat - Overgrazing Overgrazing (about 100 cattle graze for about 8 months) reduces the palatable sps. & increase the colony of unpalatable leading to change in floral & faunal composition disturbing the natural succession process.
M M
Notes:

iv
Define links Between Threats and Values
Pollu
tion -
pesticid
es
Pollu
tion -
nutr
ients
Pollu
tion -
industr
ial
Pollu
tion -
urb
an/d
om
estic
Pollu
tion -
org
anic
waste
Silt
ation/s
edim
enta
tion
Encro
achm
ent -
urb
an/h
ousin
g
Encro
achm
ent -
agricultura
l
Reduced f
low
s
Incre
ased f
loodin
g
Invasiv
e a
quatic s
pecie
s -
flo
ral
Invasiv
e a
quatic s
pecie
s -
faunal
Invasiv
e t
err
estr
ial specie
s -
flo
ral
Invasiv
e t
err
estr
ial specie
s -
faunal
Overg
razin
g
Ecological Impact
Loss of rare fauna (aquatic) H H H H H M L L L L L H 0 0 0
Loss of rare flora (aquatic) H H H H H M L L L L H M 0 0 0
Loss of rare fauna (terrestrial/avian) M M M M M L L L L L 0 0 L H L
Loss of rare flora (terrestrial) M M M M M L L L L L 0 0 H M M
Loss of important habitat M M M M M M M M M M M M M M M
Loss of biodiversity M M M M M M M M M M M M M M M
Loss of ethnobotanically useful plants M M M M M M M M M M M M M M L
Economic Impact
Loss of tourism L L L L L M L L L L L L L L L
Loss of fisheries H H H H H M L L L L L H 0 0 0
Loss of agriculture M M M M M M M 0 M M 0 0 M M M
Loss of additional goods and services M M M M M M H M M M M M M M M
Hydrological Impact
Loss of HEP 0 0 0 0 0 M L L H 0 L 0 0 0 0
Loss of irrigation M M M M M L L L H 0 L 0 0 0 0
Increase in downstream flooding 0 0 0 0 0 M M M 0 H 0 0 0 0 0
Reduced flows in lean period 0 0 0 0 0 M M M H 0 0 0 0 0 0
Loss of potable water supply H M H H H M L L M 0 L L 0 0 0
Sediment trapping 0 0 0 0 0 M M M 0 M 0 0 0 0 0
Water for mills 0 0 0 0 0 M M M M 0 0 0 0 0 0
Social Impact
Degredation of religious site L L L L L M L L L L L L L L L
Loss of cultural heritage L L L L L M L L L L L L L L L

v
Assessment

vi
Action Plan for Rupa Lake, Kaski, Nepal.
The following values are under threat: High Provision of a potable water supply Medium Terrestrial flora Terrestrial fauna The presence of ethnobotanically important species Additional goods and services Low Tourism Sediment trapping Provision of water for water mills Religious importance Cultural importance The following steps should be taken:
• A system of sewage collection and processing for the properties around the lake should be introduced.
• Proper facilities for litter disposal should be set up.
• Agricultural fertiliser application practices should be changed to minimise inputs to the lake.
• Planning regulation and monitoring of new building activities around the lake should be put in place to prevent further encroachment of the lake.
• Farmers should be encouraged not to overgraze the area, which could be implemented through a combination of education and enforcement.
The following areas require further data collection:
• The aquatic flora and fauna present in the lake.
• The habitat provided by the wetland area.
• The effect of the lake on the downstream hydrology (both reducing flooding and maintaining low flows).
• Pollution from pesticides.
• Sediment inputs to the lake.
• The potential for flow regime change either from natural or anthropogenic causes.
• The presence of terrestrial invasive species (both flora and fauna).