a work project, presented as part of the requirements …£o_2014.pdf · swot 10 tows 12 hotel...
TRANSCRIPT

A Work Project, presented as part of the requirements for the Award of a Masters
Degree in Management from the NOVA – School of Business and Economics.
INTERNATIONALIZATION FIELD LAB
THE INTERNATIONALIZATION OF VILA GALÉ TO THE SOUTH OF BRAZIL
Guilherme Paiva Lapas de Gusmão, 1380
A Project carried out on the Management course, under the supervision of:
Professor Sonia Dahab
Lisbon, January 6th 2014

AKNOWLEDGEMENTS
I would like to thank with gratitude to my coordinator, Sonia Dahab, for the supportive
guidance that she kindly offered, to Vila Galé’s Administrator, Gonçalo Rebelo de
Almeida, for the availability and helpful information provided every time requested, and
finally to Associação da Hotelaria de Portugal and Câmara de Comércio e Industria
Luso-Brasileira for the generous assistance they both served me with.
ABSTRACT
“THE INTERNATIONALIZATION OF VILA GALÉ TO THE SOUTH OF BRAZIL”
This working project will consist in the study of an internationalization plan of Vila Galé
to the South of Brazil, focusing on a new model for the company: the Vila Galé Express.
A company profile is traced, as well its goals and strategies. Aligning a complete
definition of the Express type hotel with several internal and external analysis aiming the
South of Brazil, it was possible to elaborate an entry strategy and assess its financial
viability, concluding that an Investment in the South needs to be cautious while, at the
same time, fast and efficient or it won’t be sustainable.
Key Words: South of Brazil, Portuguese Hotels, Express Hotels

TABLE OF CONTENTS
TABLE OF ABREVIATIONS I
TABLE OF FIGURES II
VILA GALÉ 1
The Group 1
The Strategy 3
VILA GALÉ EXPRESS 3
Benchmarking 4
SOUTH OF BRAZIL 5
Macro Analysis 6
Political 6
Economical 6
Social 7
Technological 7
Environmental 7
Legal 8
City Selection 8
Tourist Afflux 9
Investors Perspective 10
SWOT 10
TOWS 12
Hotel Concentrarion Analysis 13
Curitiba 13
Porto Alegre 14
Florianopolis 14
International Analysis Conclusion 15
INTERNATIONALIZATION 16
Entry Mode 16
Financial Analysis 17
Implementation 20
Marketing Mix 20
Implementation Phases 23
FINAL CONCLUSION AND RECOMMENDATIONS 25
REFERENCIES 26
APPENDICES 29
ENDNOTES 53

I
TABLE OF ABREVIATIONS
ADR Average Daily Rate
BNDES Banco Nacional de Desenvolvimento Econômico e Social
Cofins Contribuição para o Financiamento da Seguridade Social
CSLL Contribuição Social sobre o Lucro Liquido
F&B Food & Beverages
FDI Foreign Direct Investment
HDI Human Development Index
HI Holiday Inn
HIE Holiday Inn Express
IHG InterContinental Hotel Group
IPTU Imposto sobre a Propriedade predial e Territorial Urbana
IRPJ Imposto de Renda Pessoa Juridica
ISS Imposto Sobre Serviços (de Qualquer Natureza)
ITBI Imposto sobre a Transmissão de Bens Imóveis
OR Occupancy Rate
PASEP Programa de Formação do Patrimônio do Servidor Público
PI Profitability Index
PIS Programa de Integração Social
VG Vila Galé
VGE Vila Galé Express

II
TABLE OF FIGURES
Table 1 – Average Annual Growth of Brazil, the Southern Region and its States 6
Table 2 – South of Brazil Airport Traffic 9
Table 3 – Airports’ Capacity and Prospects made in 2009 10
Table 4 – SWOT Analysis for an Internationalization to the South of Brazil 10
Figure 1 – Implementation Chart (simplified) 23

THE INTERNATIONALIZATION OF VILA GALÉ TO THE SOUTH OF BRAZIL
1
VILA GALÉ
The Group
Vila Galé is a Portuguese hotel chain created in 1986 by three families. Initially, the
objective was simply to open one hotel in Praia da Galé, Algarve. However, this first
project was so successful that the group growth started right away. As so, until 1995,
through the acquisition of lands, existent hotels and buildings under construction, VG
expanded its portfolio through the Portuguese southern region. In 1996 the second stage
began, with the goal of getting totally national, evolving first to the Lisbon area and then
Oporto and Coimbra’s. Nowadays, with hotels also in Madeira and Alentejo, the group
believes it covers already the main touristic areas in Portugal. Therefore, VG was able to
create a quite strong presence in Portugal in these 27 years that past since its creation,
being now placed in second in the ranking of largest groups operating in the country, with
3808 rooms/apartments in 2012i. Although is still relatively distant from the third place
(Accor Hotels with 2890 rooms), the leader of this table is far beyond VG numbers:
Pestana Hotels&Resorts/Pestana Pousadas had 6483 rooms/apartments in 2012.
However, VG rooms are dispersed through much less properties than the leading
competitor. Plus, the group started operating 14 years after Pestana, which might tell us
that, following the current expansion rhythm, and considering that the leader hasn’t got
much more to evolve in the country, it could reach the national top in few years.
This strong presence and growth in the country encouraged VG to go abroad. The destiny
chosen for the first internationalization was the northeast of Brazil, since it was spotted a
lack of Resorts in this country and the region was a quite good place for this kind of
hotels. It is possible to say that the internationalization strategy was through a Greenfield
strategy, besides the fact that the second hotel (opened 2 years after the first one) was

INTERNATIONALIZATION FIELD LAB
2
developed on the lights of a Management Contract strategy. Some years after, VG ended
up buying this second Resort, but nowadays two out of 24 hotels in the portfolio are still
under this kind of management since 2009 in Brazil. Its presence in this country relies
mostly in the Northeast region, with only one in the Southeast and another one coming
up at this same region. (See Exhibit 1 for Company Portfolio.)
The group is considerably centralized, being the following departments, besides
Administration, shared by all the hotels in the portfolio: Marketing and Sales; Human
Resources; Administrative and Financial; Legal; Technical, and; IT. There’s also an
Operational department coordinating each hotel work and so each propriety has solely a
purely operational structure. (See Exhibit 2 for Organizational Chart.)
VG has been quite successful among its customers, such in Portugal as in Brazil.
Observing clients’ reviews at booking.com, the most valued feature in Brazil was
Comfort, followed right away by Location. In Portugal, the most valued one was
Location, followed closely by Staff and Clean. Is possible to consider that, so far, what
VG is able to provide better is then the hotel location (which is reasonable since the group
is so careful in its acquisitions). However, both in Portugal and Brazil, the worse quality
of VG hotels was Value for Money scoring 7.5 in Portugal and 6.9 in Brazil which
indicates that the hotels might be moderately overpriced, or at least are not perceived as
really opportunities (see Exhibit 3 for complete booking.com Scorecard). Also, looking
at the internal reviews, the low Value for Money stated by booking.com can be seen in the
overall low values in the column Voltaria?1, despite almost every quality before analysed
by the surveys had had quite high scores. (See Exhibit 4 for complete Internal Survey.)
1 “Would you come back?” in a literal translation
THE INTERNATIONALIZATION OF VILA GALÉ TO THE SOUTH OF BRAZIL
3
The Strategy
VG mission is defined by one simple sentence “Sempre perto de si”2 and its culture is
aligned with eight values: Appreciation, Innovation, Loyalty, Ambition, Assurance,
Accessibility, Freedom and Efficiency (literal translation). These pillars were defined
properly by the managers when VG was already 15 years old but it was based on the
management practices until then and it is how the group is still administrated.
For the future, VG not only wants to find new international destinations but also desires
to expand its Brazilian portfolio further south, either in number of properties as also in
type of hotels. This strategy is sought in order to balance the characteristic Resorts’
seasonality. In Portugal, a seasonal balance was achieved through the investment in
City/Leisure hotels. The Brazilian strategy would be similar, with already one city hotel
functioning and another one under construction. However, to boost this South American
expansion, VG wanted to apply a new project already thought but never used – the Vila
Galé Express.
VILA GALÉ EXPRESS
To define properly VGE it’s important to settle first the concept of the Express hotels.
This model can be seen as the fusion of the two more common types of accommodation:
the Bed&Breakfast and the Budget. The first one embraces normally small family hotels,
from 4 to 11 rooms, quite typical in the USii. The second holds for regular hotels,
relatively large, with less amenities than the competitors in order to practice lower prices.
As so, Express hotels might be identified as relatively large hotels (around 120 rooms)
offering basically only good accommodation and breakfast as the B&B type, but keeping
a relatively low price through the elimination of common amenities usually used by other
2 “Always close to you” in a literal translation

INTERNATIONALIZATION FIELD LAB
4
hotels (e.g. gym, pool or restaurant). This type targets people who came in town just for
business and consequently have no time nor interest in using the several additional
amenities besides a good night sleep, internet and breakfast like other business hotels
offer.
The two brands leading this sub-market are: Holiday Inn Express (from the
InterContinental Hotels Group) and Ibis (from the Accor Group). These are the ideal
brands to be benchmarked.
Benchmarking
Assessing the best-in-class would help not only to understand how to operate in the
market, as it would also allow VG to spot faults, and consequently, opportunities for the
company, in those models. Currently, the two best-in-class, HIE and Ibis, dominate
completely the Express sub-market. Their practices and amenities are relatively similar
and are the ones that most characterize this hotel business sector. Both offer “excellent”
large beds, free breakfast and Wi-Fi in all rooms. Discrepancies are scarce, limited to a
competition based on the principle of “who serves better the amenity that both offer”,
leading HIE to offer allegedly better Wi-Fi connection, while Ibis optioned for a larger
schedule for breakfasts. It is also quite important to point the two key success factors for
this type of hotel: location and price. The location of every HIE is carefully oriented to
the business customers, leading to locations like near the airports or business centres. Ibis,
even though less than HIE, is also oriented to business customers, providing then hotels
close to business centres. Prices are the main advantage for these hotels being chosen over
other Business hotels. By offering less amenities, like gym or pool, Express hotels are
able to lower their prices relatively to other Business/City hotels in good locations,
targeting people who have no interest into these additional services.

THE INTERNATIONALIZATION OF VILA GALÉ TO THE SOUTH OF BRAZIL
5
It should also be taken into consideration some hotel indicators from these two brands,
like the Occupancy Rate, Average Daily Rate and the RevPAR. Regarding HIE, the brand
presented in the first half of 2013 an overall OR of 57.25%. The ADR for the total 2045
hotels was US$101.69 in the same semester and the RevPAR US$67.22iii. Concerning the
economy range of Accor, from which make part the three Ibis brands, it is possible to
verify a higher than HIE OR, 67.7%, but a lower ADR and RevPAR, US$72.8 and
US$49.4.3,iv
VG has already some plans regarding this project. As Gonçalo Rebelo de Almeida, VG’s
administrator, said “We are talking about hotels in cities, between 80 and 120 rooms, with
the size of the bedroom with bathroom around 22m2 […] As additional services there will
only be one coffee shop for breakfasts and snacks. The rooms would have their normal
equipment: it is vital to have a good LCD screen, good internet access, basic features of
the Express model.” The brand itself is also already thought: it will be a sub-brand, so
“Vila Galé Express”, with a logo in white and a green.
SOUTH OF BRAZIL
Brazil is a federative republic composed by 26 States and one Federal District. These
States are grouped, even though only for geographical purposes, into five regions: North,
Northeast, Central-West, Southeast and South. The Southern region of Brazil is
composed by three states only – (from north to south) Paraná, Santa Catarina and Rio
Grande do Sul. Their capitals are, respectively: Curitiba, Florianopolis and Porto Alegre.
3 Values provided by Accor in € but converted to US$ at a rate of 1.3$/€

INTERNATIONALIZATION FIELD LAB
6
Macro analysis
Each region of Brazil is different and so a careful and focused analysis on the Southern
region is necessary. To the effect, a PESTEL analysis was performed in order to
understand the three states situation.
Political
Brazil has, in general, some political stability, having this one only being "reconsidered"
by the population in a more severe way in 2013 through some significant protests. This
discontentment came most likely from the country's economic growth slowdown, which
result in several social issues (like unemployment). Another cause pointed was the
expenditures with the future world events and the corruption involved in this question.
As so, people demanded more transparency in order to fight the corruption. Nevertheless,
considering the world's recovery from the global crisis, it is expected that Brazil will be
able to restart its strong growth and so diminishing the dissents.
Economical
The South and South-Eastern region of Brazil are considerably more developed than any
other regions in the country. This might be due to the concentration of the population in
the area (see Exhibit 5, Figure 1). Two of the Southern States grew at a faster pace than
the country’s annual GDP growth from ’95 to ’07, being Rio Grande do Sul the only one
who couldn’t achieve such growth.
Table 1 – Average Annual Growth of Brazil, the Southern Region and its States
These States grew, in general, at a slower pace than most of the other states (see Exhibit
6 for complete table) but this should be translated as the catch up of the remaining ones
Average Annual Growth in % from 95’ to 07’
Brazil 2.967
South of Brazil 3.370
Paraná 3.528
Rio Grande Do Sul 2.438
Santa Catarina 4.146

THE INTERNATIONALIZATION OF VILA GALÉ TO THE SOUTH OF BRAZIL
7
and not a bad performance from the Southern region (see Exhibit 5, Figure 2). Also, the
country’s economy is still quite based on the commodity sector while the Southern
regions are already facing quite more the services sector. Nevertheless is in the South that
still relies most of the country’s wealth (see Exhibit 5, Figure 3).
Social
The social development that took place in the last 20 years in Brazil was tremendous. The
country passed from an overall poor HDI to a general quite good index, almost reaching
the level of the developed economies' HDI. In fact, the South and Southeast region are
the ones that evolved the most, being a great part of the municipalities above the country's
average and 43 out of the 44 municipalities which are considered highly developed
(HDI>0.8) are in the South and Southeast regionv. This translates that these regions have,
on average, a quite good life expectancy, a low level of illiteracy and an elevated GDP
per capita.
Technological
Brazil is considered the most developed country of Latin America in several technological
areas. However, the most relevant for the case is definitely the communication sector.
Brazil is quite developed in this particular matter in the Centre, South and Southeast
regions, supporting all the modern network means, contrasting with the other regions. Is
also the 5th country with more internet users in the worldvi.
Environmental
Concerning this issue, it is possible to say that Brazil is, at some level, an eco-friendly
country. Its carbon emissions are quite low, especially when compared with other
emerging economies (see Exhibit 5, Figure 4), and even the ones emitted are quite
“consumed” by the vast territory still covered by forest (see Exhibit 5, Figure 5). Plus,
the energy consumption in Brazil relies a lot on oil and hydroelectric power (47% and

INTERNATIONALIZATION FIELD LAB
8
35% respectively) and it’s the 2nd country which more biodiesel produces and usesvii.
Considering all this data, it is possible to conclude that this country is, at least for the
following years, relatively environmental sustainable. The weather in the three states of
the South is humid subtropical, which means that the temperature in the summer is usually
high and in the winter mild. The precipitation observed stays at a stable level all year, yet
not much accentuated.viii
Legal
The bureaucracy in Brazil is quite high and is considered one of the biggest barriers to
the investment in the country, since it increases the corruption and makes the business
activity slow and more costful. The taxes are also a concern for most investors since are
usually quite high and complex.
There are several laws to be taken into account, namely the ones involved in the process
of opening an hotel (see Exhibit 8 for the relevant laws applicable to the hotel industry).
Although these laws are one of the main bureaucratic problems that some investors point,
VG should not have much trouble dealing with these since they are basically the same
that the company had to pass through while creating the other hotels in the country. About
the taxes, there are two types that apply to the hotel business: the federal and the municipal
(there are no statual taxes to apply to the hotel business directly). VG knows already all
of them since they are the same all over the contry. The only different relies on the
percentages taken by the municipes (the ISS, the ITBI and the IPTU) which might be
different from the ones practiced where VG has already hotels.
City Selection
Considering the Macro analysis of the country with some specific focus in the Southern
region and taking into consideration the characteristics of the Express hotel model, is
THE INTERNATIONALIZATION OF VILA GALÉ TO THE SOUTH OF BRAZIL
9
pertinent to define before any further analysis, which should be considered good cities in
the region for the internationalization. Good indicators that should be considered are the
city’s afflux of people and the investors’ opinion about those. These two analysis give us
the reality and the prospects of the businesses development in the area.
Tourist Afflux
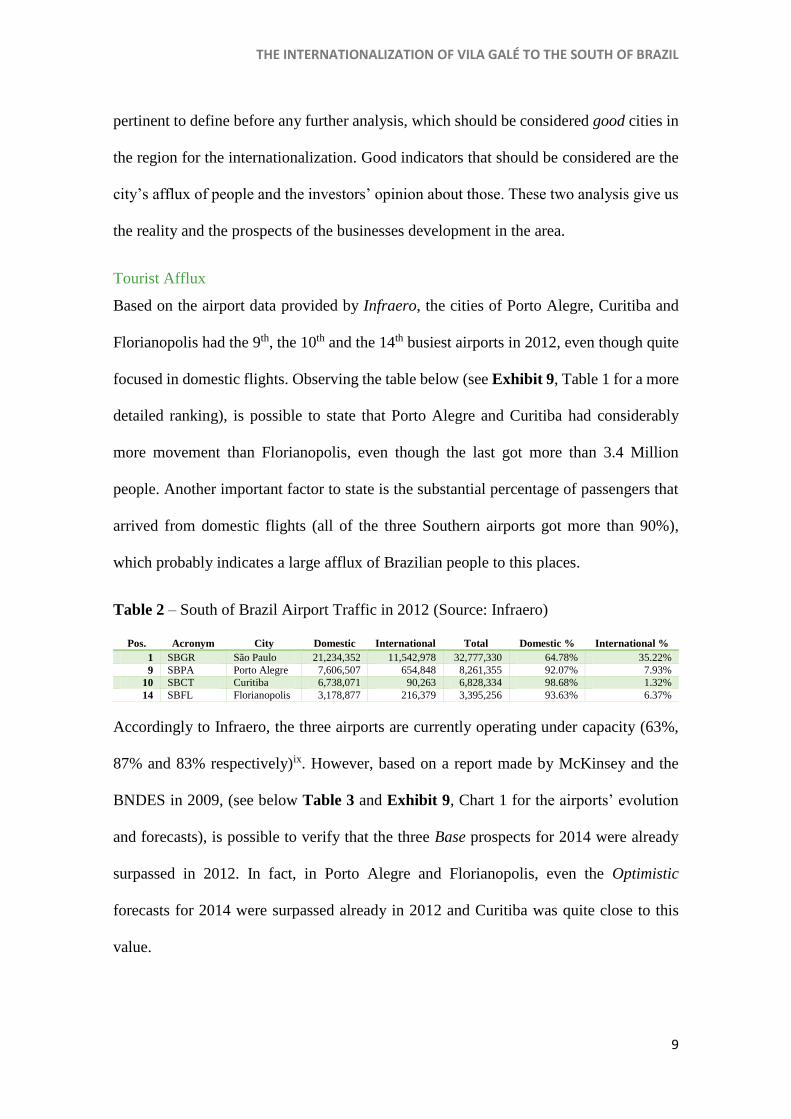
Based on the airport data provided by Infraero, the cities of Porto Alegre, Curitiba and
Florianopolis had the 9th, the 10th and the 14th busiest airports in 2012, even though quite
focused in domestic flights. Observing the table below (see Exhibit 9, Table 1 for a more
detailed ranking), is possible to state that Porto Alegre and Curitiba had considerably
more movement than Florianopolis, even though the last got more than 3.4 Million
people. Another important factor to state is the substantial percentage of passengers that
arrived from domestic flights (all of the three Southern airports got more than 90%),
which probably indicates a large afflux of Brazilian people to this places.
Table 2 – South of Brazil Airport Traffic in 2012 (Source: Infraero)
Pos. Acronym City Domestic International Total Domestic % International %
1 SBGR São Paulo 21,234,352 11,542,978 32,777,330 64.78% 35.22%
9 SBPA Porto Alegre 7,606,507 654,848 8,261,355 92.07% 7.93%
10 SBCT Curitiba 6,738,071 90,263 6,828,334 98.68% 1.32%
14 SBFL Florianopolis 3,178,877 216,379 3,395,256 93.63% 6.37%
Accordingly to Infraero, the three airports are currently operating under capacity (63%,
87% and 83% respectively)ix. However, based on a report made by McKinsey and the
BNDES in 2009, (see below Table 3 and Exhibit 9, Chart 1 for the airports’ evolution
and forecasts), is possible to verify that the three Base prospects for 2014 were already
surpassed in 2012. In fact, in Porto Alegre and Florianopolis, even the Optimistic
forecasts for 2014 were surpassed already in 2012 and Curitiba was quite close to this
value.

INTERNATIONALIZATION FIELD LAB
10
Table 3 – Airports’ Capacity and Prospects made in 2009 (Sources: Infraero and BNDES)
Passengers
in 2012 Capacity
Capacity
Usage
Prospects made in 2009
2014 Pess. 2014 Base 2014 Opt. 2020 2030
Porto Alegre 8,261,355 13,100,000 63% 6,300,000 7,200,000 8,100,000 9,700,000 15,800,000
Curitiba 6,828,334 7,800,000 88% 5,400,000 6,200,000 7,000,000 8,400,000 13,800,000
Florianopolis 3,395,256 4,177,800 81% 2,200,000 2,500,000 2,900,000 3,400,000 5,600,000
Investors Perspective
In a study conducted by EY in order to sound the investment in Brazil and to draw
forecasts about it, Curitiba and Porto Alegre appeared in 3rd and 5th place at the list of
Brazilian cities with more FDI in the last years, only surpassed by São Paulo, Rio de
Janeiro (1st and 2nd) and Campinas (4th). Also in the same document, Curitiba was elected
by several queried investors the most promising city of Brazil while Porto Alegre and
Florianopolis stayed with the 4th and 10th place. (See Exhibit 10 for both rankings.)
Taking into account all this, is reasonable to conduct the succeeding analysis bearing in
mind an internationalization for one or more of these three Southern capitals, since they
are the most promising cities in the region.
SWOT
A SWOT analysis was assembled in order to retrieve a better perspective of the Pros and
Cons of this expansion.
Table 4 – SWOT Analysis for an Internationalization to the South of Brazil
STRENGTHS WEAKNESSES
Knowledge of the Brazilian market, due
to its 12 years of experience operating
there;
Really patient and careful might slows
down the process too much4;
4 E.g. Vila Galé Rio de Janeiro took about 10 years to start being built and if started earlier could probably profit more from the exponential growth in tourism seen in the last years in this hub.

THE INTERNATIONALIZATION OF VILA GALÉ TO THE SOUTH OF BRAZIL
11
An internationalization success history;
Really patient and careful, always to
minimize the entry risks. VG has its own
personnel looking for exactly what is
considered an opportunity for the
company in predefined areas of the
globe;
Defined culture;
Strong brand in Brazil.
No experience in the type of Express
hotels;
No partnerships in Brazil, even though
VG says that hadn’t needed them so
far;
No experience in the Southern states.
OPPORTUNITIES THREATS
No HIE in the three cities of the South;
Strong development from the Southern
cities, boosted by the economy of the
neighbourhood cities of the Southeast
(S. Paulo, Rio de Janeiro, Campinas…)
(see Exhibit 6 and 9);
Strong prospects on the eyes of the
investors (see Exhibit 10);
The upcoming international events
might boost the three Southern cities5;
Good location of the Southern States
concerning Mercosur.
Already some Ibis hotels in each city:
Curitiba has 4 (one close to the
airport); Porto Alegre has 2 (also with
one in the airport area) and
Florianopolis has 1;
The current Brazilian economic
slowdown might affect these cities
growth on the eyes of the investors,
even though that this impact can’t be
too strong;
The issues that already averse the
investors, such as the high corporate
taxes, corruption or the security, might
5 Curitiba and Porto Alegre will have each one a stadium for the FIFA World Cup, and are quite closer to Rio de Janeiro than the northern cities concerning the Olympics of 2016

INTERNATIONALIZATION FIELD LAB
12
get worse due to the recent economic
slowdown, diminishing investments in
the country.
TOWS
The TOWS analysis is a complementary analysis derived from the SWOT analysis. Once
knowing what do the company has in its favour and against, is important to realize what
is possible to do in order to take advantage of the firm’s strengths relatively to the
environment, while using these exterior pressures to diminish the weaknesses.
The strong brand in the country and the knowledge of the Brazilian market are capabilities
that should be used by VG both to rise entry barriers for future entrants (namely HIE) and
to decrease the opening time. Regarding the entry, the group should not be too strict in
what it considers an opportunity, since, due to the increasing development and good
prospects in the three cities, it will certainly appear several good real estate opportunities,
the cities will be thriving and VG should avoid to “regret” to open too late. Also, it is
important to take advantage of the current absence of HIE, which releases some pressure
of VG to be excellent right in the beginning and would allow the brand to benchmark
purely the HIE methods. Furthermore, it is important to expand fast and to take a position
before Ibis reinforces its strategies. Nevertheless, VG should remain especially careful in
the location of its hotel in order to be a serious competitor to Ibis.
The proximity of the other Mercosur countries gives the opportunity to study their
markets and their clients, which goes along with VG careful growth strategy since it
provides a chance of a deeper analysis of potential expansions to those territories. To open
a different type of hotels and being in the South, would allow VG to fight better an
eventual Brazilian economic downturn (and even the seasonality experienced by the

THE INTERNATIONALIZATION OF VILA GALÉ TO THE SOUTH OF BRAZIL
13
Resorts in the Northeast). Plus, with its well-known brand and knowledge of the market,
in the eventuality of a decrease in tourism numbers, VG would be able to relatively sustain
its numbers. (See Exhibit 11 for detailed and schematic TOWS analysis)
Hotel Concentration Analysis
For the Hotel Concentration Analysis of each city, it was used the website “hoteis.com”,
which is the most suitable hotel search engine for the purpose due to the available filters.
As so, it was possible to locate in the map most of the hotels existent in each city, for any
time (it is possible to eliminate the “date” factor from the search) and then filtering in
order to obtain only business hotels. This analysis is relevant in the way that shows how
other hotels are dispersed (and how they are focused in a particular area) and discloses
the amount of potential competitors active in the hub.
Curitiba
In the capital of Paraná were identified 16 business hotels out of the total universe of 60
pointed by the website. These 16 are dispersed in three areas: the city downtown, with
11; the Batel neighbourhood, with 4; and, finally, Champagnat with only one. Also,
looking in the Ibis and HI websites (these two brands are not included in the search
engine), it was possible to verify that the first one has 3 hotels in the city centre and 1
near the airport, while the second one has no hotels in the city. Therefore, 19 hotels can
be pointed as probable competitors of a VGE in Curitiba.
The best location for a business hotel should be near the business centres and is possible
to state through this analysis that Curitiba’s financial area is located in the downtown and
in the wealthy neighbourhood of Batel. In fact is not difficult to observe that the square
kilometre with more business hotels in Curitiba is located between the centres of the two
areas, comprising roughly 11 hotels. Batel is also known for being the zone where the

INTERNATIONALIZATION FIELD LAB
14
square meter price is higher, which probably justifies the lack of hotels in the area when
comparing with the downtown. (See Exhibit 12, Figure 1 for the city’s map.)
Porto Alegre
This Southern city has a relatively more dispersed disposition of business hotels than
Curitiba. The search engine was able to identify 12 hotels of this kind in the city, showing
two predominant areas: the city centre and Moinhos de Vento, comprising 7 hotels. Ibis
has also hotels in this city, presenting one in Moinhos de Vento and another near the
airport. There are two other hotels under the brand Ibis in the two satellite cities of Canoas
and Novo Hamburgo, but both are relatively distant from the city centre. On the other
hand, HI has no Express hotels in the city.
Through this analysis is possible to state that, even being some business hotels in what is
considered the city centre, they are all quite close of the Moinhos de Vento area, which is
where the biggest concentration of business hotels is. (See Exhibit 12, Figure 2 for the
city’s map)
Florianopolis
The capital of Santa Catarina has a quite large hotel industry. However, the number of
business hotels is not so promising. A total of 7 of this kind were pointed by the search
engine and Ibis has two hotels in the area, being one of them in the city centre and the
other one in the satellite city (but still relatively close from the centre of Florianopolis) of
São José. It is possible to state through this analysis that the biggest concentration of
business hotels, including one Ibis, is in Florianopolis’ downtown, having the total of 4
hotels considered business hotels. (See Exhibit 12, Figure 3 for the city’s map)
THE INTERNATIONALIZATION OF VILA GALÉ TO THE SOUTH OF BRAZIL
15
International Analysis Conclusion
Taking into account the information disposable on the section “City Selection”, it is
possible to conclude that there is a greater afflux of people to Curitiba and Porto Alegre
than to Florianopolis, even though this gap is decreasing. Nevertheless, regarding the
other source provided in that section, the EY report, there’s a clear preference and stronger
prospects from the investors on the capitals of Paraná and Rio Grande do Sul than on the
Santa Catarina’s. Additionally, is possible to conclude, also through the analysis of the
hotel concentration, that Curitiba and Porto Alegre are considerably more directed to
business tourism than Florianopolis, which provides so few business type hotels. This
location is far more directed to other type of tourism and so I believe an entrance in a
close future at this location could be considered using a City/Leisure Hotel or even a
Resort in the area, but not an Express.
Also, considering only Curitiba and Porto Alegre and running the same analytical process
as above, it is possible to observe a greater business development and prospects in the
first city. This is probably due to its proximity to São Paulo and Rio de Janeiro.
Nevertheless, Porto Alegre also shows reasonably good values on these analysed issues.
As so, I believe that, so far, the best International strategy for VG would be to focus
mostly on Curitiba and Porto Alegre, concerning Express hotels in the South of Brazil.
One might say that Curitiba has already a developed competition regarding this market
comparing to Porto Alegre, but facing the growth forecasts and the high investment
prospects for the Paraná capital, I believe that the current lodging available of this type
will not be enough in a near future. In the end, my opinion is that Florianopolis should
only be considered for this type of hotel in a more advanced stage, i.e. after a successful
expansion to the other two capitals and after a reassessment of this town at the time.

INTERNATIONALIZATION FIELD LAB
16
INTERNATIONALIZATION
Entry Mode
VG has a relatively strict way of expansion. The group prefers to rely on Greenfields
through the purchase of terrains and buildings or on Acquisitions of existent hotels. In the
end, the company likes to rule completely the propriety on its own. This should be
considered the most likely entry mode in the South – to find a land/building/hotel in the
predefined areas established before in this document and take over it alone. The
advantages of these two strategies are the full control over the hotel, the possibility to
decide what to do with the propriety at any time and the option to impose freely the culture
wanted. On the other hand, these are probably the international strategies which more
resources (namely capital) and time consumes, even though Greenfield weights more on
the time while the Acquisition process is more capital intensive. Also, for a non-
experienced company in the destiny market, to acknowledge all the laws and procedures
necessaries in the country might be another delay provoked by these strategies. However,
VG wouldn’t be so affected by this last condition, considering that it is already present in
Brazil and has experience dealing with this.
Another option would be an internationalization through Management Contracts. This
strategy is not so well perceived by the group and has risen some issues before. Even
though it would be cheaper, safer and faster, VG’s profits would probably be much lower,
the control over the propriety would be limited and the sub-brand could be questioned.
An even bigger issue would be to find a hotel in such a prosperous cities like Curitiba or
Porto Alegre willing to accept such contract right away. VG could acquire a
land/propriety, turn it into the desired hotel, sell it to an investor and then settle a MC, but

THE INTERNATIONALIZATION OF VILA GALÉ TO THE SOUTH OF BRAZIL
17
this way it would still be capital intensive in the short term and not faster than a Greenfield
or Acquisition. As so, I don’t believe this would be a good option for this expansion.
A third strategy would be a Joint Venture with a Brazilian hotel chain with a strong
connections in the South. This would reduce the capital required and could turn the
process faster. However, in the end, VG would only have a share of the brand control and
its management, which could lead to disagreements in the long run. Plus, the company,
through its history, has never shown interest into share the control over its hotels, even
though it has currently two proprieties of the portfolio under MC.
Other entry strategies aren’t any better: for Franchising and Licensing, VGE needed to
be an already well-known and successful brand, and Exporting doesn’t apply to this type
of market.
As so, I believe, considering all this, that VG should option then for its usual expansion
strategy, also where it has more experience, and acquire a land/building/hotel in the
desirable area.
Financial Analysis
In order to verify the project’s profitability, it is necessary to make some financial
analysis, discounting FCF based on some assumptions. This analysis tries to be as precise
as possible, although it may present, when implementing, some forecasting errors. To
minimize it, the assumptions used tried to be meaningful and a considerable amount of
scenarios with several variables were computed. The project was composed based on
variable sources, being the two major ones an interview with Gonçalo Rebelo de Almeida
and a spreadsheet model used by VG ceded by him. Also, the project was estimated for

INTERNATIONALIZATION FIELD LAB
18
30 years, instead of for infinite periods, since even in this horizon the forecasts are already
quite uncertain and more years could prejudice even more the analysis.
Even though the benchmark model created for the FCF calculation is the Appendices,
some points are necessary to clarify. Regarding employees, the average amount of
personnel working in a VG hotel with 200 bedrooms that is assumed is 69 people.6 Since
this number applies to larger and with more amenities hotels than the Express, it is not
reasonable to calculate the employees necessary for a VGE using a merely proportion. As
so, when considering the Lodging area (where in the model 32 out of the 69 employees
work) on a 120 bedrooms hotel (benchmark size of a VGE), it should rely proportionally
on 19 or 20 employees. However, due to the considerable less amenities, for this area it
was presumed 10 employees. The F&B area has in the model 30 employees working
(which indicates a proportional number of 18 for a 120 bedrooms’ hotel), but for an
Express hotel, where only Breakfasts and some snacks are served, only 8 employees were
considered for the purpose. Relatively to the Administration and Maintenance, where in
the initial model are 4 and 3 employees working, the numbers assumed for the VGE were
merely the proportional numbers for a 120 rooms’ hotel, which are 3 and 2. The salaries
are based on the disclosed information provided in the model spreadsheet ceded, except
the ones in F&B, where, since they don’t need to be so specialized, their cost should be
lower.7
The VGE’s revenues come from two activities: the first are the Lodging services, which
come from room price per night, and the second one come from F&B services, namely
the purchase of snacks (breakfasts are not considered since they are included in the room
6 Information on the Model Spreadsheet disclosed by Gonçalo Rebelo de Almeida 7 The number of employees weren’t altered any other time in any of the scenarios.

THE INTERNATIONALIZATION OF VILA GALÉ TO THE SOUTH OF BRAZIL
19
price). Regarding the costs, the percentages used for accounts like “Other Costs” or others
more specific (e.g. Energy) were provided by VG and not changed.
The investment was computed based on the average investment made by VG in its hotels.
Having the Total Investment per room, and separating the amount that is spent in rooms’
equipment and furniture, it was possible to calculate the Investment per square meter
without rooms’ equipment and furniture. Assuming a new reduced value for the rooms’
equipment (VG’s normal rooms have kitchenettes, furniture and decorations that
wouldn’t be necessary in an Express hotel) and adding it to the Investment per square
meter previously computed it was possible to assemble a Total Investment value per
square meter, and so the Investment value per room, and consequently the Total
Investment to be applied to the VGE. The percentages of the Total Investment applied to
separate the land, building and equipment costs, as also their expected lifetime (and
consequently their depreciation) were provided by VG. Also, the group is not “taking
out” the money generated currently in Brazil and so, to invest this money overflow could
be a good solution. In the end, a loan will not be considered since the group has enough
money relatively stopped in the country that could be used for the necessary investment.
For Curitiba, considering the expected OR for Economy Scale hotels of 72%x and
assuming a 30 years project, as well a cost of equity of 10%8, it is observed a negative
NPV with a Profitability Index of 0.83. These two factors give a red light to the investment
as it is in the Benchmark form, even though almost every year the hotel makes practically
€1M and, if the FCF are not actualized, the investment is recovered between the 10th and
the 11th year, respecting the company’s requirements9 for a project.
8 Value provided by VG 9 Expected investment recovery between 12 and 15 years

INTERNATIONALIZATION FIELD LAB
20
Some scenarios were developed in order to verify how a VGE in Curitiba could be
profitable. It was concluded that the NPV was positive if the Investment per square meter
without the rooms’ equipment and furniture decreased from the benchmarked value of
€3,200 to €2,300 or, more realistic, when this value per square meter decreased to €2,600
while the amount of rooms increased to 160 instead of 120, ceteris paribus. Also, when
solely increasing the price per room (tested until €70 per night) or increasing the OR
(tested until 80%) the NPV would still be negative. Even when considering both moving
at the same time with a negative correlation (the only one that makes economic sense), a
positive indicator wasn’t achieved. In opposition to this Curitiba’s scenarios, Porto Alegre
has higher OR prospects and the competitors (namely Ibis) practice higher prices, leading
to a benchmark with a positive NPV, even though with a low PI of 1.037. The best option
for this city is the same as in Curitiba, to decrease the investment without equipment and
furniture to €2,600 and increasing the room number to 160, ceteris paribus, returning this
way a PI of 1.28. (See Exhibit 13 for the OR prospects used for both cities and Exhibit
14 for more detailed financial information.)
Implementation
Marketing Mix
For the implementation process, it should be considered the 4P’s that compose the MM,
accordingly to McCarthy’s formulation: Product, Place, Promotion and Price. The first
two points were already pointed out before in this document, being the Product an
Express type hotel with the characteristics said previously10 and the Place in Curitiba
between the city’s downtown and the Batel neighbourhood11 and in Porto Alegre
10 See “Vila Galé Express” section 11 see Hotel Concentration Analysis and International Analysis Conclusion sections

THE INTERNATIONALIZATION OF VILA GALÉ TO THE SOUTH OF BRAZIL
21
somewhere relatively close to Moinhos de Vento. However, the other two points of the
MM are not yet quite defined.
Regarding Promotion, VGE advertising strategy can be based only on three marketing
campaigns. The first one, quite simple and low cost, is to advertise the new hotels on the
group website, as well as in the social networks which VG is in. Three months before the
opening should be enough to create some awareness and come up with some reservations.
Equally important is to certify that the new hotel is added to hotels’ search engine, like
booking.com. Most people rely on these kind of websites not only to make a reservation
but to read other people’s comments about the hotel. VG says that reservations on its
portfolio are usually made through three channels12: directly (telephone or email), online
(including company website) or through touristic agencies/operators. Concerning VGE,
the firm shouldn’t expect reservations using the last channel, and can expect a quite larger
weight on online reservations. As so, the VGE has to be present in these type of sites also
at least three months before the opening. These two strategies should be kept, of course,
even after the opening to continue to create brand awareness.
A last advertising strategy that VG should rely on is publicity in crowded arrival places,
namely the city airport, train stations and on highways. This aims business people
entering in the city without a defined place to stay. Also, the first two places pointed have
normally internet access, which would able potential customers to make a quick
reservation as soon as they arrive in town. Since these billboards aim people arriving, it
doesn’t make sense to advertise this way much sooner than the opening date. As so, I
believe the best strategy is to start this publicity around one month before to target people
12 Information given in an interview with VG’s administrator Gonçalo Rebelo de Almeida

INTERNATIONALIZATION FIELD LAB
22
that go often to the city and keep it strongly in the first operating months. After that, this
type of publicity should be maintained but in less intensity. In other words, in the most
successfully strategic places, increasing the advertising efficiency. These promotions are
applicable, of course, to both cities.
The Price strategy for this hotel is relatively complicated to define. First of all, it should
be considered the direct competitor prices, Ibis, in the places where VGE should be.
Considering prices of the two Ibis hotels in the centre of Curitiba, Ibis Curitiba Shopping
and Ibis Curitiba Batel, is possible to verify an Average Daily Price for 2014 of €53.62
and €58.73 respectively (see Exhibit 15 for Ibis’ prices). This represents an average of
€56.17 of daily price during 2014 for both hotels in the area. I believe that, since VG
doesn’t know perfectly the Express market yet and has only one direct competitor in the
city (even though are two hotels), it shouldn’t threat Ibis with a price war. On the other
hand, to practice considerably higher prices than Ibis can perpetuate the most criticized
characteristic of the group’s hotels, the Value-for-Money. In the end an Average Daily
Price should fluctuate more or less between €50 and €60, taking advantage of the high
and low seasons. Another aspect that VGE could take advantage of is from the demand
fluctuations within the week period: there’s a higher demand for this type of hotel from
Monday to Friday (working days) than on weekends, derived from the fact that businesses
are mostly made on week days and so slightly higher prices could be presented at these
days other than on Saturdays and Sundays.
In Porto Alegre, for the Price strategy should also be considered the Ibis’ prices as a
reference. The Ibis Porto Alegre Moinhos do Vento will practice an Average Daily Price
of €66.8 in 2014 (see Exhibit 15, for Ibis’ prices) and so a VGE in this city should have
a price fluctuating around this value for the same reasons pointed for Curitiba.

THE INTERNATIONALIZATION OF VILA GALÉ TO THE SOUTH OF BRAZIL
23
Implementation Phases
Figure 1 – Implementation Chart (simplified)
As a first phase of implementation is necessary to complete the most important research
for VG: to find a good land/building/hotel that would fit in the profile of a good
opportunity. To find a proper propriety that would suit all the requirements is the number
one task that will define the whole implementation process. Only after this is possible to
set all the rest. This process can take an undefined amount of time, since VG will only
move in the presence of a good investment and that might take a while to appear (e.g. in
Rio de Janeiro this opportunity appeared only 10 years after VG had shown interest in the
area).
Once the ideal building/land is found, the whole process is triggered. First of all, it is
important to close the deal with the owner which might be relatively difficult, since the
seller will probably have the upper hand regarding this business due to the fact that is
should be quite complicated to find another real estate opportunity in the area. As so, it is
expected something around three months of negotiations. Further on, VG must proceed
to the hotel registration13. Though, to obtain this registration is necessary a construction
licence and a construction conclusion certificate. Hence, is necessary a construction
13 See Legal section at PESTEL Analysis and Exhibit 8 (Applicable Laws).

INTERNATIONALIZATION FIELD LAB
24
project (which wouldn’t be too extensive if a proper building is bought) in order to obtain
a construction permit. This would subsequently lead to the construction works, and only
after it, VG would be able to register its hotel. All this process would take probably around
one year and a half.
The human resources also work in this pre-opening phase, first assessing job
requirements, which should not be too time consuming and can be done immediately after
the construction project is settled, and then recruiting and training mostly Brazilian
workers for the defined positions14 that should take slightly more than half year. This last
task from the HR should be performed taking into account the forecasted opening day in
order to complete the trainees close to this date. Plus, after the opening, regular trainee
should take place in the way to keep always improving, as VG usually does.
For the opening time is necessary to consider the marketing campaigns (already expressed
above at the MM section). This would start 3 months before the opening in order to tease
and create some reservations for the first days. Of course these advertising measures
should continue even after the opening day, with a special focus on the first months. After
those, and in order to decrease marketing expenditures, the advertisements should reduce
their presence, keeping only some crucial locations.
Besides the continuous training and advertisement, after the opening day the control
processes would take place almost constantly, checking regularly the key indicators, such
as RevPAR, ADR and OR. Plus, to spot trainee needs, fill gaps in the personnel and
benchmark Ibis should be ongoing processes in order to be always up-to-date for quick
responses or strategy changes. (See Exhibit 16 for detailed Implementation Chart.)
14 VG contracts mostly Brazilian workers in Brazil in order to better adjust the culture to the clients.

THE INTERNATIONALIZATION OF VILA GALÉ TO THE SOUTH OF BRAZIL
25
FINAL CONCLUSION AND RECOMMENDATIONS
Based on all the analysis elaborated above it was possible to conclude, at a certain point,
that VG should only focus on two cities of the Southern states: Curitiba and Porto Alegre,
presenting the first city better prospects concerning economic and financial development,
while the second one presents a superior position today, with more touristic traffic and
less competition in the business hotels submarket. However, when elaborating an
internationalization process, it was possible to verify through a financial analysis that the
position of Curitiba was considerably worse than Porto Alegre’s, mostly due to the fact
that an Express hotel in this Paraná city would have to practice lower prices (consequence
of a tight pressure of Ibis) and the OR prospects (even being quite high) are not as positive
as the ones for Porto Alegre. The analysis has also shown a possibility of a good
investment in Curitiba depending on the Investment cost: if the Investment is
considerably lower than the one benchmarked in this document, then a VGE in Paraná
could be a reality. Since the initial investment value was computed using data provided
by VG referring to hotels with a considerable amount of common amenities (e.g. pools,
spas), the “investment cost per room without equipment” is probably overvalued. As so,
to be able to succeed in both cities, VG has to decrease the Investment cost considerably
from the benchmarked here, not only in Curitiba, but also in Porto Alegre, where the
initial position provides a, even though positive, quite low NPV. Yet, if VG takes too long
to enter (too cautious), others might reinforce their position or even enter in the city (HIE),
while entering in the wrong “street” might condemn a VGE right from the start.
In the end, I believe that or the opportunity is spotted in the right place in the short term,
with a cost considerably lower than the one benchmarked, or VG shouldn’t move to these
places using VGE. All relies on the ability (and luck) of VG to find that good opportunity.

INTERNATIONALIZATION FIELD LAB
26
REFERENCES
Airports. Infraero. [Online] http://www.infraero.gov.br/index.php/br/aeroportos.html.
Bezerra, D. M. F. and Albanez, P. 2008. Plano de Desenvolvimento do Turismo do Paraná 2008-
2011. Curitiba : s.n., 2008.
Booking. [Online] http://www.booking.com/.
Brazil - Overview. US Energy Information Administration. [Online]
http://www.eia.gov/countries/cab.cfm?fips=BR.
Campbell, D. and Kazan, B. 2008. Shangri-La Hotels. s.l. : Harvard Business School, 2008.
Chediek, J. and Neri, M. C. 2013. O Índice de Desenvolvimento Humano Municipal Brasileiro -
Atlas do Desenvolvimento Humano do Brasil 2013. s.l. : PNUD Brasil, 2013.
Climates that Occur in Brazil. Projeto Cactáceas Brasileiras. [Online]
http://www.brcactaceae.org/climate.html.
Deloitte. 2012. Atlas da Hotelaria 2012 - Uma Fusão de Perspectivas. 2012.
Directoria de Planejamento, Infraero. 2013. Anuário Estatístico Operacional 2012. Brasilia :
s.n., 2013.
EY. 2010. A World of Possibility: Brazil Hotel Investment Opportunities. 2010.
—. 2012. Capturing the Momentum - Brazil. 2012.
Feldmann, H. H. 2013. SME Competitiveness: an Internationalization Strategy for D. Pedro
Hotel. Lisbon : s.n., 2013.
Foster, S. T. 2012. Managing Quality - Integrating the Supply Chain. s.l. : Prentice Hall, 2012.

THE INTERNATIONALIZATION OF VILA GALÉ TO THE SOUTH OF BRAZIL
27
Goeldner, C. R. and Ritchie, J. R. B. 2011. Tourism - Principles, Practices, Philosophies. s.l. :
Wiley, 2011.
Hallowell, R. 2000. Four Seasons Hotel and Resorts. s.l. : Harvard Business School, 2000.
Hoteis.com. [Online] http://www.hoteis.com/.
Hotel Invest. 2012. Brazilian Hotel Market Overview. São Paulo : s.n., 2012.
Ibis. [Online] http://ibishotel.ibis.com/pt/portugal/index.shtml.
IHG. 2012. IHG Annual Report and Financial Statements 2012. 2012.
IPEA. 2010. Migração Interna no Brasil. 2010.
Jones Lang LaSalle. 2013. Hotel Investment Outlook. 2013.
Koch, J. and Johnson, L. K. 2005. Hilton Hotels Corporation: A Balanced Scorecard Hall of Fame
Profile. s.l. : Harvard Business School, 2005.
McKinsey&Company. 2010. Estudo do Sector de Transporte Aéreo do Brasil - Relatório
Consolidado. Rio de Janeiro : s.n., 2010.
Page, S. 2009. Tourism Management - An Introduction. s.l. : Butterworth-Heinemann, 2009.
Papiryan, G. 2008. Note on the Global Hotel Industry. s.l. : Ivey Publishing, 2008.
Presidência da Repulica Casa Cívil Subchefia para Assuntos Jurídicos. 2008. LEI Nº 11.771, DE
17 DE SETEMBRO DE 2008 - Lei Geral do Turismo. 2008.
Rebelo de Almeida, G. 2013. 1st Interview (Company Overview). [interv.] G. Gusmão and R.
Pereira. 2013.
—. 2013. 2nd Interview (Financials). [interv.] G. Gusmão. 2013.

INTERNATIONALIZATION FIELD LAB
28
Regions at a Galnce 2011. OECD. [Online] http://www.oecd-ilibrary.org/sites/reg_glance-2011-
en/index.html?contentType=/ns/StatisticalPublication,/ns/Book&itemId=/content/book/reg_g
lance-2011-
en&containerItemId=/content/serial/19990057&accessItemIds=&mimeType=text/html.
Secretaria de Estado do Turismo de Curitiba. Plano de Desenvolvimento do Turismo do Paraná
2008-2011. Curitiba : s.n.
—. Plano de Desenvolvimento Integrado do Turismo Sustentável. Curitiba : s.n.
Secretaria do Turismo do Estado do Rio Grande do Sul, Fundação Getulio Vargas. 2012. Plano
de Desenvolvimento do Turismo do Rio Grande do Sul. 2012.
The Industry. Professional Association of Innkeepers International. [Online]
http://www.innkeeping.org/?The_Industry.
The International Bank for Reconstruction and Development/The World Bank. 2006. Doing
Business in Brazil. Washington D.C. : International Finance Corporation, 2006.
Top 20 Internet Countries by Users. Internet World Stats. [Online]
http://www.internetworldstats.com/top20.htm.
Vila Galé. 2013. Relatório e Contas Consolidado 2012. 2013.
World Data Bank - World Development Indicators. The World Bank. [Online]
http://databank.worldbank.org/data/home.aspx.

THE INTERNATIONALIZATION OF VILA GALÉ TO THE SOUTH OF BRAZIL
29
EXHIBIT 1 Company Portfolio
Hotel Area/State Rooms
Portugal
Albacora Alentejo and Algarve 162
Ampalius Alentejo and Algarve 357
Atlântico Alentejo and Algarve 220
Cascais Lisbon Coast 233
Cerro Alagoa Alentejo and Algarve 310
Clube de Campo Alentejo and Algarve 81
Coimbra Centre 229
Collection Palácio dos Arcos Lisbon Coast 76
Ericeira Lisbon Coast 202
Estoril Lisbon Coast 126
Lagos Alentejo and Algarve
Marina Alentejo and Algarve 243
Náutico – All Inclusive Alentejo and Algarve 225
Ópera Lisbon Coast 259
Porto Porto 292
Praia Alentejo and Algarve 40
Santa Cruz Alentejo and Algarve 262
Tavira Alentejo and Algarve 268
Brasil
Cumbuco Ceará 465
Eco Resort de Angra – All Inclusive Rio de Janeiro 307
Eco Resort do Cabo Pernambuco 300
Fortaleza Ceará 300
Marés Bahia 447
Salvador Bahia 224
Source: Vila Galé

INTERNATIONALIZATION FIELD LAB
30
EXHIBIT 2 Organizational Chart
Administration
Marketing & Sales
Human Resources
Administrative & Financial
Legal Technical IT
Operations
Company Portfolio

THE INTERNATIONALIZATION OF VILA GALÉ TO THE SOUTH OF BRAZIL
31
EXHIBIT 3 booking.com Scorecard
CLEAN COMFORT LOCATION FACILITIES STAFF VALUE FOR
MONEY TOTAL
PORTUGAL
Porto 8.3 8 7.3 8 8 7.8 7.9
Santa Cruz 8.7 8.1 8 8.4 8.6 7.6 8.2
Ericeira 8.4 8.2 9.6 8.1 8.5 7.6 8.4
Nautico All Inclusive 6.7 7.1 7.6 7.1 8.8 6.8 7.4
Praia 9.1 9 9.1 8.9 9.6 8.5 9.0
Atlantico 6.9 6.9 8.2 7 7.5 6.7 7.2
Cerro Alagoa 8.4 7.9 8.4 7.9 8.2 7.4 8.0
Coimbra 8.9 8.7 7.8 8.5 8.6 8.2 8.5
Marina 7.9 7.4 9.2 7.2 7.8 7.1 7.8
Tavira 8.3 7.9 8.7 8 8.3 7.7 8.2
Lagos 8.6 8.6 8.4 8.6 8.6 8 8.5
Albacora 8 7.4 8.5 7.7 8 7.3 7.8
Amapalius 8 7.6 9.5 7.6 7.9 7.4 8.0
Opera 8.1 7.5 7.3 7.4 7.7 7.1 7.5
Cascais 8.1 8.2 8.6 7.7 8.1 7.5 8.0
Clube de Campo 7.2 6.7 8.2 7.1 8 6.8 7.3
Estoril 8.3 7.5 9 7.3 8.4 7.3 8.0
Collection Palácio dos Arcos 9.5 9.6 8.1 9.5 9.4 9 9.2
PORTUGUESE AVERAGE 8.2 7.9 8.4 7.9 8.3 7.5 8.0
BRAZIL
Marés All Inclusive 7.3 8.3 8.9 7.8 7.1 6.8 7.7
Eco Resort Angra All
Inclusive 6.7 7.9 8.4 7.4 7.1 6.9 7.4
Fortaleza 6.4 6.8 6.7 6.1 6.3 5.9 6.4
Cumbuco All Inclusive 7.7 8.6 7.9 8.3 7.9 7.6 8.0
Salvador 8 8.2 8.2 7.3 7.4 7.3 7.7
Eco Resort do Cabo All
Inclusive 7.5 7.9 7.3 7.6 7.7 6.9 7.5
BRAZILIAN AVERAGE 7.3 8.0 7.9 7.4 7.3 6.9 7.4
Source: www.booking.com

INTERNATIONALIZATION FIELD LAB
32
EXHIBIT 4 VG Internal Survey
HOTEIS SIMPATIA SERVIÇO
LIMPEZA recep andar resta bares manut Sub-Total recep andar resta bares manut Sub-Total
ALBACORA 88.35% 82.27% 82.95% 81.79% 82% 86.6% 78.64% 79.58% 78.83% 79.57% 80.75% 75.28% 75%
AMPALIUS 84.9% 83.76% 83.33% 81.65% 81.97% 83.86% 79.79% 81.35% 80.66% 79.72% 81.37% 79.81% 78.42%
ATLANTICO 85.4% 82.65% 82.59% 81.43% 79.48% 84.49% 77.23% 81.8% 80.1% 75.69% 78.65% 77.16% 78.3%
CASCAIS 87.19% 85.83% 82.55% 86.45% 83.6% 87.44% 84.06% 81.02% 84.68% 83.09% 85.26% 85.04% 74.64%
CERRO ALAGOA 87.53% 88.48% 85.1% 81.68% 82.94% 87.65% 87.38% 84.39% 79.54% 82.17% 87.22% 83.84% 78.48%
CLUBE DE CAMPO 88.48% 85.94% 88.29% 87.17% 84.11% 87.3% 81.88% 83.93% 83.8% 79.77% 82.66% 79.74% 80.2%
COIMBRA 90.65% 89.61% 88.09% 87.97% 87.75% 89.59% 88.16% 87.25% 86.71% 86.87% 89.42% 88.12% 83.02%
COLLECTION PALACIO DOS ARCOS 98.25% 96.59% 94.43% 94.34% 96.7% 97.95% 96.53% 93.7% 93.15% 96.21% 96.95% 96.86% 89.38%
CUMBUCO 83.12% 87.59% 86.77% 84.91% 86.79% 81.35% 82.03% 83.71% 83.55% 84.31% 83.29% 88.85% 83.66%
ECO RESORT DE ANGRA 85.16% 79.33% 79.22% 77.42% 73.21% 83.08% 72.59% 78.63% 77.11% 66.54% 70.97% 82.48% 79.85%
ECO RESORT DO CABO 81.81% 83.67% 80.52% 79.84% 79.93% 81.04% 76.91% 77.68% 75.87% 74.39% 74.88% 82.02% 79.48%
ERICEIRA 89.5% 89.76% 88.25% 84.53% 83.36% 87.82% 88.27% 86.13% 83.12% 81.34% 88.62% 81.97% 83.65%
ESTORIL 88.4% 86.9% 87.19% 85.46% 83.17% 88.22% 85.48% 85.96% 85.04% 81.89% 85.87% 81.27% 81.81%
FORTALEZA 81.65% 81.15% 78.06% 76.84% 73.17% 79.49% 77.01% 75.53% 73.81% 68.91% 76.5% 78.46% 76.68%
LAGOS 89.66% 88.89% 89.15% 85.62% 86.82% 88.77% 86.74% 87.31% 85.06% 86.14% 87.77% 87.72% 82.28%
MARES 84.86% 86.63% 83.7% 84.81% 82.93% 83.11% 83.15% 81.51% 82.85% 79.56% 83.08% 85.45% 82.09%
MARINA 85.6% 85.44% 81.55% 81.8% 82.72% 84.76% 83.09% 81.12% 80.85% 79.87% 83.61% 80.69% 76.52%
NAUTICO 94.22% 88.22% 90.21% 89.81% 88.17% 92.83% 85.65% 88% 88.48% 86.46% 85.13% 85.42% 86.49%
OPERA 85.05% 85.86% 82.02% 82.25% 81.48% 84.69% 84.06% 81.11% 81.52% 79.59% 84.45% 78.82% 79.22%
PORTO 88.33% 88.22% 88.72% 85.54% 86.5% 88.18% 87.44% 87.74% 84.69% 84.39% 87.83% 83.23% 85.37%
PRAIA 96.86% 92.97% 92.98% 91.96% 90.92% 96.03% 92.27% 91.11% 90.05% 89.62% 92.95% 92.32% 86.46%
SALVADOR 80.71% 87.21% 80.34% 82.77% 78.8% 82.14% 85.52% 78.45% 79.5% 76.3% 85.95% 86.81% 80.81%
SANTA CRUZ 90.35% 90.32% 90.04% 87.4% 88.36% 90.13% 89.88% 87.89% 85.66% 87.79% 90.81% 87.29% 81.88%
TAVIRA 86.38% 85.5% 81.69% 80.1% 80.33% 85.77% 83.32% 79.91% 78.23% 77.04% 83.05% 78.39% 73.97%
Media 87,19% 86.69% 85.3% 83.85% 83.28% 85.66% 86.15% 83.82% 83.35% 82.08% 80.65% 83.36% 84.23%

THE INTERNATIONALIZATION OF VILA GALÉ TO THE SOUTH OF BRAZIL
33
HOTEIS CONFO
RTO
COMIDA PRÁTICAS
AMBIENT
AIS
VOLTAR
IA
RECOM
ENDARI
A
Como chegou ao hotel
TOTAL q.
alm/jant
v.
alm/jant
q. peq
alm
v. peq
alm
agência interne
t
publicida
de
recomend
ação
ALBACORA 72.46% 83.35% 81.25% 84.45% 93.65% 93.79% 12.01% 46.79% 11.03% 30.18% 170 465 82.6
AMPALIUS 75.78% 82.25% 81.22% 78.36% 92.94% 92.82% 20.95% 41.55% 9.8% 27.7% 138 390 82.75
ATLANTICO 75.83% 84.07% 81.37% 74.05% 92.59% 92.26% 18.42% 38.6% 12.78% 30.2% 102 241 81.72
CASCAIS 73.5% 81.71% 80.56% 80.47% 93.03% 93.94% 31.36% 41.78% 8.92% 17.93% 107 215 84.52
CERRO ALAGOA 76.03% 85.22% 83.15% 82.07% 92.75% 94.44% 39.93% 38.1% 6.8% 15.18% 130 290 85.28
CLUBE DE CAMPO 76.14% 86.51% 83.53% 84.67% 96.76% 96.88% 8.82% 35.01% 14.48% 41.69% 115 331 85.36
COIMBRA 81.04% 87.51% 86.64% 83.39% 97.03% 97.01% 14.68% 38.94% 16.52% 29.86% 333 602 88.79
COLLECTION PALACIO DOS ARCOS 87.14% 90.24% 85.85% 92.74% 99.56% 99.67% 9.33% 48.41% 10.86% 31.4% 92 266 94.98
CUMBUCO 82.77% 87.19% 85.48% 82.76% 90.81% 91.78% 39% 30.29% 4.56% 26.15% 155 889 85.33
ECO RESORT DE ANGRA 79.31% 80.7% 79.47% 68.03% 84.46% 84.04% 29.17% 29.1% 4.98% 36.74% 75 553 78.02
ECO RESORT DO CABO 76.96% 83.47% 80.51% 94.64% 82.52% 82.65% 42.57% 28.29% 2.48% 26.66% 35 377 79.67
ERICEIRA 82.82% 86.15% 83.91% 81.27% 97.5% 97.62% 37.67% 25.24% 13.32% 23.77% 209 373 87.15
ESTORIL 79.41% 85.32% 82.91% 79.58% 93.98% 94.56% 30.86% 34.89% 12.95% 21.3% 183 301 85.89
FORTALEZA 74.54% 81.64% 80.11% 71.05% 80.43% 79.63% 53.96% 26.11% 4.07% 15.87% 105 409 77.48
LAGOS 80.51% 86.15% 83.28% 83.43% 96.07% 97.32% 34.72% 33.19% 13.23% 18.86% 336 479 87.51
MARES 82.91% 82.49% 81.49% 85.9% 92.49% 92.53% 44.88% 19.94% 4.32% 30.86% 172 1229 84.3
MARINA 74.69% 80.17% 80.78% 79.88% 90.59% 90.33% 25.21% 42.38% 9.84% 22.57% 82 188 82.69
NAUTICO 84.64% 87.36% 85.31% 82.54% 92.5% 94.99% 51.16% 31.92% 3.96% 12.96% 58 190 88.26
OPERA 77.09% 81.73% 80.63% 77.94% 90.43% 90.31% 22.61% 35.89% 12.29% 29.21% 149 354 83.07
PORTO 84.46% 86.83% 85.51% 80.58% 95.44% 96.35% 50.58% 21.35% 9.79% 18.28% 271 506 87.5
PRAIA 80.4% 89.65% 87.17% 89.16% 98.72% 99.4% 11.88% 62.28% 7.98% 17.86% 80 179 92
SALVADOR 77.62% 83.64% 80.68% 74.64% 92.05% 89.38% 52.82% 28.39% 3.13% 15.66% 15 75 82.83
SANTA CRUZ 78.45% 84.18% 81.15% 83.45% 93.2% 95.58% 40.91% 30.73% 9.88% 18.48% 295 552 87.85
TAVIRA 72.41% 82.89% 81.9% 78.59% 93.38% 94% 18.35% 46.83% 10.98% 23.84% 296 643 82.71
Media 83.79% 81.08% 79.45% 84.53% 82.68% 81.65% 92.3% 92.85% 39.29% 36.04% 10.49% 25.66% 84.74%
Source: Vila Galé (from January to October 2013; Total surveys made: 43,020; Sample’s Percentage: 14.20%

INTERNATIONALIZATION FIELD LAB
34
EXHIBIT 5 Regional Maps
Source: OECD iLibrary – OECD Regions at a Glance
Figure 1 Distribution of Population (inhabitants per Square Kilometer)
Figure 2 Regional contribution to GDP growth from ’95 to ’07 (average annual rate at constant 2000 USD)
Figure 3 Regional Economic Disparities (GDP per capita, constant 2000 USD in thousands)
Figure 4 Carbon Emissions and Air Quality (population exposures to air pollution, by WHOPM2.5 thresholds)
Figure 5 Forest and Carbon Footprints (carbon absorption through biomass production)

THE INTERNATIONALIZATION OF VILA GALÉ TO THE SOUTH OF BRAZIL
35
EXHIBIT 6 Brazilian and Regional’s growth
Brazil’s growth from 95’ to 07’ (in percentage). Average Annual Growth: 2.97%
95' 96' 97' 98' 99' 00' 01' 02' 03' 04' 05' 06' 07'
Annual Growth 4.42 2.15 3.37 0.04 0.26 4.31 1.31 2.66 1.15 5.71 3.16 3.96 6.10
Source: World Bank
Region State Average Annual GDP Growth Rate from 95’ to 07’ (%)
North
Acre 4.80
Amapá 3.48
Amazonas 3.85
Pará 4.51
Rondônia 5.04
Roraima 3.81
Tocantins 7.08
Northern Region Average 4.65
Northeast
Alagoas 3.09
Bahia 3.80
Ceará 2.73
Maranhão 5.33
Paraíba 4.08
Pernambuco 3.13
Piauí 3.36
Rio Grande Do Norte 4.77
Sergipe 4.33
North-Eastern Region Average 3.85
Southeast
Espírito Santo 4.09
Minas Gerais 3.40
Rio De Janeiro 2.95
São Paulo 2.16
South-Eastern Region Average 3.15
South
Paraná 3.53
Rio Grande Do Sul 2.44
Santa Catarina 4.15
Southern Region Average 3.37
Central West
Distrito Federal 1.61
Goiás 4.52
Mato Grosso 6.79
Mato Grosso Do Sul 4.26
Central-Western Region Average 4.29
Source: OECD

INTERNATIONALIZATION FIELD LAB
36
EXHIBIT 7 HDI
Source: “O Índice do Desenvolvimento Humano Municipal Brasileiro
EXHIBIT 8 Laws Applicable to the Hotel Business in Brazil
Transcript from Lei Geral do Turismo
Art. 22. Os prestadores de serviços turísticos estão obrigados ao cadastro no
Ministério do Turismo, na forma e nas condições fixadas nesta Lei e na sua
regulamentação.
Art. 23. Consideram-se meios de hospedagem os empreendimentos ou
estabelecimentos, independentemente de sua forma de constituição, destinados a
prestar serviços de alojamento temporário, ofertados em unidades de freqüência
individual e de uso exclusivo do hóspede, bem como outros serviços necessários
aos usuários, denominados de serviços de hospedagem, mediante adoção de
instrumento contratual, tácito ou expresso, e cobrança de diária.
§ 1 Os empreendimentos ou estabelecimentos de hospedagem que explorem ou
administrem, em condomínios residenciais, a prestação de serviços de hospedagem

THE INTERNATIONALIZATION OF VILA GALÉ TO THE SOUTH OF BRAZIL
37
em unidades mobiliadas e equipadas, bem como outros serviços oferecidos a
hóspedes, estão sujeitos ao cadastro de que trata esta Lei e ao seu regulamento.
Art. 24. Os meios de hospedagem, para obter o cadastramento, devem preencher
pelo menos um dos seguintes requisitos:
I - possuir licença de funcionamento, expedida pela autoridade competente, para
prestar serviços de hospedagem, podendo tal licença objetivar somente partes da
edificação; e
II - no caso dos empreendimentos ou estabelecimentos conhecidos como
condomínio hoteleiro, flat, flat-hotel, hotel-residence, loft, apart-hotel, apart-
service condominial, condohotel e similares, possuir licença edilícia de construção
ou certificado de conclusão de construção, expedidos pela autoridade competente,
acompanhados dos seguintes documentos:
a) convenção de condomínio ou memorial de incorporação ou, ainda, instrumento
de instituição condominial, com previsão de prestação de serviços hoteleiros aos
seus usuários, condôminos ou não, com oferta de alojamento temporário para
hóspedes mediante contrato de hospedagem no sistema associativo, também
conhecido como pool de locação;
b) documento ou contrato de formalização de constituição do pool de locação, como
sociedade em conta de participação, ou outra forma legal de constituição, com a
adesão dos proprietários de pelo menos 60% (sessenta por cento) das unidades
habitacionais à exploração hoteleira do empreendimento;
c) contrato em que esteja formalizada a administração ou exploração, em regime
solidário, do empreendimento imobiliário como meio de hospedagem de

INTERNATIONALIZATION FIELD LAB
38
responsabilidade de prestador de serviço hoteleiro cadastrado no Ministério do
Turismo;
d) certidão de cumprimento às regras de segurança contra riscos aplicáveis aos
estabelecimentos comerciais; e
e) documento comprobatório de enquadramento sindical da categoria na atividade
de hotéis, exigível a contar da data de eficácia do segundo dissídio coletivo
celebrado na vigência desta Lei.
Art. 26. Os meios de hospedagem deverão fornecer ao Ministério do Turismo, em
periodicidade por ele determinada, as seguintes informações:
I - perfil dos hóspedes recebidos, distinguindo-os por nacionalidade; e
II - registro quantitativo de hóspedes, taxas de ocupação, permanência média e
número de hóspedes por unidade habitacional.
EXHIBIT 9 Airport Information
Table 1 – Passengers passing through the Airports
City Position Passengers in 2012
Total in 2012 Relative Weight
Domestic International Domestic International
SBGR São Paulo 1 21,234,352 11,542,978 32,777,330 64.78% 35.22%
SBGL Rio de Janeiro 2 13,201,049 4,294,688 17,495,737 75.45% 24.55%
SBSP São Paulo 3 16,775,770 - 16,775,770 100.00% 0.00%
SBBR Brasilia 4 15,480,033 411,497 15,891,530 97.41% 2.59%
SBCF Belo Horizonte 5 9,952,684 445,612 10,398,296 95.71% 4.29%
SBRJ Rio de Janeiro 6 9,002,863 - 9,002,863 100.00% 0.00%
SBKP Campinas 7 8,780,290 78,090 8,858,380 99.12% 0.88%
SBSV Salvador 8 8,502,605 308,935 8,811,540 96.49% 3.51%
SBPA Porto Alegre 9 7,606,507 654,848 8,261,355 92.07% 7.93%
SBCT Curitiba 10 6,738,071 90,263 6,828,334 98.68% 1.32%
SBRF Recife 11 6,221,013 212,397 6,433,410 96.70% 3.30%
SBFZ Fortaleza 12 5,764,339 199,969 5,964,308 96.65% 3.35%
SBVT Vitoria 13 3,642,842 - 3,642,842 100.00% 0.00%
SBFL Florianopolis 14 3,178,877 216,379 3,395,256 93.63% 6.37%
Source: Infraero in “Anuário Estatístico Operacional”

THE INTERNATIONALIZATION OF VILA GALÉ TO THE SOUTH OF BRAZIL
39
Chart 1 – Evolution of Passenger Traffic in the three major Southern Airports in 2012.
Source: Infraero
EXHIBIT 10 EY Report
Brazilian cities ranked based on FDI.
4,931,464
5,607,703
6,676,216
7,834,312 8,261,355
4,281,354
4,853,733
5,774,615
6,969,484 6,828,334
2,080,342 2,108,383
2,672,250 3,122,035
3,395,256
2008 2009 2010 2011 2012
Porto Alegre Curitiba Florianopolis

INTERNATIONALIZATION FIELD LAB
40
Ranking of the Most Promising Cities in Brazil
Source: EY in Capturing the Momentum – Brazil

THE INTERNATIONALIZATION OF VILA GALÉ TO THE SOUTH OF BRAZIL
41
EXHIBIT 11 TOWS Analysis
OPPORTUNITIES THREATS
ST
RE
NG
TH
S
Take advantage of the strong brand
and knowledge of the Brazilian
Market to create stronger entry
barriers to HIE in these cities;
The knowledge of the Brazilian
market will decrease the opening
time of the hotel, maybe at time of
the international events;
Use the proximity of Argentina,
Paraguay and Uruguay to study
deeper potential entrances in these
markets.
In the eventuality of the amount
of tourists in these cities decrease
due to a worse economic
slowdown, knowing the market
and having a strong brand would
help VGE to sustain its numbers;
Being careful and having a strong
brand are qualities that will allow
VG to locate the best location to
compete directly with Ibis and
eliminate other small/not
specialized hotels
WE
AK
NE
SS
ES
The strong development and
prospects will most likely create
what VG considers good
opportunities (properties for the
right price), so don’t need to be so
patient and risk to open too late;
The lack of HIE lowers the pressure
over VG to create excellent express
hotels right at the beginning. Lack
Being extremely careful will give
time to Ibis to reinforce its
presence in each town;
Using HIE as a benchmark would
be good to start since it would
“steal” from Ibis the clients that
looked for this hotels of IHG,
creating the competition that
these cities need;

INTERNATIONALIZATION FIELD LAB
42
EXHIBIT 12 Hotel Concentration Analysis Maps
Figure 1 – Business Hotels and Ibis Hotels in Curitiba
of competition gives time to
improve and find the right model;
If VG realizes it will need partners
in the South due to the strong
development and upcoming events,
partnerships will not be difficult to
obtain, since there will be a large
offer.
A Brazilian slowdown would
affect more VG if its portfolio
was concentrated in only one
region (as it is currently).

THE INTERNATIONALIZATION OF VILA GALÉ TO THE SOUTH OF BRAZIL
43
Figure 2 – Business Hotels and Ibis Hotels in Porto Alegre
Figure 3 – Business Hotels and Ibis Hotels in Florianopolis

INTERNATIONALIZATION FIELD LAB
44
EXHIBIT 13 Occupancy Rate Prospects
Curitiba Porto Alegre
Source: Hotel Invest
EXHIBIT 14 Financial Information and Scenarios
Salaries
# Employees Emp. Av. Cost/Month Total Annual Cost
Initial Model Proportional1 Assumed Initial Model Assumed Initial Model Assumed
Lodging 32 20 10 1,200 1,200 460,800 144,000
F&B 30 18 8 1,400 1,000 504,000 96,000
Administration 4 3 3 3,000 3,000 144,000 108,000
Maintenance 3 2 2 1,500 1,500 54,000 36,000
1,162,800 384,000
Investment
VG (Average Room Size of 28m2) VGE (Benchmarked Room Size of 18m2)
Total Per Sq. Meter Total Per Sq. Meter
Equipment 12,0002 428.57 8,000 444.44
Without Equipment 88,000 3,142.86 57,600 3,2003
Total Investment per Room 100,000 3,571.43 65,600 3,644.44
1 Rounded up 2 12% of the Total Investment per Room, data provided by VG 3 Value of the Investment per Room without Equipment of a normal VG Hotel rounded up.

THE INTERNATIONALIZATION OF VILA GALÉ TO THE SOUTH OF BRAZIL
45
CURITIBA BENCHMARK
Rates/
Unit
Price
Year (Relevant ones showing changes considered in )
0 1 2
10 111
152 16
203 21
30
Rooms Available per Year 120 0 43800 43800 43800 43800 43800 43800 43800 43800 43800
Average Occupancy Rate 0 0.72 0.72 0.72 0.72 0.72 0.72 0.72 0.72 0.72
Occupied Rooms per Year 0 31536 31536 31536 31536 31536 31536 31536 31536 31536
Paid Nights (Freq. Index) 1 0 31536 31536 31536 31536 31536 31536 31536 31536 31536
Average Room Price 60 60 60 60 60 60 60 60 60 60 60
Rev
. Lodging 0 1892160 1892160 1892160 1892160 1892160 1892160 1892160 1892160 1892160
F&B 5 0 157680 157680 157680 157680 157680 157680 157680 157680 157680
Total Revenues 0 2049840 2049840 2049840 2049840 2049840 2049840 2049840 2049840 2049840
Op
era
tio
na
l C
ost
s
Lo
dg
ing
# Employees 0 10 10 10 10 10 10 10 10 10
Employees' cost 14400 0 144000 144000 144000 144000 144000 144000 144000 144000 144000
Other Lodging Costs 0.05 0 94608 94608 94608 94608 94608 94608 94608 94608 94608
Total Lodg. Costs 0 238608 238608 238608 238608 238608 238608 238608 238608 238608
(Lodging Results) 0 1653552 1653552 1653552 1653552 1653552 1653552 1653552 1653552 1653552
F&
B
# Employees 0 8 8 8 8 8 8 8 8 8
Employees' cost 12000 0 96000 96000 96000 96000 96000 96000 96000 96000 96000
Direct Costs 0.3 0 47304 47304 47304 47304 47304 47304 47304 47304 47304
Other F&B Costs 0.03 0 4730.4 4730.4 4730.4 4730.4 4730.4 4730.4 4730.4 4730.4 4730.4
Total F&B Costs 0 148034.4 148034.4 148034.4 148034.4 148034.4 148034.4 148034.4 148034.4 148034.4
(F&B Results) 0 9645.6 9645.6 9645.6 9645.6 9645.6 9645.6 9645.6 9645.6 9645.6
Ad
min
ist.
# Employees 0 3 3 3 3 3 3 3 3 3
Employees' cost 36000 0 108000 108000 108000 108000 108000 108000 108000 108000 108000
Other Costs 0.01 0 20498.4 20498.4 20498.4 20498.4 20498.4 20498.4 20498.4 20498.4 20498.4
Total Administ. Costs 0 128498.4 128498.4 128498.4 128498.4 128498.4 128498.4 128498.4 128498.4 128498.4
Mai
nte
n. # Employees 0 2 2 2 2 2 2 2 2 2
Employees' cost 18000 0 36000 36000 36000 36000 36000 36000 36000 36000 36000
Other Costs 0.03 0 61495.2 61495.2 61495.2 61495.2 61495.2 61495.2 61495.2 61495.2 61495.2
Total Mainten. Costs 0 97495.2 97495.2 97495.2 97495.2 97495.2 97495.2 97495.2 97495.2 97495.2
Energy 5 0 157680 157680 157680 157680 157680 157680 157680 157680 157680
Marketing 0.0317 0 64979.928 64979.928 64979.928 64979.928 64979.928 64979.928 64979.928 64979.928 64979.928
Others 0.0236 0 48376.224 48376.224 48376.224 48376.224 48376.224 48376.224 48376.224 48376.224 48376.224
Total Operational Costs 0 883672.152 883672.152 883672.152 883672.152 883672.152 883672.152 883672.152 883672.152 883672.152
EBITDA 0 1166167.848 1166167.848 1166167.848 1166167.848 1166167.848 1166167.848 1166167.848 1166167.848 1166167.848
Dep
rec. Land&Building 0.05 0 334560 334560 334560 334560 334560 334560 334560 0 0
Equipment&Forniture 0.067 0 78720 78720 78720 78720 78720 55104 55104 55104 55104
Total Annual Deprec. 0 413280 413280 413280 413280 413280 389664 389664 55104 55104
EBIT 0 752887.848 752887.848 752887.848 752887.848 752887.848 776503.848 776503.848 1111063.848 1111063.848
Interests 0 0 0 0 0 0 0 0 0 0
1 First year with positive cumulative Cash Flow 2 Remodel year. Considering 80% of the Investment at year 0. 3 End of building depreciation

INTERNATIONALIZATION FIELD LAB
46
EB
T
in Euros 0 752887.848 752887.848
752887.848 752887.848
752887.848 776503.848
776503.848 1111063.848
1111063.848
In Reals (for the IRPJ) 2.7294 0 2054898.217 2054898.217 2054898.217 2054898.217 2054898.217 2119354.664 2119354.664 3032487.675 3032487.675
Ta
xes
IRPJ5 (in Euros) 0.15 0 179429.216 179429.216 179429.216 179429.216 179429.216 185333.2352 185333.2352 268973.5071 268973.5071
CSLL6 0.09 0 67759.90632 67759.90632 67759.90632 67759.90632 67759.90632 69885.34632 69885.34632 99995.74632 99995.74632
PIS/PASEP7 0.0165 0 12422.64949 12422.64949 12422.64949 12422.64949 12422.64949 12812.31349 12812.31349 18332.55349 18332.55349
COFINS8 0.076 0 57219.47645 57219.47645 57219.47645 57219.47645 57219.47645 59014.29245 59014.29245 84440.85245 84440.85245
ISS9 0.05 0 102492 102492 102492 102492 102492 102492 102492 102492 102492
ITBI10 0.02 157440 0 0 0 0 0 0 0 0 0
Total Taxes11 157440 419323.2483 419323.2483 419323.2483 419323.2483 419323.2483 429537.1875 429537.1875 574234.6594 574234.6594
Earnings -157440 333564.5997 333564.5997 333564.5997 333564.5997 333564.5997 346966.6605 346966.6605 536829.1886 536829.1886
Depreciations 0 413280 413280 413280 413280 413280 389664 389664 55104 55104
Ca
pE
X
Land&Building 0.85 6691200 0 0 0 0 0 0 0 0 0
Equipment&Forniture 0.15 1180800 0 0 0 0 826560 0 0 0 0
Total CapEX12 7872000 0 0 0 0 826560 0 0 0 0
FCF -8029440 746844.5997 746844.5997
746844.5997 746844.5997
-79715.40031 736630.6605
736630.6605 591933.1886
591933.1886
(Actualized FCF) -8029440 678949.6361 617226.9419 287940.9237 261764.4761 -19083.23305 160312.294 109495.4539 79988.26973 33922.83469
Cumulative FCF -8029440 -7282595.4 -6535750.801 -560994.0031 185850.5966 2346668.995 3083299.656 6029822.298 6621755.487 11949154.18
(Cum. Actualized FCF) -8029440 -7350490.364 -6733263.422 -3440403.24 -3178638.764 -2546752.488 -2386440.194 -1878271.793 -1798283.523 -1337629.173
Financial Indicators: Curitiba’s Benchmark
Cost of Equity 10%
NPV -1,337,629.17€
PI 0.829
Annualized Benefit -141,894.70€
4 Rate provided by Bloomberg, computed using geometric average for a 10 years weekly data 5 Computed over the EBT (15% over the total results, plus 10% over the annual EBT share over 240,000 Reals) 6 Computed over the EBT 7 Computed over the EBT 8 Computed over the EBT 9 Computed over the Total Revenues 10 Computed over the Total CapEX 11 There is one Municipal Tax (IPTU) that was not considered since it depends of the property value each year 12 Computed by multiplying the Total Investment per Room (see Investment Table) by the number of rooms

THE INTERNATIONALIZATION OF VILA GALÉ TO THE SOUTH OF BRAZIL
47
PORTO ALEGRE BENCHMARK
Rates/
Unit
Price
Year (Relevant ones showing changes considered in )
0 1 2
8 9
15 16
20 21
30
Rooms Available per Year 120 0 43800 43800 43800 43800 43800 43800 43800 43800 43800
Average Occupancy Rate 80% 0% 80% 80% 0.8 0.8 80% 80% 80% 80% 80%
Occupied Rooms per Year 0 35040 35040 35040 35040 35040 35040 35040 35040 35040
Paid Nights (Freq. Index) 1 0 35040 35040 35040 35040 35040 35040 35040 35040 35040
Average Room Price 66 66 66 66 66 66 66 66 66 66 66
Rev
. Lodging 0 2312640 2312640 2312640 2312640 2312640 2312640 2312640 2312640 2312640
F&B 5 0 175200 175200 175200 175200 175200 175200 175200 175200 175200
Total Revenues 0 2487840 2487840 2487840 2487840 2487840 2487840 2487840 2487840 2487840
Op
era
tio
na
l C
ost
s
Lo
dg
ing
# Employees 0 10 10 10 10 10 10 10 10 10
Employees' cost 0 0 144000 144000 144000 144000 144000 144000 144000 144000 144000
Other Lodging Costs 5% 0 115632 115632 115632 115632 115632 115632 115632 115632 115632
Total Lodg. Costs 0 259632 259632 259632 259632 259632 259632 259632 259632 259632
(Lodging Results) 0 2053008 2053008 2053008 2053008 2053008 2053008 2053008 2053008 2053008
F&
B
# Employees 0 8 8 8 8 8 8 8 8 8
Employees' cost 0 0 96000 96000 96000 96000 96000 96000 96000 96000 96000
Direct Costs 30% 0 52560 52560 52560 52560 52560 52560 52560 52560 52560
Other F&B Costs 3% 0 5256 5256 5256 5256 5256 5256 5256 5256 5256
Total F&B Costs 0 153816 153816 153816 153816 153816 153816 153816 153816 153816
(F&B Results) 0 21384 21384 21384 21384 21384 21384 21384 21384 21384
Ad
min
is
t
# Employees 0 3 3 3 3 3 3 3 3 3
Employees' cost 0 0 108000 108000 108000 108000 108000 108000 108000 108000 108000
Other Costs 1% 0 24878.4 24878.4 24878.4 24878.4 24878.4 24878.4 24878.4 24878.4 24878.4
Total Administ Costs 0 132878.4 132878.4 132878.4 132878.4 132878.4 132878.4 132878.4 132878.4 132878.4
Mai
nte
n. # Employees 0 2 2 2 2 2 2 2 2 2
Employees' cost 0 0 36000 36000 36000 36000 36000 36000 36000 36000 36000
Other Costs 3% 0 74635.2 74635.2 74635.2 74635.2 74635.2 74635.2 74635.2 74635.2 74635.2
Total Mainten. Costs 0 110635.2 110635.2 110635.2 110635.2 110635.2 110635.2 110635.2 110635.2 110635.2
Energy 5 0 175200 175200 175200 175200 175200 175200 175200 175200 175200
Marketing 3.17% 0 78864.528 78864.528 78864.528 78864.528 78864.528 78864.528 78864.528 78864.528 78864.528
Others 2.36% 0 58713.024 58713.024 58713.024 58713.024 58713.024 58713.024 58713.024 58713.024 58713.024
Total Operational Costs 0 969739.152 969739.152 969739.152 969739.152 969739.152 969739.152 969739.152 969739.152 969739.152
EBITDA 0 1518100.848 1518100.848 1518100.848 1518100.848 1518100.848 1518100.848 1518100.848 1518100.848 1518100.848
Dep
. Land&Building 5% 0 334560 334560 334560 334560 334560 334560 334560 0 0
Equipment&Forniture 6.67% 0 78720 78720 78720 78720 78720 55104 55104 55104 55104
Total Annual Deprec 0 413280 413280 413280 413280 413280 389664 389664 55104 55104
EBIT 0 1104820.848 1104820.848 1104820.848 1104820.848 1104820.848 1128436.848 1128436.848 1462996.848 1462996.848
Interest 0 0 0 0 0 0 0 0 0 0
EBT (in Euros) 0 1104820.848 1104820.848 1104820.848 1104820.848 1104820.848 1128436.848 1128436.848 1462996.848 1462996.848
(in Reals) 0 0 3015448.312 3015448.312 3015448.312 3015448.312 3015448.312 3079904.76 3079904.76 3993037.77 3993037.77

INTERNATIONALIZATION FIELD LAB
48
Tax
IRPJ 15% 0 267412.752 267412.752
267412.752 267412.752
267412.752 273316.7712
273316.7712 356957.0431
356957.0431
CSLL 9% 0 99433.87632 99433.87632 99433.87632 99433.87632 99433.87632 101559.3163 101559.3163 131669.7163 131669.7163
PIS/PASEP 1.65% 0 18229.54399 18229.54399 18229.54399 18229.54399 18229.54399 18619.20799 18619.20799 24139.44799 24139.44799
COFINS 7.60% 0 83966.38445 83966.38445 83966.38445 83966.38445 83966.38445 85761.20045 85761.20045 111187.7604 111187.7604
ISS 5% 0 124392 124392 124392 124392 124392 124392 124392 124392 124392
ITBI 2% 157440 0 0 0 0 0 0 0 0 0
Total Taxes 157440 593434.5568 593434.5568 593434.5568 593434.5568 593434.5568 603648.496 603648.496 748345.9679 748345.9679
Earnings -157440 511386.2912 511386.2912 511386.2912 511386.2912 511386.2912 524788.352 524788.352 714650.8801 714650.8801
Depreciations 0 413280 413280 413280 413280 413280 389664 389664 55104 55104
Ca
p
EX
Land&Building 85% 6691200 0 0 0 0 0 0 0 0 0
Equipment&Forniture 15% 1180800 0 0 0 0 826560 0 0 0 0
Total CapEX 7872000 0 0 0 0 826560 0 0 0 0
FCF -8029440 924666.2912 924666.2912
924666.2912 924666.2912
98106.2912 914452.352
914452.352 769754.8801
769754.8801
(Actualized FCF) -8029440 840605.7193 764187.0175 431363.6491 392148.7719 23485.86611 199011.4751 135927.5153 104017.4164 44113.53858
Cumulative FCF -8029440 -7104773.709 -6180107.418 -632109.6704 292556.6208 5013994.368 5928446.72 9586256.128 10356011.01 17283804.93
(Cumulative Actualized FCF) -8029440 -7188834.281 -6424647.263 -3096413.579 -2704264.807 -1194226.565 -995215.0895 -364375.4912 -260358.0748 338680.7037
Financial Indicators: Porto Alegre’s Benchmark
Cost of Equity 10%
NPV 338,680.70€
PI 1.037
Annualized Benefit 35,926.99€

THE INTERNATIONALIZATION OF VILA GALÉ TO THE SOUTH OF BRAZIL
49
Scenario Analysis - CURITIBA
Changing Investment without Equipment per m2
Scenario Cheap and
Simple Cheap Simple Benchmark Elaborated Expensive
Invest. Without
Equip./m2 2300 2600 2900 3200 3500 3800
Ind
.
Total Invest. 5928000 6576000 7224000 7872000 8520000 9168000
NPV 315,231.52€ -235,722.04€ -786,675.61€ -1,337,629.17€ -1,888,582.74€ -2,439,536.30€
PI 1.047 0.960 0.889 0.829 0.779 0.735
Changing Amount of Rooms
Scenario Smallest Smaller Benchmark Larger Largest
Amount of Rooms 80 100 120 140 160
Ind
.
Total Investment 5248000 6560000 7872000 9184000 10496000
NPV -1,548,891.46€ -1,443,260.32€ -1,337,629.17€ -1,231,998.03€ -1,126,366.89€
PI 0.707 0.780 0.829 0.864 0.890
Changing Amount of Rooms and Investment without Equipment per m2 (negative correlation)
Scenario Cheap and Largest Simple and
Larger Benchmark
Elaborated and
Smaller
Expensive and
Smallest
Invest. Without
Equip./m2 2600 2900 3200 3500 3700
Amount of Rooms 160 140 120 100 80
Ind
.
Invest/Room 54800 60200 65600 71000 74600
Total Investment 8768000 8428000 7872000 7100000 5968000
NPV 342,842.62€ -589,218.87€ -1,337,629.17€ -1,902,388.29€ -2,161,062.09€
PI 1.033 0.927 0.829 0.734 0.642
Changing Amount of Rooms and Investment without Equipment per m2 (positive correlation)
Scenario Cheap and
Smallest
Simple and
Smaller Benchmark
Elaborated and
Larger
Expensive and
Largest
Inv. Without Equip./m2 80 100 120 140 160
Amount of Rooms 2600 2900 3200 3500 3800
Ind
.
Invest/Room 54800 60200 65600 71000 76400
Total Investment 4384000 6020000 7872000 9940000 12224000
NPV -814,286.70€ -984,132.34€ -1,337,629.17€ -1,874,777.19€ -2,595,576.40€
PI 0.814 0.836 0.829 0.811 0.788
Changing Prices
Scenario Lower Low Benchmark High Higher
Price 50 55 60 65 70
Ind
. NPV -2,630,951.92€ -1,984,290.55€ -1,337,629.17€ -690,967.80€ -44,306.42€
PI 0.669 0.749 0.829 0.909 0.989
Changing Annual Average Occupancy Rate
Scenario Pessimistic MidScale
Prospects Benchmark Optimistic
Porto Alegre
Prospects
Av. Annual OR 64% 68% 72% 76% 80%
Ind
. NPV -2,151,723.88€ -1,744,676.53€ -1,337,629.17€ -930,581.82€ -523,534.46€
PI 0.728 0.779 0.829 0.880 0.930

INTERNATIONALIZATION FIELD LAB
50
Changing Prices and Annual Average Occupancy Rate (negative correlation)
Scenario Lower Low Benchmark High Higher
Price 50 55 60 65 70
Av. Annual Occ. Rate 80% 76% 72% 68% 64%
Ind
. NPV -1,960,559.74€ -1,613,168.82€ -1,337,629.17€ -1,133,940.79€ -1,002,103.66€
PI 0.752 0.795 0.829 0.854 0.871
Changing Prices and Amount of Rooms (negative correlation)
Scenario Lower and
Largest Low, Larger Benchmark
High and
Smaller
Higher and,
Smallest
Amount of Rooms 160 140 120 100 80
Price 50 55 60 65 70
Ind
. NPV -2,850,797.22€ -1,986,436.30€ -1,337,629.17€ -904,375.84€ -686,676.29€
PI 0.730 0.784 0.829 0.861 0.867
Changing Prices and Amount of Rooms (positive correlation)
Scenario Smallest and
Lower Smaller and
Low Benchmark Larger and High
Largest and Higher
Amount of Rooms 80 100 120 140 160
Price 50 55 60 65 70
Ind
. NPV -2,411,106.62€ -1,982,144.79€ -1,337,629.17€ -477,559.76€ 598,063.44€
PI 0.547 0.700 0.829 0.944 1.051
Scenario Analysis – PORTO ALEGRE
Changing Amount of Rooms
Scenario Smallest Smaller Benchmark Larger Largest
Amount of Rooms 80 100 120 140 160
Ind
.
NPV -431,351.54€ -46,335.42€ 338,680.70€ 723,696.83€ 1,108,712.95€
PI 0.915 0.988 1.037 1.072 1.098
Total Investment 5248000 6560000 7872000 9184000 10496000
Changing Investment without Equipment per m2
Scenarios Cheapest Cheaper Benchmark Elaborated Expensive
Invest. Without
Equip./m2 2600 2900 3200 3500 3800
Ind
.
NPV 1,440,587.84€ 889,634.27€ 338,680.70€ -212,272.86€ -763,226.43€
PI 1.209 1.115 1.037 0.971 0.914
Invest/Room 54800 60200 65600 71000 76400
Total Investment 6576000 7224000 7872000 8520000 9168000
Changing Amount of Rooms and Investment without Equipment per m2 (negative correlation)
Scenarios Cheapest and
Largest
Cheaper and
Larger Benchmark
Elaborated and
Smaller
Expensive and
Smallest
Invest. Without
Equip./m2 2600 2900 3200 3500 3800
Amount of Rooms 160 140 120 100 80
Ind
.
NPV 2,577,922.46€ 1,366,475.99€ 338,680.70€ -505,463.39€ -1,165,956.29€
PI 1.282 1.153 1.037 0.926 0.809
Invest/Room 54800 60200 65600 71000 76400

THE INTERNATIONALIZATION OF VILA GALÉ TO THE SOUTH OF BRAZIL
51
Total Investment 8768000 8428000 7872000 7100000 6112000
Changing Amount of Rooms and Investment without Equipment per m2 (positive correlation)
Scenarios Cheapest and
Smallest Cheaper and
Smaller Benchmark
Elaborated and Larger
Expensive and Largest
Invest. Without
Equip./m2 2600 2900 3200 3500 3800
Amount of Rooms 80 100 120 140 160
Ind
.
NPV 303,253.21€ 412,792.55€ 338,680.70€ 80,917.67€ -360,496.56€
PI 1.062 1.062 1.037 1.003 0.966
Invest/Room 54800 60200 65600 71000 76400
Total Investment 4384000 6020000 7872000 9940000 12224000
Changing Annual Average Occupancy Rate
Scenarios MidScale Prospects
Lower Prospects
Benchmark Higher
Prospects Optimistic
Av. Annual Occ. Rate 68% 74% 80% 86% 92%
Ind
. NPV -1,011,793.64€ -336,556.47€ 338,680.70€ 1,013,917.87€ 1,689,155.04€
PI 0.870 0.953 1.037 1.121 1.204
Source: Results from Scenario Analysis applied to the two Benchmark Models.
EXHIBIT 15 Ibis’ Prices
Ibis Prices for 2014 (four random dates within 3 months interval).
IBIS CURITIBA (Prices
in €) Jan Apr Jul Oct Annual Average
Centro Civico 44.75 44.75 44.75 46.35 45.15
Shopping 49.22 52.42 60.41 52.42 53.62
Batel 57.53 55.93 60.73 60.73 58.73
Average 50.50 51.03 55.30 53.17 52.50
IBIS PORTO ALEGRE
(Prices in €) Jan Apr Jul Oct Annual Average
Moinhos de Vento 66.8 66.8 66.8 66.8 66.8
Aeroporto 66.8 66.8 70 66.8 67.6
Average 66.8 66.8 68.4 66.8 67.2
Source: Ibis Website

INTERNATIONALIZATION FIELD LAB
52
EXHIBIT 16 Implementation Process
Source: own assemblage

THE INTERNATIONALIZATION OF VILA GALÉ TO THE SOUTH OF BRAZIL
53
ENDNOTES
i “Deloitte – Atlas da Hotelaria 2012”
ii Professional Association of Innkeepers International at
http://www.innkeeping.org/?The_Industry
iii InterContinental Hotel Group Website
iv Accor Group Website
v O Indice de Desenvolvimento Humano Municipal Brasileiro p.44
vi Ranking presented by the Internet World Stats at
http://www.internetworldstats.com/top20.htm
vii Info provided by Independ Statistics & Analysis from the US Energy Information
Administration at http://www.eia.gov/countries/cab.cfm?fips=BR
viii Climate information provided at http://www.brcactaceae.org/climate.html
ix Capacity Data extracted from each Airport Webpage at
http://www.infraero.gov.br/index.php/br/aeroportos.html
x Hotel Invest – Brazilian Hotel Market Overview 2011-2012