a101657 - military standards mil-std, military...
TRANSCRIPT

A101657
AFWAL.TR-T1.3041VOLUME 1
EFFECT OF VARIANCES ANDMANUFACTURING TOLERANCES ON THEDESIGN STRENGTH AND LIFE OFMECHANICALLY FASTENEDCOMPOSITE JOINTSVOLUME I - METHODOLOGY DEVELOPMENT AND
DATA EVALUATION
S.P. Garbo and J.M. O4onowski J
McDonnell Aircraft CormnveyMcDonnell Douglas CorporationP.O. Box 516St. Louis, Missouri 63166 .
April 1981
Final Rnport for Period 15 February 1978- 15 April 1981
-pwn ftr URbIftISS idt'IbUwid UUUI*
-__ T DYNAMICS LABGS : ?ORY'In FORCE WRIGHT AERONAUTICAL LABSRA•C•IES
AIR FORCE SYSTEkMS COMMANDWRIGHT-PATTERSON AIR FORCE BASE, OHIG 4 8 7210381 7 21 009
Downloaded from http://www.everyspec.com

-D' NOTICE
When Government drawings, specifications, or other data areused for any purpose other than in connection with a definitelyrelated Government procuremant operation, the United StatesGovernment thereby incurs no responsibility nor azrny obligationwhatsoever; anid the fact that the government may have formulated,furnished, or in any way supplied the said drawing, specifica-tions, or other data, is not to be regarded by implication orotherwise as in any manner licensing the holder or any otherperson or corporation, or conveying any rights or permission tomanufacture, use, or sell any patented invention that may in anyway be related theereto.
Thie report has been reviewed by the Office of PublicAffairs (ASD/PA) and is releasable to the National TechnicalInformation Service (NTIS). At NTIS, it will be available to thegeneral public, including foreign nations.
Thiis technical report has been reviewed and is approved forpublication.
ROBERT L. GALLO, Capt, USAF DAVEY L/ SAITH, Chief
Project Engineer Structural Integrity Branch
Structures & Dynamics Division
FOR THE COMMANDER
RALPH L. KUSTER, JR., Col, USAFChief, Structures and Dynamics Division
If your address "is changed, if you wish to be removed frontour mailing list, or if the addressee is no longer employed byyour organization please notify AFWAL/FIBEC, Wright-PattersonAFB, OH 45433 to help urs maintain a cu:rent mailing list. Copiesof this report should riot be returned unless return is requiredby security considerations, contractual obligations, or notice ona specific document.AIR FORCE/5678011 July 1981 - 500
Downloaded from http://www.everyspec.com

SECURITY q r6,CATION Of THIS PAGE (WPhen Da. Entered)"
RPORT DOCU4ENTATION PAGE READ INSTRUCTIONSBEFORE COMPLETING FORM
" GoV ACCESSION NO. IENT'S CATALOG NUMBER
AFAL R-8--3,4 1' V I h V±
tFFECT OF YARIANCES AND MANUFACTURIW OLEIRANCE [Final Je_. 15TH PSI6N §TRENGTHq At IFE OF rE&ANICALLY 115 Apr t@S8lflITT-
.,ASTENED OMPOýITE P, :NTS. REPORT NUMBE
AU Sý0IF-0 CONTRACT O GRA~NT UMNER(a)
J. M. /Ogonowski -- 7
ibe'oSwPt) G ORGANIZATION NAME AND ADDRESS 10 PROGRAM ELEMENT. 'PROJECT, TASK
McDonnell Aircraft Company AREA A WORK UNIT NUMBERSP.O. Box 516 P.E. 62201FSt. Louis, Missouri 63166 W.U. 24010110
I.CONTROLLING OFFICE NAME: AND ADDRESS
Flight Dynamics Laboratory (AFWAL/FIBEC) [ j ApAir Force Wright Aej:onautical Lab. (AFSC) Ur PAGES
Wright-Patterson AFB, Ohio 45433 14414 MONITORING AGENCY NAME & Ar)ORESS(It different fron. Controllin4 Olfice) 15. SECURITY CLASS. (of it . report)
7 ,1 Jnclassif iedIS. DE C ASSI FICATION/ DOWNGRADING
SCHEDULE
16 DISTRBUTION STATEMENT (of th
Approved for public release; distribution unlimited
17, DISTRIBUTION ST 4ENT (of abstract eentered in Block 20, If different froe. Report) 4
IS SUPPLEMENTARY IES " '
C'
19. KE V WORDS Zonllnuie or reverse side if neciiesli znd Identify iiy black numbwr)
Bolted Joints Orthotropic Ltad DistributionsComposite Stress Concentrations Sl:ress AnalysisGraphite-epoxy Methodology Failure CriterLa
Fatigue Life
0 ABSTRACT (Conlinu on reverse sde If necesesry and Identify by block number)
The subject of this program was structural evaluation of mechanicallyfastened composite Joints. Program objectives were threefold: (1) develop-ment and verification by test of improved static strength methodology,(2) experimental evaluation of the effects of manufacturing anomalies onjoint itatic strength, and (3) experimental evaluation of joint fatigue life.-
DI I JAN 3o 1473SECURITt' CLASSIFICATION OF THIS PAGE (When Data Entered)
Li"- T 7 ! . ...-Cm11 ,
Downloaded from http://www.everyspec.com

SECURITY CLASSIFICATION OF THIS PAGE(When Data Enfl.;d_
,'Program activities to accomplish these objectives were organized underfive tasks. Under Task 1 - Literature Survey, a surivey wae perform4 todetermine the state-of--the-art in design and analysisi of bolted coa.6 ,sitejoints. Expezimental evaluations of joint static strength were performedunder Tatsks 2 and 3. In Task 2 - Evaluation of Joint Design Variables,strength data were obtained through an experimental, program to evaluate theeffects of twelve joint design variables. Tn Task 3 - Evaluation of Manu-facturing and Service Anomaelies, effects of seven anomailies on joint strengthwere evaluated experimentally and compared with Task 2 strength data. Beltedcomposite joint durability was evaluated under Task 4 - Evaluation of Crii:tcalJoint Design Variables on Fatigue life. Seven critical design variables o0.manufacturing anomalies were identified based on Task 2 and 3 strength data.Under Task 5 - Final Analyses eind Correlation, required data reduction,methodology development and correlation, and necessary documentation wereperformed . -
This report documents all program activitics performed under Tasks 2, 3,4 and 5. Activities performed under Task 1 - L-iterature Survey, were pre-viously reported in AFFDL-TR-78-179. Static. strength methodology and evalua-tions of joint static and fatigue test data are reported. Analytic, studiescomplfment methodology developmeizt and illustrate: the need fcr detailedstress analysis, the utility of the developed "Bolted Joint Stress FieldModel" (BJSFM) procedure, and define i-odel limitatLins. For static strengthdata, correlations with analytic predicbtions are included. Data trends inall cases are discussed relative joint strz',agth and failure mode. Forjoint fatigue studies, data trends are discuesed relative to life, holeelongation, and failure mode behavior.
Tbis final report is organized in the •oll]owin$ three volumes:
Vlolume 1 - M1ethodology Development ard asta Eval.uationVilume 2 - lest Data, Equlpment and ProceduresVolume 3 - Belted Joint Stress Field Model (BJSFM) Camputr
FrL'gram User's Manual
SECURITY LASSIFICATION OF THIS PArkir-'When Date Entered)
Downloaded from http://www.everyspec.com

FOREWORD
The work reported herein was performed by the McDonnellAircraft Company (MCAIR) of the McDonnell Douglas Corporation(MDC), St. Louis, Missouri, under Air Force Contract F33615-77-C-3140, for the P'light Dynamics Laboratory, Wright-Patterson AirForce Base, Ohio.. This effort was conducted under Project No.2401 "Structural Mechanics", Task 240101 " Structural Integrityfor Military Aeroxzpace Vehicles", Work Unit 24010110 "Effect ofVariances and Manufacturing Toleranceii on the Design Strength andLife of Meclianically Fastened Composite Joints". The Air ForceProject Engineer at contract go-ahead was Mr. Roger J.Aschenbrenner (A•'WAL/FIBEC); in Dec,-.mber 1979, Capt. Robert L.Gallo (AFWAL/FIBEC) assumed this assignment. The work describedwas conducted during the period 15 February 1978 through 15 April1981.
Program Manager was Mr. Raman A. Garrett, Branch ChiefTerhnology, MCAIR Structural Research Department.. PrincipalInvestigator was Mr. Samual P. Garbo, MCAIR Structural ResearchDepartment.
Dr ý C T'. I_
Di st ribution /
AvailmbilitY Codes .nn," or
iii9IL
I
I• •.•• ".. " -- .• mm -• • `.-- • ••••.• • •- -4 `*•• •.•.. ."• ' ..L4"
Downloaded from http://www.everyspec.com

TABLE OF COI4rENTSSection P_
I INTRODUCTION . . . . . . . . . . . . . . . . . . . . . . 1
I1 SUMMARY AND COMCLUSIONS . . . . . . . . . . . . . . . . 2
IXcI METHODOLOGY DEVELOPMENT KID ANALYTIC STUDIES . . . . . 5
1. BACKGROUND ...... . . . . . . . . . . . . 52. METHODOLOGY DEVELCPMENT ........... ... 53. PREDICTIONS USING BJSFM APPROACH. . . . . . . ... 15
a. Effects of Anisotropy on StressSDistributions .... ......... 15
b. Hole Size Effects ... .......... . 16c. Finite Width Effects .............. 17d. Characteristic Dimension Sensitivity Study . . 19e. Biaxial Loading Effects .............. 20f. Pure Bearing Strength Study .... .......... . 24g. Effects of Enviromment . . .......... . 25
IV TEST DATA EVALUATION ..... .................. 26
I. METHODOLOGY VERIFICATION: EVALUATION OF
JOINT DESIGN VARIABLES - TASK 2 ......... .26
a. Task 2 Test Plan . ....... .......... 26b. Correlation of 3JSFM Predictions With
Experimental Results and Evaluations ...... .. 35
(i) Strength of Laminates With Unloadedand Unfilled Holes . . . ........... 35
(2) Strength of Laminates With LoadedFastener Holes ......... ............. 44
(a) Layup Variation .. .. ........ . 50(b) Load Orientation .... ....... . . . . 50(c) Edgt Distance ........... ............ 55ký ;1) Widthi . . . . . . . . 57(e) Hole Size ....... .............. 57(f) Load Interaction .... ........... .. 64(g) Fastener Pattern . ....... ............ 73(h) Torque-up ......... . ............ 76(i) Fastener Countersink and
Laminate Thickness ... .......... .. 77(j) Stacking Sequence ................ 86(k) Single-Shear Loading ........... .. 86
V
Downloaded from http://www.everyspec.com

TABLE OF CONTENTS (Concluded)
Section age
2. EV\LIUATION OF MANUFACTURING AN.) SERVICEANOMALIES - TASK 3 .......................... 93
a. Task 3 Test Plan .......... ............... 93b. Experimental Results and Evaluation ..... ...... 94
(1) Out of Round Holes .. .......... 94(2) Broken Fibers on Exit Side of Hole 98(3) Porosity . . . . . .. . . . . . . . . . 100(4) Improper Fastener Seating Depth .. 102(5) Tilted Countersinks. . . ............ 104(6) Interference Fit .................... . 106(7) Fastener Removal and Reinstallation .... .. 109
3. EVALUATION OF CRITICAL JOINT DESIGN VARIABLESON FATIGUE LIFE - TASK 4 ...... ........... . . . . IC
a. Task 4 Test Plan . . . . ............ . . 110b. Experimental Results and Evaluation . . . . . . 115
(1) Layup Variation ...... .............. .. 117(2) Stacking Sequence . . . . ........... 125(3) Torque-Up.............. . . . . . . . . . 1.30(4) Joint Geometry . . . . . . . ... ... 135(5) Interference Fit ............. 138(6) Single-Shear Loading .............. . .. 138(7) Porosity .... ............ .142
V RECOMM>,NDATIONS ....................... 143
VI REFERENCES .............. ....................... 144
vi
-i
Downloaded from http://www.everyspec.com

LIST OF ILLUSTRATrIoNS
Figure Page
1 Superposition of Linear-Elastic Stress Solutions . 6
2 Uniaxially Loaded Infinite Plate ........ .......... 9
3 Assumed Cosine Bolt-Load Distribution ....... ...... 10
4 Characteristic Dimension Failure Hypothesis . . .. 12
5 Failure Criteria Comparison ....... ........... .. 13
6 Superposition of Solutions to Accountfor Finite Width. . ............ .* . . . . 14
7 CircuMferential Stress Solutions atUnloaded Holes ....... ................. . . . . 15
8 Circ mferential Stress Solutions atLoaded Holes ...................... 6
9 Effect of Hole Size on Stress Distributions .... 17
10 Correlation of Loaded Hole Analyses ..... ........ 18
11 Effects of Width on Stress Ccncentrations ....... 18
12 Correlation of Loaded Hole Analysis for SmallEdge Distance Cases ....... ..................... 19
13 Effect of Characteristic Dimension onPredicted Strength - 30/60/10 layup .. ........ .. 20
14 Effect of Biaxial Loading on Predicted Strength 21
15 Effect of Biaxial Loading on Failure Location . . . 22
16 effect of Biaxial Loading on Ply StrainConcentrations ............ ................... 23
17 Effect of Bearing Load Direction onPredicted Strength ..................... 24
18 Effect of Moisture and Temperature on
Laminate Strength ........... ................. 25
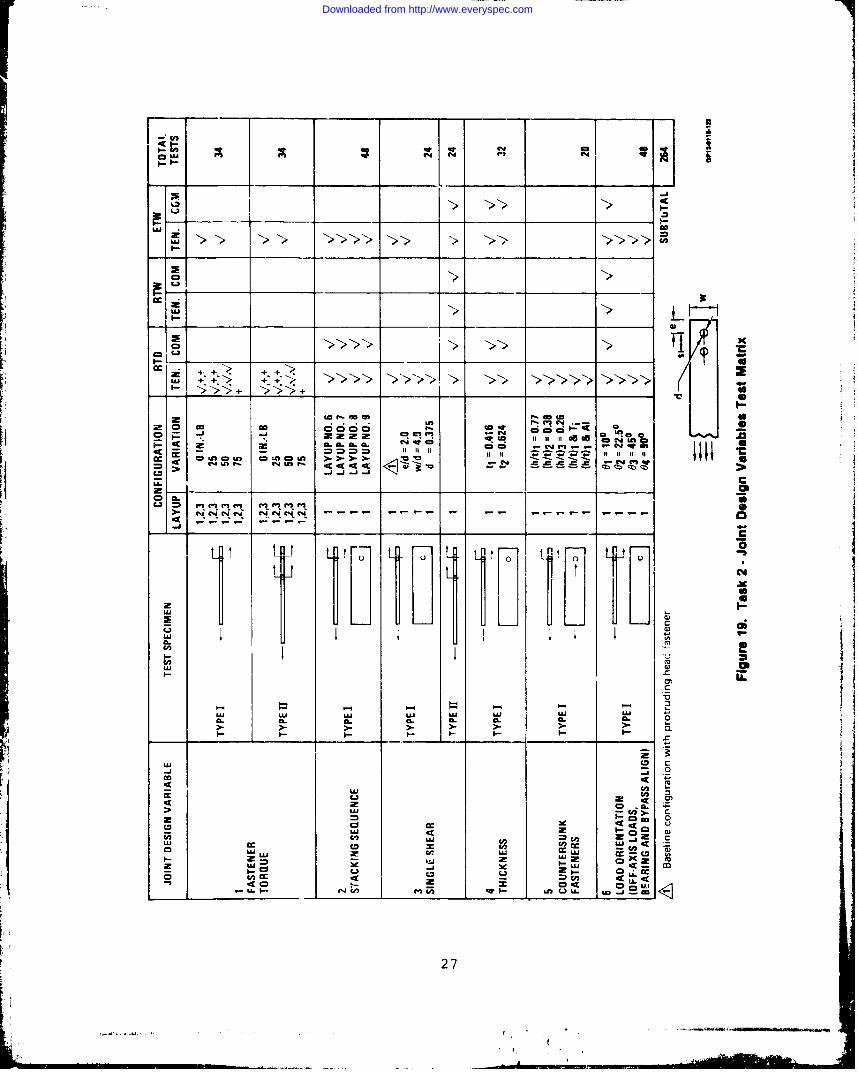
19 Task 2 - Joint Design Variables - Test Matrix . . 27
20 MCAIR Evaluation of Unloaded Hole Specimens -
Test Matrix ............... .................... 29
vii
Downloaded from http://www.everyspec.com

LIST OF ILLUSTRATIONS (Continued)
Frigure P _
21 MCAIR Evaluation of Loaded Hole SpecimensTest Matrix ............. .................... 30
22 Unloaded Hole Specimen Geometry ... .......... 30
23 Loaded Hole Specimen Configuration ... ......... .. 31
24 Specimen Loading Configurations ... .......... 32
25 Effect of Laminate Stiffness on SpecimenBolt-Load Distributions ....... .............. 33
26 Task 2 - Layup Number and Stacking Sequence ... 34
27 AS/3501-6 Lamina Mechanical Properties ....... .. 35
2R Effect of Layup Variation on UnloadedHole Tensile Strength ......... .............. 36
29 Effect of Hole Size on Unloaded HoleTensile Strength .......... .................. 37
30 Effect of Variation of Rc on Predicted
Tensile Strength ............ .................. 38
31 Predicted Failure Orientations Were Verified . 39
32 Effect Off-Axis Loading on Failure Stress ...... 40
33 Efrect of Variation of R, on PredictedCompressive Strength ........ ................ 41
34 Effect of Hole Size on Unloaded HoleCompressive Strength ........ ................ 42
35 Effect of Layup Variation on UnloadedHole Compressive Strength ....... ............. 43
36 Effect of Temperature on Unloaded HoleCompression Strength ........ ................ 44
37 Two-Bolt-In-Tandem Spezimen RaselineConfiguration ............. ................... 45
38 Variations of Single 7nstener SpecimenConfigurations . . ..................... 46
39 Variations of Two-Rolt-In-TandemSpecimen ConfiguratiLns ......... .............. 47
viii
Downloaded from http://www.everyspec.com
LIST OF ILLUSTRATIONS (Continued)
Figure Page
40 Variations of Load-Interaction SpecimenConfigurations ............ ................... 48
41 Fastener Pattern Specimen Geometry ... ......... .. 49
42 Effect of Layup Variation on JointTensile Strength ............ ................. .. 51
43 Effect of Layup Variation on JointCompreasive Strength ........ ................ 52
44 Effect of Off-Axis Loading on RTD PureBearing Strength. ......... ................. 53
45 Effect of Temperature and Moisture onOff-Axis Strength ........... ................. 54
46 Effect of Temperature and Moisture onCow.preusive Strength ........ ................ 55
47 Effect of Edge Distance on JointTensile Strength ............ ................. .. 56
48 Effect of Fastener Spacing on JointTensile Strength .......... .................. 58
49 Effect of Edge Distance on PureBearing Strength .......... .................. 59
50 Effect of Specimen Width on RTD Joint Strength . . . 60
51 Effect of Temperature and Moistureon Joint Strength ........... ................. 61
52 Joint Failures Changed at ETW Test Conditions. . . . 2
53 Effect of Hole Size on Joint Strength ....... 63
54 Load Interaction Specimen and Test Setup ...... .. 64
55 Correlation of Bearing-Bypass Strength of a50/40/10 Layup ............ ................... 65
56 Correlation of Bearing-Bypass Strength of a30/60/10 Layup ............ ................... 66
57 Effect of Bearing Loads on SpecimenLoad-Deflection Behavior ...... .............. 67
ix
Downloaded from http://www.everyspec.com

LIST OF ILLUSTRATIONS (Continued)
Figure Pag~e
58 Predicted Critical Plies for Net-SectionFailures .............. ...................... 68
59 Predicted Critical Plies for Bearing-ShearoutFailures .............. ...................... 69
E10 Tests Verify Predicted FailureInitiation Points ........... ................. 70
61 Load Conditions for Off-Axis".~oad-Interaction Tests ........ ............... .. 71
62 Effect of Off-Axis Bearing Loads onBypass Strength ........... ................. 72
63 Fastener-Pattern Specimen Loading Configurations . . 73
64 Effects of Environmnint on Fastener-PatternJoint Strength ............ ................... 74
65 Joint Failures for Fastener-Pattern Specimens . . . 75
66 Corrosion Resulting From Salt-Spray Exposure . . .. 76
67 Effect of Lavup and Torque-Up on RTD PureBearing Strength ............ ... .................. 78
68 Failures of Pure Bearing Specimens ........... .. 79
69 Comparison of Loaded and Unloaded Hole
Specimen Strength ........... ................. 80
70 Effect of Torque-Up on RTD Pure Bearing
Strength 50/40/10 Layup ....... .............. 81
71 Effect of Toraue-Up on RTD Pure BearingStrength 70/26/10 Layurp ....... .............. 82
72 Effect of Torque-Up on RTD Pure BearingStrength 30/60/10 Layup ....... .............. 83
73 Comparison of Effects of Torque-Up onJoint Stru-':'th ................ . ................... 84
74 Effects of Thickness and Countersink onJoint Tensile Strength ........ ............... 85
75 Effect of Stacking Sequence on JointTensile Strength .......... .................. 87
x
Downloaded from http://www.everyspec.com
LIST OF ILLUSTRATIONS (Continued)
Figure Paqe
76 Correlation of Joint RTD Tensile Strength
With Grouped 0 Plies ...... ............... 88
77 Correlation of Joint ETW Tensile StrengthWith Grouped 0° Plies ...............
78 Correlation of Joint RTD Compressive StrengthWith Grouped 0° Plies .... ................ 90
79 Comparison of Single and Double-ShearJoint Strengths ......... .................. 91
80 Correlation of Joint Strength With Edge Distance-to-Width Ratios ........................ 92
81 Task 3 - Evaluation of Manufacturing Anomalies -Test Matrix ............ .................... 93
S2 Specimen Moisture Conditioning Histories ...... .. 95
83 Summary of Task 3 Strength Reduction Percents . . . 96
84 Out-of-Round Holes - Specimen Details ....... 97
85 Effect of Out-of-Round Holes on Joint Strength .7 . C
86 C-Scans of Laminates With Delaminationsat Fastener Holes ........ ................. 98
87 Effect of Delaminations on Joint Strength ...... 99
88 Panel Fabrication Procedures Used toProduce Panel Porosity ........... ............... 130
89 Examples of Panel Porosity .... ............. .. 101
90 Freeze-Thaw Exposure Profile .... ............ 102
91 Effect of Porosity Around Hole on Joini Strength . 103
92 Effect of Improper Fastener Seating onJoint Strength ......... ................... 104
93 rilted Countersink - Specimen Configuration .... 105
94 Effect of Tilted Countersink on Joint Strength . . . 106
xi
Downloaded from http://www.everyspec.com

LIST OF ILLUSTRATIONS (Continued)
Figure Pag
95 Effect of Fastener Interference Fit onJoint Strength ........... .................. 107
96 P'hotomicrographic Examination of LaminatesWith Interference Fit Holes .... ........... 108
97 Effect of Fastener Removal and Reinstallationon Joint Strength ........ ................. 109
98 Task 4 - Evaluation of Critical JointVariables on Fatigue Life - Test Matrix ...... ...... li1i
99 Task 4 - Fatigue Specimen Configuration .......... 113
100 Distribution of Hours and Exceedances .. ...... 114
101 Measured Mix-Truncated Spectrum ... .......... 114
102 Task 4 Layup Numbers and Stacking Sequence ..... .. 115
103 Summary of Task 4 Specimen Static Strength ..... .. 116
104 RTD Baseline Joint Fatigue Life50/40/10 Layup ......... ................... 117
105 RTD Baseline Joint Fatigue Life30/60/10 Layup ......... ................... 118
106 RTD Baseline Joint Fatigue Life
19/76/5 Layup .......... ................... 118
107 Comparison of R = +0.1 Joint Fatijue Life Trends . . 119
108 Comparison of R = -1.0 Joint Fatigue Life Trends . 119
109 Hole Elongation Fatigue Life Trends50/40/10 Layup ................. ................... 120
110 Hole Elongation Fatigue Life Trends30/60/10 Layup ................. ................... 121
iii Hole Elongation Fatigue Life Trends19/76/5 Layup .......... ................... 121
112 Representative Specimen Fatigue Failures ...... .. 122
113 Summary of Effects of Environment onJoint Spectrum Fatigue Life ...................... 123
xii
Downloaded from http://www.everyspec.com
LIST OF ILLUSTRATIONS (Concluded)
Figure Page
11, Effect of R - +0.1 Loading on Hole Elorgation -Baeie50/40/10 Layup .............. 124Baseline 0//lay..........................2
115 Effect of R = +0.1 Loading on Joint Spring Rate -
Baseline 50/40/10 Layup . . . . . . . 125
116 Effect of Stacking Sequence on Joint Life -50/40/10 Layup .*. . ......... ........... 126
117 Effect of Stacking Sequence on Joint Life -19/76/5 Layup ........ . ............... 127
118 Stacking Sequence - Comparison With R = -1.0Baseline Life Trends ...................... . . . . 128
119 Su.acking Sequence - Comparison With R = +0.1Baseline Life Trends . . . . . .............. 128
120 Effect of Stacking Sequence - Hole ElongationLevels - 50/40/10 Layup ........... . . . . 129
121 Effect of Stacking Sequence - Hole ElongationLevels - 19/76/5 Layup ............. ........ 130
122 Summary of Effects of Stacking Sequence onJoint Spectrum Life . . . . . ............... 131
123 Effect of Torque-Up on Joint Fatigue "Lie50/40/10 Layup ............ ................... 132
124 Effect of Torque-Up on Joint Fatigue Life19/76/5 Layup ............. ................... 133
125 Specimen Failures for Torque-Up Conditions ..... .. 134
126 Effect of Geometry on Joint Fatigue Life50/40/10 Layap . . .................... 135
127 Effect of Geometry on Joint Fatigue Life19/76/5 Layup ................. ................... i36
128 Changes in Failure Due to Specimen Geometry . . . . 137
129 Effect of 0.005 Inch Interference Fit on JointFatigue Life - 50/40/10 Layup .... .......... 139
130 Effect of Single-Shear Loading on JointFatigue Life - 50/40/10 Layup ..... ........... .. 140
131 Failures of Single-Shear Specimens ... ......... .. 141
132 Effect of Porosity on Joint Fatigue Life -
50/40/10 Layuip ............ ................... 142
xiii
Downloaded from http://www.everyspec.com

SECTIONI
I NTRODUCT ION
The subject of this program was structural evaluation ofmechanically fastened composite joints. Program objectives werethreefold: (1) development and verification by test of improvedstatic strength methodology, (2) experimental evaluation of theeffects of manufacturing anomalies on joint static strength, and(3) experimental evaluation of joint fatigue life.
Program activities to accomplish th'ese objectives wereorganized under five tasks. Under Task 1 - Literature Survey, asurvey was performed to determine the state-of-the-art in designand analysis of bolted composite joints. Experimental evalua-tions of joii~t static strength were performed under Tasks 2 and3. In Task 2 - Evaluatior~ of Joint Design Variables, baselinestrengt~h data were obtained through an experimental program toevaluate the effects of twelve joint design variables. In Task 3- Evaluation of Manufacturing and Service Anomalies, effects ofseven anomalies on joint strength were experimentally evaluatedand compared with baseline Task 2 strength data. Bolted compos-ite joint durability was evaluated under Task 4 - Evaluation ofCritical Joint Design Variables On Fatigue Life. Seven criticaldesign variables or manufacturing anomalies were ide'nLified basedon Task 2 and 3 strength data. Under Task 5 - Final Analyses andCorrelation, required data reduction, methodology development andcorrelation, and necessary documentation were performed.
This report documents all program acti- ''ities performed underTasks 2, 3, 4 and 5. Activities performed under Task 1 - Litera-ture Survey, were previously reported in Reference 1. The mainbody of this report (Sections III and IV) documents developedstatic strength methodology and evaluations of joint static andfatigue test data. Associated analytic studies have beenincluded in Section III to complement methodology developmentdiscussions and to illustý-ate: the need for detailed stressanalysis, the utility of the developed "Bolted Joint Stress FieldModel" (BJSFM) procedure, and to define model limitations. Forstatic strength data reported in Section IV, correlations withanalytic predictions, where applicable, are included. DataJtrends in all cases are discussed relative to joint strength andfailure mode and compared to baseline data. For joint fatiguestudies, data trends are discussed relative to life, hole elonga-tion, and failure mode behavior.
This final report is crganized in three volumes: Volume 1-Methodology Development and Data Evaluation, Volume 2 -- TestData, Equipment and Procedures, Volume 3 - Bolted Joint StressField Model (BJsFM) computer Program User's Manual.
Downloaded from http://www.everyspec.com

I
SECTION II
SUMMARY AND CONCLUSIONS
Analytic methods were developed which permit strengthanalysis of bolted composite joints with minimal test datarequirements. Methodology was based on anisotropic theory ofelasticity; classical lamination plate theory, and a character-istic dimension (R ) failure hypothesis. The princAple ofelastic superpositioAc was used to obtain laminate stress distribu-tions due to combined loadings of bearing and bypass. Test datarequirements for general method use were minimized by extendingthe characteristic dimension failure hypothesis to a ply-by-plyanalysis in conjunction with known material failure criteria.Unidirectional (lamina) stiffness and strength data were usedwith an empirical value of R to predict stress distributions,critical plies, failure locatfon, and failure load of arbitrarylaminates under general loadings. The developed analysisprocedre is entitled the "Bolted Joint Stress Field Model"
The BJSFM methodology was originally developed for unloaded
hole analysis by McDonnell Aircraft Company (MCAIR) under an in-house research and development program. The methodology waxfurther verified and extended to the analysis of loaded holeaunder this program.
Under Task 2 - Evaluation of Joint Design variables, effectsof twelve joint design variables on static strength were experi-mentally evaluated. The BJSFM procedure was used to predict theeffects of five of the twelve design variables (layups, loadinteraction, off-axis loading, hole size, and width). Only exper-imental evaluation of the remaining variables was possible. Therange of test conditions in eachý design variable was identifiedin the Task I - Literature Survey.
Initial verification of analysis was obtained by correlatingstrength predictions with data b-i-- iti Lcfsws of specimenswith unfilled fastener hole,. Specimenn were tested to failurein tension and compressio[z. Values for R of .02 inch for ten-sile strength predictions and .025 inch f8r compressive strengthpredictions were empirically determined for one laminate, each ofwhich were fabricated using the Hercules AS/3501-6 graphite-epoxysystem. With these values of R &nd unidirectional ply (lamina)mechanical properties, BJSFM predictions were correlated withunloaded hole strength data for an extensive range of layup varia-tions and, in general, were accurate to within + 10%. Predictedfailure initjAtion points were visually verified: Correlation ofstrength predictions with data indicated that only knowledge oftemperature-altered lamina properties is required to predicteffects of temperature on general laminate strength; R remainedunchanged. C
2
Downloaded from http://www.everyspec.com

Joint load-deflection plots for specimens with either shear-out or bearing failures indicated nonlinear mechanical behavior,with ultimate failure occurring at loads considerably above ini-tial nonlinearities. Strength predictions obtained using theBTSFM procedure correlated with initial points cf joint nonlineardeflection behavior. Ultimate strength predictions using thelinear-elartic BJSFM procedure became increasingly conservativeas this joint nonlinear load-deflection behavior occurred. How--ever, predicted linear-elastic failures of critical plies weredue to exceeding lamina fiber or shear strength and implied thetype of localized joint failures and load redistribution typicalof the failure modis observed in tests.
Under Task 3 - Evaluation of Manufacturing and Service Anom-alies, effects of seven anomalies on joint static strength wereexperimentally evaluated and compared with baseline (no anomaly)'strength data. The seven anomalies were aelected based on MCAIRexperience and an available industry-wide survey (Reference 2).
Results fell into two groups: (1) anomalies which resultedin strength reductions of more than 13 percent (porosity aroundhole, improper fastener seating depth, and tilted countersinks),and (2) anomalies which resulted in strength reductions of lessthan 13 percent (out-of-round holes, broken fibers on exit sideof hole, interference fit tolerances, removal and reinstalla-tion). For anomalies of the first group, current industryinspection and acceptance criteria would have detected all threeand resulted in part rejection or required repair.
Unuer Task 4 - Evaluation of Critical Joint Design Variableson Fatigue Life, the influence of seven design variables and ano-malies on joint durability were evaluated. Tests were performedto provide data on joint fatigue life performance, hole elonga-tion, and failure mode behavior. Single-fastener pure bearingspecimens were cycled, under tension-tension (R = +0.1) and ten-sion-compression (R = -1.0) constant amplitude fatigue loading,and under spectrum fatigue loadings.
During fatigue testi'ng, load-deflection data were obtainedat specified increments of accumulated hole elongation. Severaltests were performed at environmental conditions previouslydefined in Task 2. Static and residual strength tests wereperformed on selected specimens at each test condition.
Joint fatigue life was defined to occur at specimen failureor when hole elongations of .02 inch were measured. Based onthis definition, little difference was noted in relative fatiguelife between 50/40/10, 30/6G/10 and 19/76/5 layups (percent 00,+450, 90° plies respectively) under tension-tension (R = +0.1)cycling. Under fully reversed load cycling, (R = -1.0), holeelongations of .02 inch occurred more rapidly in the matrix-dominant 19/76/5 layup, followed by the 30/60/10 and 50/40/10layups. Under spectrum fatigue tests of a'1 three layups, no
3
S i. II I
Downloaded from http://www.everyspec.com

hole elongation occurred after 16,COO spectrum hours at testlimit loads (TLL) of 891 of static strength values. This agreedwith constant amplitude fatigue test zesults; 16,000 hours ofspectrum loading at tbese levels did not produce enough cycles ofhigh loads to produce hole elongation.
Effects of faistener torque--up on Joint fatigue life werepronounced. Joints with torque-up Paltien exhibited increasedstrength and life for all layups testad, inder both R - +3.1 andR - -1.0 cycling. While failure modoas wore the same, aireas ofdamage were more pronounced for specimern with torque-up andfailure occurred more abruptly (rates of ',ole elongation, onceinitiated, were faster).
Effects of joint eccentricity and geometry also infLuencedjoint fatigue life characteristics. hingle.-shear specimensexhibited lower fatigue life as compared to the double-shearbaseline configuration. Further reductions occurred wit-hflush-head fasten-ars relative to pzotrtuding head fastenerii;attributed to jincreased fastener f.tex;.bility and nspecimnnbending. For tTi_ 19/76/5 layup, chianrtges in specieren width causedchanges in failuxe modes and marked changeii in both strength andlife. However, for the 50/40/10 layup, variationa in width andedge distance did not alter failure modes, and strergth and lifewere virtually unchanged.
Effects of remaining v_4riables on joint fatigue life wereminor, with failure modes and durability essentially .he satme asfor baseline configurations.
4
Ii
Downloaded from http://www.everyspec.com

SECTION III
METHODOLOGY DEVELOPMENT AND ANALYTIC STUDIES
1. 0ACKGROUND - As described in the Literature Survey, analysisof t-ei -omposite joints in aircraft structural componentsthroughout the industry proceeds from overall structural andbolt-load distribution analyses, to assessment of stress distri-butions and strength predictions at individual fastener holesthrough utilization of joint failure analysis.
Methodi currently used to deternine detailed stress distribu-tions in the immediate vicinity of the fastener hole include boththeoretical and empirical approaches. Theoretical approachesinclude analytic, finite element, and strength of materialsapproximation methods. Analytic methods, preferred because oftheir potential generality, economy, and exactness, are princi-pally formulated from two-dimensional anisotropic elasticitytheory. Empirical approaches lack generality at high cost.
Joint failure analyses, in current use, include: (1) empiri-cal approaches, (2) elastic and inelastic failure analyses,(3) phenomenological failure analysis, and (4) fracture mechanicsmodels. Physical variables considered for accurate solutionswere generally agreed upon throughout the industry. However, thedegree to which variables were accounted for was different inparticular methods. No single methodology accounted for all ofthe important variables (e.g. orthotropy, finite geometry, non-linear or inelastic material behavior).
In each joint failure analysis approach, after detailedstress distributions are determined, strength is assessed byusing some material failure criteria; however, no single materialfailure criterion is uniformly endorsed. Studies of utilizationof various material failure criteria for joint failure analysisare very limited.
Detailed stress analysis performed at individual fastenerholes and associated application of failure criteria representsthe primary area of analytic development in this program. Themethodology developed requires only unidirectional materialproperties and minimal laminate test data to calculate laminatestrength with an arbitrary in-plane loading. Because the methoduses closed-form solutions, parametric studies are easily andinexpensively performed.
2. METHODOLOGY DEVELOPMENT - The goal of the methodology develop-ment. was to provide a technique for predicting the strength of ananisotropic plate with a stress concentration. A closed-formanalytic approach was developed to predict stress distributionsand perform failure analysis of an anisotropic plate with aloaded or unloaded fastener hole. This section describes the
5
Downloaded from http://www.everyspec.com

analytical development of the Bolted Joint Stress Field Model(BJSFM). An associated computer program is described in Volume3.
The method of analysis is based on (1) anisotropic theory ofelasticity, (2) lamination plate theory and (3) a failurehypothesia. The principle of elastic e, uperposition is used t:obtain laminate stress distributions due to combined loadings ofbearing and bypass (Figure 1). The leveloped analysis can beused with various material failure criteria and the failurehypothesis to predict laminate load carrying capability.
T - -- --
Problemr•InttmtUlZ)e Ol addHoeOnly
Flgut. 1. Suputpcehmdtn of Llnear-Elastkc Strses Solutions
0 01
The elastic solution for the stress field in a homogeneous,anisotropic infinite plate with a stress concentration was solvedusing two-dimensional anisotropic theory of elasticity (Reference3). Equilibrium and compatibility requirements a~e satisfied bya stress function, F, which satisfies the generalized biharmonicequation for anisotropic materials,
a4F __4F __4
2S6+ 21 + $66
$22 Ed4 263 Iy 1X 2 M2
_4_ a4F
~l6PaxaY' U
04W&
Fgr 1.L': SI.ipsto of IIewEa i Stres Solutions..
Downloaded from http://www.everyspec.com

I
wher,- Sjk are laminate compliance coefficients. The generalexpresafion for the function F depends upon the roots of theassociated characteristic equation. Solving the characteristicequation yiel(s a set of complex conjugate roots (RI, RA, R2 ,R2 ). The stress function can be expressed as
F - 2Re {F 1 (Z) + F 2 (Z 2 ))
where Fl(ZI), F2(Z 2 ) are analytic functions of the complex coordi-nates Z1 = X + RIY and Z2 X + R2 Y respectively. Introducingthe functions
aF(Z1 aF(Z)
lZ = (z1 I __2(z2 az2#2
general expressions for the stress components are obtained:
Ox= 2Re {R I O (Z ) + R 2 O (Z 2 )1
C, = 2Re {1 j (z 1 ) + 4 ý (Z 2 )1
Oxy -2Re {R 1 i (ZI) + R2 ; (Z 2 )}
Superscript primes represent derivatives with respect to the com-plex arguments. Displacements, ignoring terms for rigid bodyrotation and translation which in this problem do r~ot affect solu-tions, can be expressed as:
U = 2Re {P •I (zI) + P2 cb 2 (Z 2 ))
V 2Re {Q I I (z 1 ) + Q2 •2 (Z 2 )}
where
2P 1 =SI R1I + S 12 - S16 R1I
P S R2 + S -S R2 11 2 12 16 2
7
• ..2 k.1 Ii l I I Ill l l
Downloaded from http://www.everyspec.com

S22 + S 1 2 RP . S2 6
Q 22
2 + S12 R2 - S2 62
To obtain exact solutions for an infinite platk with acircular hole (loaded or unloadad) and uniform stresses atinfinity, conformal mappinq techniques were used. A mappingfunction was used to map the physical circular boundary ofradius, a, in the Zk plane (k - 1,2) onto a unit circle in the &kpl e. The mapping function is given by
2 _72 a2 k 1,2k a(l - iUV) k = 1,2
The sign of the square root is chosen such that the exterior of ahole is mapped to the exterior of a unit circle.
The above equations contain unknown stress functions *1 (Zl)and ý 2 (Z 2 ). For infinite plate problems with a stress concentra-tion, these functions will have the general form:
cc -M(Z) B Z + A In 1+ AM=I
(Z 2) B2 Z + A2 in2 + E A2 M 2-MM=I
Linear Z1 and Z2 terms are required for a uniform stress atinfinity. Terms with In &1 and In F2 are present whenever theresultant of the applied stresses on the circular boundary arenonzero. Boundary conditions on the circular hole are satisfiedby the AIM and A2M series coefficients.
To obtain the solution for a plate with an unloaded holesubjected to a remote uniaxial in-plane stress field, P, at anarbitrary orientation, a, with the X-axis (Figure 2), the imposedboundary conditions at infinity and on the circular boundaryresult in the stress functions:
8
Downloaded from http://www.everyspec.com

2i
iPa 2 (1-iR1 )i(z)= x1 4(R 1 -R 277
[R2 sin 2a + 2 co 2a+ (2-R 2 a2 J i 0
2 2 2
iPa2 (1-iR2 )
¢2 (z 2) " 4(R 1 - R2 )
R n2a + 2 coo2 a + i (2R sin 2a + sin 2a)][Z2 + 2 -a2 _R2 2 a22 2 22
2 1< 2
y-
900
400
--- 45k)
Ip
Figure 2. Unlaxiafly Loaded Infinite Plate j9
Downloaded from http://www.everyspec.com

7
Only the linear terms and first coefficient of the eummation areused for the unloaded hole solut.ion,
Loaded hole analysis was performed by specifying a radialstress boundary condition varyina as a cosine over half the hole(Tigure 3). Boundary conditions at infinity required to satisfyequilibrium result in stress free conditions since the finitefrorce required to balance the bolt load is applied to an infinite)V.undary. Thus, the lirear terns are not required.
YPR _ PCO$O
Figure 3. Assumned Cosine Bolt-Load Distribution
Since the specified hole loading is not self-equilibratingon the boundary, single-valued displacement conditions areimposed to determine the log term coefficients. The followingset of simultaneous equations are solved for the A1 and A2complex coefficients.
A A 1 + A2 - A2 = Py/2 Yri
R A1 R A + R A2- R A = -P/2 7i
11 22 2 2 X
10
Downloaded from http://www.everyspec.com

2 - + 2 - 2 - S12 Y siC: Px1 R1 R2 A2 2 R 2 2 w S 2 2
S1 P + $26P
A /R A /R + A /R. _/ SI2 x y1 1 2 2 2 2 2 ni S 2 2
'The terms Px and P are net load resultants on the internalboundary in the X anc Y directions respectively.
Expressing the radial stress boundary conditions on the holein terns of a Fourier series and equating the series representa-tion of the solution, the unknown AlM and A2M coefficients areobtained (Reference 4). The resulting expansion can be written
A 1 2 = aPi (I + iR 2 )/[16 (R 2 - RI)]
A2 2 = -aPi (I + iR 1 )/[16 (R 2 - RI)]
for M = 4,6,8...
A A =0IM 2M
for M = 1,3,5...
14M1/ 2 2_AI =-aPi(-l)(M-)/2 (2+i MR )/[-'m,2 (M -4) (R -RI)]lM 2 2 1
(Ni- )/2 2 2A2 M = aPi(-l) (2+i MR)/UIIiM (M -4) (R 2 -R 1 )]
These equations give the complete elastic stress distribu-ti.on in an infinite, two-dimensional, anisotropic material with acircular hole. These solutions are valid only for homogeneousmedia, but are assumed valid also for mid-plane symmetric lamin-ates. Laminate strains are calculated using material complianceconstitutive relations. Laminate compliance coefficients S k arederived using classical lamination plate theory with uniAirec-tional material elastic constants, ply angular orientations, and
ply thicknesses. Assuming that laminate strain remains constantthrou]gh the thickness, sLrains for individual plies along laminaprincipal material axes are calculated using coordinate transfor-mations. Stress distributions resulting from an arbitrary set ofin-plane loads (bearing z bypass) are obtained using the prin-ciple of supcrposition (F 1re 1).
11
Downloaded from http://www.everyspec.com

To account for inelastic or nonlin,-ir material behavior atthe hole boundary, the "characteristic dimension" hypothesis ofWhitney and Nuismer was adapted (Reference 5). Their hypothesisstates that failure of. a composite material with a stress colncen-tration can be correlated with analytical predictio-s of pointstresses at a characteristic dimension from the edge of a stressconcentration (Figure 4).
THEORETICAL STRESS DISTRIBUTION
FAILURE TEST POINT
CHARACTERISTICDIMENSION
0- OR
Figuie 4. Characteristic Dimension Failure Hypothesis
The application of the characteristic dimension failurehypothesis was extended to permit strength predictions for aniso-tropic laminates under general in-plane loadings, without requir-ing extensive laminate test data. To do this, laminate failureis predicted by comparing elastic stress distributions withmaterial failure criteria on a ply-b,,- ply basis at a characteris-tic dimension away from the hole boundary.
Various material failure criteria can be used with the char-acteristic dimension failure hypot'Aesis. Interactive (Tsai-Hill,Hoffnman, Tsai-Wu) and noninteractive (maximum stress, maximumstrain) criteria were evaluated. Failure envelopes for each cri-teria for the same set of graphite-epoxy (AS/3501-6) materialallowables ignoring matrix failure are illustrated in Figure 5.
Finite width effects have a significant influence on thecircumferential stress distribution around a loaded fastenerhole. A superposition of stress distributions from loaded andunloaded hole infinite plate solutions can be used to evaluatethe effects of finite width (Reference 6). In the loaded hole
12
Downloaded from http://www.everyspec.com

analysis, the bolt load, P, is reacted (at infinity) by tensiland compressive loads oi P/2 (see Figure 6). By superimposingthe solution for an unloaded hole under a remote tensile loadingof P/2 (a stress of P/2Wt) the desired loading on the bolt andoverall equilibrium is obtained. The resulting stress distri-but ion gives a good approximation of the state of stress in aplate of finite width but differs from an exact solution in thatthe superimposed normal and shear stresses at the "edge" of theplate are nonzero.
02- ksi
ý-- 30
- +20 -' ,
-- +10
-300 -200 -100 +100 200
S_,o
Tsai-Hil-
Tsai-Wu -20 00
~ HoffmanI
S-Maximum re -40
" •I ý -- Maximum Strain
Figure 5. Failure Criteria Comparison
13
V - -.. f
Downloaded from http://www.everyspec.com

Loaded Hole Unloaded HoleInfinite Plate Infinite Plate
P/2 ti0lt
w - w
PI I
P/2WP/W
SI I I w
P/2Wt P/2Wt
P/2W P/2W P/wt
Figure 6. Superposition of Solutions to Account for FInife Width
This methodology has been combined and incorporated into acomputer program entitled BJSFM. Capabilities are programmed tohandle material anisotropy, general in-plane loadin~gs (tension,compression, biaxiality, shear, bearing), multi-material (hybrid)laminates, and arbitrary hole sizes. Only mechanical propertiesfor the basic lamina (unidirectional ply) are required to obtainstrength predictions. A detailed description of the computerprogram is given in Volume 3.
14
Downloaded from http://www.everyspec.com

I3. PREDICTT'N3 UISING BJSFM APPROACH - Predictions made using the 1BJSkN -ce presented in this section to indicate the scope andflexibility of the developed methodology as well as indicate dataard information pertinent to analysis of bolted joints in compos-ile structures. The predictions shown are not intended to coverall iaminates or loading combinations.
a. Effects of Anisotropy on Stress Distributions - Unlikeisotropic materials, stress concentrations in composite materialsare affected by layup and load orientation. Predicted circumfer-ential Ltress plotted at an unloaded fastener hole boundary withuniaxial bypass loads indicates important differences betweenanisotropic composites and isotropic metals (Figure 7). Layupvariations which change laminate stiffness properties affect holeboundary stress distributions and stress concentration factors;however, metal distributions are independent of their stiffnessproperties. Also, if loading shifts away from principal materialaxes, shear-extensional coupling creates biaxial states of stressin the laminate. Peak stresses no longer occur 90" to load direc-tions and distributions shift. Loaded holes also show the samedependence on layup and load orientation (Figure 8). Thesecomplete stress distributions must be considered to determinefailure load, mode and location of failure initiation ofcomposite materials.
- ------ Isotropic
CompositeY
Y
1_41
50/40/10 Lavup 70/20/10 Layup 70/20/10 Layup0o C = 00o 0 = 450
Figure 7. Circumferential Stress Solutions at Unioadod Holes
15
Downloaded from http://www.everyspec.com

Isotropic material
CompositeY
Y y
_x x
/ /
/
50/40/10 Layup 70/20/10 Layup 70/20/10 Layup0 00 0° o = 450
GP1S.011544
Figure 8. Ciumfetrntlal Stress Solutions at Loaded Holes
b. Hole Size Effects - Hole size effects are also accountedfor analytically. Stress gradients at the edge of the hole varywith hole size and laminate orientation. Smaller diameter holesproduce steeper stress gradients which decay rapidly as the dis-tance from the hole is increased (Figure 9). Applying a failure-riterion at a constant distance from the hole boundary, holesik.-. is accounted for due to the varying stress gradient withhole z ize.
16
Downloaded from http://www.everyspec.com

3.0
1::xO
2.6 00-00-0 0 00
00° ply
2.2-. °× • • .dia
C. FiieWdhEfcs-T vlaiefcso iiego
1.85 di i
0.125 dia •• •••
I
1.0-0 0,02 0.04 0.06 0.08 0.10 0.12
Disctance from Hole Boundary - in. OpIli.0 74
Figure 9. Effect of Hole Size on Stress Distributions
c. Finite Width Effects - To evaluate effects of finite geo-•
metry on stress solutions and establish limits on the accuracy ofinfinite plate solutions, a comparison of BJSFM solutions withfinite element solutions was performed. Two example cases areillustrated: (1) a pure bearing specimen with a width-to-dia-meter ratio (W/D) of 8 and an edge-to-diameter ratio (e/D) of 9,and (2) a pure bearing specimen with a W/D of 6 and an e/D of 3.The results for the first case are presented in Figure 10. Cir-cumferential stresses normalized to the average bolt bearingstress are plotted about the half-circle from directly in frontof the neat-fit bolt (0Q) to directly behind the bolt (1800).The dashed line indicates the infinite plate BJSFM solution, thesolid line represents the BJSFM solution corrected using theDeJong finite-width approximation method, and the triangular sym-bols represent the finite element solution. .- nults shown inFigures 10 and 11 indicate that for an e/D of 9, the BJSFM solu-tions, corrected for finite width, correlate extremely well withfinite element solutions where W/D ratios were greater than 4.
17
| ' , . . . . . . . . . . . . .
Downloaded from http://www.everyspec.com

1.2 -
w/d =81id -S 9
- 0.4 --- ]GBRG .~
A Finite ale;,ient model0 BJSFM - finite plate
- BJSFM - infinite plato
50/40/10 Lay pL
j ~~~~~-0.4 .........
0 20 40 60 80 101) 120 140 160 180
0 LOCATION ABOUT HOLE - DEG
Figure 10. Correlation of Loaded Hole Analysis
1.4__.1 1 1~~
, - BJSFM Prediction
1.2 ) 0 Finite element (,/d = 9.0)
n- • d - 0.25
-x E0/40/10 Layup
E 1.0 NNW.•
•Z P.8-- _ _
0.6 -0 4 8 12 16 20
Width/Diameter - w/dOP15-O1•I46-
Figure 11. Effects of Width on Stress Concentrations
Sensitivity of solutions to small e/D ratios is illustratedin Figure 12 by results obtained for the second case. At an e/Dvalue of 3, BJSFM infinite-plate solutions, approximately cor-rected for finite widths (long dash line), are significant~lyimproved over the original BJSFM-infinite plate solution (shortdash line), but still differ from the correct finite geometrysolution (triangle symbol line).
41.8
Downloaded from http://www.everyspec.com

'e/d = 3
1.2 - - w_
0.8
0.4. BJF fnt wit - -- ,- - - Finite element model0BJSFM - finite width : "
BJSFM - infinite plate
50/40/10 Layup-0.4 -• ,
0 20 40 60 80 100 120 140 160 180
t) Location About Hole - Deg ON 3411 &W
Figure 12. Correlation of Loaded Hole Analysis for Small Edge Distance Cases
d. Characteristic Dimension Sensitivity Study - Various
laminate failure criteria can be used with the BJSFM procedure.To fully evaluate the characteristic dimension hypothesis, vari-ous correlative and parametric studies were performed. A sensi-tivity study was performed to determine the effect of variouscharacteristic dimensions on laminate strength predictions.Loading configuration studies included unloaded and loaded fas-tener holes,
Results for a 30/60/10 layup of graphite/epoxy with unloadedhole sizes of .125, .25 and .50 inch are presented in Figure 13.The Tsai-Hill material failure criterion was used, with strengthspredicted when first ply fiber or shear failure occurred. Eachcurve initiates from a common predicted failure stress levelsince the theoretical stress concentration at the hole boundary(Rc = 0.0) is independent of hole size. Due to stress gradientsaway from the hole boundary varying with hole size, predictedfailure stress levels change with the characteristic dimension.The predicted failure stress curves each asymptotically approachthe predicted unnotched laminate strength with an increasing char-acteristic dimension. These curves indicate that a 10% change inthe characteristic dimension yields a maximum 4% chang, n pre-dicted laminate failure stress for the .125 inch diam, ,,r holeand a maximum 2% change for the .50 inch diameter hole. Also, ascharacteristic dimension changes occur, failure initiation anglepredictions change, as indicated in Figure 13.
19
Downloaded from http://www.everyspec.com

70 100I
,Unotchd LaminateS ro
"c 007575900 Failunt__ 4
60 -. - Initiation Angle 90
i ~ 0=.125--
,50 8
0 0.008 0.016 0.024 0.032 0 0.40 C.80 1.20
Characteristic Dimension, Rc- in. 0pw1§4l547
Flgur; I&3 Effect of Charectedstic Dimension on Predicted Strength30/60110 Layup
e. Biaxial Loading Effects - To demonstrate the utility ofthe Bolted Joint Stress Field Model, a parametric analysis wasperformed to predict interactive effects of biaxiil loads on lam-inates with unloaded fastener holes. Laminate strength, failurelocation and critical plies were pi.edicted for a representativecomposite wing skin laminate.
Figure 14 presents predicted failure stress and indicateschanges in failure modes as biaxial load ratics increase. Loadratios of increasing (NY/Nx) for this tension-tension case pro-vide relief at the fastener hole and laminate strength Increases.Increasing shear load ratios (Nxy/Nx), however, intensify stressconcentration effects at the fastener hole; laminate strengthdecreases and failure modes change from 0* Flies to 45° plies.Figure 15 presents the predinted location at the fastener holeboundary of first ply failure. Significant is the indicationthat at certain biaxial load ratios, a wide arc of the hole bound-ary may become critical. Figure 16 presents strain concentrationfactors for critical plies within the lamirate with respect tothe strain developed under Nx alone.
20
Downloaded from http://www.everyspec.com

55 1-7 00Nxy Ply Fails
-oo,,• 5OpN~ x
Fails
05015
S = 0.250
I 0
CONN,
45
-496'5011 LayuIJ
o0 0.10 0.20 0.30 0.40 0.50
Ny/Nx
FIgure 14. Effect of Biaxial L*)adIng on Predicted Strength
21
Downloaded from http://www.everyspec.com

130 I
46/50/4 Lavup
120 0
- 110
LA.
> ~~~~0.25 -. 0 / .1w.10 ,/ - o1 4-.o• ol '50 Ply
Fails
0C 1001
-9
00 PlyV. ,Fails
0 0.1 0.2 0.3 0.4 0.5N y
Figure 15. Effect of Blaxial Loading on Failure Location ji
22
iU
Downloaded from http://www.everyspec.com

39 ( 03S- 0 N
3.7 ý41!
UL J
xV
Ic ________46/50/4 Layup
v 35
0
00
LO
+45 Ply Faiils
'21 z-
0 0.1 0.2 0.3 0.4 0.5NyV
N x
Figure 16. Effect of Blaxial Loading on Ply Stiain Concentrations
Experimental and analytic studies have indicated that fail-ure locations at fastener hole boundaries shift depending onlayup and biaxial stress states. The BJSFM methodology accountsfor this phenomenon and, further, reveals thc critical nly at thefailure location. Data shown in Figures 14, 15 and 16 show thatfailure analysis must account for all locations around the fasten-er hole, since the critical area is layup and loading dependent.This is best indicated by Figure 15 which shows not only continu-o'is shifts with biaxial loading, but also indicates wide arcs ofthe hole perimeter may become equally sensitive to failure. Thisin(licates the potential errors which can arise by using methodswhich predict laminate failure by referencing unnotched laminatestrength data at "preselected" or "representative" loc-ations onthe hole boundary.
23
L.. ..m... --. . ... - wJ --
Downloaded from http://www.everyspec.com

f. Pure Bearing Strength Study - Strength envelopes are pre-dicted based on ply-by-ply analysis to determine critical pliesand failure initiation location. The results of a ply-by--plyevaluation of strength based on first ply fiber rupture for the50/40/10 layup under pure bearing loads is presented in Figure17. The ply strength envelopes predict initial failure in 90*pl.ies f. - all load directions with relatively constant laminatestrength up to a load angle of 25° and a gradual decrease from25' to 90*. This predicts that while unloaded holes show a pro-nounced sensitivity to off-axis bypass loading, bearing strengthsfor this laminate are relatively unaffected by off-axis loadings.Analytically, this behavior is a direct result of the differencesin local stress distributions resulting from the two loadingi ~ cond it ions.
I,
!• ~ ~32o,0
280
50/40/10 LAYUP
STRESS 20 ,---__5°PLE
KSI " .. /-O L p•--1240
80 ---
0 20 40 60 80 120
STRS DEG OFF PRINCIPAL MATERIAL AXIS
OPI).1PLY)
Figure 17. Effect of Bearing Load Direction on Predicted Strength
24
D OFF P
Downloaded from http://www.everyspec.com

g. Effects of Environment - Effects of environment on lami-nate strength can also be accounted for with the BJSFM analysis.Unidirectional material properties (stiffness and strength), asaffected by an environment, are used to redefine laminate beha-vior. Bearing versus bypass failure envelopes were predicted fora 50/40/10 layup at room temperature dry and at elevated tempera-ture with moisture. For this layup, results indicate that littlechange in predicted strength occurs for high bypass loads associ-ated with fiber dominated modes of failure which are usually notadversely affected by temperature and moisture (Figure 18). How-ever, elevated temperature and moisture do affect matrix proper-ties resulting primarily in lower shear modulus, shear strengthand lower compression strength. The lower shear stiffness causesa redistribution of high bearing stresses to the stiffer 45*plies in compression. This, coupled with decreased compressionstrength, results in fiber compression failures at lower bearingstresses than corresponding RTD properties (Figure 18). Althoughthe failures for this layup initiate in the same vicinity aroundthe hole, different phenomena cause the failures due to changesin material mechanical properties with temperature and moisture.
80
RTD and ETW00 Plies -OCR = 900 PB ---- BypassFiber Critical/ ___
60 - -
c~40
> /--ETW F-RTD
+450 Plies 00/900 PliesOC =c 40OCR 450Fiber Critical Shear Critical
20- _ __ _
0 20 40 60 80 100
Bearing Stress - ksi 0p1S-OI 1B-M
Figure 18. Effect of Moisture and Temperature on Laminate Strength
25
' ~ ~~~~_.Mi•, r .0 'l "- .
Downloaded from http://www.everyspec.com

SECTION IV
TEST DATA EVALUATION
1. METHODOLOGY VERIFICATION: EVALUATION OF JOINT DESIGN VARI-ABLES - TASK 2 - The primary objective of the Task 2 expe~rimentalprogram was to verity developed methodology through strengthtests over a range of bolted composite joint design variables.Test data were also used to provide direction for development offurther improvements in the methodology. The Task 2 Test Matrixis presented in Figure 19.
The selection of test variables was guided by informationgathered under the Task 1 - Literature Survey. Data obtainedfrom earlier MCAIR in-house test programs were identified underthis survey (Reference 1). MCAIR test programs outlined inFigures 20 and 21 were used to supplement the Task 2 experimentaldata. Ten different layups oi the 0°, +45', and 90° family ofply orientations were tested under tension and compression load-ings. Effects of hole size, thickness, countersinking, edge andwidth distances, and joint eccentricity (single versus doubleshear) on the strength of laminates with a single loaded orunloaded fastener hole were evaluated. Specimen configurationsfor unloaded fastener hole and puce bearing evaluations aredetailed in Figures 22 and 23.
These MCAIR data provided an initial basis for the effectsof layup variations on laminate strength for the two bounds ofbolted composite joint load-transfer, i.e., zero bolt bearing(100 percent4 bypass+ strs an tota l load ; trn fir t-hrt'iuh asingle fastener (pure bearing). The availabili.ty c these datapermitted early verification of developed methodology, reducedthe scope of layup variations to be tested, and permitted Task 2experimental efforts to include a more comprehensive range ofother bolted composite joint design variables.
a. Task 2 Test Plan - The effects of 12 design variables onjoint strength were evaluated. Tests were performed at threeenvironmental conditions: room temperature dry (RTD), roomtemperature wet (RTW), and elevated temperature wet (ETW). Envi-ronmental conditions were selected to be realistic with respectto deployment profiles for multi-mission, high-performance super-sonic aircraft. Tests were conducted at an elevated temperatureof 250°F and, when applicale, specimens were conditioned to anequilibrium moisture content of approximately 0.8 percent byweight. All specimens tested at 250°F were held at temperature10 minutes before testing. Specimens were loaded in tension orcompression to failure. In general, a replication of four testswere performed at each test condition.
Hercules AS/3501-6 Type II (ten mil thick) graphite-epoxywas used as the principal material for fabrication of testspecimens. Limited testing was performed using NARMCO T300/5208graphite-epoxy.
26
Z17
Downloaded from http://www.everyspec.com
[ _ _ _ _
ClU
+ >'>I
fs , 0m ot
~~& >F> >> N» »m OocB- i ; c
C2L L2hI!0
_j- __ "0I
Kl Lz caOO@~ -cow0
L-C~
CL
LU LU i lU0
CL C. CL CL CL I.,- >- )CIL
B-B f - -B
ca c
LU B-j LUZVZf LUu
0j LU LUIEca cc -M U
ot C3 0 ~-C , )
LL cn n Ln L
27 0
Downloaded from http://www.everyspec.com

o~11
LU
- ci 4.
z ~ » in- m»a,>RRC_:- C44"
44F , f 5
4.- 6
,, I [ <* . - _ _ _ __a
.- IP SM
.5.L
0L* Il 'mII! ..; xL
-CCI.1c 00
SM IIJ SMSXM M
a-
0 N SU a 4~
Wn 0 m z4-
aoU ____ W _____
_ _ _ _U _ _ _ _ _ _ _ _ @
cm.
Downloaded from http://www.everyspec.com

Laminate % Layers of No. _ Hole Dia. Loadinr N ofGroup 00 +45 900 Plies 0.01 0.125 0.250 0.500 Ten. Com. Tests
A 70 20 10 40 V V V 24B so 40 10 40 V V V V V 24
120 V V 18
C 30 60 10 40 / V V V V V 24
108
S50 10 40 40 V / V V 12E 40, 20 40 40 V VI V/V 12F 40 50 10 40 V V V V 12G 30 30 40 40 IV' IV/V 12H 20 40 40 40 V V V V 121 20 70 10 40 V V 12J 10 80 10 40 V V V V 12
84
A 70 20 10 40 X X X 6B 50 40 10 40 x X X 6
120 X X X 630 60 10 40 X X X 6
30Total No. Tests 222
V Noncountersunk Specimens
X Countersunk Specimens 0Pl13111"iI
Figure 20. MCAIR Evaluation of Unloaded Hole Specimens • Test Matrix
29
Downloaded from http://www.everyspec.com

Phase Layup % Layers No. Hole Die eld wid Single Double TotalNo. No. 0O +450 0o Plies 0 0.250 0.375 0.500 0.250- 1.5 2.0 2.5 3.0 4.0 4 6 8 Sheer Shoat Specinons
1 170 20 10 20 0 V V/ V V V/ •• - 87
TI 2 50 10 40 20 0 V .-- -V- V- V - 9
I 3 50 40 10 20 V V V* 0 N/ V V A 86
1[ 4 40 20 40 20 - V.-V-V- - V - 6
U 5 40 40 20 20 - V . . . .- V-- - V - 6
R 6 30 20 50 20 - V - - - - - V - 6
I 7 30 60 10 20 0 V V V VVVVVVV - 87
R 8 20 40 40 20 -- V - . . -V-V -- V-V - 6
1 9 20 60 2020- - V/- - V V - -V -- 6
HI 1010 80 10 2P - V - . . .- V-- -V V - 6
11 11 55 40 5 20 0 V - - - V V V - -V / - 15
---- 15 92 103 72 36----Total 323
Each test replication of 3 0P13-0115.121
Countersink
e Baseline STwo specimens in double shear
Figure 21. MCAIR Evaluation of Loaded Hole Specimens Test Matrix
11.000 in
d ' J.500T
0-/ 3.000 in.900 _.1i
_ _d = 0.250
F 00 -/ 1.500 in.1900 _j_
d = 0.1251
0- 00 O_____- --___ 0.75 in.
40 Plies 2000 T0.375 in.
&---0 Strain Gage
Figure 22. Unloaded Hole Specimen Geometry
30
ip
- t9 -' - i4'
Downloaded from http://www.everyspec.com

eI
90° -- \--
450
Strain Gage
PTest Specimen Bload
Figure 23. Loaded Hole Specimen Configuration
4
Four test specimen c:onfigurations were used: (1) a single-bolt pure bearing specimen, (2) a baseline two-bolt-in-tandembearing-bypass specimen, (3) a two-bolt load interaction specimenand (4) a four-bolt fastener pattern specimen. Both single andtwo-bolt-in-tandem specimens were loaded in either a single-shearor double-shear configuration (Figure 24). All specimens werestrain gaged. Recorded data included: failure load and strain,continuous load versus strain plots to failure, selected loadversus deflection plots to failure, thickness, width, hole diam-eter measurements, weigh- gain of humidity exposure specimens,and selective photographic documentation of failed specimens.
31
Downloaded from http://www.everyspec.com

(a) Double Shear Face Configu ration
0.025 Max Gap
Strain G ageSt
e
P I Load --- PkClevis J
Graphite/EpoxySpecimen
0.025 Max Gap
(b) Single Shear Fac. Configuration
-Graphite/Epo'y Specimen
fSteel Load Block
OF13-OlI1-4t
Figure 24. Specimen Loading Configura\)Ions
Prior to specification of load-clL. ge. metry (thickness,width, and material), a parametric study was pe4rformed to evalu-ate the effect of clevis-to-laminate stiffness ratios on loaddistributions for the baseline two-bolt-in-tanlem joint. Tbeobjective was to quantify the errors in load dio-tribution whichcould arise due to material stiffness variability. This wou.Id,in turn, provide a theoretical data base to aid in selection oiload-clevis geometries and material. The re,3ults of this studyare presented in Figure 25. Based on theke results, a loadclevis-to-laminate stiffness ratio of 10 or more was selected.This choice results in unequal bolt loads, but c'uarantees that nodistribution error greater than 0.5 percent sh-uld o.cur due tolaminate stiffness variations expected from specimen to specimen.
32
iJ
Downloaded from http://www.everyspec.com

P1 P2
.TotaI _,__ Tota,S~Clevis
Laminate
Load Clevis Stiffness Bnlline - 0 - 10
Specimen Stiffness Fraction of Total Load
0.6 Layup P1 P2
30/60/10 0.442 0.55850/40/10 0.457 0.54370/20/10 0.465 0.535
0.5
S"-ý-10 (Baseline)I- 0.4
0..0
0.3
30/60/10 50/40/10 70/20/10
0.2 f0 4 8 12 16 20
Ex - Laminate Stiffness Specimen - (106 psi) I P14k116.M
Figure 25. Edfect of Laminate Stiffness on Specimen Boll-Load Distributions
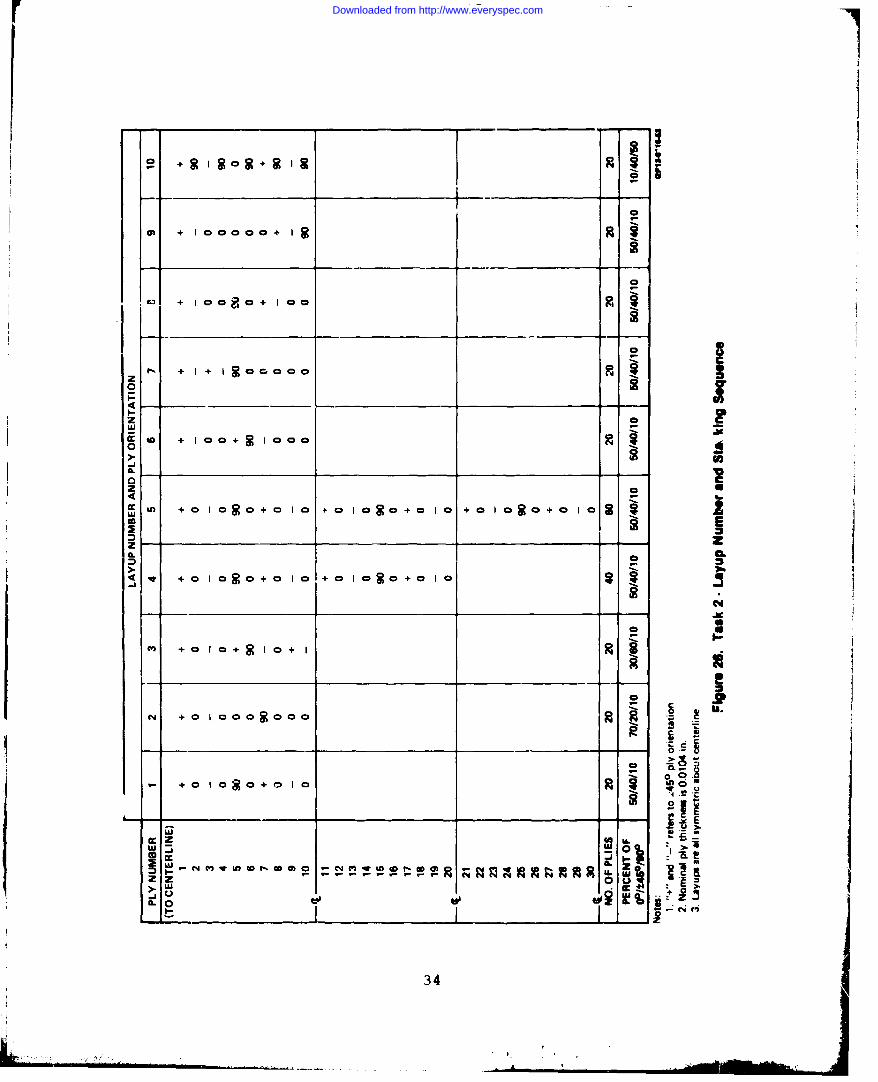
Individual test specimens were fabricated from 19 panels.Stacking sequences are detailed in Figure 26. Panels were cut,collated, and cured per standard MCAIR process specification.Al!. specimens were tested to static failure according to Figure19 under tensile or compressive loadings. Complete details ofall procedures, test results and support requirements arecontained in Volume 2 of this report.
33
__..p. •
Downloaded from http://www.everyspec.com
a0 + Io00c0+
,, + I ISO0 Q ICCzS20
z
Cc + 1 00+ 10coo
2C.2
+0 la~oI +0 1080+0 IC +01080+0 lgo V
2- z
z ooooo~ i ~ ~ ~ a0
4L_ _ _ _ _ 06__ _ _ -j
~0_ _ _ _ _ _ _ _ _ _ _ _ - to
uJr
~ -NI~w~a~-0>9L ~ .E
34j
Downloaded from http://www.everyspec.com

b. correlation of Ik7SFM Predictions With Ex erimentalResults luu G.. Ctlit UumnhIpres experimental
results ol-tained under Task 2 and predictions using the BJSFM.
Where IRJSFMl/test correlation was not possible, data trends are
?or aninitMiXlveriicaionof he JSF i-rccedur fo th cae o anunloaded
fastener hole. Using the IV.SFM procedure, strength predictionswere made for all test layups and teati conditions. Lamrinate elas-tic properties were calculated using unidirectional ply laminaelastic constants. Laminate failure was assumed to occur whenfirst ply fiber or shear failure w'as predicted, based on the Tsai-Hill or maximum strain material failure criterion applied at acharacteristic dimension away from the hole. Only laminajstrength and stiffness data were required for this analysis;these data are shown in Figure 27. RTD data are average valuesobtained fromi MCA1R tests performed on unnotched unidirectionallaminate sandwich beams, arid 0*/9Q@ rail-shear specimens; RTWand ETW data are estimatod.
Poete;ROOM RT Wet 250OF WetTemperature IMstimsaed)*11 (Estimafted)**
Elastic Constantsfjis Eilt(106 psi) 18.85 18.85 18.54
"* Elc (106 psi) 18.20 18.20 17.80
" E2 (10'P psi) 1.90 1.72 1.27
* 12 (06 psi) 0.85 0.77 0.60
120.30 0.30 0.30
" f 1t (pin./in.) 12,206 12,206 12.735
"telu (pin./in.) 176012,6948, 6
"a ~t (pin/in.) 5,380
* 712 (pin./inj* 20,352 22,470 18,461is F 1tu(ksi) 230 230 236
e Ficu (ksi) 321 231 151
is F2tu (ksi) 9.50 -
0 F2cu (ksi) 38.90 35.20 26.00
to F 1 2 (ksi) 17.30 17.30 11.00
'Based on linear-elastic behavior GPSSIIS1-ttS-Approximately 0.86% moisture
Figure 27. A5/3501-6 Lamina Mechanical Properties
35
Downloaded from http://www.everyspec.com

Correlation of predicted tensile strerg9th with test datifrom ten layups is shown in Figure 28. Currelation of predicte.ieffects of hole size on laminate tensile strength with *-eat datais shown in Figure 29. For the AS/3501-6 material system, a char-acterietic dimension (Rc) of 0.02 inch was used for all tensilefailure analysis. This value was obtAineti b, comuparing .250 inchhole-sire strength data from the 50/40/10 laminate with predic-tions, as illustrated in Figure 30.
-- Theoretical * Test data A Predicted
120 I~~~Rc 0.02 in.
100 -- %0 0 Plies
90/
080
0D 20 60 60 8 10
b
S6040'U.I
3x 400I10
20
0!
% ± 450 Plies OpIzt..
Figure 28. Effect of Layup Variation on Unloaded Hole Tensile Strength
36
Downloaded from http://www.everyspec.com

180II ' -- Ifstu4Uiross d
160 1 1"
140g
"__I I-~120 -- Predicted
S 100
J .x 8 0 7 0 / ' -2 0 / 1 0 10 )4 X
LLI
60 --
SI-- Wi/40/1 0 fA
40 • • •J
! ~30160/10 10)
20 "
14,000
12.000
.~10,000 -__
0.250 CSK
I AverageM ' U Hole Size(n 8.000
6,000 --- 70/60/1
4,000
2,000-0 0.1 0.2 0.3 0.4 0.5 0.6
Hole Diameter - in. Qp Ml.5Iw
Figure 29. Effect of Hole Size on UnIo6ded Hole Tensile Strength
37
i! . ...... ... ~ ~~j . ,. .....- ,.
Downloaded from http://www.everyspec.com

72 , I
Rc -d 0.250
FtU-
p66
./ -- Predicte0~ I
S64 - -U-
62 --
0.02 Value of R. Usedin All Tension Analysis
58|
0.015 0.017 0 .019 0.021 0 .0 2 3 0.025 0.027
Characteristic Dimension, Rc - in.
Figure 30. Effect of Variation of Rc on Predicted Tensile Strength
Location of failure initiation depends on layup and holesize. Predicted failure location occurred on the hole boundaryand at 90* to the applied load direction for all but two cases.The exceptions are the 70/20/10 layup with 0.250 or 0.500 in.diameter holes. Predicted origins of failure were at 65* for the0.250 in. diameter hole and 70° for the 0.500 in. diameter hole.in these two cases, failure was predicted in the +45* plies. Allpredicted locations of failure correlated visually with test data(e.g., Figure 31).
38
Downloaded from http://www.everyspec.com

(30/60/10, 0.500 in. Dia Hole)
700/j
(70/20/10, 0.500 in. Dia Hole)
Piedicled f-jilure Ore,)jIjl~jl GPIe-Ot.117
Figure 31. Predicted Failure Orientations Were Verified
!ýtrength predictions for a biaxially loaded laminat., with anopen fastener hole were also verified by test. This loading con-dition was achieved with uniaxial. loading at various angles rela-tive to the laminate principal material axis. Due to orthotropicmaterial hehavior, off-axis uniaxial loading causes shear-exten-sional coupling which produces a biaxial stress state in the testspeciiilen gage area. Using the 0.02 in. characteristic dimension,correlation of tes;t data wit]h predictions is shown in Figure 32.
A characteristic dimension of Rc = .025 inch was used forall compressive failure analysis. As in the tension case, Rc wasinitially determined using only .250 inch hole size strength dataobtained from tests performed on the 30/60/10 laminate (Figure33); however the final value of .025 inch was based on a best fitof all hole-size strength data for the 30/60/10 layup. Predic--tions and test data on the effects of hole size on compressionstrength for this layup as well as the 50/40/1) and 70/20/10layup are presented in Figure 34. A carpet plot of compressivestrength predictions for all ten layups of Figure 20 is corre-lated with test data in Figure 35. Test data and predictions arefor the open hole, .250 inch diameter, specimen configuration.
7\ preliminary evaluation of the effects of temperature oncoMpressive strength of laminates with .250 inch diameterunfilled fastener holes was also performed. Three differentlaninates were tested at room temperature and 250°F. Using theBJSFM procedure, strength predictions for both room temperatureand 250°F wJere based on a constant characteristic dimension of0.025 inch and the Tsai-Ilill Failure Criterion. Correlation of
39
Downloaded from http://www.everyspec.com

60-
. __Rc = 0.0250 -48/48/4 ,AYUP-
w/d = 6
Fu 40FAILURE __REDICTED
STRESS 30
KSI 00 PLY REF
2 0 F ( ) _ _ _ _ _
10 d 0.250 F0
0 10 20 30 40 50 50 70 80 90 100S- LU AD ORIENTATION - DEG
Figure 32. Effect of Off-Axis Loading on Failure Stress
40
Downloaded from http://www.everyspec.com

-66_
0.025 Value Used for IAll Compression Analysis
-642, I¶
d = 0.250 Data I-• Predicted•x -60 4LL
2 -58_= •e" 30/60/10 Layup
KY
u. .0Rc 0. 0d7 0 0.250
Chrateisi Dies, R x-in
IN -54 1S~00 Ply Ref
-521 1i0.019 0.021 0.023 0.025 0.027 0.029 0.031
Characteristic Dimension, Rc - in.
Figure 33. Effect of Variation of Rc on Predicted Compressive Strength
41
___ ___ I
Downloaded from http://www.everyspec.com

-180 I I 2
Sso I
Cu u
-140 x 6d
LL 120
-100
S10/20/1
-80 __ 04/bA
Hole Diameter in.
20,000 T
18,000
n Prediction
16,000 .
c!14,000 -
70/20/10 WeightedFgr 12,000 e or Hole Size t
x for 0.250 Csk
r
..... .,,- 50 .../10g - -'T--- 0 0.1 0.2 0.3 0.4 0.5 0.6 0.7Hole Diameter - in. PIM
Figure 34. Effect of Hole Size on Unloaded Hole CompreSSIve Strength
42
Downloaded from http://www.everyspec.com

Theoretical 0 Te%t Data A Predicted
120 % o o 'ie ,
90• •r = 0.025
'ioo ~80 _______1007
1 8 7060
"* 80050
0 60
U 40U_
01
0 20 40 60 80 100% +450 Plies
GPI"11t -101
Figure 35. Effect of Layup Variation on Unloaded Hole Compressive Strength
test data and predictions is illustrated in Figure 36. Resultsindicate that effects of enemperature on unloaded hole laminatestrength for a wide range of layups can be satisfactorilypredicted by using the BJSFM procedure with appropriatetemperature-corrected values of lamina elastic constants andlawnina strengths.
For all test conditions, compressive failure modes of openhole specimens were similar. Laminate material in the net-section area "broomed-out" symmetrically about the thicknesscenterline, typical of compressive failures in unnotchedlaminates.
Failure initiation points were predicted to occur on thehole boundary 85-90' frow the specimen length axis in all but thehighly orthotropic layups. For these latter layups (70/20/10 and50/10/40), failure initiation points were predicted to occur at1250. However, due to extensive laminate compressive damage, vis-ual verification of failure initiation points was not possible.
43 4~- 4~-
Downloaded from http://www.everyspec.com

IISw
SxCU d =0.25xCU
180
i 80 50/4b/10
Rc = 0.025 in.
"-60 Test data.42/5 0 Predict3d
LL w/d =640f-m=
20/60/20
T
0 50 100 150 200 250 300
Temperature - OF
Figure 36. Effect of Temperature on Unloaded Hole Compression Strength
(2) Strength of Laminates With Loaded Fastener Holes -In the Task 2 test matrix (Figure 19), evaluations of boltedcomposite joint strength can be sub-grouped under four studies:(1) effects of orthotropic mechanical properties, (2) effects ofjoint geometry, (3) effects of loading and fastener patterninteractions, and (4) effects of through-the-thickness variables.A baseline 50/40/10 layup and joint geometry (single or twofastener-in-tandem confiquration) detailed in Fiqure 37 is usedthroughout the Task 2 test program as a reference point. Detailsof specific specimen geometries are shown in Fiv,•res 38, 39, 40and 41.
Evaluation of effects of orthotropic mechanical propertiesincluded layup and load orientation variables. Effects of lami-nate variations (70/20/10 and 30/60/10 layups) on joint strengthwere compared to the 50/40/10 baseline strength data for the loadcondition of bearing and bypass loads aligned with a principalmaterial axis. Effects of bearing load, off the principalmaterial axis, on ultimate bearing strength were evaluated forthe 50/40/10 layup under pure bearing loadings. As-manufacturedand moisture conditioned specimens were tesCed in tension andcompression at room temperature and 250 0 F.
44
Downloaded from http://www.everyspec.com

15.00 -1.000---- - - 0.750
;" , I,,, I, ,, p o 1.500I I /
SS G d0 2 +0.0022 _/0 Strain Gage -0.0000 20 Plies
Notes: TLaminate: 50/40/10 LayupStacking Sequence: [+450, 00, -450, 00, 900, 00, +450, 00, -450, 00]sThickness (t): 0.208 in. Nominal (20 Plies)Fastener Type: ST3M 453-4 (0.2495 + 0.0000/-0.0005 in. dia)Torque Value: 50 in.-Ib (1/4 in. Fastener)
Load Configuration: Double-ShearOPI"-116-47
Figure 37. Two-Bolt In.Tandem Specimen Baseline Configuration
45
,,I
Downloaded from http://www.everyspec.com

15.00-3.50-
wi
S--I --- i
Cut Off and d0G Strain Re-Drill for tNext Test-
II 1 .
Design w e dVaribleVariations w __________Variable (in.) (in.) (in.) Plies in.
Load Oreintation All 1.50 0.750 0.250 20 0.208
Countersink (h/t) 1 2.25 1.125 0.375 20 0., j8(h/t) 2 2.25 1.125 0.375 40 0.416(h/t) 3 2.25 1.125 0.375 60 0.624
Single Shear Baseline 1.50 0.750 0250 20 0.208(Protruding Hd) e/d 1.50 0.500 U 0.250 20 0.208
w/d 1.00 0.750I 0.250 20 0.208 Jd 2.25 1.125 0.375 20 0.208
Stacking Sequence A:: 1.50 0.750 0.250 20 0.208
Fastener Torque All 1.50 0.750 0.250 2C 0.208
Thickness t1 2.25 1.125 0.375 40 0.416t 2 2.25 1.125 0.375 60 0,624
OP1lC-11546
Figure 38. Variations of Single Fastener Specimen Configurations
4.6
Downloaded from http://www.everyspec.com

- 15.00
-,---- 3.50 S-" e
-400 Strain Cut Off and / --d
Gage Re-Drill for tNext Test r i
Disgn Vaitos w & d S t
Variable Variations (in.) (in.) (in.) (_r.) (in.)_
Layup All 1.500 0.7500 0.2500 1.500 0.208 j
Edge Distance (e/d) 1 1.500 0.3750 0.2500 1.000 0.208(e/d) 2 1.500 0.5000 0.2500 1,000 0.208(e/d) 3 1.500 1.0000 0.2500 1.000 0.208
S1 1.500 0.7500 0.2500 0.500 0.208S2 1.500 0.7500 0.2500 0.750 0.208
Widxh (w/d) 1 1.000 0.7500 0.2500 1.000 0.208
(w/d) 2 1.250 0.7500 0.2500 1.000 0.208(w/d) 3 2.000 0.7500 0.2500 1.000 0.208
Hole Size D1 1.137 0.5685 0.1895 0.758 0.208D2 2.250 1.1250 0.3750 1,500 0.208D3 3.000 1.5000 0.5000 2.000 0.208
Single Shear All 1.500 0.7b00 0.2500 1.000 0.208
Fastener To'que All 1.500 0.7500 0.25U0 1 1.000 1 0.208
OP13-0115.45
Figure 39. Variations of Two-Bolt-IWn.Tandem Specimen Configurations
47
Downloaded from http://www.everyspec.com
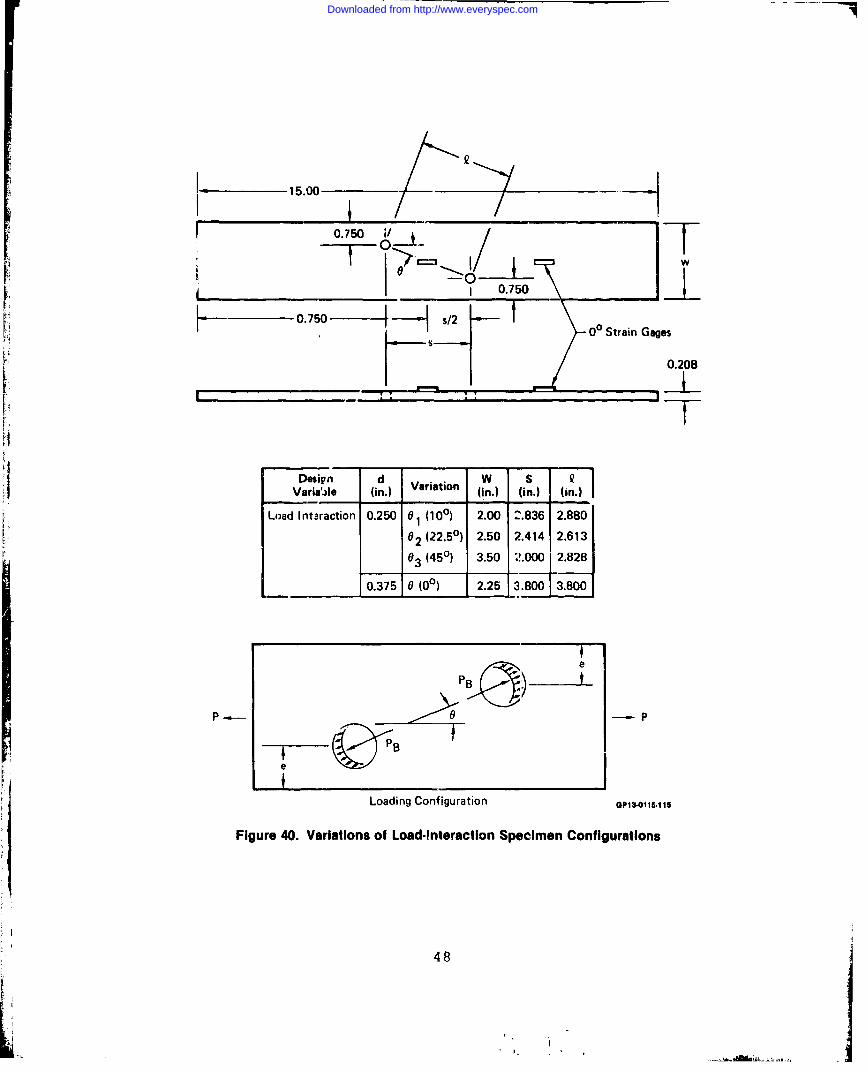
15.00
0.750/T
V ~0.7501
s00 Strain Gages
0.208
[I_ ;; -Vl
Design d W S
Variaale (in.) Variation (i.) (in.) (in.)
Load Intaraction 0.250 01 (100) 2.00 2.836 2.880
02 (22.50) 2.50 2.414 2,613
0 (450) 3.50 2.000 2.828
0.375 0 (00) 2.25 3.800 3.800
P0 P
Loading Configuration 0P151W5
Figure 40. Variations of Load-Interaction Specimen Configurations
48
,=8 p.
Downloaded from http://www.everyspec.com

n o 1.000 2.500
3.50 - 1.000 0.750
-- 7.50
____ ___ ____ ___ ___ ____ ___ ___ ____ ___ji 0208
GPIS.•IO11-6
Figure 41. Fastener Potterm Specimen Geometry
In the second group, effects of joint geometry, joint vari-"ables evaluated include edge distance (e), width (w), and hole-size (d) for the 50/40/10 laminate. Specimens were tested intension at room temperature dry and selectively at 250*F aftermoisture conditioning.
Studies of loading and fastener pattern interactionI. involved: (1) evaluation of the effect of bearing stress on
laminate bypass strength and (2) evaluation of stress concentra-tion interactions in multi-fastener patterns. Bearing-bypassinteractions were evaluated for two layups (50/40/10 and 30/60/10) with bearing and bypass 2oads aligned with the 0* principalmaterial axis and, for the 50/40/10 layup, when bearing loadswere oriented at 100, 22.50, and 450 relative to bypass loadswhich were parallel to a principal material axis. Four-boltspecimens were used to evaluate the interaction of fastenerstress concentrations for two layups (50/40/10 and 30/60/10) andwere tested selectively in tension and compression at room temper-ature and 250°F after moisture preconditioning.
49
- -k - .,-._ • .
Downloaded from http://www.everyspec.com

Five through-the-thickness joint variables - (1) torque-up,(2) single shear (joint load eccentricity), (3V laminate thick-ness, (4) countersinking fasteners, and (5) stacking sequence -were evaluated to determine the possible three-dimensional inter-actions at individual fastener holes. Single-fastener purebearing and two-fastener bearing plus bypass specimens weretested in tension and compression at room temperature dry condi-tions. Selective tests were performed at room temperature and250°F with specimens moisture preconditioned. Strength data werecompared with the baseline joint configuration.
(a) Layup Variation - Effects of layup variation onlaminate bearing strength were evaluated using the two-fastenerin-tandem specimen. Three layups (70/20/10, 50/40/10 and30/60/10) were tested in tension and compression. Tests wereperformed at RTD, RTW, and ETW. Results of all tension tests arepresented in Figure 42. Results of all compression tests are pre-sented in Figure 43. In both sets of data increases in grossfailure strain were linear with increases in percent of +450plies contained in the layup. Parallel trends were oserved formoisture conditioned specimens tested at 250°F (ETW), withstrains genezzlly lowered by 800-1000 win/in for all layups bothin tension and compression. Specimens of the 50/40/10 layup,which were moisture preconditioned and tested at room temperature(RTW) exhibited little strength changes. Associated ultimatebearing strengths reflected similar trends between RTD and ETWdata with approximately a 30-40 KSI loss in bearing strength forall layups tested at ETW.
Associated joint load-deflection data indicated thepresence of nonlinear mechanical behavior. Predictions, usingthe BJSFM procedure, and joint loads at which initial nonlinear-ity occurred are also presented in Figure 42 and 43. Predictionswere based on the previously determined Rc values of 0.02 inchand 0.025 inch for tension and compression respectively.
(b) Load Orientation - Effect of material ortho-tropy on pure bearing strength was evaluated using a single-fastener specimen fabricated at various angles off the 0°principal material axis. Specimens were tested selectively atroom temperature dry and at 250'F after moisture conditioning.
Strengths at room temperature dry conditions are presentedin Figure 44. Included are bearing stress values at which ini-tial nonilinearities or abrupt changes were observed in jointload-deflection data. All off-axis test specimens were loaded indouble-shear with fastener torque-up of 50 inch-pounds. BJSFMpredictions indicate first ply fiber rupture or shear failure,based on a maximum strain failure criterion applied at a charac-teristic dimension of 0.02 inch away from the hole boundary.Correlation of this linear-elastic analysis with initial pointsof nonlinear joint deflection behavior, indicates that laminashear or fiber failures are likely before ultimate bearingfailure occurs.
50
L I
Downloaded from http://www.everyspec.com

I I Double-shear
"Gr3~oss 4d 3d Ultimate failure
F 50 in.-lb Torque-Up 0 Inlitial nonlinearity
160
120
.0 xPred.cted
40 _______ ___ ____________
6,000 30/60/10
'000
Ci
* 2,000
702/0 20 4Predicted
60 80to
Percent of 1450 Plies
OP13-O 115-340
Figure 42. Effect of Layup Variation on Joint Tensile Strength
51
Downloaded from http://www.everyspec.com

d -,0.250 -
-IIPTotal 6dI P2
XGross 4d 3d
50 in.-lb Torque-Up U 0 A Ultimate strength
Double-Shear 0 A Initial non-linearity170
130-
• •, f •ETW
U-
90/
50"
- 7 ,000, ra I
C -J
__-__--5,000 PredictedS-5,000 -
IIl.0.0,
--1,000,
0 20 40 60 80 100
Percent of ±450 PliesCIP13-0115,44
Figure 43. Effect of Layup Variation on Joint Compressive Strength
52
j
Downloaded from http://www.everyspec.com

d = 0.250-\ Double-shear
0 Vo•\N - _T 50 in,-Ib torque-upP 6d 0 Oin.-lb torque'up
0 [0 Initial nonlinearity
50/40/10 layup3d
160,
40
Figu ein.Shenr Faitinr Shte re
80
ditioned ~~ reiced spcmesat20e.Thoe ictlped:cin tbt T0 20 40 60 80 100
Off-Axis Loading Angle, 0i - deg a P13-0115i-
Figure 44. Effect of Off-Axis Loading on RTD Pure Bearing Strength
Strength of moisture conditioned specimens is presented inFigure 45. Trends appear to be similar to RTD results with joint.gross failure strains reduced by approximately 700-1000 kimi/ inand bearing strength by approximately 40 KSI in the moisture con-ditioned specimens at 250*F. Theoretical predictions at both RTDarid ETW are indicated in Figure 45, versus strain data for ini-tial. points of nonlinearity. Both ETW and RTD prediLctions werebased on the .02 inch v~ilue of Rc. Results from off-axis lcidingat 100 under compression loading ara presented in Figure 46.
53
pI
Downloaded from http://www.everyspec.com

200 __
A * UUltimate0 0 Initial nonlinearity -
6d160---
50 in.-lb rorque UpDouble-Shear 3
RTD3
120-0XT W
80
40 ____
6,000
5,000 T D
4,000
Predicted RTD
2,01050
1,00 woo___ \ Predicted ETW
0 20 40 60 80 100 120 140
Off Axis Loading Angle, 0 -deg OI164
Figure 45. Effect of Temperature and Moisture on Off-Axis Strength
54
Downloaded from http://www.everyspec.com

P p1 6d_ •
bl, Initial cuTest Condition x Nonlinearity _ _ X
50/40/10Layup ksi Prcent A ksi Percent A Z an./in. Percent A
of IRTD of RTD of RTD
RTD 153 - - -2,640 -
RTW 157 +2.7 122 +10.4 -.2,830 +7.3
ETIW 113 -26.3 76 -3.8 -1,980 -25.11J
OP130115.42
Figure 46. Effect of Temperature and Moisture on Compressive Strength
(c) Edge Distance - Effects of edge distance on
joint: strength were evaluated by testing two-fastener-in-tandem
double shear specimens. Tests were performed on dry specimens at
room temperature and on moisture conditioned specimens at 250°F.
3pecimen.-, were loaded to failure in tension. Additional RTD data
on the effects of edge distance on pure bearing (single-fastener)
streorgth were available from an earlier WCAIR in-house program.
Results of RTD and ETW tests are presented in Figure 47.
Specimen failure modes at all e/d ratios exhiLited shearout tobearing-shearout failures. Joint bearing strenoth and gross
failure strain data exhibit a marked bilinear behavior. Reduced
joint strength with earlier insensitivity to e/d ratios was
exhibited in the ETW tests.
55A
Downloaded from http://www.everyspec.com

d 0.250\
P 1 + P2 I -d
50 in.-Ib Torque-Up x 4d e
160i RTD
120 .TV
C,,
80
40
5,000
RTD
4,000
S'• __ ETW -
3,000
2,000
1,0000 1 2 3 4 5
Edge Distance/Diameter , e/dOP134-11E-40
Figure 47. Effect of Edge Distance on Joint Tensile Strength
56
Downloaded from http://www.everyspec.com
Effects of fastener spacing (S) on joir.t strength wereevaluated at RTD test conditions. Results (Figure 48) indicatethat for high-bearing to bypass joint loadings, strength reduc-tins occur as S/d ratios decrease from 4.0 to 2.0. Whilefastener spacing creates a beneficial "shadowing effect" at thern '.-section on stress concentrations, this is not the case in1, gh bearing-to-bypass multi-fastener joints where bearing orshearout failures prevail. The proximity of adjacent fastenerholes acts like an edge-of-part to internal fasterner holes,reducing bearing strength capability and overall laminate straincapability.
Single fastener (pure bearing) joints were tested in single-shear at RTD for edge distance/diameter values ranging from 1.5to 3. Effects of torque-up (30.0 increased to 50.0 inch-pounds)are reflected in a 25 KSI increase in bearing strength (Figure49) for the e/d ratio of 3. The stacking sequence used in thesetests was identical to the number 6 stacking sequences of Task 2(Figure 26). The increased strength of the more homogeneousstacking sequence (number 1) is also indicated in Figure 49.
(d) Width - Effects of width on joint strength wereevaluated using the 50/40/10 laminate in a two-fastener-in-tandem double-shear configuration. Specimens were tested tofailure in tension at RTD and ETW. Results are presented inFigures 50 and 51. For RTD tests, specimens failed in the netsection at the lower w/d ratios of 3 and 4, and failed in bearing-shearout at the w/d ratios of 6 and 8. Effects of temperature(250 0 F) and moisture content reduced strengths markedly at thehigher w/d ratios but not at the lower w/d ratio of 4. Thisdecreased sensitivity reflects a transition to fiber dominant net-section failures which are insensitive to effects of moisture.Failures for RTD specimens occurred in bearing-shearout at w/dratios of 6 and 8 and transitioned to net-section at w/d ratiosof 4 and 5. Decreased shear and compression properties at ETWconditions caused bearing-shearout failures at all but the lowestw/d ratios. Typical failed specimens are illustrated inFigure 52.
(e) Hole Siz2 - Effects of hole size on jointstrength were evaluated using the two-fastener-in-tandem double-shear specimen. Specimens were loaded in tension to failure atroom temperature. Strengths are illustrated in Figure 53.Bearing strength and gross joint failure strain trends variedlinearly over the range of hole sizes tested; however, all torque-up values for these tests were maintained at 50 inch-pounds. Thetriangular •yrrbol in Figure 53 indicates the increased strengthof joints with 160 inch-pounds of torque-up. This indicates areduced sensiitivity to effects of hole-size on joint strengthwhen fastener torque-up values are increased. Predicted jointstrengths for a nontorqued configuration are also presented inFigure 53. All specimens failed in bearing-shearout, regardlessof hole size.
57
Downloaded from http://www.everyspec.com

k-s--s--i d- = 0.25
P1 + P2 --- P2- --4!1. i
50 in.-Ib To'que-UpDouble-Shear
180
0,U • • ~ S = .75--• _•• •
SS= 0.50
.' 100
. . . . - Prediction
t601
* A n UltimateO A 03 Initial nonlinearity
N 50/40/10 layup
t 3,000 ___"-
2,000
2 3 4 5
Edge Distance/Diameter - e/d
Figure 48. Effect of Fastener Spacing on Joint Tensile Strength
58
LmLmmmmm
Downloaded from http://www.everyspec.com

d 0.375-
(I50/40/10 layup- I . Baseline stacking sequence (no. 1)Ct A A@ Stacking sequence no. 6X 3d
160
4L
120nxLL
Ci)
.E 80
40'•3,000
C • Double-Shear
"• 2,000
nx Single
1,000
0
1 2 3 4 5
Edge Distance/Diameter -e/d OPI"115-37
Figure 49. Effect of Edge Distance on Pure Bearing Strength
59
'St
Downloaded from http://www.everyspec.com

S--I_
d 0.250-
~Tota --e 6d -
Double-Shear
50 in.-lb Torque-Up 4d 3dS~160 -
L~i Net SectionS~~~Failure Mode--\ = z
_Bearing/Shearou:
120 Failure Mode120
U o
• J * Ultimate strcngth
o Initial n~onlinearity
40 10
Width/Diameter, w/d a•.~-
Figure 50. Effect of Specimen Width on RTD Joint Strength
60
(nto
tm 1100
Downloaded from http://www.everyspec.com

Pi + P --we 6de I d- ,5 -
50 in.-lb Torque-Up 4d 3d
160 ,---RTD Bearing
RT Nt Shearout FailureF I r o N e t . l [ " "
Section Failure
v4'N 120.0 x --*• -.. 1S.......... .
-- - ETW
4C
6,000
5,000 . .. .. •
'. 4,000 -- _____D
3,0000
SETW
2,000
0 A Ul'imateA Initial nonlinearity ETW
IOOC, 1 __II__I_
0 2 4 6 8 10
Width/Diameter, w/dOPt3-115-35
Figure 51. Effect of Temperature and Moisture on Joint Strength
61
Downloaded from http://www.everyspec.com

rI
iI
/
Ia) Net-Section at RTD
(b) Bearing-Shearout
at ETWFig(5re
2. Joint Failures Changed
at ETW Test Conditions
I.
62{
Downloaded from http://www.everyspec.com

I2
P1 + P2 -'- we 6d Double-hearP2 P 1 j Ultimate failure
u III J 0 Initial nonlinearitytuE x 4d 3d
1' 12o ", Torqe-U
160
'
60 in.-Ib Torque-Up
120
C4
4--
C
80, -d f
0.0 in.lb Torque Up
40 O. 125 1 9.375 05 6 5
6,000
4,000
-x
2,000
00 0.125 0.250 0.375 in.0500 0.6250,750
Figure 53. Effect of Hole Size on Joint Strength
63
i I
Downloaded from http://www.everyspec.com

(f) Load Interaction - Effects of fastener bearingand bypass stress interaction on laminate strength were evaluatedby two load conditions; (1) bearing and bypass loadings alignedparallel to the 0' principal material axis, and (2) bypass load-ings with bearing loads at angles of 100, 22.50 and 450 off the00 principal material axis. Roth studies used a speciallydesigned, hydraulic-actuated, scissor mechanism (Figure 54) topermit bearing loads to be applied to fastener holes independentof bypass loads. In all interaction tests, hearing loads wereapplied and maintained while typass loading was increased untilspecimen failure occurred.
II
CIPI13-15.33
Figure 54. Load Interaction Specimen and Test Setup
The first evaluation provided preliminary data on theeffects of aligned bearing and bypass stress on laminate strengthfor a 50/40/10 and 30/60/10 layup. Unloaded hole (zero bearingstress) and pure bearing (zero bypass stress) data were included
64
, •
Downloaded from http://www.everyspec.com

in the study. Predicted strengths are correlated with test datain Figures 55 and 56. Predictions made using the BJSFM are basedon the maximum strain failure criterion applied at a characteris-tic dimension of 0.02 inches away from the hole boundary. Solidsymbols indicate occurrence of ultimate static failure, opensymbols indicate initial nonlinear or discontinuous load-versus-deflection behavior, if any. For the 50/40/10 layup, the triangu-lar symbnl represents strength data obtained from an unfilledsingle-hole test specimen. This lower strength value indicatedthe presence of fastener hole interaction ("hole-shadowing") inthe bearing-bypass specimen (Figure 40) which tended to reducestress concentration effects by approximately 10 percent
H ~~80 7-n-- ____________ __
Pbypass Pbolt 1 bypass
6o' -.- - --o )6
60 0 y45 plies @ OCr T: 40 '
S40
00 plies @ Ocr 85-90
20SUltimate strength data
0 Initial nonlinearity
- Single hole test specimenI0I
0 20 40 60 80 100 120
Bearing Stress - ksi GP13-Ol15-114
Figure 55. Correlation of Bearing-Bypass Strength of a 50140/10 Layup
65
1..
Downloaded from http://www.everyspec.com

rii
80
Pbypatl • - Pbolt- • bypass
60 204000 80 Ply
4U
00 plies @ cr
Figu e 7 U e ale strengthf
0 Isnitial non-linearitya aI .0 20 40 60 80 10O0 120
Bearing Stress - ksi OpIW.0IS-113 i
Figure 56. Correlation of Bearing-Bypass Strength of a 30/60110 Layup
Typical load-versus-de rl ection trends are illustrated inFigure 57. General trends for both layups were: (1) bypassstrength decreased as bearing stresses increased, and (2) initialnon-linear or discontinuous load-versus-deflection behavior waspresent, appeared earlier, and became m-ore marked as bearingstresses increased relative to bypass stress. Predicted failureat low bearing stress was net-section fiber failure of (0 plies;at high bearing stress, failure was predicted to occur in either+45' oi- 900 plies due to ply shear stress. Figures 58 and 59indicate graphic representations of predicted critical plies andfailure locations. Representative failed specimens in Figure 60indicate verification of predicted failure modes.
66
Downloaded from http://www.everyspec.com
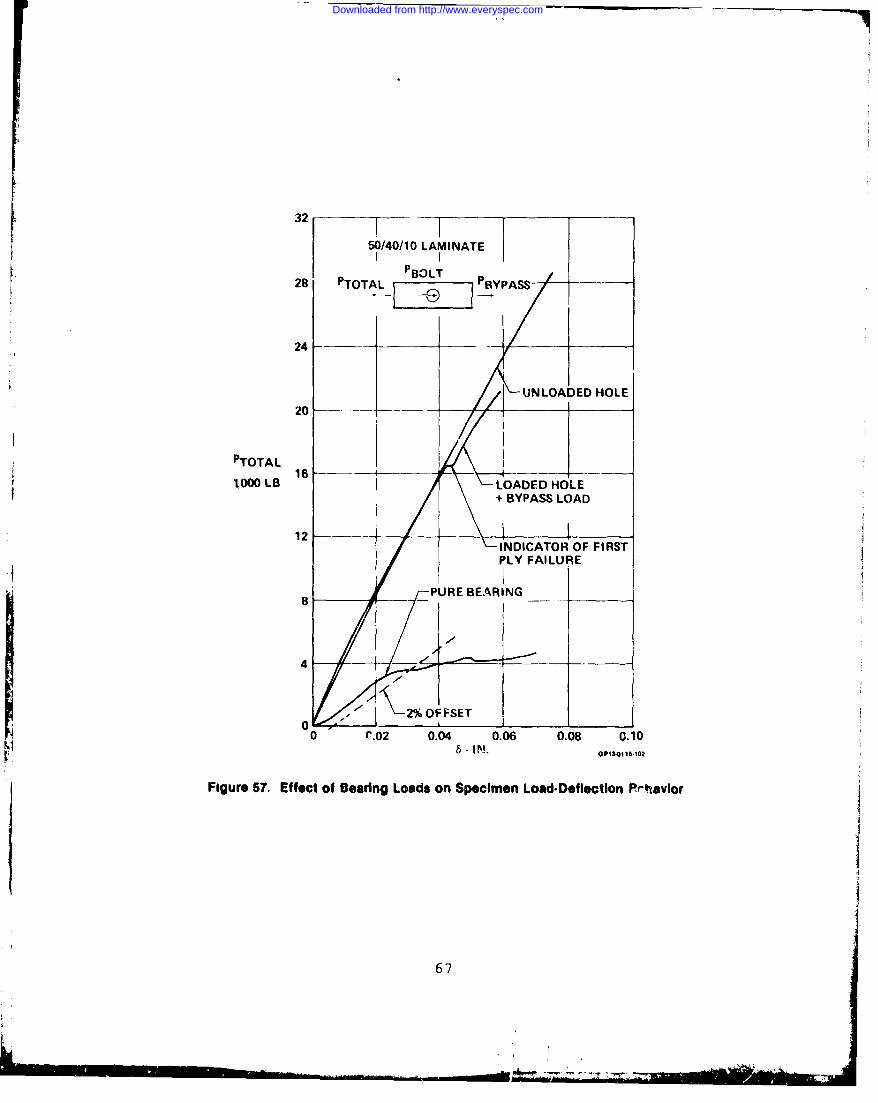
32 __
50/40/10 LAMINATEI INT
28 PTOTALP__ 7 PRBYPASS
24 -- 7 1,__ ___
UNLOADED HOLE
20 -- -____ - -
PTOTAL K---1000 LB LOADED HOLE
+ BYPASS LOAD
12 -I•NDICATOR OF FIRSTPLY FAILURE
PURE BEARING ___
8
_2% OFFSET0 "- e 'ozo 0.0
00 C,02 0.04 0.06 0.08 0.10
Figure 57. Effect of Bearing Loads on Specimen Load-Deflection Prhavior
j
67
Downloaded from http://www.everyspec.com

00 PLY FIBER CRITICAL -450 PLY SHEAR CRITICAL
3-
/ 2R
1 , I _.•I,,/
,- / -
//
NET.SFCTION FAILURE (LOW BEARING)
FBY-PASS FBy.PASS
,P13-01 I S103
Figure 58. Predicted Critical Plies for Net.Section Failures
68
' - - : " - • • ::..• o::., :. " -7 -7 = k.-• ' " " " • • • • ' i -:-.- :
Downloaded from http://www.everyspec.com

00 PLY SHEAR CRITICAL -45 PLY SHEAR CRITCAL
IIle
2R
/10
/,/
SHEAROUT B BEARING FAILURE (HIGH BEARING)
PBOLT-FBY-PASS
FBY-PASS
OP13-0115-112
Figure 59. Predicted Critical Plies 'or Bearine-Shearout Fai!ures
69
I.
Downloaded from http://www.everyspec.com

F -,
Low Bearirvi toads Highi Bearing Loads
OP13-116-111
Figure 60. Tests Verify Predicted Failure Initiation Points
The second evaluation examined effects of increasing off-axis bearing stress on laminate bypass strength. For the 50/40/10 laminate, bearing stresses of approximately 25, 27, and 35 KSIwere applied to a .250 inch diaireter fastener hole at off-axisangles of 100, 22.50, and 450 respectively. Bypass loading para-l.el to the 0' principal material axis was increased from 0.0
pounds until static failure occurred. The resultant bearingloads, and angles of application, were selected to maintain aconstant 25 KSI bearing stress component (fxbr) parallel to thebypass loading, while perpendicular bearing stress components(f br) increased to values of 4, 10 and 25 KSIy IoTheory and test data are correlated in Figure 62. For thesebearing stresses, all failures were in a net-section mode.
70
Downloaded from http://www.everyspec.com

fbr 100+ ~ ~ ~ 1 1 by pass
fbr 25.4 ksi go° Ply Reference0
"" fbypasI- fbr
"j d fbr f0
fbr 0
fbr 27.1 ksifo =-
_......... 0 fbr fbr
br (deg) X yf &< 450 (ksi) (ksi)
10.0 25 4.3IN. 'I, __fbypass22.5 25 10.4
1-y 45.0 25 25.0
fbbr = 35.4 ksifGp 1-0.31
Figure 61. Load Conditions fof Off-Axis Load Interaction Tests
71 jL*-
Downloaded from http://www.everyspec.com

r!
P Double-shearP]
-Ft Ultimate failure
- Initial nonlinearity
70
*~60
"U. 50
Prediction J
40 _ - --- - --
E 6000
Zw 5000
"• 4000
Prediction300
0 5 1015 20 25 30
Fbr - ksi 1Y OP13&0115.32
Figure 62. Effect of Off-Axir Bearing Loads on Bypass Strength
For both load-interaction studies, at increased bearingloads, ultimate s ngths occurred .Eter initial nonlinearitieswere observed ill joint load-deflection plots. Predictedstrengths, based on the linear-elastic BJSFM analysis, correlatedwith the initial nonlinear indications. High bypass loads withzero to low bearing caused joint net-section failures with pliespredicted critical due to excessive fiber strain. Joint load-deflection behavior was linear with catastrophic failure occur-ring at predicted first ply fiber rupture. At higher bearingstresses, plies were predicted critical due to excessire shearstress, a typically nonlinear ply property. This correlated withobserved joint failures which were in bearing or bearing-shearoutwith nonlinear load-deflection behavior. Failures were localizedat the fastener hole with load redistribution occurring prior tofailure.
72
Downloaded from http://www.everyspec.com

(g) Fastener Pattern - Stress concentration inter-actions were evaluated using a four-fastener specimen (referenceFigure 41). Edge distances and fastener spacings were 3 and 4diameters respectively. Column spacing was 4 diameters. Allfasteners were .250 inch in diameter and specimens were tested tofailure at RTD and ETW conditions. Steel, aluminum, and titaniumload blocks for the four-fastener specimens were designed toprovide joint stiffness ratios between the metal load blocks andthe Gr/Ep specimen of approximately 10, 5, and 1 respectively.Test setups are illustrated in Figure 63.
(a) Single-Lap (b) Double-Lap
Steel Load Block /AluminumStraps
Graphite/Epoxy Specimen
Graphite/Epoxy: Ti Stiffness (1:5)Graphite/EpoxySpecimen Titanium
Graphite/Epoxy: Ti Stiffness (1:10) Straps
-Graphite/Epoxy Spesimen
Graphite/Epoxy: Ti Stiffness (1:1)OP13.011-30
Figure 63. Fastener Pattern Specimen Loading Configurations
73
Downloaded from http://www.everyspec.com

Tension strengths are presented in Figure 64. No signifi-cant variations in internal load distributions due to variationsin joint stiffness were evident. Predicted bolt-loads indicatedthat the graphite-to-aluminum joint strength should be approxi-mately 4% higher than the graphite-to-titanium joint; however, aslight reduction (6-8%) was noted in test. Based on data fromsingle and two-fastener specimens, small variations in internalbolt-load distribution are probably masked by joint nonlineari-ties which occur prior to failure. Single-shear joint strengthswere similar to the double-shear strengths at RTD, and lower(13-20%) than double-shear strength at ETW. Single-shear jointfailures were predominantly shearout. For double-shear joints,failures tended to shift to net-section tension or tension-cleavage as is illustrated in Figure 65. Strengths and failuremodes of the single-shear joints reflect joint eccentricityeffects. Because bolt-bending was minimal, a physical variablewhich could account for strength and mode differences is thedouble lap arrangement of the metal loading members. Thisarrangement inhibits initiation of localized damage at thefastener hole due to bearing or shearout and creates additionalfriction load paths.
P2-G PPP
RTD ETW
Layup Configuration Fbru etu Fbru etux2 XGross X2 XGros
(ksi) (uin./in.) (ksi) (pin./in.)
30/60/10 Steel Load Block 123 5,470 110 5,110A 90 4,700
50/40/10 Steel Load Block 130 4,350 101 3,380
50/40/10 Graphite/Epoxy-Ti 133 4,350 112 3,880
50/40/10 Graphite/Epoxy-Al 139 4,510 122 4,220
50/40/10 Graphite/Epoxy-Al - -- 123 4,580
(Salt Exposure)
A\ T300/5208; all others AS/3501-6 OP13O011-2t
Figure 64. Effects of Environment on Faatoner Pattern Joint Strength
74
Downloaded from http://www.everyspec.com

OP13-0115-85
Figure 65. Joint Failures for Fastener Pattern Specimena
Downloaded from http://www.everyspec.com

A limited examination of the galvanic effect of salt-waterexposure on graphite-to-aluminum joints was performed with thefoar-fastener specimen. Specimens were attached to 7075-T76aluminun plates and exposed to a 5% NaCl salt spray at 95*F.Setup was exposed for 34 consecutive days. Visual appearanceafter the exposure is indicated in Figure 66. As expected, theexposure resulted in corrosion of the aluminum parts. Becausecomposite member strength was the issue of question, specimenswere then attached to pristine aluminum members in a double-lapconfiguration and tested to static failure at 250'F under tensionloadinqs. As indicated by strength results shown in Figure 64,composite member strength was unaffected by the salt sprayexposure.
Figure 66. Corrosion Resulting from Salt-Spray Exposure
Two additional sets of specimens were fabricated fromT300/5208 graphite-epoxy in the 50/40/10 and 30/60/10 laminateconfigurations. These specimens were tested to failure intension at room temperature. Relative to the AS/3501-6 data,failure modes were similar, but strength values were lower byapproximately 14-23 percent (Figure 64).
(h) Torque-Up - Effects of torque-up on bearingstrength were evaluated for three layups. In addition, purebearing (single fastener) and two-fastener-in-tandem (bearingplus bypass) double shear specimens were tested with torque-upvalues ranging from 0 to 70 inch-poundL.
76
Downloaded from http://www.everyspec.com

Pure bearinq strengths and associated failure strains arecompared in Figure 67. All layups failed in shearout-bearing.Representative failures are illustrated in Figure 68. Layupsensitivity to torque-up appeared to be related to percentage of0* plies (or lack of + 450 plies). For the three layups of 30,50, and 70 percent 05' plies, respective increases in bearingstrength at 50 inch-pounds of torque-up over pin conditions wereapproximately 15, 21, and 30 percent.
Pure bearing and unloaded hole failure strain data arecompared in Figure 69. Higher percentages of 0* plies causeincreased strain concentrations which lower laminate gross straincapability. Resulting unloaded hole gross strain concentrationfactors (Kt's) range from 2.44 for the 70/20/10 layup, to 2.1 forthe 30/60/10 layp, with pure bearing Kt's respectively of 10.2and 3.5 for fasteners baving 50 inch-p.ounds torque-up. Removingtorque-up entirely increased the effective Kt under pure bearingto 13.6 and 4.1 respectively.
In acdition to bearing strength, joint load-deflection plotswere examined for nonlinear mechanical response. Points of ini-tial nonlinearities are plotted with ultimate bearing strengthsin. Figures 70, 71 and 72. Although scatter bands are wider,unlike ultimate strength data, the load values at initial non-linearities appear to be less affected by torque-up. Thiscorrelation of predicted first ply shear failure indicates thatjoint nonlinearities are associated with localized failure ofplies at the hole boundary. For this calculation, the previouslydetermined <'alue of .02 inch was used as the characteristic dimen-sion in conjunction with the maximum strain failure criterion.Strengths of the two-fastener-in-tandem specimens are compared inFigure 73 with pure bearing strengths.
(i) Fastener Countersink and Laminate Thickness -
Effects of countersinks on laminate bearing strength wereevaluated over a range of countersink denth-to-laminate thicknessratios (.77, .38, and .26). Test specimens were of a single-fastener pure bearing configuration having a .375 inch diameterfastener with the laminate loaded in double-shear. As-manufac-tured speci mens were tested in tension to failure at roomtemperature. Layup stackings, detailed in Figure 26 were integermultiples of the 50/40/10 baseline 20 ply stacking sequence.These same 40 ply and 60 ply layups were further used to evaluatethe effects of thickness without countersirks. The do'.ble-shearspecimen configuration was used and specimens weie loaded tofailure in tension and compression. Test conditions included RTWand ETW. RTD strengths are presented in Figure 74. Within datascatter, effects of countersink versus noncountersink on strengthappear to be insignificant for the 50/40/10 laminate. However,initial points of nonlinearity indicate a 50% lower onset forcountersink 20 ply laminates, becoming less pronounced at the 40ply thickness and disaFpearing at the 60 ply thickness. These
77
L "
Downloaded from http://www.everyspec.com

2 2 0 It -0 .2Double-Shear Ex d 0250
LL
4,000
Ci
60
c - ' • "='.50/40/10
0 20 40 60 80 100
Torque-Up - in.-Ihi ~ G PI 3-115-2 5
Figure 67. Effects of Layup and Torque-Up on RTD Pure Bearing Strength
78
Downloaded from http://www.everyspec.com

70/20/10 Layup 50/40/10 Layup
-i 0.250 -• --,-- 1.5
30/60/10 LayupGP13-011547
Figure 68. Failures of Pure Hearing Specirnans
79
Downloaded from http://www.everyspec.com

14,000
13,000
12,000 " _"
Unnotched
Unidirectional11,000 Tensile Strain
Capability
10,000
9,000
CtX /-d 0.250
*- 8,000
x 6d I
6Unloaded Hole-
F 6,000
5,000 .---
4,000 Torque-Up
Loaded Hole 5 n.b- ___,,__0 in.-Ib--•.II
3,000
6d
Double-Shear
(All layups contain 10 percent 900 plies) j0 10 20 30 40 50 60 70 80 90 100
Percent of ±450 PliesGP13-0115677
Figure 69. Comparison of Loaded and Unloaded Hole Specimen SAengths
80
Downloaded from http://www.everyspec.com

Double-shear
U Ultimate failure
Q3 Initial nonlinearity3d
200 --
120
-Prpcixtion
80 _
40 -- _
20 40 60 80 100
Torque-Up - in..lb GP13-o115.27
Figure 70. Effect of Torque-Up on RTD Pure Bearing Strength50/40/10 Layup
81
Downloaded from http://www.everyspec.com

200 F l T
Diuble-shear
( 0.250 Ult mate failure
_T Initial nonlinleirity
P P - 6d Predicton
160
3d
120
-xU_
- Prediction
40__ _ _jz
00 20' 40 60 80 1 GO
Toi1ue-Up - in.-l OP13-VI15.26
Figure 71. Effect of Torque-Up on RTD Pure Bearing Strength70/20/10 Lay up
82
Downloaded from http://www.everyspec.com

(I 0.250p\
P 6dDouble-shear
Ultimate failure
r3 Initial nonlinearity3d
200
160
120
.L -BJSFM
80 ,. • ,..Prediction
-1
40
0 -0 20 4J 60 80 100
Torque-Up- in.-Ib GPIS11Z
Figure 72., Effect of Torque-Up on RTD Pure Bearing Strength30/60/10 Layup
P,3
-I
Downloaded from http://www.everyspec.com

d= 0.250- d -0 .250
PT PT 6dP _G 6d
, 0. 25_.. 0 • Double-Shear _ d_,
3 t 4d 3dSex ex
180
'- Single FastenerJoint
2 24 asteners-Sin-a-Row Joint12
i 6,000
-4--C-
2x2,000r-= J-
00 20 40 60 80 100
Torque-Up - in.-lb041340116-2
Figure 73. Comnpalds of Effects of Torque-Up on RTD Joint Stmngth
84
L ,t
Downloaded from http://www.everyspec.com

trends indicate the expected effect of local countersink geometryon linear-elastic stress distributions, with differences vanish-ing due to subsequent joint nonlinear behavior prior to specimenfailure.
d- 0.375-
pp 6d
Double-Shear 3d
200
* U Ultimate failure
Initial nonlinear~ty
S150-
M -
,, !~
1 v0
C .
TNon-CNk-CE 50 40, 1c8
00
2,400
Qk-- IT"2,200- i
Thcnesin.t 0P3152
2,000 f,
1,4oo01
0 .01 0.2 0.3 0.4 0.5 0.6 0.?Thickness - in.
Figure 74. Effect of Thickness and Countersink on Joint Tensile Strength
85
- .
Downloaded from http://www.everyspec.com

(j) Stacking Sequence - Five variations of the50/40/10 layup w:'re tested in pure bearing. Spe imens wereloaded to failure at room temperature in tension and compression.Effects of moisture content (approximately .8% by' w-ight) andelevated temperatura (250*F) on bearing strength were evaluatedfor tensile loaing. The 50/40/10 layup stacking sequences aredetailed in Figure 26. The primary variation in stacicingsequence was separation of 0* plies.
Tension strengths are presented in Figure 75. Loweststrength values are associated with layups having 60% and 100% of
their 0O plies grouped. This type of stacking increases intra-laminar shear stresses between each group of 0° plies and theremaining +45* or 90* plies. The dominance of this factor isillustrated in Figures 76 and 77. Both tension RTD and ETWstrength trends are presented relative to the maximum percent ofgrouped 0* plies contained in the 50/40/10 layup. Data trendsindicate a linear dependence on 0* ply groupings. Predictedbearing strengths are shown in both p'..ots as a constant value.Effects of through-the-thickness variables on stress distribu-tions are not accounted for in current BJSFM methodology.
For RTD ccmpression data, strengths are plotted versus maxi-
mum percent of grouped 0* plies in Figure 78. While compressionstrength data indicated a linear relation, fastener bearingstresses are quite different t an stresses in the previoustensile specimens. While groupings of 0* plies do affect joint
compression strength, it would not appear to be through apresence or lack of intralaminar shear planes.
(,k) Single-Shear Loading - A comparison of jointsingle shear versus double-shear strength is presented in Figure79. Initial pcints of nonlinearity indicate the expecteddecrease in joint strength associated with increased joint eccen-tricity. However, laminate bearing strength at joint failureexceeded bolt shear strength capability in the .250 inchprotruding-head single-shear configuration, and composite memberfailure trends could not be quantified. Single-shear jointstrength versus variations in e/w ratios is plotted in Figure 80.
86
Downloaded from http://www.everyspec.com

200
b~u 3&~1 6d
d 0.250 -150
z xuL
1T.
CE
50
•RTD • nUltimate
[0 ETW 0 E3 Initial nonlinearitv
0
2,600
2.200 T
.C
C I
. 1,400
U.
1,000
6001 6 7
"acking Sequence Number50/40/10 Layup
Figure 75. Effect of Stacking Sequence on Joint Tensile Strength
87
Downloaded from http://www.everyspec.com
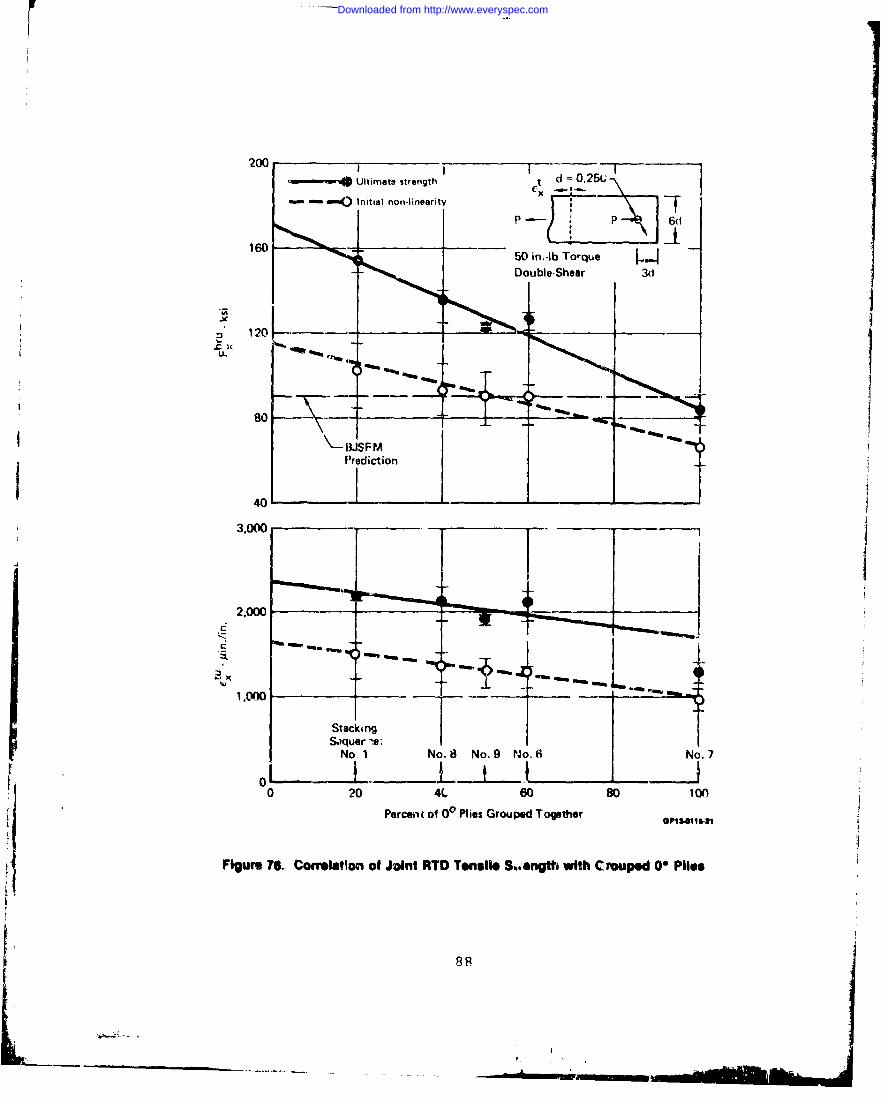
200 1.. m4Ultimatq strength -*-025;-\
- ()initial non-linearityT
16 -___6d
1050 in..bTorqu.e I.Double-Shear 3d
4 120 -
LL 41111111180
13JSF MPrediction
.40
2,000 -- -__
0 04 60 f 80 10
I,,
88
Downloaded from http://www.everyspec.com

d =0.250
-- 6d 50 in.-lb Torque-Up
(.• .. N Double-Shear
7- Ultimate failure
3 0 Initial nonlinearity3d
120
100
80
LL 60 ,i.. i.---.-•,,-- -,
201
2,000
1,500 1 - ill
; 1,003
500 --- Stacking
SequenceNumber 1 8 9 6 7
01
0 20 40 60 80 100
Maximum Percent of 00 Plies GroupetdaPIS-el11-U|.
Figure 77. Correlallion of Joint ETW Tensile Streng!h with Grouped 00 Plies
39
Downloaded from http://www.everyspec.com

iI
(1 0.250
i=7I 50 n..lb Tc;que-Up
Double-Shaar
v 1-40 Ultimate FailureX" Initial Nonlinearity
160 -'
150 --- - - -- _ _ _ _ _ -. _ _ _ _ _ _
140 - -
130 - - - -
___ _ _ -_U ___120 • •• •--
2 1Prediction.U -x go o Ply_ Fiber Failure -- ____ __
Prediction
10 450 Plies - - --- ___
Shear Failure -"-
801 1__ _ _ _ _ _1
3,000 f--------
2,600
W x 1,000 -Stacking - t _
Sequence
Nu0e 1 10 20 40 60 80 100
Maximum "'Nicent of Grouped 00 Flies
Figure 78. Correlation of Joint RTD Compressive Strength with Grouped 00 Plies
90
Downloaded from http://www.everyspec.com

Clevis
Double- Shear f@0 Single-Shear fUltimate Csk Ultimate A Csk
0 0 0 A Initial Nonlinearity160 ..
140
120
' IC" 100 - _ __ _
8012
601 __ _ _ _ _ _ _
400.125 0.250 0.375 0.500
Diameter - in.gplal111
Figure 79. Comparldsc m of Single and Double-Shear Joint Strengths
91
Downloaded from http://www.everyspec.com
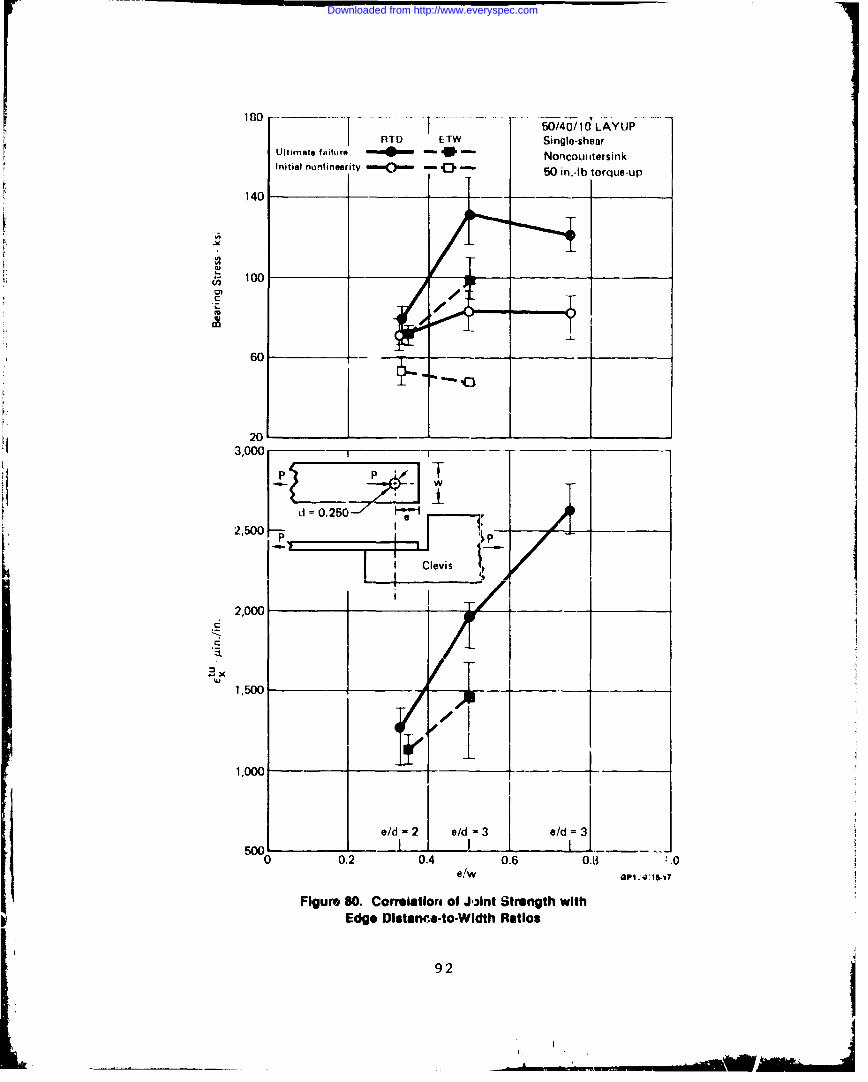
o. 1Y50/40/1o LA .UP18 I RTC) ETW Single-shearUltimate failure '.--49- - 0 - NoncoutitersinkInitial nonlinearity - C -- , -,. 50 in.-lb torque-up
140
S100 - _ _
.-A-
60
20-
3,000 -
d0., 0.25
2,500 P I!
P2,50 Clevis
2,000
Xt--'U.
1,500 - _ __
1,000
e/d = 2 e/d 3 e/d= 35001 10 0.2 0.4 0.6 0.8 '.0
eWPt
Figure 80. Correlatiore of J,3lnt Strength withEdge Distance-to-Width Ratios
92
Downloaded from http://www.everyspec.com

2. EVAIIIATION OFMANUJFACTUIRING; AN!DSERVICE ANOMALIES -TASK 3in thIS task te serviceK~anomal ies Oil joint static strength were evaluated. The? selectionof the seven bolted joint anowF~lies was based on MCAIR experienceand results of an industry-wide survey conducted as part of the"Advanced C,_omp)osite Serviceability Program" (Reference 2, . Datafromn Task 3 weýre compared with baseline joint strengths (noanomaly) determined from tests performed in Task 2.
a. Task 3 Test Plan - The objective of Taskz 3 was to evalu-ate the effects of manufacturing and service anomalies on boltedcomrposite- Joint static strength. Only laminate quality or holequality was varied for Task 3 testing. Test Matrix details areprovidedI in 1'iqure 81.
Number of TestsPer Environment Total
Anomaly rSpecimenRT (Dry) IRT (Wet) ET (Wet) Tests
1. Ou-of-ound olesTensio -n Compressior Compression
"'I" Laminate (50/40/10) A - ~ -4
"2' Lamrinate (3 0/6 0/10) 4 - 4
2. Broken) Fibers on Exit Side of HoleSevere Delamination 4 4 4 12Moderate De~amination 4 4 4 12
3. Porosity arouind hole
Severe Porosity 4 2,2 4 12Moderate Porosity - 2,2 J~4 8
4. Improper Fastener Seating Depth80% of Thickness 4 -- 4100%) of Thickness 4 -- 4
5. Tilted Countersinks ____ ___ _____
Away from Bearing Surface 4 -- 4 8Toward Beeý,ng Surface448
6. Interference LayUP 1 4 -4 8Fit Tolerances 1 4 4 80.003 in. Interference 2 4 -- 4 80.008 in. Interference 2 4 -4 8
7. Fastener Removal and Reir-stallation100 Cycles 4 4 4
Totdl 116
A GOP13-115-110
zi\A fter f reeze' xhirs c,- Rit /2\Ten vsion tests
rigure 8". Task 3 - Evaluation of Manufacturing Anomalies-Test Matrix
93
ICi
Downloaded from http://www.everyspec.com

Test procedures and specimen configurations (Figure 37) usedin this task were consistent with those establi3hed in Task 2 toinsure correlatable results. Specimens were tested to failure intension and compression at three environmental conditions: roomtemperature dry (RTD), room temperature wet. (RTW), and elevatedtemperature wet (ETW). ETW tests were conducted at 250"F withspecimen moisture contents of approximately .80 percent byweight. Hercules AS/3501-6 graphite-epoxy was used as the mate-rial for fabrication of test specimens. All specimens weretested to failure according to Figure 81 under tensile or compres-sive loadings. Absorption profiles representative of specimensrequiring moisture preconditioning are i-lustrated in Figure 82.
All specimens were instrumented with strain gauges. Docu-mentation included: (I) failure load and failure stra in,(2) load-strain plots to failure, (3) thickness, width and holesize measurements of all specimens, (4) resin content of eachpanel, (5) weight gain of humidity exposure specimens, (5) repre-sentative photographs, and (6) selected load-deflection plots tofailure. Complete details of Task 3 testing, test procedures,data and support equipment are provided in Volume 2.
b. Experimental Results and Evaluation - Results from allT'Vsk 3 tests are summarized in Figure 83. Indicated percentagesof increase or decreased strength are based on a comparison ofgross failure strains with baseline strength data from Task 2.
Results can be grouped under two classifications: (1)effects of anomalies which resulted in strength reductions ofmore than 13 percent and 12) those which resulted in strenqithL edtc L ions Less kII1II11 1,ret Tho fis .tol. n l..oporosity around hole, improper fastener seating depth, and tiltedcountersinks. Current project inspection and acceptance criteriain the industry would have detected all three of these anomaliesand resulted in part rejection or required repair. Detailedresults are discussed in the following paragraphs.
(1) Out of Round doles - Effects of out-of-round holes onjoint strength were evaluated by testing specimens produced bydrilling offset (.004 inch) holes as shown in Figure 84. Themajor diameter of the out-of-round hole was fabricated perpendi-cular to the 00 fibers and the direction of loading.
Joint specimens from two laminates (V 1/40/10 and 30/60/10)were tested to failure, in tension at roum temperature. Testresults were compared with baseline data from Task 2. Jointstrengths for both layups (Figure 85) indicate littLe or nosensitivity to out-of- round holes. This is consistent withunloaded hole studies where an out-of-round value of .004 irch(modeled as an ellipt ½c hole) resalted in predicted strengthreductions of no more than 1.0 percent.
94
€I
Downloaded from http://www.everyspec.com

1.2
1.0 -__
0.8
0
CCU 0.4
0.2
98% RH
+8 R 95% 9H I _I 55% RH16 0 °F I 16 0 0 c '" I 8 •I 18 0 °F
(a) For Baaeline Specimens
2.4 _- __
RH ,, _ _95% RH 98% RH55% RH
1600F 180OF 180OF
2.0 18
. 1.6 ]- --
. 1.2 ---
w08
0.4 A derv" delamination
04 n vere porosity
C severe delaminition
0
0 25 so 75 100 125 150Days
(b) For DelanrAnated or Porous Specimens oPsI11-O1i6t
Figure 82. Specimen Moisture Conditioning Histories
95
• - • • .-. . .• ,
Downloaded from http://www.everyspec.com
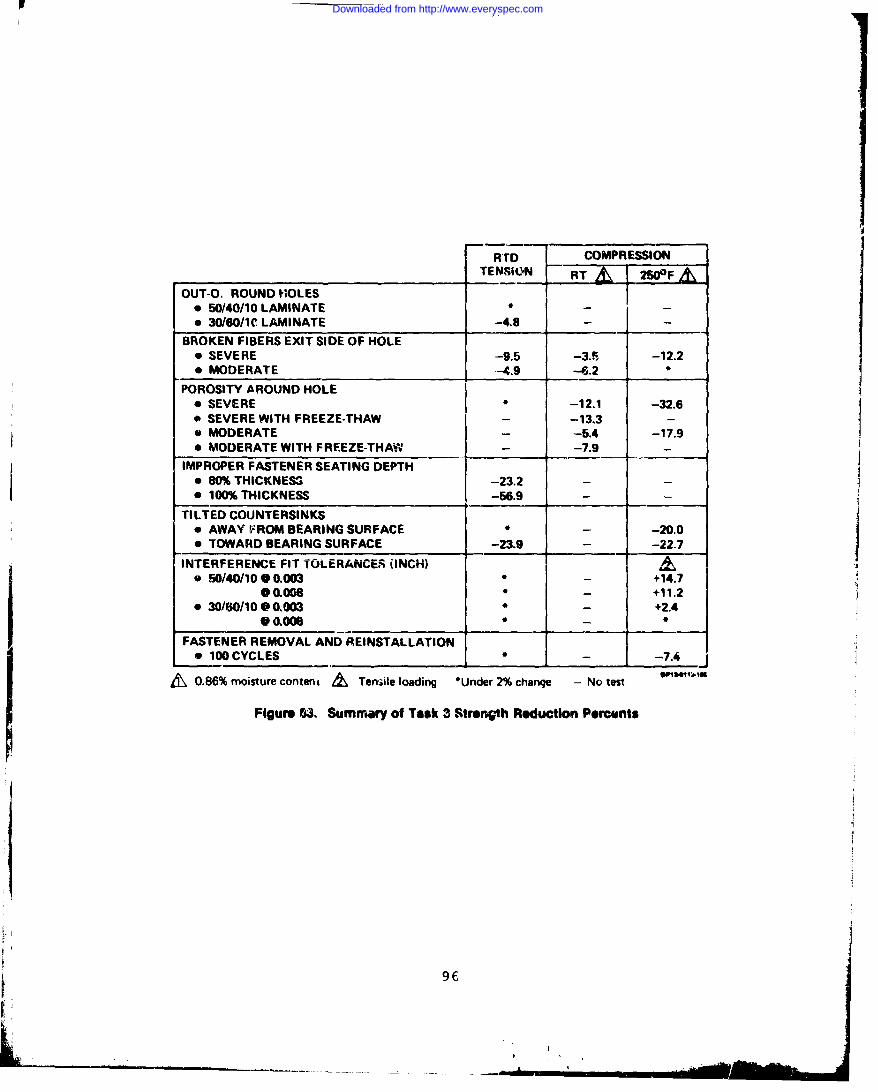
RrD COMPRESSIONTENSION RT 25&F
OUT-O, ROUND HOLES* 50/40/10 LAMINATE 0 - -
* 30/60/1(0 LAMINATE -4.8 - -
BROKEN FIBERS EXIT SIDE OF HOLEe SEVERE -9.5 -3.t -12.2* MODERATE -4.9 -4.2 _
POROSITY AROUND HOLE* SEVERE * -12.1 -32.6& SEVERE WITH FREEZE-THAW -13.3 -e MODERATE -5.4 -17.9e MODERATE WITH FREEZE-THAW - -7.9 -
IMPROPER FASTENER SEATING DEPTH* 80% THICKNESS -23.2 - -
* 100% THICKNESS -56.9 - -
TILTED COUNTERSINKSe AWAY FROM BEARING SURFACE - -20.0e TOWARD BEARING SURFACE -23.9- -22.7
INTERFERENCE FIT TOLERANCES (INCH) &* 50/40110 @ 0.003 * - +14.7
@0.008 * - +11.2* 30/60/10 0 0.003 * - +2.4
FASTENER REMOVAL AND REINSTALLATIONe 100CYCLES _ - -7.4
A0.86% moisture content & Tem;ile loading *Under 2% change - No test
Figure 63. Summary of Task 3 Strength Reduction Percents
96
L!
Downloaded from http://www.everyspec.com

O..
__ ILT
two- 100- 0.750--,
Note: Dimension in inche- I , 0Pt50115tS
Figure 84. Outof-Round Holes - Specimen Details
"I(d =0.250
PTctal P2 P1 6
- XGross
Task 2 Task 3 %Baseline Data Anom-.aly Results ChangeTest Condition "u c bU•. odn
Out-of -Round Holes Fbd C.u LoadingXGross x2 XGros Fbru eGross
_ (k•i (liin./in.) (ksi) (in./in.)
50/40/10 Layup • RTO 140 3,990 146 4,010 +4.3 +0.6 Ten30/60/10 Layup - RTD 143 5,470 141 5,200 -1.3 -4.8 Ten
OPI4.01S-14
Figure 85. Effect of Out-of-Round Holes on Joint Strength
97
Downloaded from http://www.everyspec.com

(2) Broken Fibers on Exit Side of Hole - Specimens weretested for two conditions of severity, "moderate" delaminationsand "severe" delaminations. In order to obtain the variousdegrees of delamination, drill procedures included: use of dullbits without backup material, and improper drill and feed speeds.Tests to failure were performed in tension and compression.Compression tests were conducted at room temperature and elevatedtemperature after specimen moisture conditioning.
Delaminations were detected visually .nd with ultrasonicC-scan. Delaminations were defined as "moderate" when theyextended over 10-20 percent (2-4 plies deep) of the laminatethickness on the exit side. Delaminations were defined as"severe" when they extended over 20-30 percent (4-6 plies) of thelamina.ie thickness on the exit side. Nondestructive C-scans ofholes with moderate and with severe delaminations are illustratedin Fioure 86 and compared with a nominal condition.
1.0 0.75 1 1.00 0.751+ 1 0 "ExitSideDe mnatioExS D lamination
Ei Sides with' n the Last Exit Side within the Lastof Holes 1-20%o: of Holcs 20 - 30% of
Thickness Thickness
Specimen Number 6-21-3 Specimen Number 2-20-12 Specimen Number 2-20-2
I+ ' II'' l"... ii~ !*,.,.,. ***: ,., .*.. . • Pt I.... ........
T :++ T::::+.+ Il I!++ ' is W:: '•t i! +l ! i ;iItti:iitt(,, ,
Nominal Broken Fibers Broken FibersCondition Moderate Severe
Delamination Delamination
0p13-Ohlt.12
Figure 86. C-Scans of Laminates with Delaminations at Fastener Holes
98
Downloaded from http://www.everyspec.com
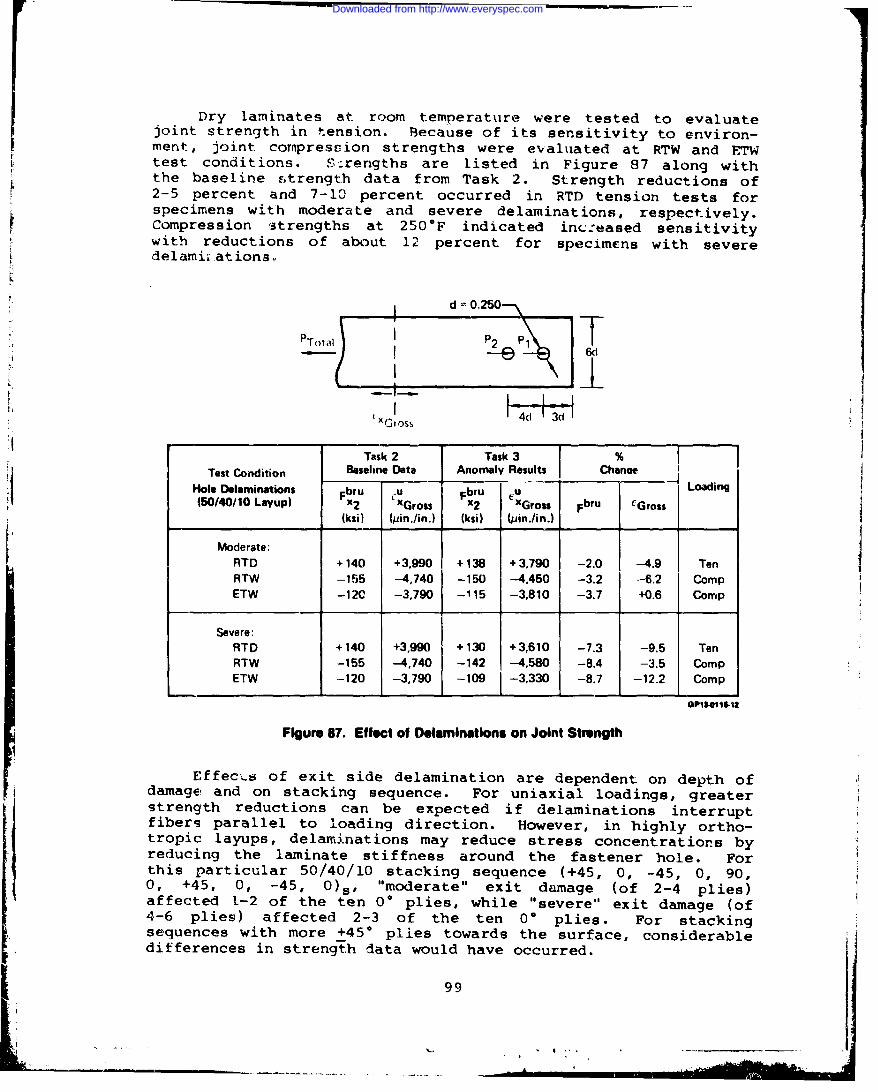
Dry laminates at room temperature were tested to evaluatejoint strength in tension. Because of its sensitivity to environ-ment, joint cormpression strengths were evaluated at RTW and ETWtest conditions. S:rengths are listed in Figure 87 along withthe baseline strength data from Task 2. Strength reductions of2-5 percent and 7-10 percent occurred in RTD tension tests forspecimens with moderate and severe delaminations, respectively.Compression 'strengths at 250°F indicated inc.:eased sensitivitywith reductions of about 12 percent for specimens with severedelami~ations.
d 0.250-
Task 2 Task 3 %
Test Condition Baseline Data Anomaly Results ChanueHole Delaminations bru - u FbrU u Loading(50/40/10 Layup) x2 XGross 2 Gross Fbru CGross
(ksi) (pin./in.) (ksi) (pin./in.)
Moderate:RTD +140 +3,990 +138 +3,790 -2.0 -4.9 TenRTW -155 -4,740 -150 -4,450 -3.2 -6.2 Comp
ETW -120 -3,790 -115 -3,810 -3.7 +0.6 Comp
Severe:RTD +140 +3,990 +130 +3,610 -7.3 -9.5 TenRTW -155 -4,740 -142 -4,580 -8.4 -3.5 CompETW -120 -3,790 -109 [ -3,330 -8.7 -12.2 Comp
0PlS.411-la
Figure 67. Effect of Delamninatlons on Joint Strength
Effec-..s of exit side delamination are dependent on depth ofdamage! and on stacking sequence. For uniaxial loadings, greaterstrength reductions can be expected if delaminations interruptfibers parallel to loading direction. However, in highly ortho-tropic layups, delaminations may reduce stress concentrations byreducing the laminate stiffness around the fastener hole. Forthis particular 50/40/10 stacking sequence (+45, 0, -45, 0, 90,0, +45, 0, -45, 0)., "moderate" exit damage (of 2-4 plies)affected 1-2 of the ten 0° plies, while "severe" exit damage (of4-6 plies) affected 2-3 of the ten 0* plies. For stackingsequences with more +450 plies towards the surface, considerabledifferences in strength data would have occurred.
I
IL .. . . ...... -
Downloaded from http://www.everyspec.com

(3) Porosity - Two levels of porosity were evaluated;"moderate" and "severe". Desired levels of porosity in the50/40/10 laminate were obtained by ujing the altered collationand curing procedures summarized in Figure 88. Specimens werelocated within panels such that fastener holes occurred in areasof desired porosity levels as indicated by photomicrograph andnondestructive inspections (Figure 89). Specimens were testedunder "worst case" conditions. Under tension loadings, only theeffects of severe porosiuy on joint strength were evaluated atroom temperature. Under compressive loadings, effects ofmoderate and severe porosity on joint strength were evaluated atRTD, RTW, and ETW. Four specimens (two of moderate and two ofsevere porosity) were loaded to failure in compression at roomtemperature a•fter moisture conditioning and exposure tofreeza-thaw c•" 1 .n• (Figure 90).
Procass Used for ,. Proem Used to IProdue.Curing Pro cedur e Good Panels M od orat Po rosity S " Porosity
Vacuum Oebulk Yes None None•
intermediate Temperature Hold 1 hr @ 275°F None NoneBag Va-uum 0.05 in. Heading 0.8 in. Heading 1.5 in. Heading
Autoclave Pressure 100 psig 50 psig 50 psig
Moisture Induced & None Every 7th Ply Every PlyI L -lne mist sprayed betwmn plies OP1341101
Figure 8o. Panel Fabrication Procedures Used to Produce Panel Porosity
100
5p
Downloaded from http://www.everyspec.com

Spec No 3 22 4
4.1
(a) Moderate Porosity
10 0 C-Scan0 Region
Spec No. 3-23-1
ib) Severe Porosity G -1I.1
Figure 89. Examples of Panel Porosity
101
Downloaded from http://www.everyspec.com

160
140k120 - C-ool Down from 180OF - 55% R • exposure
100
80--- - Room Temperature
LA.o 40-/
S20 /S0 --
S-20 1_--40 --
-60 - _- -65 F
-80 _-1I00 -- --- 30- 30 30 -
5--
-120 -1 Cyce
-140Time in Minutes
FIgure 90. Freeze-Thaw Exposure Proffie
Strengths from all tests and baseline (no anomaly) strengthdata are listed in Figure 0)l. Little sensitivity to severeporosity was indicated under tensile loading. tinder compressiveloadings, strength reductions ranged from 4-18 percent for speci-mens with moderafe porosity and 10-33 percent for specimens withsevere porosity. The greatest reductions occurred at the 250OFtest condition. Specimens with exposures to freeze-thaw cyclingindicated a slightly greater loss of strength than specimens notsimilarly exposed; 3-4 percent added reduction and 1-2 percentadded reduction respectively for moderate and severe porosityconditions. Specimens loaded in compression failed in bearing,similar in appearance to specimens with no porosity.
(4) Improper Fastener Seating Depth - Effects of excessivecountersink depth on joint strengt'h were evaluated by testingcomposite joint members having fasteiners seated too deeply in thelaminate. Two conditions of countersink depth were evaluated atroom temperature in tension.
102
I.
Downloaded from http://www.everyspec.com

d 0.250-\
P~otalP 2 P1
lXross
Task 2 Task 3 %
Test Cnditio Baseline Data Anomaly Results Change
Porosity bru u FbrU uoading(50/40/10 Layup) Fx2 XGron x2 XGross Fbru I Gross
(kSi) (Win./in.) (ksi) (.in.!n.)
Moderate Porosity:RTD +140 +3,990 ..-.. TenRTW -155 -4,740 -184 -4,480 -4.3 -54 Comp
RTW (F-T) --15 --4,740 -142 -4,370 --8.4 -7.9 CompETW -120 -3,790 -104 -3,110 -12.8 -17.9 Comp
Severe Porosity:RTD +140 43,990 +140 +3,940 0 -1.2 TenRTW -155 -4,740 --139 --4,170 -10.3 --12.1 CompRTW (F-T) -155 -4,740 -137 -4.110 -11.9 -13.3 CompETW -120 -3,790 -83 -2,550 -30.3 -32.6 Comp
Note: (F-T) - ttxposed to freoze-thaw cyclas Opt3411tS4
FIgure 91. Effect of Porisity Around Hole on Joint Strength
Strengths are listed with nominal condition strengths inFigure 92. Strengths for joints having improper seating depthsare compared with nominal countersunk (52% of laminate thickness)strength data. For the 50/40/10 layup tested, joint strengthsfor countersink vcr sus noncounters.ý nk larrinates (Task 2,Reference Figure 74) indicated no significant reductions occurredwhen fastener seating depth was nominal. The loss of bearingmaterial and the associated knife-edge condition for the 80% and100% depths may account for the strength reduction. Based onaverage bearing stresses, countersink depths of 80% and 100%thickness reduce cylindrical bearing area by 28% and 48%respectively, which approximates the percent changes in strengthlisted in Figure 92. Additionally, the deeper countersink in-creases the effective diameter of the hole which further reduceslaminate strength due to hole size effects.
103
J-
Downloaded from http://www.everyspec.com

r\ !
d -0.25(j-
~Tot al'
XGross
Task 2 T-ak 3 %Test Condition Baseline Data Anomaly Results Change
Fastener Seating FbrU u bru u Loading(50/40/10 L.yup) Fx2 CXGross Fx CGross Fbru cGross
(ksi) ( pin./in.) (ksi) b (C rin./ino)
80% Depth - RTD 140 3,990 117 3,240 -20 -23 Ten100% (Knifedge) - RTO 140 3,990 92 2,540 -53 -57 Ten
0P150115-?
Figure 92. Effect of Improper Fastener Seating on Joint Silrength
(5) Tilted Countersinks - Countersink perpendicularity wasinvestigated for two conditions of misalignment. The misalignedcountersink was tilted 100 away from the bearing surface for onecondition and tilted 100 toward it for the other. These testswere conducted in tension &t RTD and in compression at 250*Fafter specimen moisture conditioning. As illustrated in Figure93, tilted countersinks cause interferen,:e prior to properfastener seating and create a gap under the fastener head reduc-ing laminate bearing material. Experimental data indicateapproximately equal strength reductions (Figure 94), regardlessof direction and magnitude of countersink tilt, for moistureconditioned specimens te~ted in compression at 250*F.
104
Downloaded from http://www.everyspec.com

4.F
S - 0.20 Diame*,---te+100 (Toward)Point of
Interference-\ -100 (Away From)
0.108
-Lminate2 I Bearin_ _
S~~~~S u rf ac e ____'-
Note: Dimensions in inches 0P134. 1S4
Figure 93. 1 ilted Countersink - Specimen Configuration
105
__ _ _ _ _ _ _ __ _ _ _ _ __ __ _ _ _ _ _
Downloaded from http://www.everyspec.com

d 0.250--T
_ _ _ _ _
XGtoss
LT,-k 2 Task 3 %Test Condition Baseline Data Anomaly Reults Chanwe
Tilted Countersink Fbru M Fbru u Loading(50/40/10 Layup) x2 XGross x2 XGross Fbru 'Gross
(ksi) (pJin./in.) (ksi) (/pin,/in.)
Away From BearingRTD +140 +3,990 +140 +3,910 +1.1 -2.J Ten
ETW 120 -3,750 -'100 -2,990 12.6 -20.2 Comp
Toward BearingRTD +-140 +3990 +110 •3,030 -18 -24 TenETW -120 -3,750 100 -2,898 -14 -23 Comp
Figure 94. Effent of Tilted Countersink on Joint Strength
(6) Interfer."(ce Fit - The effects of fastener interferencefits on joint str.t',,jch were investigated in two different lami-nates (50/40/10 and 30/60/10). Two-factener-in-tandem specimenswere tested to failure in tension at RTD and 1-TW conditions.Strength evaluations were performed on specimens with .003 and.008 inch levels of interference fit.
Results (Figure 95) for both layups indicate an insensitiv-ity to interference at room temperature. Mixed results wereohtairied at FTW. Joint strength of the more fiber-dominant50/40/10 layup improved by 8-15% at both levels of interference.Joint strengths of the matrix-dominant 30/60/10 layup showedlittle or no increase (-1.8 to +4.6 percent) at the ETW testcorld it ioI.
106
Downloaded from http://www.everyspec.com

d 0.250-\
!6dPTetaI
P2 P16
( ;OSS K ±
Task 2 Task 3 %Test Condition Baseline Data Anomaly Results Change
Tost ConditioInterference Fit Fbru (U Fbru Cu G Loading
X2 XGross x2 XGross FbrU egress(ksi) (pin./in.) (ksi) (pin./in.)
50/40/10 Layup:0.003 Interference
RTD 140 3,990 140 4,000 +2.1 +0.4 TenETW 110 3,080 120 3,530 +11.8 +14.7 Ten
0.008 InterferenceRTD 140 3,990 140 4,030 +1.0 +0.9 TenETW 110 3,080 120 3,420 ý8.1 +11.2 Ten
30/60/10 Layup:
RTD 140 5,470 140 5,460 +0.2 -0.1 1 enETW 120 4,710 120 4,820 +4.6 +2.4 Ten
0.008 InterferenceRTD 140 5,470 140 5,490 -4.6 +0.3 TenETW 120 4,710 120 4,620 4-1.5 -1.8 Ten
OP13-O115.4
Figure 95. Effect of Fastener Interference Fit on Joint Strength
Laminate damage due to fastener installation at differentlevels of interference fit were further evaluated. Fastfenerinterference fits ranging from .002 to .0075 inch were examined.Standard pull-through installation techniques and fastener typeswere used. Each fastenrr area was sectioned and photomicrographstaken. Representative results are shown in Figure 96. Photo-graphs indicate little or no damage at a fastener interference of.0035 inch or less; hov -2r, damage is indicated at the fastenerexit side as well as t rugh-the-thickness for interference fitsfrom .004 through .007 iich.
107
Downloaded from http://www.everyspec.com

Pitu:tte At,,; ivv-
fntoiference Fits:
0.0010 in, 0.0034 in. .05n
IVI
Exit Side
Figure 96. Photomlcrographic Examination of Laminates withInterteroaice Fit Holes
108
Downloaded from http://www.everyspec.com
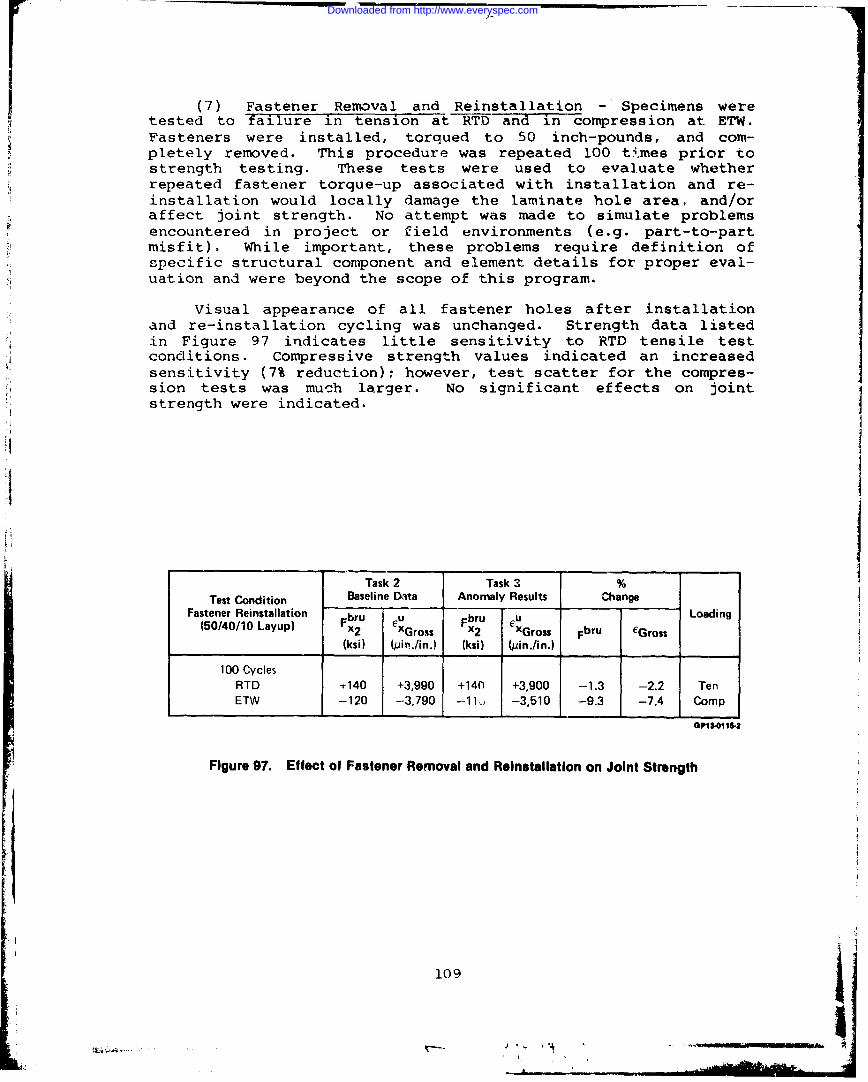
(7) Fastener Removal and Reinstallation - Specimens weretested to failure in tension at RTD and in compression at ETW.Fasteners were installed, torqued to 50 inch-pounds, and com-pletely removed. This procedure was repeated 100 ti.mes prior tostrength testing. These tests were used to evaluate whetherrepeated fastener torque-up associated with installation and re-installation would locally damage the laminate hole area, and/oraffect joint strength. No attempt was made to simulate problemsencountered in project or field environments (e.g. part-to-partmisfit). While important, these problems require definition ofspecific structural component and element details for proper eval-uation and were beyond the scope of this program.
Visual appearance of all fastener holes after installationand re-installation cycling was unchanged. Strength data listedin Figure 97 indicates little sensitivity to RTD tensile testconditions. Compressive strength values indicated an increasedsensitivity (7% reduction); however, test scatter for the compres-sion tests was much larger. No significant effects on jointstrength were indicated.
Task 2 Task 3 %Test Condition Baseline Dotta Anomaly Results Change
Fastener Reinstallation Fbru u FbrU u Loading(50/40/10 Layup) XGross X2 XGross Fbru eGross
(ksi) (jin./in.) (ksi) (pin./in.)
100 CyclesRTD -r140 +3,990 +140 +3,900 -1.3 -2.2 TenETW -120 -3,790 -11,, -3,510 -9.3 -7.4 Comp
Figure 97. Effect of Fastener Removal and Reinstallation on Joint Strength
109
Downloaded from http://www.everyspec.com

3. EVALUATION OF CRITICAL JOINT DESIGN VARIABLES ON FATIGUELIFE - TASK 4 - The objective of Task 4 was to evaluate the influ-ence of selected design variables and manufacturing anomalies on
joint fatigue life. Seven variables or anomalies shown in Tasks2 and 3 to have significant effect on static strength were chosenfor evaluation. Tests were to provide data on joint fatigue lifeperformance, hole elongation, and failure modes.
A pure bearing test specimen was used to provide basic jointfatigue data while minimizing test difficulties and permittingcorrelation with Task 2 and Task 3 static test data. All tension-tension (R = +0.1) and tension-compression (R = -1.0) constantamplitude testing was performed at room temperature with speci-mens in the as-manufactured condition. Spectrum fatigue testingof the 50/40/10 layup was performed at three environmental condi-tions. room temperature dry, room temperature wet, and elevatedtemperature wet. Elevated test temperature (250°F) and themoisture conditioning level (approximately .8 percent by weight)were the same as in Tasks 2 and 3. Hercules AS/3501-6 graphite-epoxy was used for fabrication of all Task 4 test specimens.
a. Task 4 Test Plan - The test plan summarized in Figure 98was based on literature survey resulis which indicated that: (1)little generic fatigue life data had been generated for 'oltedjoints, (2) life prediction methods are essentially empirical,and (3) theoretical approaches being pursued, such as the "wear-out" model, require large residual strength data bases forstatistical evaluation. This data base would be impractical insize for the seven variables to be evaluated in Task 4. Hence,an empirical approach was adapted to determine the effects of theselected variables on joint fatigue life. Testing of bcth fiber--dominated laminates and matrix-dominated laminates was includedin order to identify differences in failure modes, with suffi-cient tests under spectrum fatigue loading to indicate major datatrends.
The seven test variables selected for evaluation were:(1) stacking sequence, (2) torque-up, (3) single-shear versusdouble-shear, (4) fastener fit, (5) porosity, (6) layup, and(7) geometry.
Emphasis was placed on generation of hole elongation dataand its relevancy to joint fatigue life. All con.;tant-amplitudefatigue specimens were cycled t., failure, or 106 cycles, which-ever occurred first. Constant amplitude fatigue testing was per-formed at three stress levels for each specimen type. Selectionof the stress levels for fatigue testing was based on load-deflec-tion data obtained from static tests. During fatigue testing,load-deflection data were also obtained each time specified holeelongations occurred. All constant amplitude tests wereperformed at room temperature with as-manufactured specimens.Selected specimens which did not fail in 106 cycles were testedto determine residual strength.
110
Downloaded from http://www.everyspec.com

Tests were performed to determine effects of spectrum load--ing on joint life as a function of test limit load. If failurehad not occurred after four lifetimes of exp-sire, selected spe-cimens were static tested to determine residual Strength. As inconstant amplitude testing, three test limit load levels wereselected for each test variable evaluated.
MAX NO. OF TESTS NO. OF TESTSNO. TEST VAqIABLE FATIGUE CONSTANT AMPLITUDE SPECTRUM FATIGUE
STRESS R +0.1 R = -1.0 RTW RTD ETW RTW(TS)
1 BASELINE 01 3 3 3 3 3 3
50I40il0 u2 3 3 3 3 3
3 3 3 3 3 3•3 33 33 3 3____1 3 - ?• - 3 3 .
WSW -10 &&01 3- 3 .- 3 - -
02 3 - - -
03 3 3 -- 3 - -
19/76/5 0,t_ _1 3 3 - 3 - -
023 - 3 - -
(03 3 - 3 - -
3. ....2 STACKING SEOUENCE 01 3- - -
50/40/11C 02 3 3 - 3 - -
03 3 3 - 3 -
1&3 .. .
19:;5 ; 3 3 -- 3 - -
02 3 3 - 3 - -
03 3 3 3 - -
3 TOROUE UP
T = 160 IN.-LB 01 3- - -
50/40/10/ 3 - 3 -
03 3 3 - 3 - -
_ .....
T = 160 IN.-LB 01 - - -
19/76/5 02 3- -
03 3 3 - 3 - -
L_ 3
SComplementing static tests d= 0.375 in., w/d= 6, e/d: 3 Torque up 0 in.-lb
Figure 98. Task 4 - Evaluation of Critical Joint Design
Parameters on Fatigue Life - Test Matrix
111
Downloaded from http://www.everyspec.com

MAX NO. OF TESTS NO. OF TESTS
NO. TEST VARIABLE FATIGUE CONSTANT AMPLITUDE SPECTRUM FATIGUESTRESS R - +0.1 R = -1.0 RTW RTD ETW RTW(TS)
4 I GEOMETRY50/40/10 Z•al 3...
d -0.375 02 3-.. . ..
w/d -4 03 3 ... .
e/d -3 3 & 3..19/76/5 a\ 1 -3 .. . ..
d - 0.375 02 3 .. . . .
w/d -4 03 3 .. . . .
e/d -3 & 3 .. . . ..
19/76/5 01 3 .. . . .
d - 0.375 02 3-.. . . .
wM -3 03 3 .. . .. .
e/d - 3 .. . ..
50/40/10 /•Ž 0 3 -.. . .
d - 0.375 02 3 .
w/d - 4 03 3 -.. . .
e/d =4 3 -.. . .
5 FASTENER FIT (0.003 - 0.008 INTERFERENCE)
50/40/10LA Li\ 01 3 .. . . .
02 3-.. ...
03 3 .. . ..
6 SINGLE SHEAR (PROTRUDING AND CSK)
50140110t2\ 01 3 .. . . .
T = 160 1N.-LB 02 3 .. . ..
02 3.. . .
d - 0.375 IN. CSK 01 3 .. . ..
wM -6 02 3-.. . ..e/d 3 03 3 .. . ..
T = 160 IN.-LB 3A.. . . .
7 POROSITY7 50/40/10 / 3 3 . . ..
02 3 3 . . ..
03 3 3 . . ..
TOTAL TESTS = 35k jComplementing static tests A• d 0.375 in., w/d= 6, /'d 3 14\ Torque up 0 in,-lb
OP13.0116-262
Figure 98. (Continued) Task 4 . Evaluattion of Crit~cal Joint DesignParameters on Fatigue Life-Test Matrix
112
L p...,
Downloaded from http://www.everyspec.com

A baseline joint geometry (Figure 99) was tested to providea ftitigue life reference for all test conditions. Elevatedtemperature exposure, moisture preconditioning, and thermalspiking were included in this "baselir ." series of tests on the50/40/10 layup. Three sets of the 50/40/10 specimens weretested: (.) one set at room temperature with as-manufacturedmoisture levels, RTD, (2) one moisture conditioned set at 2500F,ETW, and (3) one moisture cond ioned set with thermal spikes(TS) applied intermittently during -he humid aging process,RTW(TS). The evaluation of a bass Ine joint geometry, alsoincluded two additional layups (30/60/10 and 19/76/5), which weretested under both constant amplitude and spectrum loading, RTD.
7.50
1.125-
1 00 STRAIN GAGE/
+__ 2,25
0.3745 +0.0022
-0.0000 1
] 1~
LJ..~CLEVIS(
SPEC IMEN-LOADING CONFIGURATION
GP134115-107
Figure 99. Task 4 - Fatigue Specimen Configuration
The random load spectrum used in Task 4 testing was an "F-15Measured-Mix Wing Spectrum-Truncated". This spectrum is a combi-nation of three F-15 wing baseiine spectra (Air-to-Air, Air-to-Ground, and Instrumentation and Navigation,, truncated toeliminate all loads less than 55% design limit load. Truncationwas considered appropriate based on the relatively low failurestrains associated with static tests of pure bearing (singlefastener) joints. The distribution of hours and exceedances forthe Air-to-Air, Air-to-Ground, and Instrumentation and Navigationin the Measured Mix spectrum are given in Figure 100. Theassociated exceedances are illustrated in Figure 101.
113
Downloaded from http://www.everyspec.com

MEASURED MIX
H EXCEEDANCES OF60% LIMIT STRESS
AIR-TO-AIR 700 3,1!
AIR-TO-GROUND 100 14U
INSTRUMENTATIONAND NAVIGATION 200 10
TOTAL 1,000 3,300
Figure 100. Distribution of Hours and Exceedances
10,000- -\ _-
1,000 -
EXCEEDANCE1OOR 100,,, ~ ~1,000 HR - /
10
-30 -20 -10 0 10 20 30 40 50 60 70 80 90 100
PERCENT DESIGN LIMIT STRESS OP13-0115105
Figure 101. Measured Mix.Truncated Spectrum
Fatigue specimen joint load-deflection response was moni-tored during the test. Evaluation of joint load-deflectionhysteresis data provided hole elongation and overall jointcompliance data as a function of cyclic exposure.
Indavidual test specimens were fabricated from 10 panels.
Stacking sequences are detailed in Figure 102.
114
4$
Downloaded from http://www.everyspec.com
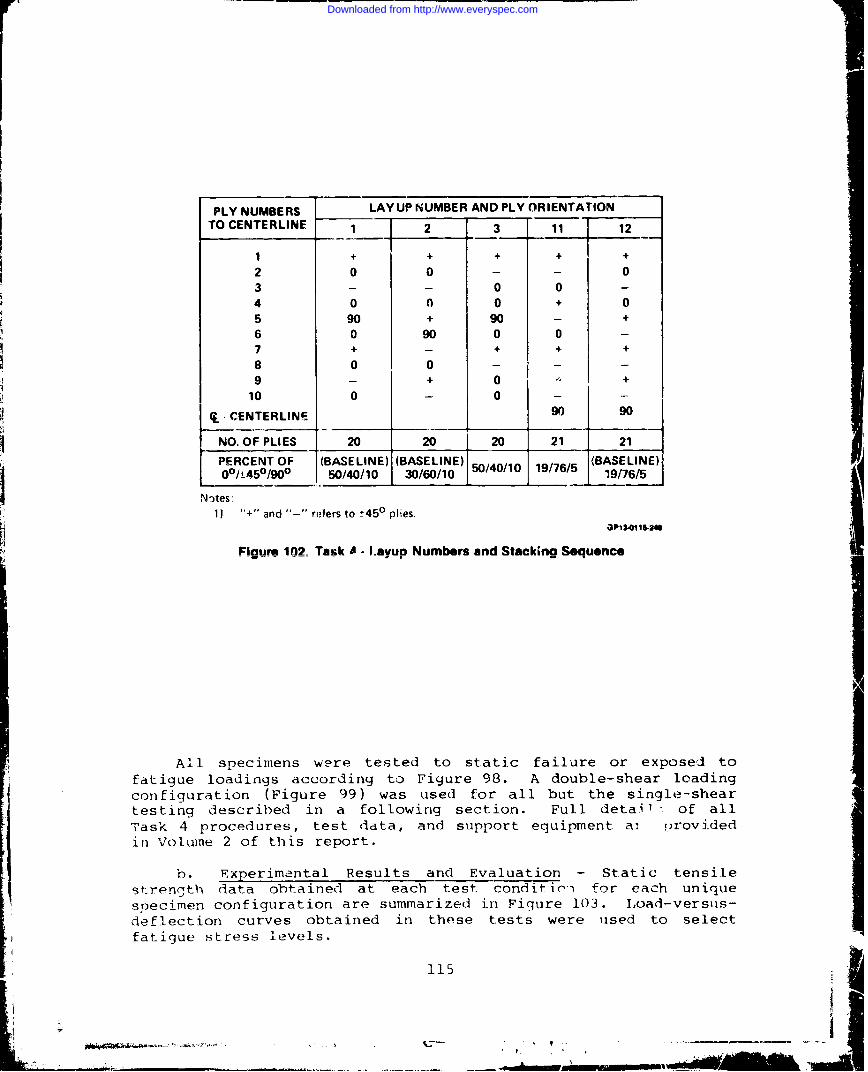
PLY NUMBERS LAY UP NUMBER AND PLY ORIENTATION
TO CENTERLINE 1 2 3 11 12
1 + + + + +
2 0 0 - - 03 - - 0 0 -
4 0 0 0 + 05 90 + 90 - +6 0 90 0 0 -7 + -+ + +
8 0 0 - - -
9 - + 0 -- +10 0 -0-- I
CL CENTERLINE 90 90
NO. OF PLIES 20 20 20 21 21
PERCENT OF (BASELINE) (BASELINE) 50/40/10 19/76/5 (BASELINE)00°/450 /90 0 50/40/10 30/60/10 1 1 19/76/5
Notes:1) "+" and "-" reffers to ±450 phes.
Figure- 102- Task A. I.avup Numbers and Stacking Sequence
All specimens were tested to static failure or exposed tofatigue loadings according to Figure 98. A double-shear loadingconfiguration (Figure 99) was used for all but the single-sheartesting described in a following section. Full detail - of allTask 4 procedures, test data, and support equipment ai providedin Volume 2 of this report.
b. Experimental Results and Evaluation - Static tensilestrength data obtained at each test condit-ic- for each uniquespecimen configuration are summarized in Figure 103. I,oad-versus-deflection curves obtained in these tests were used to selectfatigue stress levels.
115
Downloaded from http://www.everyspec.com

d =0.375
00 ly ef6d 0 in. Ab Torque-Up1 P~ouble-Shear
tu_ _ _ 3d _
Test Spring Stearngt Failure Strain Failu~reN.Variation Rate Srnt h (tu -i.i Loado. Parameter (k - kips/in.) (fbru - ksl) (gos X9,81' ldn b)
1 Layup. 50/40/10 RTD 400 100 1,400 7,530RTW 410 90 1,430 7,250RTWV (TS) 400 90 1,390 7,020ETW 330 50 790 4,210
I30/60/10 RTD 350 100 1,910 7,480___ 19/76/5 FITD 330 100 2,650 7,850
2 Stacking '50/40/10 .Z90 201,33%) 7,230Sequence: 119/76/5 320 100 2, 720 8,070
3Torque-Up: 50/40/10 400 120 1,770 9,350(T =160 in.-gb) 19/76/5 300 150 4,160 12,570
4 Guieometry: 50/40/10 e/d =34 30 0 2,210 7,440w/d 4 3330
bI50/40/10 w/d =4 390 100 2,160 7,610J
19/76/5 w/d 2 4 400 103, 960 I,9N0
e/d = 3
5 0.0045 in. 50/40/10 500 100 1,580 8,10IGInterference Fit
6 Single Shear 50/40/10 (PROTR) 350 120 1,830 9,250(T= 160 in.-lb) (CSK) 250 110 1,450 8,200
Pororsity: ____________ 400 _100 1,470 7,810
Figure 103. Summary of Task 4 Specimein Static Strength
Residual strengths were, in general, equal. or greater thannonfatigued specimen static strengths; however, in moicst cases,these specimens had acquired hole e long'at ions of .02 inch orgreater during fatigue. For structural applications, h,-d)e elonga-tio~ns of .02 inch exceed the usual yield criteria for metall ic
joints.16
11----- -W
Downloaded from http://www.everyspec.com

(1) Layop Variation - Three laminate variations were testedto determine relatveý fatigue life; the fiber-dominant 50/40/10layup and two matrix-dominant ] %yups, 30/bo/i0 rnd 19/76/5.These laminates were selected for fatigue evaluation on the basisof Task 2 results where changes were noted in a,-rength, failuremode, and failure initiation point.
Results of tension-tension (R = +0.1) and tension.-comprvs-sion (R = -1.0) cyclic loading on each laminate at room tempera-ttire, dry (RTD) test conditions are summarized in Figures 104,105, and 106, in terms of fatigue cycles required to produce an0.02 inch elongation of the fastener hole. The results indicatesimilar static and fatigue strength for all layups for tension-tension (R = +0.1) cycling, as summarized in Figure 107. Fortensicn-compression (R = -1.0), the 19/76/5 and 30/60/10 matrix-dominant layups sustained fewer load cycles prior to developingan .02 inch hole elongation, as compared to the 50/40/10 layup(Figure 108).
100,
4 "•"•R = +0.1
c60-
R =-1.0
4 P- 3 7 5 P-
0 in -Ib Torque-Up -
Doublfe-Shear 3d
0 1 1 1 1 1 1 1 !1 I 1 ! 1 1 - I II I I I ! I 1 I1 101 102 103 105 106 107
N - Cycle-
Figure 104. RTD Baseline Joint Fatig'vle Life50140110 Layup
117
L ,1. , ,-". . . . ._I..
Downloaded from http://www.everyspec.com
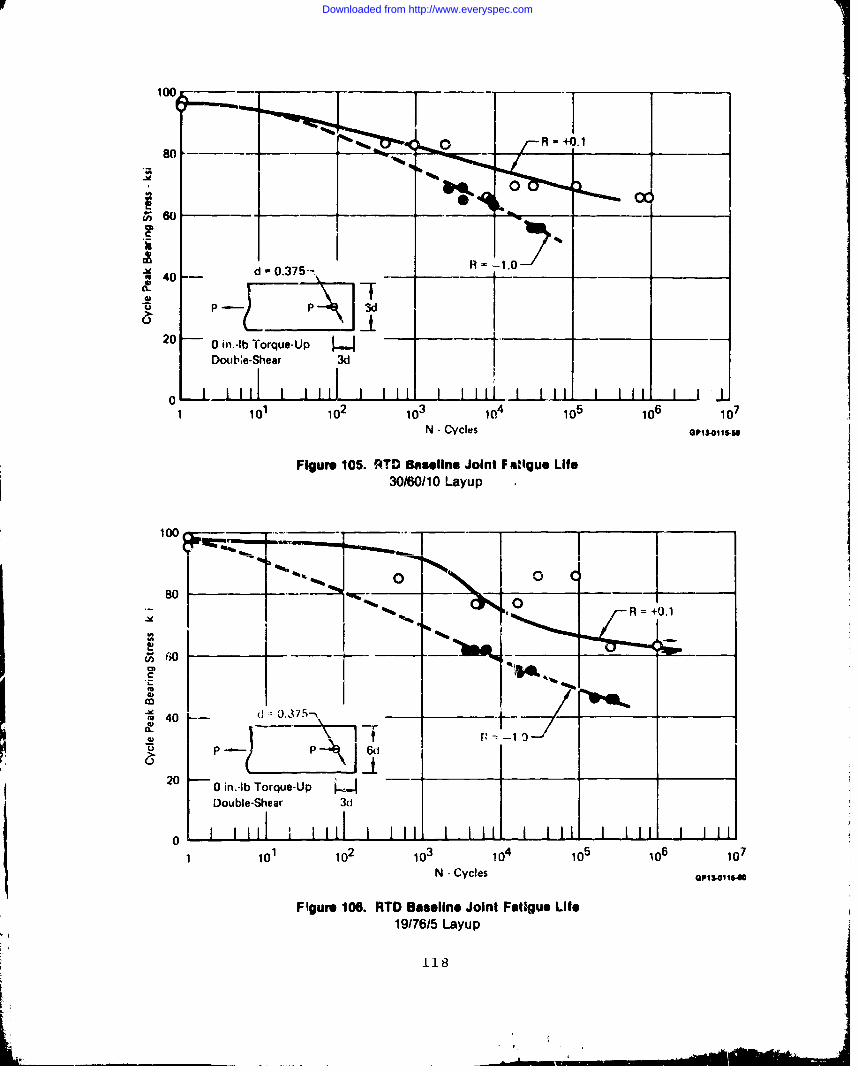
100
80
G1~O I __
60
S 40 d - 0,375-"
C--,20 0 in.-lb Torque-Up
Double-Shear 3d
0 WL llL I 1 L1 I I_ I I I I I I 1 11 101 102 103 104 105 106 107
N - Cycles
Figure 105. RTD Baseline Joint F atigue Life30/60/10 Layup
.+0.
20
""V- -
2 0 in.-lb Torque-Up
Double-Shear 3d
0 dJW1 101 102 103 104 105 106 107
N - Cycles OP1S-0115ee
Figure 106. RTD Baseline Joint Fatigue Life19/7615 Layup
118
Downloaded from http://www.everyspec.com

1001 /76/5 Laoup
ZL /-30/60 /10 Layup80 50/40/10
"• •' Layup
wS60
~40
20 0 in.-lb Torque-Up I. -
Double-Shear 3d
0 1 1 1 1 I ! 1 I II 1 1 , I I I I1 101 102 103 104 105 106 107
N - Cycles
Figure 107. Comparison of R : + 0.1 Joint Fatigue Life Trends
100
80
-- 0 30/60/10 Layup
U..60
o d 0.375 19/76/5 Layup
S40 -_ _
20 0 in.-lb Torque-Up 33d
Double-Shear
01 101 102 103 104 105 106
N - Cycles
Figure 108. Comparison of R = -1.0 Joint Fatigue Life Trends
119
Downloaded from http://www.everyspec.com

In order to evaluate the rate of hole elongation in compos.-ite joints, the hole elongation data at R -+0.1 is summarized inFigures 109, 110, and 111 for three levels of hole elongation(.005, .010, and .020 inch). These data indicate that the matrix-dominant 19/76/5 layup exhibits earliest initiation of holeelongation, but had the most gradual rate of accumulationi.Cuoiversely, the fiber-dominant (50/40/10) layup exhibited themost-delayed initiation of hole elongation, but had the mostrapid accumulation. The 30/60/10 layup exhibited an intermediateperformance. However, hole elongation arid associated damage inall three layups resembled bearing failure modes as shown inFigure 112, indicating a possible common matrix failure mechanismwith di.ffe:ences in initiation time and accumulation resultingfrom fiber layup effects.
80
CL
l20 Ai020in.
1 101 102 10 10 15 0 io6 ,N -Cycles OP13-011541
Figure 109. Hole Elongation Fatigue Life Trends50/40/10 Layup
"120
Downloaded from http://www.everyspec.com

60
CHole Elcongation 0.005-
*m 40
> P P 6d
200 in.-Ib Torque-Up [.Double-Shear 3d
0 101 1 1o 111
N - Cycles GP"14
Figure 110. Hole Elongation Fatigue Life Trends30/60/10 Layup
100
60
Hole Elongation =0.005
(1 0.375
0 rin-lb Torque-Up1-Double-Shear 3(d
111 i2 3 4o o6 7N - Cycles PS014
Figure 111. Hole Elongation Fatigue Life Trends
19/76/5 Layup
121
Downloaded from http://www.everyspec.com

50/40/10 Layup 30/60/10 Layup
127J
----1- -0
-I-
19/176/5 Layup
0P13.01 15-U
Figure 112. Representative Specimen Fatigue Failures
1 22
Downloaded from http://www.everyspec.com

Spectrum fatigue tests were conducted for the 50/40/10,30/60/10, and 19/76/5 layup with test limit load (TLL) defined at
89%, 93%, and 94% of static strength respectively. The resultsof these tests showed no measurable hole elongation for any ofthe tested layups after testing equivalent to 16,000 spectrumservice hours. Further, fo: tests with TLL defined at 73%, 87%,and 89% of static strength, no hole elongation was observed after32,000 spectrum service hour7s. The differences between constantamplitude results and spectrum results are attributed I , theinfrequent application of loads high enough to produce.. holeelongation in any of the three layups tested.
Spectrum fatigue life of the 50/40/10 layup was determinedunder the RTW, ETW, and RTW(TS) test conditions to identify envi-ronmental effects. These results are summarized in Figure 113.Hole elongation was greater for the RTW condition as compared toth2 RTD condition for test limit load levels above 95% of staticsti..-ngths with otherwise similar performance belcw that loadlevel. The RTW(TS) tests produced greater hole elongation thanthe RTD tests for all TLL above 85% of static strengths; however,the performance of the RTW and RTW(TS) tests is not. distinguish-able from the test data. All residual strengths were greaterthan RTD static strength.
Spectrum Hole Elongation (in.) After Fatigue Cycling JointTest etum @ TLL (As a Percent of Static Strength) StaticH ours - Streng th
Conditions Cycled TLL@75% 75-85% 85-95% >95% Stet
50/40/10 <16,000 - (F) J (F)
RTW 16,000 - 0.000 0.0 "0 0.088 7,250
Residual Strength - 8,560 8,670 8,0110
50/40/10 <16,000 - (F)•RTD 16,000 - 0.0002 - 0.0006 0.03 -0.046
16,000- 32,000 - (F) I - 7,530
32,000 0.000 - 0.006 - 0.035
Residual Strength 8,980 - 8,080 9,240
50/40/10 <16,000 -
ETW 16,000 - 0.0006 - 0.0012 0.000 0.0008 4,210
Residual Strength* - 8,660 7,540 8,540
50/40/10 <16,000 - (F)$ (F)
RTW (TS) 16,000 - 0.003 -0.004 0.03 - 0.059 0.053 7,020
Residual Strength - 9,140 8,150 8,650
(F) Specimen failure occurred in some joints tested OPIS-011544
* Rusidual strength tests at RT-- No test
Figure 113. Summari of Effects of Environment on Joint Spectrum Fatigue Life
123
Downloaded from http://www.everyspec.com

The spring rates of the test specimens for the 50/40/10layup were also determined at various times in the constantamplitude fatigue testing to determine correlation with holeelongation data. Hole elongation data for this layup at RTD,shown in Figure 114, are similar in threshold points and trendsto joint spring rate data summarized in Figure 115.
0.05
0.04
Cycle Peak c 82 1 ksi 70.6 ksi 64.2 ksiBearing StressS 0.03 -- ---- __-'-- __ • __-"-' _ __ __
0.03
0
UJ 0.02 6d
N - Cycles oles.
Figure 114. Effect of R =+ 0.1 Loading on Hole Elongation
Baseline 50140110 Layup
I/
124
1 1 1 1 1 1 1
Downloaded from http://www.everyspec.com

500
400 -
- 3 Cycle PeakBearing Stress (ksi) = 82.1 ksi 70.6 k•, 64.2 ksi
d 0.375__ _ _ __ _ __ _ _
(n PP6
1 L - Double-Shear0 in.-lb Torque-Up 3d
I I 1 I IiII I I I I I I I l i I
101 102 10 10 10 10 10N - Cycles
Figure 115. Effect of R = + 0.1 Loading on Joint Spring Rate50/40/10 Layup
(2) Stacking Sequence - Tests were conducted to determinethe effect of stacking sequence changes on the joint fatigueperformance of the 50/40/10 and the 19/76/5 layups. Stackingsequence evaluations compared joint life when laminates had +450plies grouped in a balanced pair as compared to when +450 plieswere uniformly dispersed. In Task 2 testing of the 50/40/10layup, all alternate stacking sequences which grouped either the0° plies or the +45* plies exhibited lower static strength. The0° ply effect was expected; the purpose of these tests was todetermine whether the unexpected effect of the +45° ply groupingwould extend to fatigue life.
Results obtained under constant amplitude cycling of R =+0.1 and R = -1.0 are presented ir Figures 116 and 117 for the50/40/10 and 19/76/5 layups respectively. For the 50/40/10layup, a comparison of static strength data indicated the testedstacking sequence (variation 3, reference Figure 26) failed atapproximately 6% lower strengths. No significant difference instatic strength was evident between the 19/76/5 baseline andvariation stacking sequence data. A comparison of joint fatiguelife with baseline data indicates no significant differences inlife under constant amplitude cycling (Figures 118 and 119).
125 i
Downloaded from http://www.everyspec.com

10
fpm
_mJim
20•0 ,n.-Ib Torque-Up I-.4
N - Cycles 0P13-O16-76
Figure 116. Effect of Stacking Sequence on Joint Life50/40/10 Layu p
126
Downloaded from http://www.everyspec.com

120
80
p 60
20-0 in.-lb Torque-Up i-,Double-Shear 3d
0 - 1i 1 1 I IH I I IH I i I IH J I I IH i I i i
1 101 102 103 104 105 106 107
N - Cycles oP13.o11s47
Figure 117. Effect of Stacking Sequence on Joint Life
19/76/5 Layup
127
Downloaded from http://www.everyspec.com

100
80
(n 60 04/
40 \19/76/5 Baseline
________6d______
20 0 in.-lb Torque-UpDouble-Shear
01101 10 10 10 10~ 101
N -Cycles PS012
Figure 118. Stacking Sequence -Comparison with R = 1.0 Baseline Life Trends
100
80
60
M 40
20 0 in.-lb Torque-UpDc'ible-Shear 3
1 101 102 10 0 105 106 10
N - Cycles
Figure 119. Stacking Sequence - Comparison with R + +0.1 Baseline Life Trends
128
Downloaded from http://www.everyspec.com
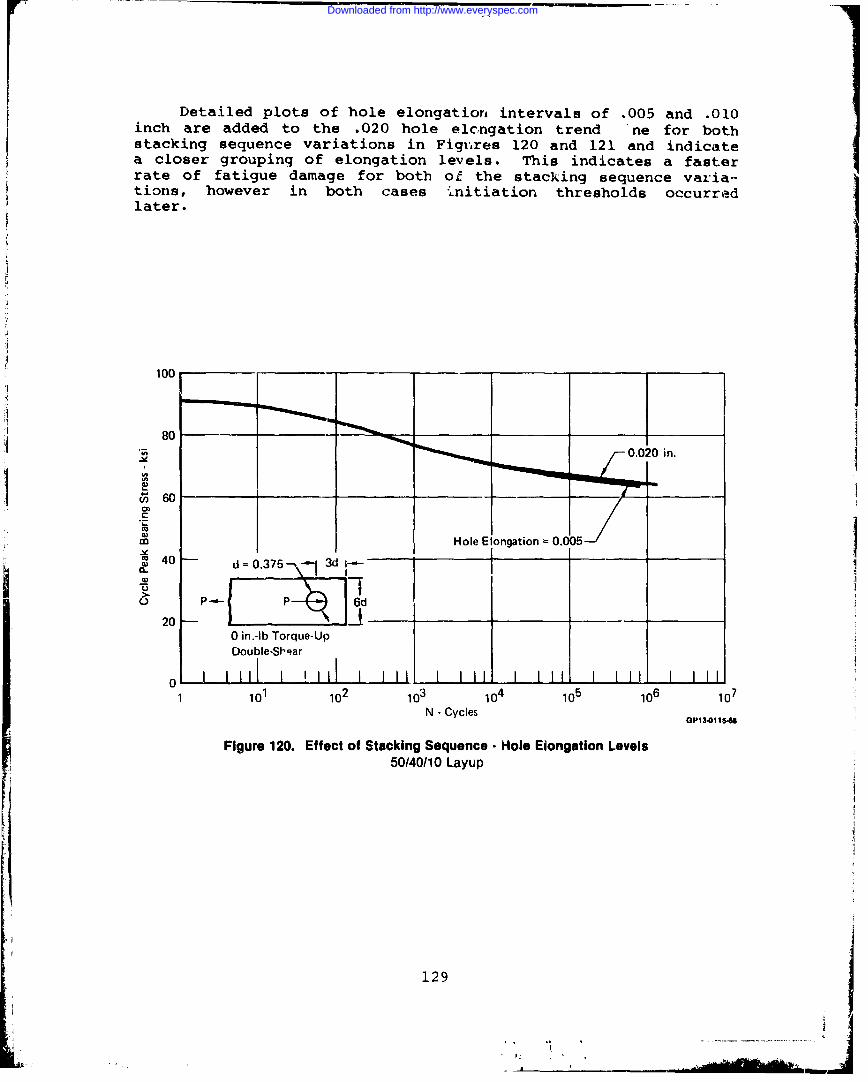
Detailed plots of hole elongation intervals of .005 and .010inch are added to the .020 hole elcngation trend ne for bothstacking sequence variations in Figulres 120 and 121 and indicatea closer groupinq of elongation levels. This indicates a fasterrate of fatigue damage for both of the stacking sequence varia-tions, however in both cases .initiation thresholds occurredlater.
100
80
40 d .375--' 3d "-
6d
200 in.-lb Torque-UpDouble-Sh'.ar
0 1 1 1 1 1 1 lii 1 I I I I IL L L1 1 I I 11 I I I
1 101 102 103 104 105 106 107N - Cycles
0P13-011545
Figure 120. Effect of Stacking Sequence - Hole Elongation Levels50/40/10 Layup
129
p. j
Downloaded from http://www.everyspec.com

LI100
80 _ _ _ __
HoHle Elongation 0.005
CO
P; P 6o
40ý20
0 in. -Ib Torque-UpDouble-Shear
01 101 102 103 104 105 106 107
N - Cycles
Figure 121. Effect of Stacking Sequence - Hole Elongation Levels19176/5 Layup
Effects of spectrum fatigue loading on joint life were simi-lar in all respects to baseline data. Results of hole elongationand residual strength after cyclic exposure are listed in Figure122. No sensitivity of life or strength was indicated.
(3) Torque-Up - To evaluate the effect of fastener torque-up on joint life, double-shear specimens of the 50/40/10 and19/76/5 layups were cycled at room temperature, dry, test condi-tions under constant amplitude tension-tension (R = +0.1) andtension-compression (R = -1.0) loadings, and under spectrumfatigue loading. Task 2 testing to determine the effects oftorque-up on joint strength indicated that both strength and fail-ure mode are altered at 0.0 in-lbs torque-up as compared totypical 160 in-lb torque values for .375 inch diameter fasteners.
130
Downloaded from http://www.everyspec.com
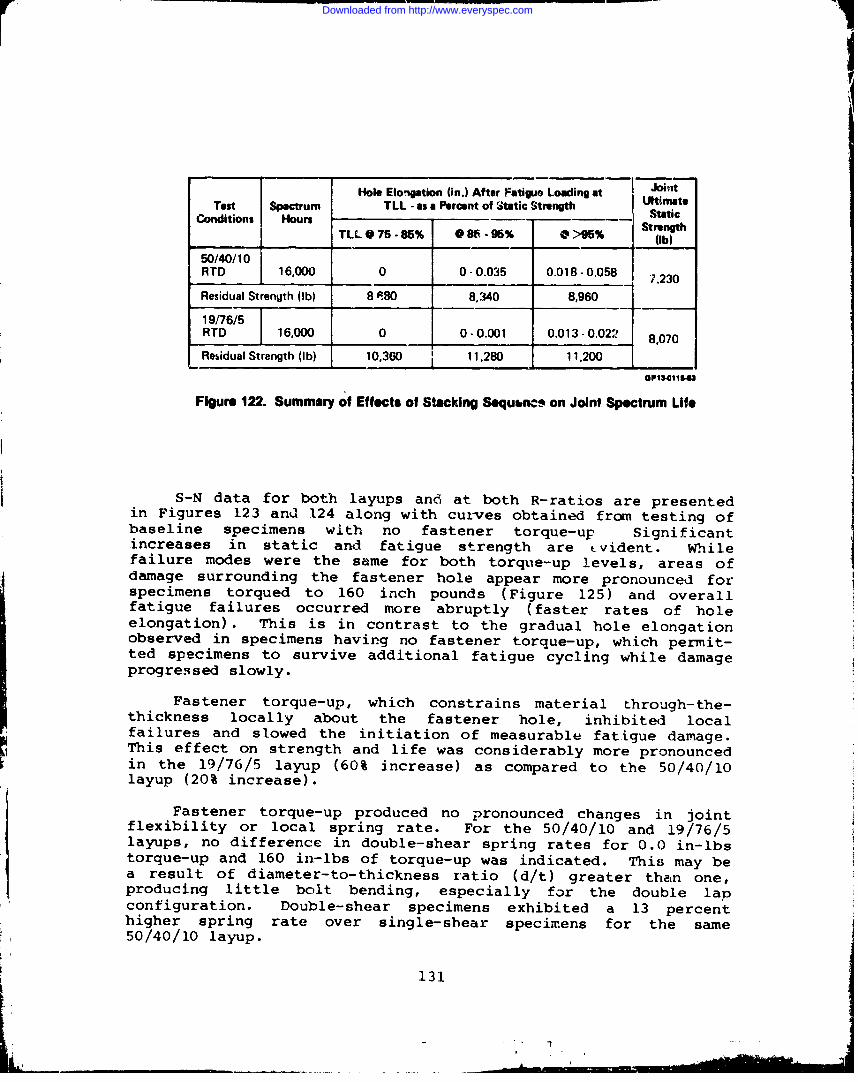
IJoint
Hole Elongation (in.) After Fatigue Loading at joint
Test Spectrum TLL -as a Percent of Static Strength Ltimate
Conditions Hours Static
TLL @ 75 - 85% "1 -96% 0 >96% (Ib)
50/40/10RTD 16,000 0 0-0.035 0.018- 0.058 7,230
Residual Strength (Ib) 8 M80 8,340 8,960
19/76/5RTD 16,000 0 0- 0.001 0.013 -0.022 8,070
Residual Strength (Ib) 10,360 11 11,280 11,200
Figure 122. Summary of Effects of Stacking Sequbncs on Joint Spectrum Life
S-N data for both layups and at both R-ratios are presentedin Figures 123 and 124 along with curves obtained from testing ofbaseline specimens with no fastener torque-up Significantincreases in static and fatigue strength are trvident. Whilefailure modes were the same for both torque-up levels, areas ofdamage surrounding the fastener hole appear more pronounced forspecimens torqued to 160 inch pounds (Figure 125) and overallfatigue failures occurred more abruptly (faster rates of holeelongation). This is in contrast to the gradual hole elongationobserved in specimens having no fastener torque-up, which permit-ted specimens to survive additional fatigue cycling while damageprogressed slowly.
Fastener torque-up, which constrains material through-the-thickness locally about the fastener hole, inhibited localfailures and slowed the initiation of measurable fatigue damage.This effect on strength and life was considerably more pronouncedin the 19/76/5 layup (60% increase) as compared to the 50/40/10layup (20% increase).
Fastener torque-up produced no pronounced changes in jointflexibility or local spring rate. For the 50/40/10 and 19/76/5layups, no difference in double-shear spring rates for 0.0 in-lbstorque-up and 160 in-lbs of torque-up was indicated. This may bea result of diameter-to-thickness ratio (d/t) greater than one,producing little bolt bending, especially for the double lapconfiguration. Double-shear specimens exhibited a 13 percenthigher spring rate over single-shear specimens for the same50/40/10 layup.
131
L _!
Downloaded from http://www.everyspec.com

140
""16 Iline)z / _ in -b To--. -1.o
400
1 101 102
N - Cycles
Figure 123. Effect of Torque-Up on Joint Fatigue Life50/40/10 Layup
132
Lobe-ha 3d__ _mnfal~
Downloaded from http://www.everyspec.com

20
0 Specimen failure t•curred10 in.-lb Torque-Up
160 - -[__ __ - -- - _ __ -
ML
0 pi ' R =+0.1
e0 in.-S b Torque-Up020
101 102 103 =4105 10610
CL 80d 0.375
P TN _WINcle
P 6d "80P1 R-=110-71
40 Ri. - R-1.0 - (Baseline) -
[Doube.S I(Baseline)
1 101 10 2 10314 051 o6 1
N - Cycles
Figure 124. Effect of Torque-Up on Joint Fatigue Life19/76/5 Layup
133
Downloaded from http://www.everyspec.com

(a) 0 in.-Ib Torque Up (b) 160 in.4b Torque-Up
50/40/10 Layup
(c) 0 in.-Ib Torque-Up (d) 160 in.-Ib Torque-Up
19/76/5 LayupUP13-01oi 5-88
Figure 125. Specimen Failures for Torque-Up Conditions
134• _
Downloaded from http://www.everyspec.com

(4) Joint Geometry - The effects of specimen geometry onioint life were evaluated by testing specimens of the 50/40/10and 19/76/5 layups with different edge distances and widths. Instatic tests, these variations resulted in changes in jointstrength and failure mode. Associated nonlinear joint load-deflection character and static failures in bearing or shearout,as compared to net tension, might alter the fatigue performancea- well.
Results for the baseline 50/40/10 layup, in which 4d and 3dedge distances as well as 4d and Gd specimen widths were tested,are summarized in Figure 126. These results indicate virtuallyidentical static and fatigue strength for this layup. Fatigueand static failures were similar for this fiber-dominant layupand did not change with geometry variations.
100
e/d = 480 ___
'•N~eld= 3-ý• aU-) 60 -,-Y
, 40 p- - 4d '"
0 0 in.-lb Torque-Up
20 Double-Shear
W• Specimen failure occurred
0 1 1 ,J I i . I 1 [ 1 1 - I 1 1 . 1 1 1 1 . 1 1 1 1 . 1 1 L 6 7
S1' 2 04 10 in6 10N - Cycles
kIOPIS-O115-12
Figure 126. Effect of Geometry on Joint Fatigue Life50140/10 Layup
Results for the matrix-dominant 19/76/5 layup, in whichvar-iations of specimen widths at 4d and 3d were tested (Figure127), indicate a pronounced effect on fatigue life. Further, achange of failure fro-a bearing to net section occurred as the w/dratio was reduced as shown in Figure 128.
135
I
Downloaded from http://www.everyspec.com

F..
100 T____
80 d4
G LI g
(n 60
0 in.-lb Tocique-Up / 3
Double-Shear
40 0.375~ d~ .3d
10 12 13 14 1 06 17Np- Cycles
I
Figure 127. Effect of Geometry on Joint Fatigu. Life19/76/5 Layup
136
Downloaded from http://www.everyspec.com
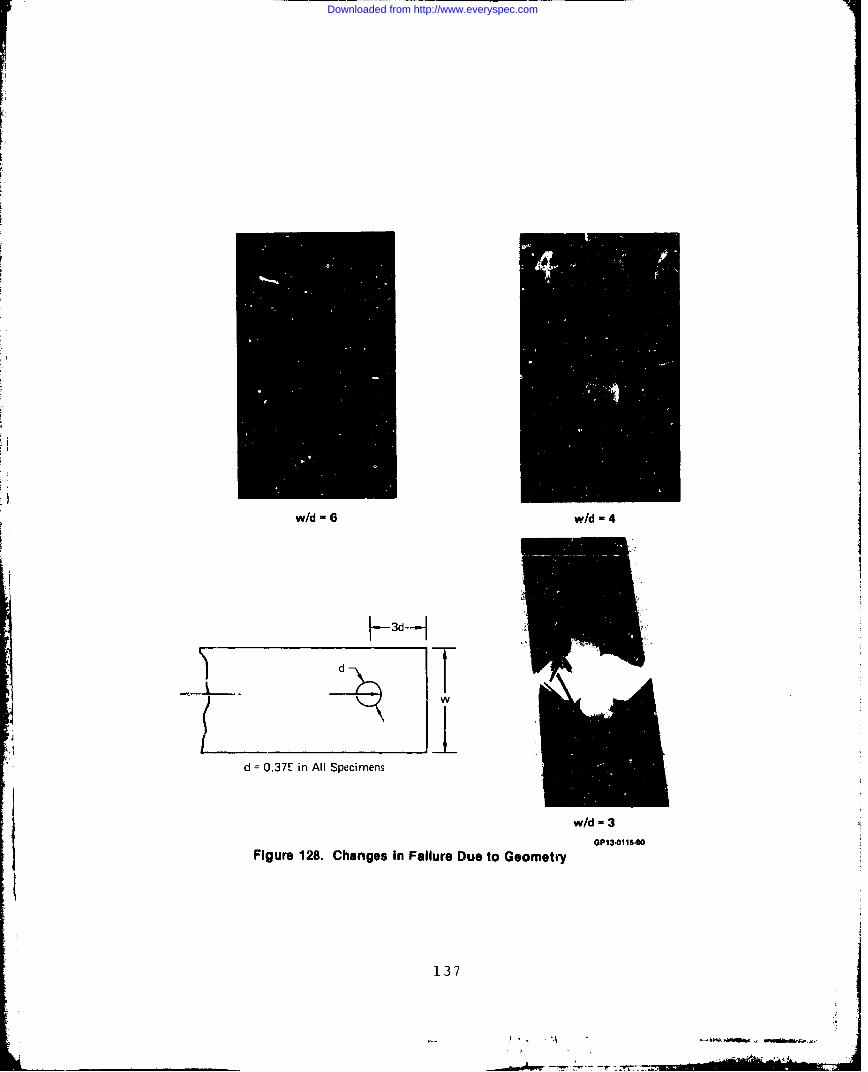
w/d =6 w/d 4
dlw
d 0.37E in All Specimens
w/d -3
GP13-O1IIgoFigure 128. Changes In Failure Due to Geometry
137
A'
Downloaded from http://www.everyspec.com

(5) Interference Fit - This series of fatigue tcsts were
conducted to evaluate the effect of interference fits of .005inch on the fatigue life of no-torque and torqued joints. InTask 3 testing, interference fits of .003 and .008 inch producedan increase in static strength (up to 14%) over neat-fit speci-mens; however, evidence of localized cracking and delaminationwas noted as well. Task 4 tests were to evaluate the effects ofthese characteristics on fatigue life.
Static strengths of specimens without torque-up were 7.5%higher than baseline (neat-fit) specimens. These data were con-sistent with earlier Task 3 data.
Fatigue tests, R = +0.1, of no torque-up specimens resultedin lower fatigue life relative to neat-fit baseline data. Dataare summarized in Figure 129. Associated with lower life waslarge test data scatter. It was suspected that minor installa-tion damage caused by the interference fit produced the widescatter in data when no through-the-thickness constraint existeddue to zero fastener torque-up. Limited fatigue testing oftorqued-up specimens (160 in-lb) produced higher fatigue liferelative to neat-fit specimens with the same installation torque,Two specimens were tested at 85% and 94% of the neat-fit staticstrength, respectively. Both showed fatigue improvements rela-tive to baseline data (Figure 129) with no hole elongationrecorded at the 85% load level after 106 cycles.
(6) Single-Shear Loading - The effects of joint eccentrici-ties on fatigue life were evaluated using a single-shear specimenconfiguration (Reference Figure 23). Two types of fastener headconfigurations were tested; protruding head and countersunktension-head. As-manufactured specimens were tested undertension-tension, R = +0.1, fatigue loading at room temperature.All specimens were torqued to 160 in-lbs for comparison to datafrom torqued-up double-shear specimens.
Effects on joint life are illustrated in Figure 130. Forthe protruding head single-lap configuration, static strengthswere identical to the double shear configuration. However, theadded effect of bending stresses due to the single shear confi-guration indicates a significant reduction in fatigue life.Further- fatigue life reductions were exhibited by the countersunkfastener with its associated loss of direct bearing material andadded fastener head flexibility. Joint spring rates for thedouble-shear, noncountersunk single-shear, and countersunk single--shear specimens were respectively 396,000 lbs/in, 347,000 lbs/in,and 250,000 lbs/in. Representative failures for the threespecimen configurations are shown in Figure 131.
138
p4
Downloaded from http://www.everyspec.com

* 160 mn.-Ib torque-up
o No torque-up
120-
Baseline 160 in.-tb Torque-Up (Neat F it)100 • , • /-Baseline 0 in.-Ib Torque-Up
(Nat Fit)
m"•.u:• •' • "-Id =0.375-\ )•• -- • 0( "
A!
0
40 Doube-Shear --3d
0.
110 1 102 103 104 105 106 107
N - C y c les O I 1 5 7
SG 1301 s7
Figure 129. Effect of 0.005 In. Interference Fit on Joint Fatigue Life50440/10 Lay0 p
C--3
3d.39
__ " m •0
Downloaded from http://www.everyspec.com

140
Protruding HID. Fouble-SihearSingle-Shear R=+0.1 /R=+0.1
6001 T peFSingle-Shear
180 R=+1.1 '
-u 60 d =0.375
PN -A CcleFigre13. Efe t ofSnl-harLaigo JonaigeLf40401 Lau
100 in.-Ib Torque-Up 3d [ < Specimem Failure Occured
214
1 10 10 10 10 10 10 10iN - Cycles
Figure 130. Effect of Single-Shear Loading on Joint Fatigue Lifg
50/40/10 Layup
140
Downloaded from http://www.everyspec.com

(a) Single-Shear (b) Single-ShearProtruding Head Countersunk
I I
I I
4 -J
160 in.-lb Torque-Up
(c) Double-Shear
GP13.0115-91
Figure 131. Failures of SingleShear Specimens
141
_ _ _ _ _ _ _ _ _ _- ~ -
Downloaded from http://www.everyspec.com

(7) Porosity - Tests of specimens with moderate porositywere conducted to evaluate the effects of this anomaly on jointdurability. Testing, in Task 3, indicated that moderate levelsof porosity had a minor effect on static joint strength at roomtemperature. Specimens with moderate porosity in regions offastener holes were tested under R = +C.1 and R = -1.0 fatigueloadings at room temperature dry conditions. Life data is com-pared in Figure 132 with baseline data. No reduction of stat'cstrength or joint fatigue life was indicated.
120
with Porosity -
240 __'_-'
2:00
0 in.-lb Torque-Up
Double-Shear 3d
0 .JI lI I I II I ! II I I 1.L..J.1 .....L LLI I l 1 1 1 I
N - Cycles GPIS.O11B.4
Figure 132. Effect of Porosity on Joint Fatigue Life50/40/10 Layup
142
I. 60
Downloaded from http://www.everyspec.com

SECTION V
RECOMMENDATIONS
Based on the results of this program, which were summarizedin Section II, several areas of future methodology developmentand experimental verin (•axion are recommended.
The analysis procedure developed in this program sextended to analyze the general class of stress risers in compo-site structures. Overall geometry and stress concentrationinteractions (e.g. multiple fastener holes) should be included.Experimental evaluations should be performed to virify developedmethodology, with emphasis placed on multifastener j-iints.
The analysis procedure developed in this program should alsobe extended to predict the effects of through-the-thicknessvariables, such as stacking sequence, fastener torque-up, andjoint eccentricity. These variables were shown by tests in thisprogram to have a pronounced effect on static and fatigueperformance. The improved methodology should be verified bytest. The extended analysis technique would permit applicationof the methodology to a broader range of joint designs.
Hole elongation mechanisms and their relation to jointfatigue life should be further studied. Analytic techniquesshould be developed to identify critical plies, failure loca-tions, and failure modes for both hole elongation and overallfatigue life. Developed methodology should incorporate thecapability to predict effects of finite joint geometry andthrough-the-thickness variables. An experimental verificationprogra-m should be conducted to verify the developed methodologyfor fatigue and hole elongation predictions.
143
S -
Downloaded from http://www.everyspec.com

r!
SECTION VI
REFERENCES
I. S. P. Garbo, and J. M. Ogonowski, "Effect o4 Variances andM.-anufacturing Tolerances on the Design Strength and Life ofý -chanically Fastened Composite Joints," Interim Report. 'FDL-TR-78-179, 1978.
2. B. Burroughs, et al, "Advanced Composite Serviceability",Rockwell International, F33615-76-C-5344, Quarterlies, 1976to Present.
3. S. G. Lekhnitskii, "Anisotropic Plates", Gordan and BreachScience Publishers, 1968.
4. J. P. Waszczak and T. A. Cruse, "A Synthesis Procedure forMechanically Fastened Joints in Advanced Composite Mater-ials", AFML-TR-73-145, Volume II, 1973.
5. J. M. Whitney and R. J. Nuismer, "Stress Fracture Criteriafor Laminated Composites Containing Stress Concentrations,"J. of Composite Materials, Volume 8, July 1974.
6. T. DeJong, "Stresses Around Pin-Loaded Holes in ElasticallyOrthotropic or Isotropic Plates", J. of Composite Materials,Volhune II, July 1977.
14411U.S.Government Printing Office: 1981 757h-002/591
Downloaded from http://www.everyspec.com