a2 economics revision - 1st class...
TRANSCRIPT

A2 Economics Revision
Bahrum Lamehdasht

© Bahrum Lamehdasht 2012 All rights reserved. No part of this publication may be reproduced, stored in a retrieval system or transmitted in any form or by any means, electronic, mechanical or photocopying, recording, or otherwise without prior permission of the publisher.
Contents
Microeconomics ....................................................................................................... pp.1-76
Theory of the Firm ................................................................................................................ pp.3-21 Revenue ................................................................................................................................ pp.3-7 Cost ....................................................................................................................................... pp.8-11 Economies of Scale ............................................................................................................... pp.12-19 Profit ..................................................................................................................................... pp.20-22 Objectives ............................................................................................................................. pp.23-25 Efficiency .............................................................................................................................. pp.26-28 Allocative Efficiency .............................................................................................................. p.26 Productive Efficiency ............................................................................................................ p.27 X-Inefficiency ........................................................................................................................ p.28 Pareto Efficiency ................................................................................................................... p.28 Barriers to Entry and Exit ..................................................................................................... pp.29-30 Contestability ....................................................................................................................... pp.31-32 Perfect Competition ............................................................................................................. pp.33-37 Monopoly ............................................................................................................................. pp.38-44 Oligopoly .............................................................................................................................. pp.45-51 Monopolistic Competition ................................................................................................... pp.52-55 Market Structure Summary ................................................................................................. p.56 Concentration Ratio ............................................................................................................. p.57 Monopsony .......................................................................................................................... p.58 Price Discrimination ............................................................................................................. pp.59-61 Why Firms Grow .................................................................................................................. pp.62-64 Methods of Competition ..................................................................................................... p.65 Reasons for Firms Making Profits ....................................................................................... pp.66-67 Competition Policy .............................................................................................................. pp.68-71 Microeconomic Definitions ................................................................................................. pp.72-76
Macroeconomics ..................................................................................................... pp.77-147
Aggregate Demand .............................................................................................................. pp.79-85 Consumption ........................................................................................................................ p.80 Investment ........................................................................................................................... pp.81-82 Government Spending ......................................................................................................... pp.83-84 Net Exports .......................................................................................................................... p.85 Aggregate Supply ................................................................................................................ pp.86-88 AD-AS Equilibrium ............................................................................................................... pp.89-90 Balance of Payments ........................................................................................................... pp.91-94 Monetary Policy ................................................................................................................... pp.95-101 Fiscal Policy .......................................................................................................................... pp.102-108 Supply-Side Policy ................................................................................................................ pp.109-112 Macro Policies: Targeting Objectives .................................................................................. pp.113-114 Taxation ................................................................................................................................ pp.115-118 Phillips Curve ........................................................................................................................ pp.119-121 Poverty and Inequality ........................................................................................................ pp.122-126 International Economics ...................................................................................................... pp.127-142 Foreign Trade ....................................................................................................................... pp.127-125 Protectionism ....................................................................................................................... pp.130-132
Exchange Rates .................................................................................................................... pp.133-135 International Competitiveness ............................................................................................. pp.136-138 Globalization ........................................................................................................................ pp.139-140 Monetary Union ................................................................................................................... pp.141-142 Macroeconomic Definitions ................................................................................................ pp.143-147
Development Economics .................................................................................. pp.149-181
Constraints on Growth and Development .......................................................................... pp.151-164 Poverty Cycle ........................................................................................................................ p.152 Population ............................................................................................................................ pp.153-154 Poor Human Capital ............................................................................................................. p.155 Poor Infrastructure .............................................................................................................. p.156 Civil War ............................................................................................................................... p.157 Corruption ........................................................................................................................... p.158 Foreign Exchange Gap ......................................................................................................... p.159 Foreign Debt ........................................................................................................................ p.160 Capital Flight ........................................................................................................................ p.161 Primary Product Dependency ............................................................................................. pp.162-163 Declining Terms of Trade ..................................................................................................... p.164 Routes to Growth and Development .................................................................................. pp.165-179 Harrod-Domar Growth Model ............................................................................................. p.166 Lewis Model ......................................................................................................................... pp.167-169 Human Capital Investment .................................................................................................. p.170 Multinational Companies ..................................................................................................... pp.171-172 Aid ........................................................................................................................................ p.173 Debt Relief ............................................................................................................................ p.174 International Monetary Fund and World Bank .................................................................... pp.175-176 Microfinance ........................................................................................................................ p.177 Tourism ................................................................................................................................ p.178 Fair Trade ............................................................................................................................. p.179 Development Economics Definitions .................................................................................. pp.180-181

1
Microeconomics

2
Microeconomics
Microeconomics looks at the decisions of individuals (consumers and producers) in the economy. At the heart of economics is scarcity and choices. Consumers, firms and the government must all make choices over scarce resources. For example, a consumer must choose how to allocate her scarce time, how long she should work and how much time she needs for leisure. Microeconomics is concerned with questions such as “What happens to demand for good X if the price of a substitute good rises”?, “Does the government need to stop people smoking in public”? and “Are there too many firms in the market”?
3
Theory of the Firm
A firm exists to make profit by selling output. Profit equals revenue minus costs. So a firm must look at its revenue and cost curves to maximize profits.
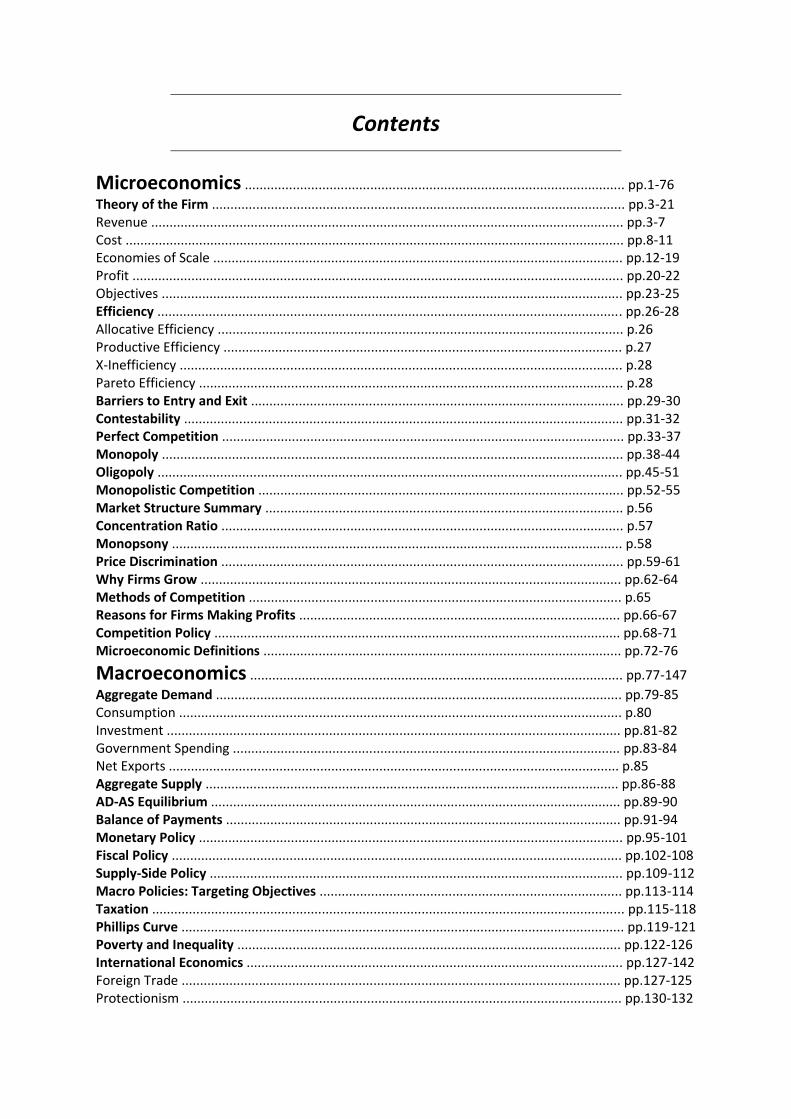
Revenue Revenue is money earned by a firm for selling its output. Total Revenue Total revenue (TR) is the total money earned by a firm for selling its output.
As price falls and output rises, TR rises, reaches a maximum point and then falls.
Total Revenue
TR is zero at the origin because . TR rises because as price falls, quantity rises more in proportion. TR is maximized at TR*. TR falls because as price falls, output rises less in proportion.
4
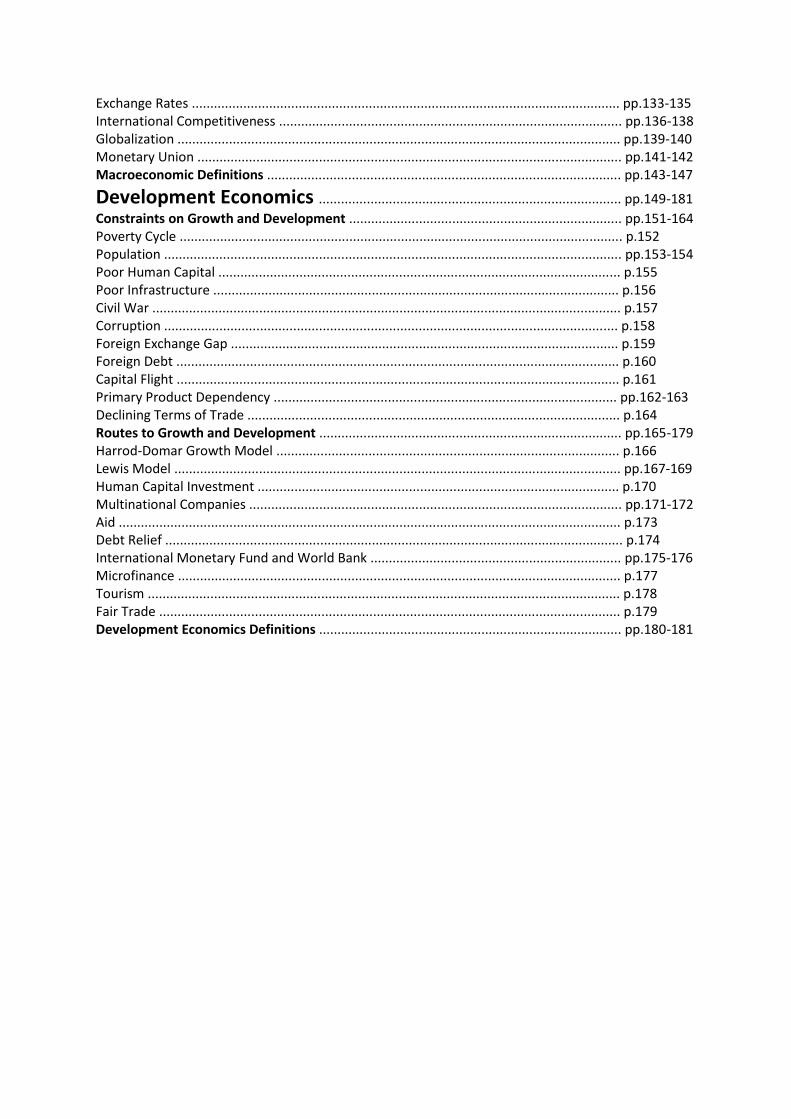
Average Revenue Average revenue (AR) is a firm’s revenue per unit of output.
so AR is the firm’s demand curve. AR shows the average price charged for each quantity of output. As price falls and output rises, AR falls.
Average Revenue
AR slopes downwards because prices must fall to induce an increase in quantity demanded.
5
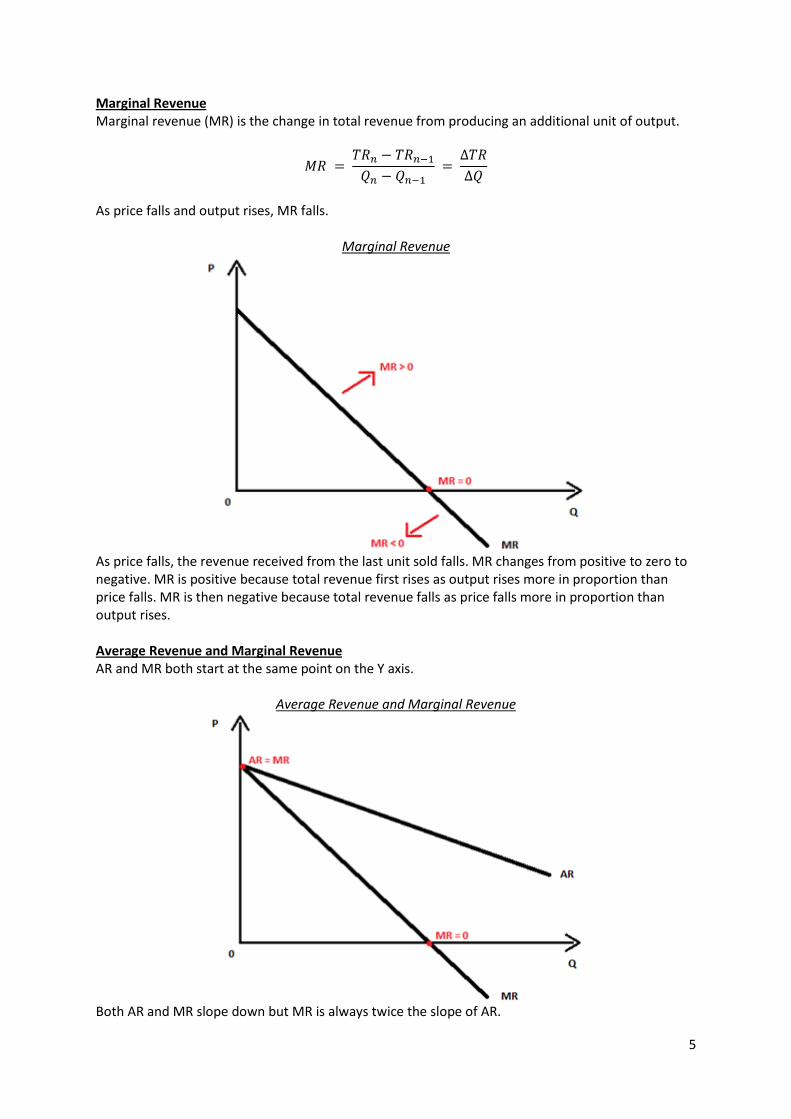
Marginal Revenue Marginal revenue (MR) is the change in total revenue from producing an additional unit of output.
As price falls and output rises, MR falls.
Marginal Revenue
As price falls, the revenue received from the last unit sold falls. MR changes from positive to zero to negative. MR is positive because total revenue first rises as output rises more in proportion than price falls. MR is then negative because total revenue falls as price falls more in proportion than output rises. Average Revenue and Marginal Revenue AR and MR both start at the same point on the Y axis.
Average Revenue and Marginal Revenue
Both AR and MR slope down but MR is always twice the slope of AR.
6
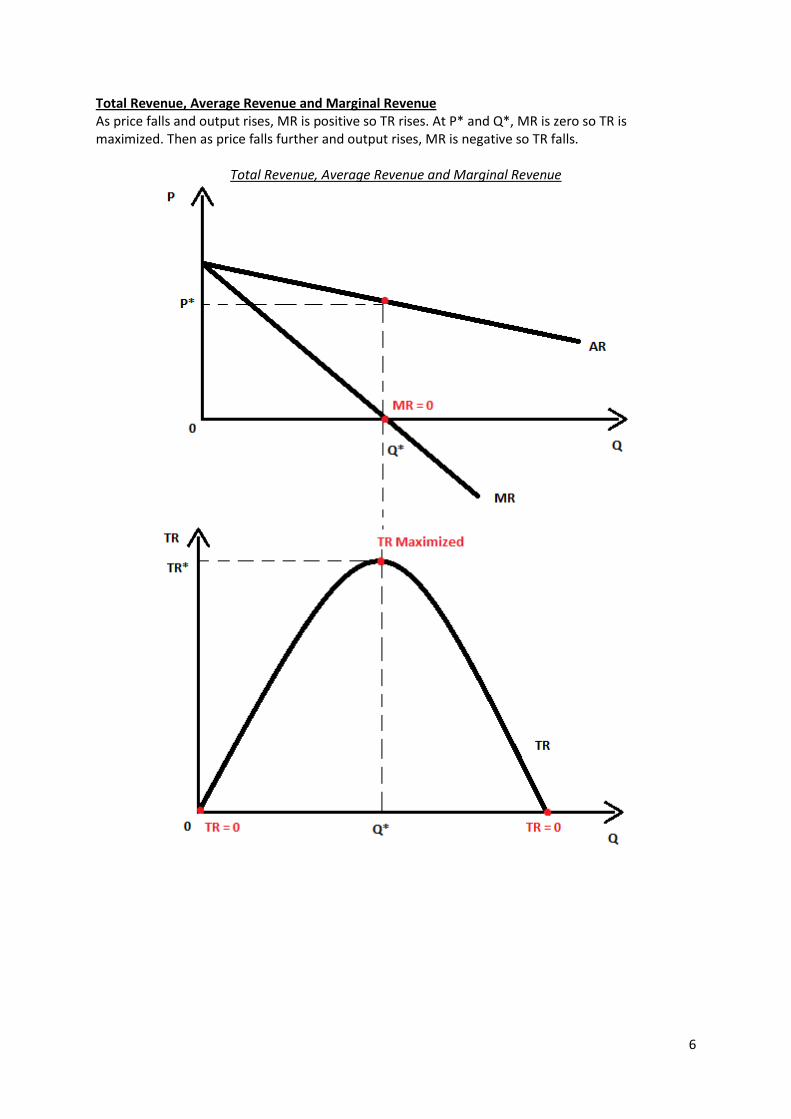
Total Revenue, Average Revenue and Marginal Revenue As price falls and output rises, MR is positive so TR rises. At P* and Q*, MR is zero so TR is maximized. Then as price falls further and output rises, MR is negative so TR falls.
Total Revenue, Average Revenue and Marginal Revenue
7
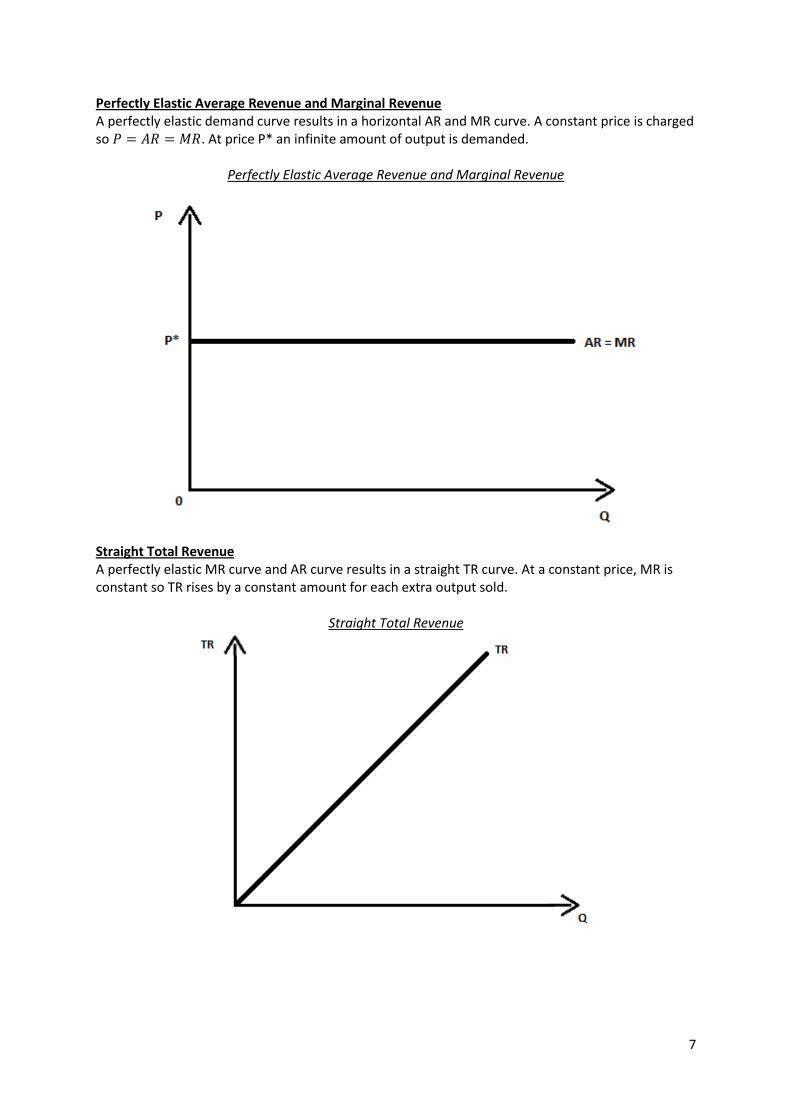
Perfectly Elastic Average Revenue and Marginal Revenue A perfectly elastic demand curve results in a horizontal AR and MR curve. A constant price is charged so . At price P* an infinite amount of output is demanded.
Perfectly Elastic Average Revenue and Marginal Revenue
Straight Total Revenue A perfectly elastic MR curve and AR curve results in a straight TR curve. At a constant price, MR is constant so TR rises by a constant amount for each extra output sold.
Straight Total Revenue
8
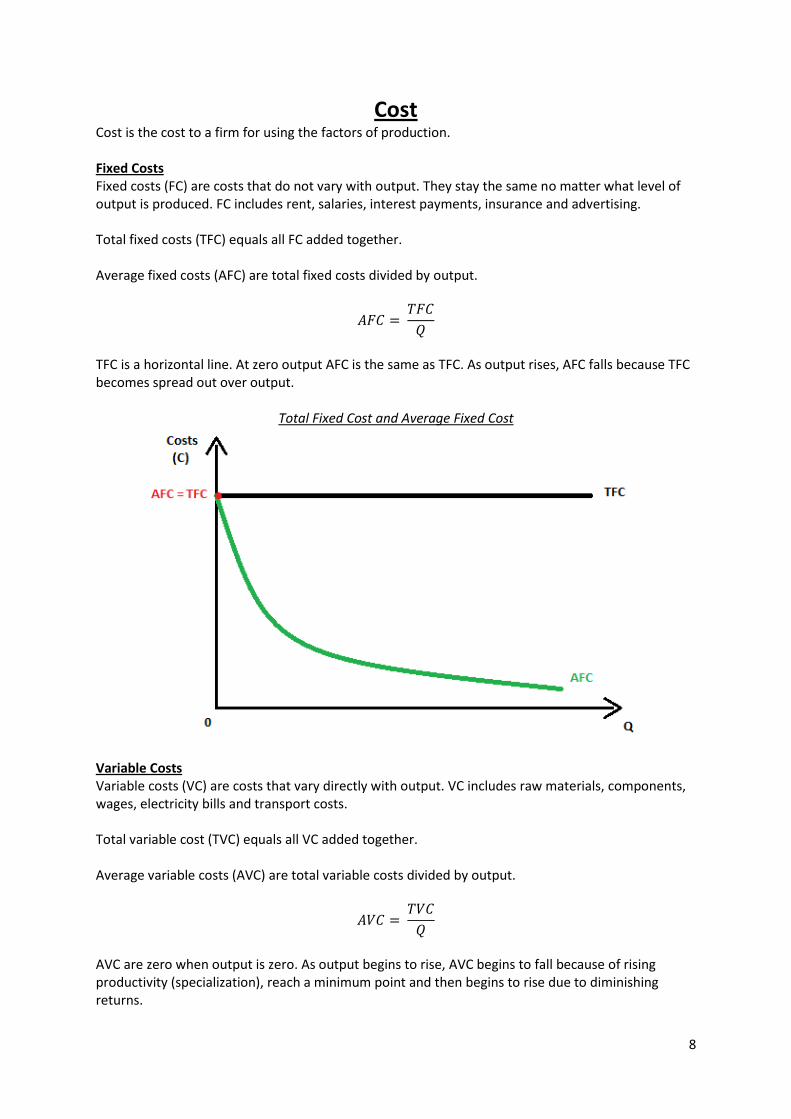
Cost Cost is the cost to a firm for using the factors of production. Fixed Costs Fixed costs (FC) are costs that do not vary with output. They stay the same no matter what level of output is produced. FC includes rent, salaries, interest payments, insurance and advertising. Total fixed costs (TFC) equals all FC added together. Average fixed costs (AFC) are total fixed costs divided by output.
TFC is a horizontal line. At zero output AFC is the same as TFC. As output rises, AFC falls because TFC becomes spread out over output.
Total Fixed Cost and Average Fixed Cost
Variable Costs Variable costs (VC) are costs that vary directly with output. VC includes raw materials, components, wages, electricity bills and transport costs. Total variable cost (TVC) equals all VC added together. Average variable costs (AVC) are total variable costs divided by output.
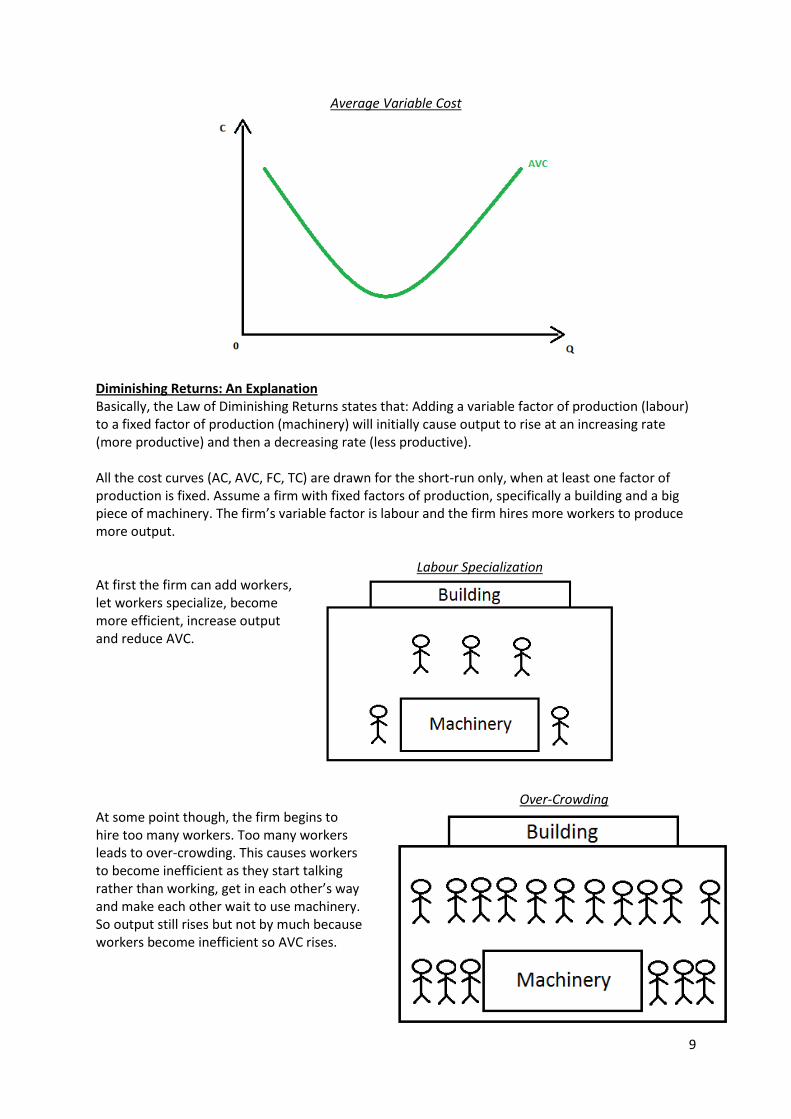
AVC are zero when output is zero. As output begins to rise, AVC begins to fall because of rising productivity (specialization), reach a minimum point and then begins to rise due to diminishing returns.
9
Average Variable Cost
Diminishing Returns: An Explanation Basically, the Law of Diminishing Returns states that: Adding a variable factor of production (labour) to a fixed factor of production (machinery) will initially cause output to rise at an increasing rate (more productive) and then a decreasing rate (less productive). All the cost curves (AC, AVC, FC, TC) are drawn for the short-run only, when at least one factor of production is fixed. Assume a firm with fixed factors of production, specifically a building and a big piece of machinery. The firm’s variable factor is labour and the firm hires more workers to produce more output. Labour Specialization At first the firm can add workers, let workers specialize, become more efficient, increase output and reduce AVC. Over-Crowding At some point though, the firm begins to hire too many workers. Too many workers leads to over-crowding. This causes workers to become inefficient as they start talking rather than working, get in each other’s way and make each other wait to use machinery. So output still rises but not by much because workers become inefficient so AVC rises.
10
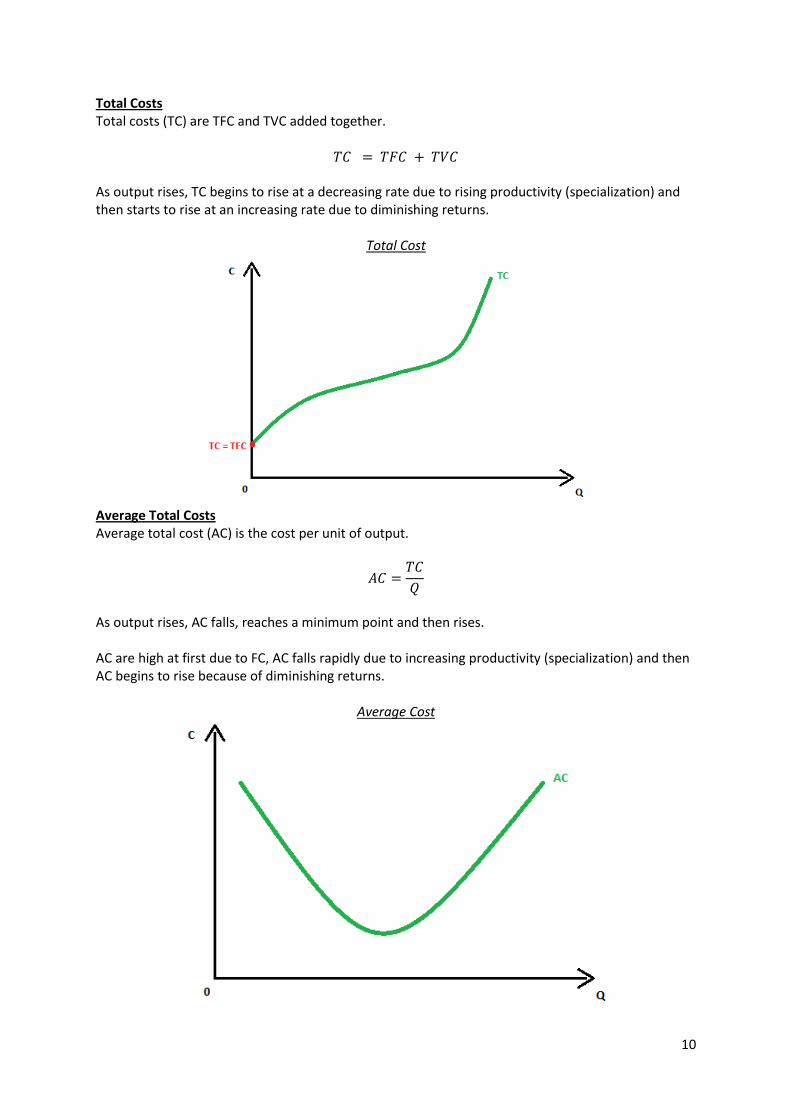
Total Costs Total costs (TC) are TFC and TVC added together.
As output rises, TC begins to rise at a decreasing rate due to rising productivity (specialization) and then starts to rise at an increasing rate due to diminishing returns.
Total Cost
Average Total Costs Average total cost (AC) is the cost per unit of output.
As output rises, AC falls, reaches a minimum point and then rises. AC are high at first due to FC, AC falls rapidly due to increasing productivity (specialization) and then AC begins to rise because of diminishing returns.
Average Cost
11
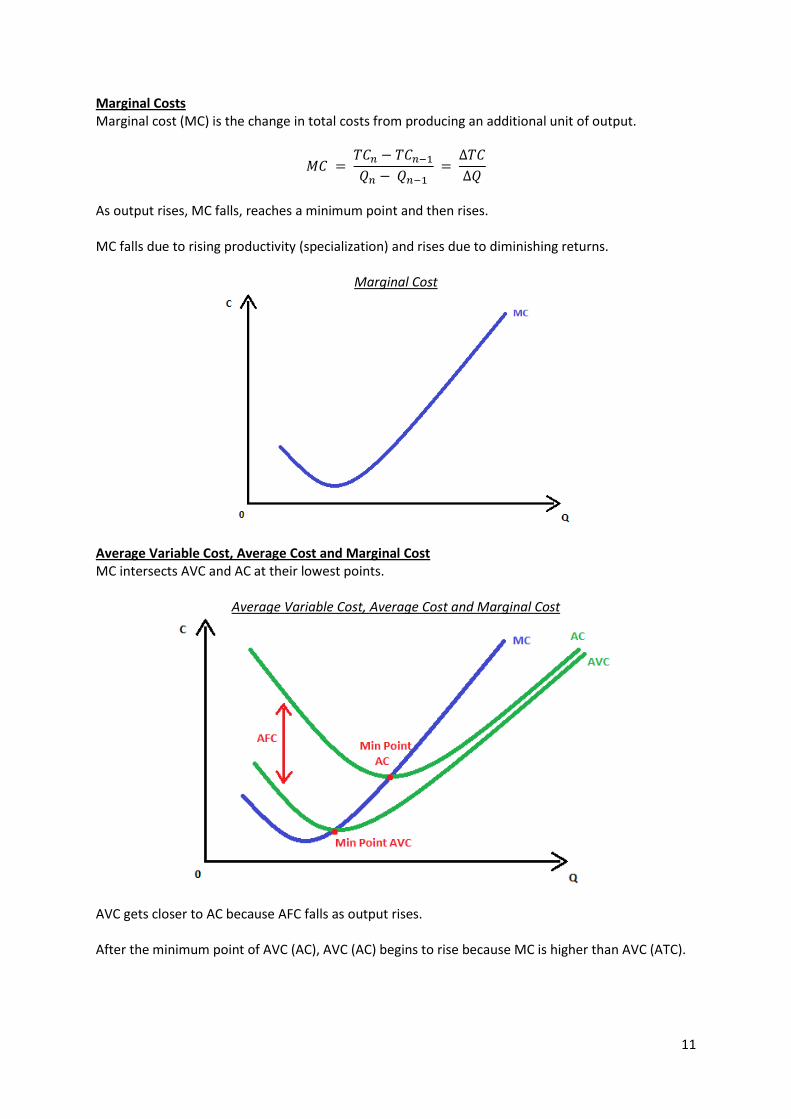
Marginal Costs Marginal cost (MC) is the change in total costs from producing an additional unit of output.
As output rises, MC falls, reaches a minimum point and then rises. MC falls due to rising productivity (specialization) and rises due to diminishing returns.
Marginal Cost
Average Variable Cost, Average Cost and Marginal Cost MC intersects AVC and AC at their lowest points.
Average Variable Cost, Average Cost and Marginal Cost
AVC gets closer to AC because AFC falls as output rises. After the minimum point of AVC (AC), AVC (AC) begins to rise because MC is higher than AVC (ATC).
12
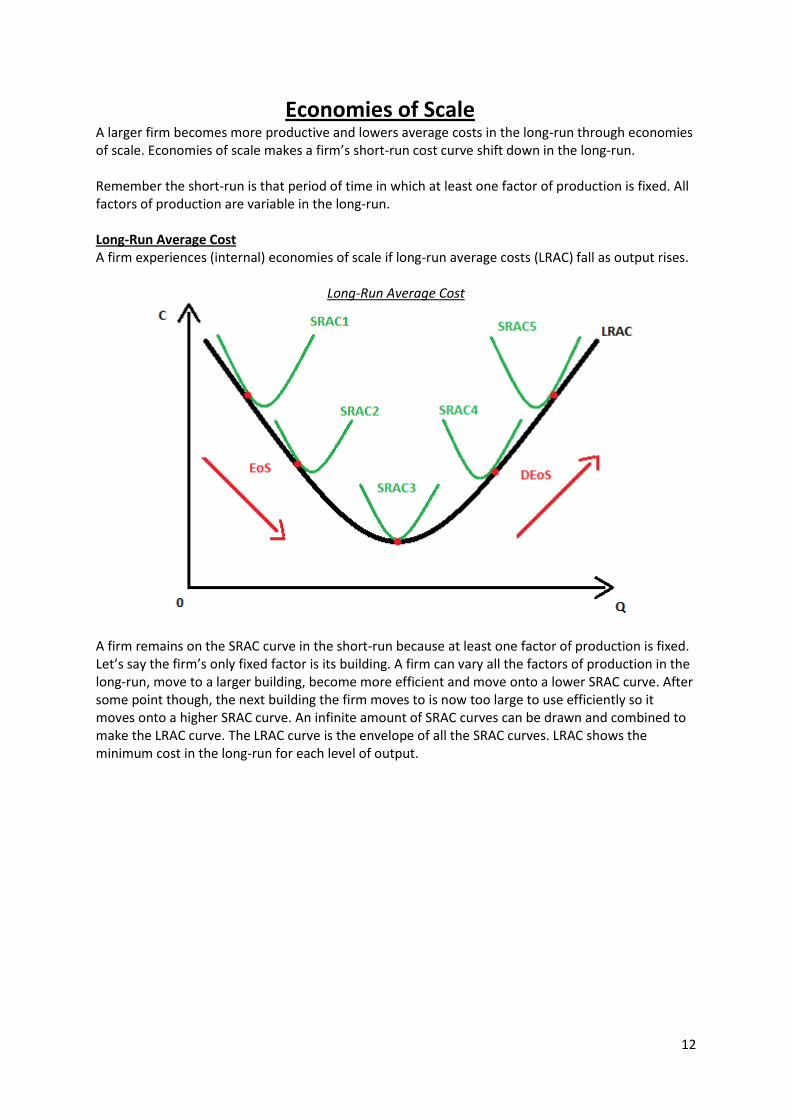
Economies of Scale A larger firm becomes more productive and lowers average costs in the long-run through economies of scale. Economies of scale makes a firm’s short-run cost curve shift down in the long-run. Remember the short-run is that period of time in which at least one factor of production is fixed. All factors of production are variable in the long-run. Long-Run Average Cost A firm experiences (internal) economies of scale if long-run average costs (LRAC) fall as output rises.
Long-Run Average Cost
A firm remains on the SRAC curve in the short-run because at least one factor of production is fixed. Let’s say the firm’s only fixed factor is its building. A firm can vary all the factors of production in the long-run, move to a larger building, become more efficient and move onto a lower SRAC curve. After some point though, the next building the firm moves to is now too large to use efficiently so it moves onto a higher SRAC curve. An infinite amount of SRAC curves can be drawn and combined to make the LRAC curve. The LRAC curve is the envelope of all the SRAC curves. LRAC shows the minimum cost in the long-run for each level of output.
13
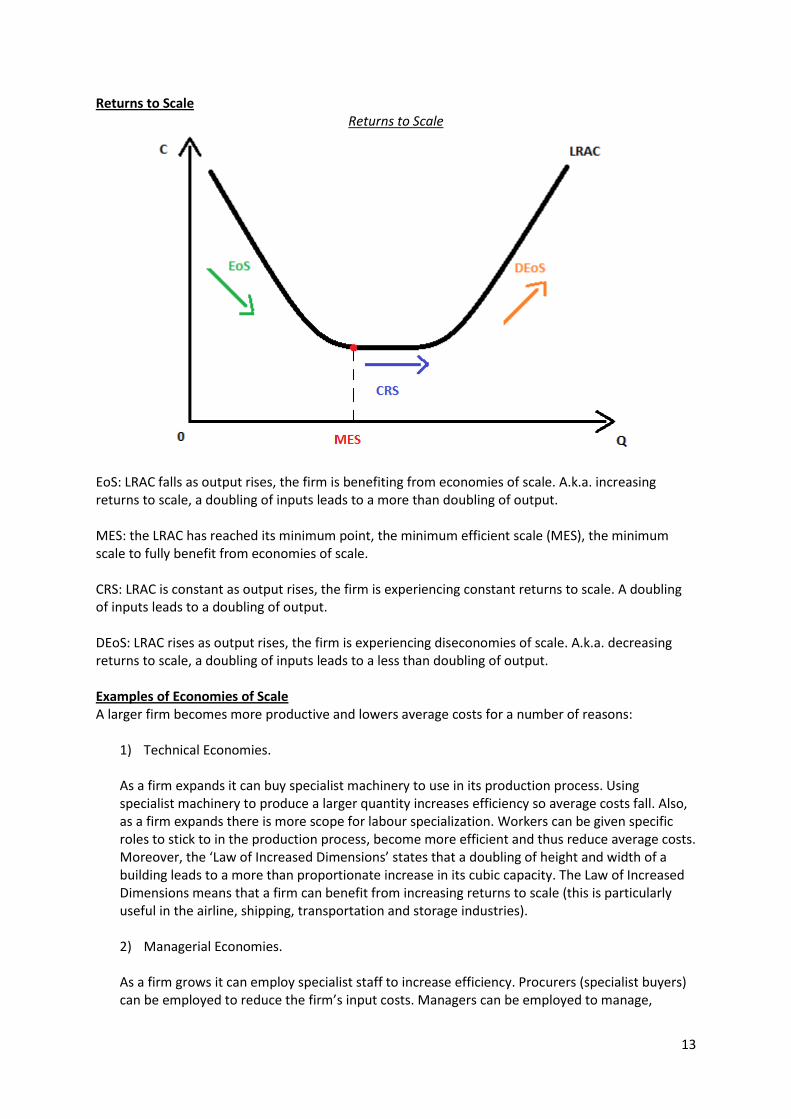
Returns to Scale Returns to Scale
EoS: LRAC falls as output rises, the firm is benefiting from economies of scale. A.k.a. increasing returns to scale, a doubling of inputs leads to a more than doubling of output. MES: the LRAC has reached its minimum point, the minimum efficient scale (MES), the minimum scale to fully benefit from economies of scale. CRS: LRAC is constant as output rises, the firm is experiencing constant returns to scale. A doubling of inputs leads to a doubling of output. DEoS: LRAC rises as output rises, the firm is experiencing diseconomies of scale. A.k.a. decreasing returns to scale, a doubling of inputs leads to a less than doubling of output. Examples of Economies of Scale A larger firm becomes more productive and lowers average costs for a number of reasons:
1) Technical Economies. As a firm expands it can buy specialist machinery to use in its production process. Using specialist machinery to produce a larger quantity increases efficiency so average costs fall. Also, as a firm expands there is more scope for labour specialization. Workers can be given specific roles to stick to in the production process, become more efficient and thus reduce average costs. Moreover, the ‘Law of Increased Dimensions’ states that a doubling of height and width of a building leads to a more than proportionate increase in its cubic capacity. The Law of Increased Dimensions means that a firm can benefit from increasing returns to scale (this is particularly useful in the airline, shipping, transportation and storage industries).
2) Managerial Economies. As a firm grows it can employ specialist staff to increase efficiency. Procurers (specialist buyers) can be employed to reduce the firm’s input costs. Managers can be employed to manage,
14
motivate and/or supervise workers to increase labour productivity and lower unit labour cost. Accountants can be employed to minimize taxes and optimally deal with the firm’s profits and savings. Receptionists and IT staff can be employed to improve communication networks.
3) Financial Economies. As a firm grows it becomes more profitable and successful so it becomes less risky, has a higher credit worthiness so it can obtain larger and quicker loans and at a lower interest rate.
4) Marketing Economies. As a firm grows it can spread its advertising costs over its larger output. Additionally, the larger firm may gain some monopsony power to be able to bulk purchase and negotiate discounted prices for its inputs.
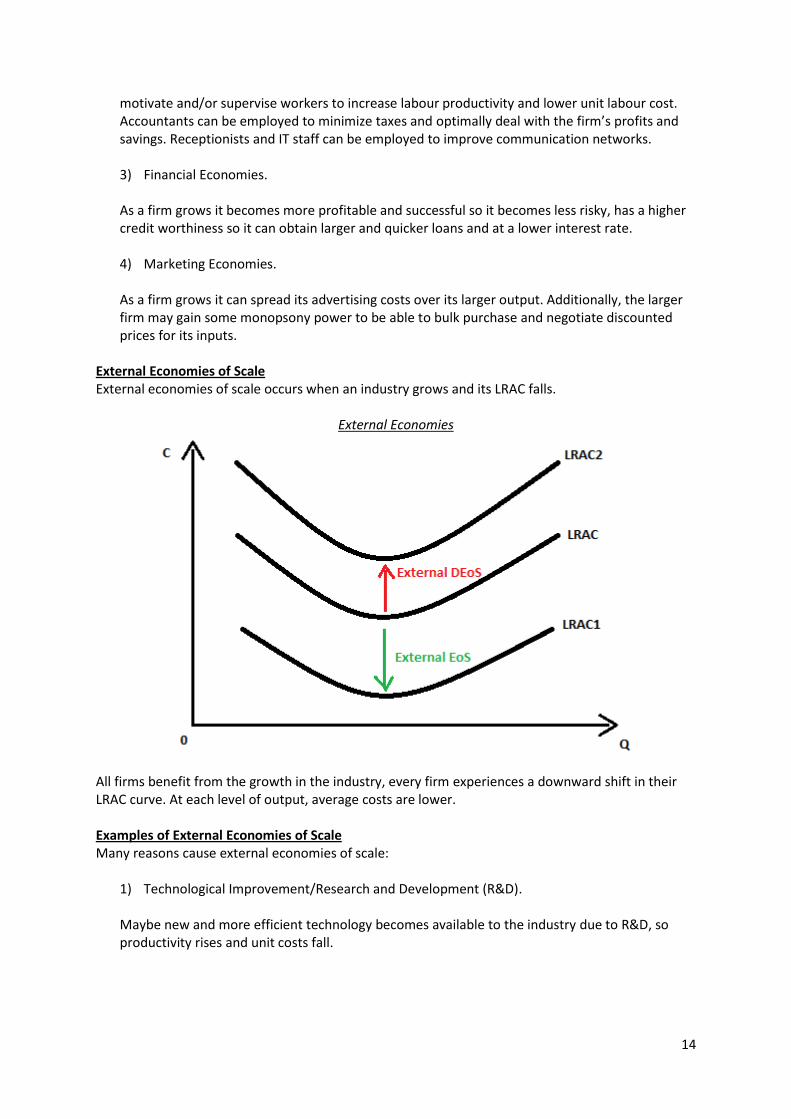
External Economies of Scale External economies of scale occurs when an industry grows and its LRAC falls.
External Economies
All firms benefit from the growth in the industry, every firm experiences a downward shift in their LRAC curve. At each level of output, average costs are lower. Examples of External Economies of Scale Many reasons cause external economies of scale:
1) Technological Improvement/Research and Development (R&D). Maybe new and more efficient technology becomes available to the industry due to R&D, so productivity rises and unit costs fall.
15
2) Taxation. The government could decrease taxes on the industry, so costs fall. 3) Labour Productivity (Education). Maybe educational institutions train more students and train them better. Workers’ skills improve, so productivity rises and unit labour costs fall. Also, firms’ training costs fall.
4) Infrastructure. Maybe the industry’s local infrastructure (roads and telecommunications) improves, so productivity rises and costs fall.
16
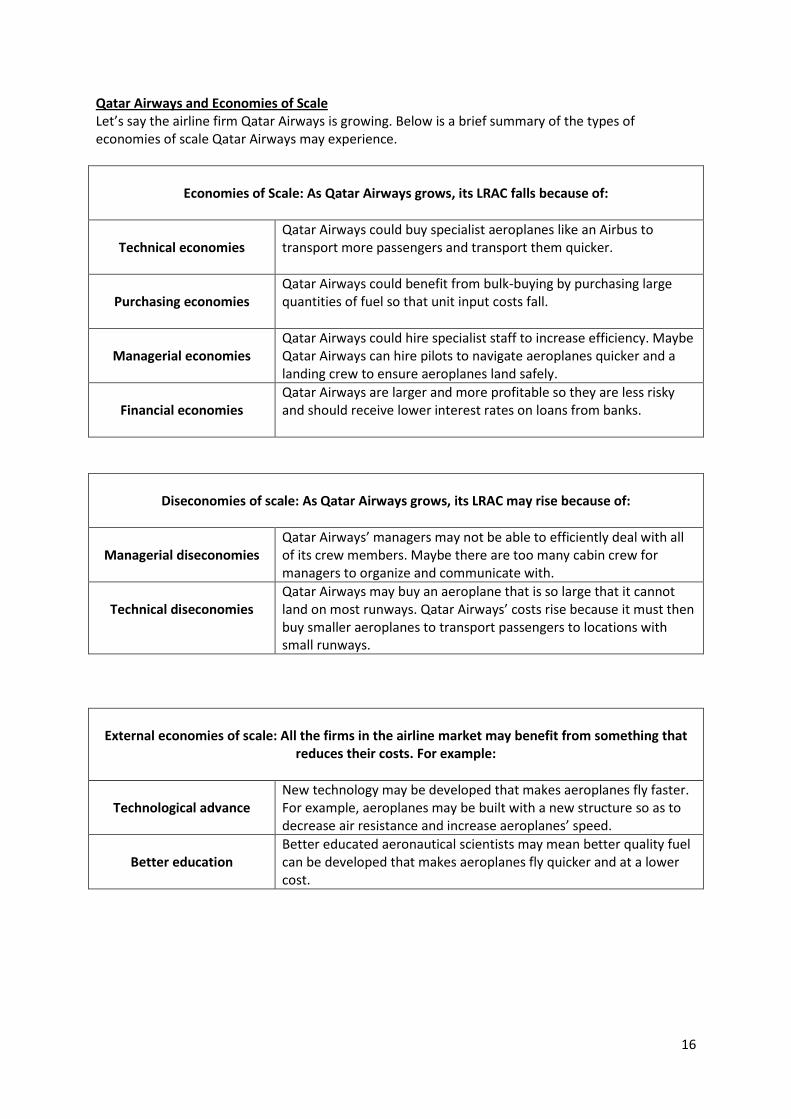
Qatar Airways and Economies of Scale Let’s say the airline firm Qatar Airways is growing. Below is a brief summary of the types of economies of scale Qatar Airways may experience.
Economies of Scale: As Qatar Airways grows, its LRAC falls because of:
Technical economies
Qatar Airways could buy specialist aeroplanes like an Airbus to transport more passengers and transport them quicker.
Purchasing economies
Qatar Airways could benefit from bulk-buying by purchasing large quantities of fuel so that unit input costs fall.
Managerial economies
Qatar Airways could hire specialist staff to increase efficiency. Maybe Qatar Airways can hire pilots to navigate aeroplanes quicker and a landing crew to ensure aeroplanes land safely.
Financial economies
Qatar Airways are larger and more profitable so they are less risky and should receive lower interest rates on loans from banks.
Diseconomies of scale: As Qatar Airways grows, its LRAC may rise because of:
Managerial diseconomies
Qatar Airways’ managers may not be able to efficiently deal with all of its crew members. Maybe there are too many cabin crew for managers to organize and communicate with.
Technical diseconomies
Qatar Airways may buy an aeroplane that is so large that it cannot land on most runways. Qatar Airways’ costs rise because it must then buy smaller aeroplanes to transport passengers to locations with small runways.
External economies of scale: All the firms in the airline market may benefit from something that
reduces their costs. For example:
Technological advance
New technology may be developed that makes aeroplanes fly faster. For example, aeroplanes may be built with a new structure so as to decrease air resistance and increase aeroplanes’ speed.
Better education
Better educated aeronautical scientists may mean better quality fuel can be developed that makes aeroplanes fly quicker and at a lower cost.

17
External diseconomies of scale: All the firms in the airline market may suffer from something that
increases their costs. For example:
Higher taxes
A rise in indirect taxes for the airline industry means Qatar Airways’ costs rise.
Bad weather
Bad weather like a tornado or storm makes it harder to navigate aeroplanes, Qatar Airways may have to take alternative routes which are longer and thus increase transportation costs.
18
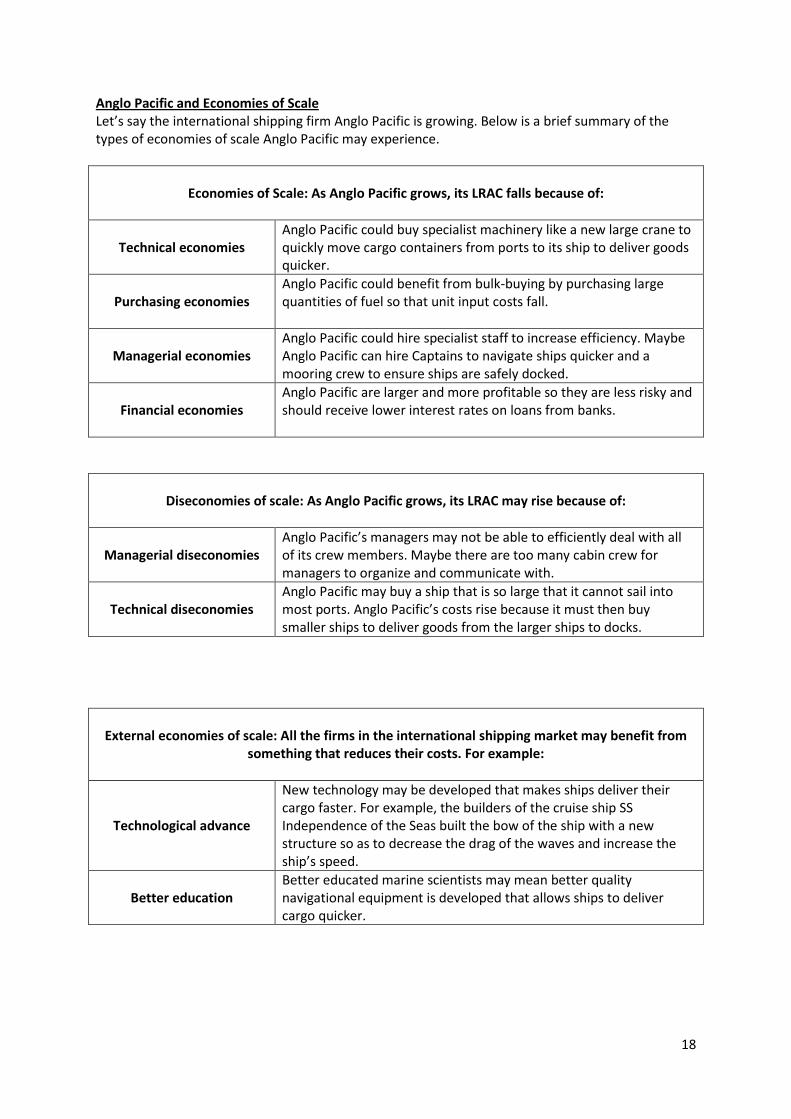
Anglo Pacific and Economies of Scale Let’s say the international shipping firm Anglo Pacific is growing. Below is a brief summary of the types of economies of scale Anglo Pacific may experience.
Economies of Scale: As Anglo Pacific grows, its LRAC falls because of:
Technical economies
Anglo Pacific could buy specialist machinery like a new large crane to quickly move cargo containers from ports to its ship to deliver goods quicker.
Purchasing economies
Anglo Pacific could benefit from bulk-buying by purchasing large quantities of fuel so that unit input costs fall.
Managerial economies
Anglo Pacific could hire specialist staff to increase efficiency. Maybe Anglo Pacific can hire Captains to navigate ships quicker and a mooring crew to ensure ships are safely docked.
Financial economies
Anglo Pacific are larger and more profitable so they are less risky and should receive lower interest rates on loans from banks.
Diseconomies of scale: As Anglo Pacific grows, its LRAC may rise because of:
Managerial diseconomies
Anglo Pacific’s managers may not be able to efficiently deal with all of its crew members. Maybe there are too many cabin crew for managers to organize and communicate with.
Technical diseconomies
Anglo Pacific may buy a ship that is so large that it cannot sail into most ports. Anglo Pacific’s costs rise because it must then buy smaller ships to deliver goods from the larger ships to docks.
External economies of scale: All the firms in the international shipping market may benefit from
something that reduces their costs. For example:
Technological advance
New technology may be developed that makes ships deliver their cargo faster. For example, the builders of the cruise ship SS Independence of the Seas built the bow of the ship with a new structure so as to decrease the drag of the waves and increase the ship’s speed.
Better education
Better educated marine scientists may mean better quality navigational equipment is developed that allows ships to deliver cargo quicker.
19
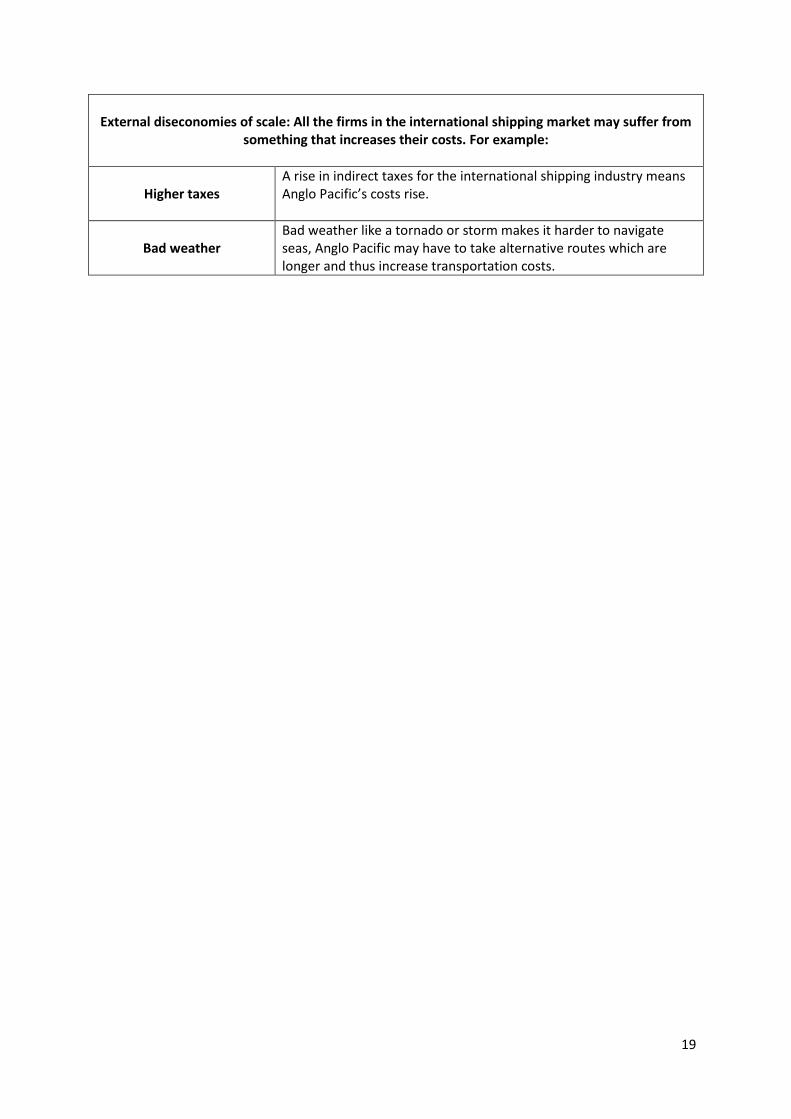
External diseconomies of scale: All the firms in the international shipping market may suffer from
something that increases their costs. For example:
Higher taxes
A rise in indirect taxes for the international shipping industry means Anglo Pacific’s costs rise.
Bad weather
Bad weather like a tornado or storm makes it harder to navigate seas, Anglo Pacific may have to take alternative routes which are longer and thus increase transportation costs.
20
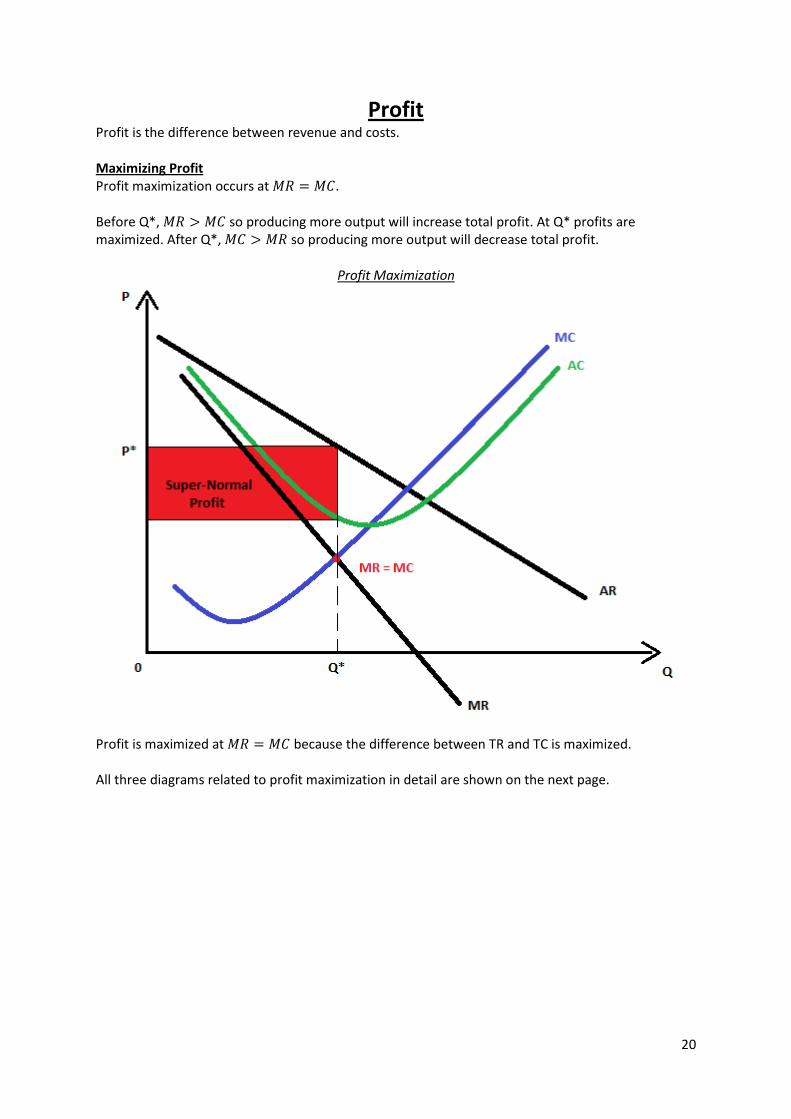
Profit Profit is the difference between revenue and costs. Maximizing Profit Profit maximization occurs at . Before Q*, so producing more output will increase total profit. At Q* profits are maximized. After Q*, so producing more output will decrease total profit.
Profit Maximization
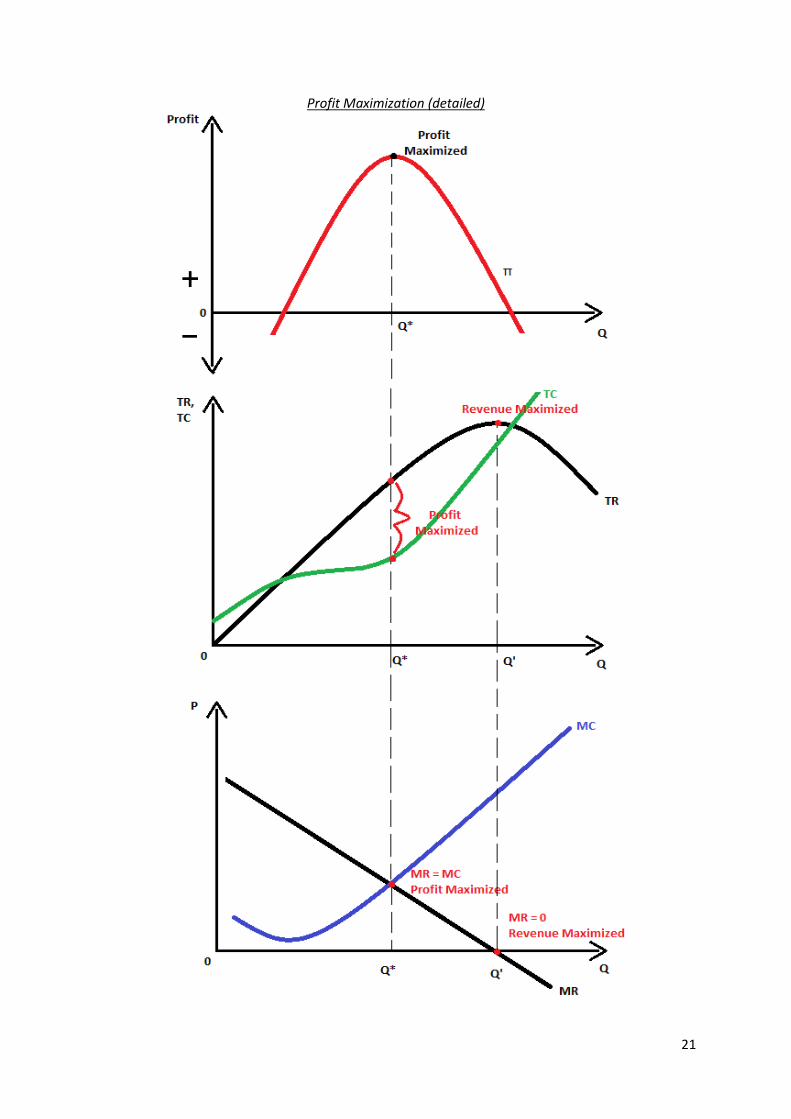
Profit is maximized at because the difference between TR and TC is maximized. All three diagrams related to profit maximization in detail are shown on the next page.
21
Profit Maximization (detailed)
22
Zero or Normal Profit An accountant would calculate cost as just the ‘monetary’ cost of machinery, wages, bills, rent etc. An economist includes into costs the opportunity cost of production. This is the profit that could have been made had the resources been employed in their next best use. This opportunity cost is normal profit. Normal profit is thus the minimum level of profit required to keep a firm’s resources in their current use in the long-run. If a firm makes normal profit then it will stay in the industry in the long-run. If a firm makes less than normal profit then it makes a loss so it will shut-down in the long-run and put its resources to a better use. A firm makes normal profit if . Because , normal profit is also called Zero profit. Zero or normal profit means the firm earns enough revenue to cover the ‘monetary’ cost of resources (bills, wages, rent etc.) and their opportunity cost (normal profit). Super-Normal Profit Super-normal profit (or abnormal profit) is earned when . Super-normal profit is profit greater than normal profit. Revenue exceeds both the ‘monetary’ costs and opportunity cost of resources.
23
Objectives A firm’s owners are its shareholders. A large firm may have many shareholders and/or shareholders with limited knowledge of running the firm. So, shareholders appoint directors to run the firm and, in turn, directors appoint managers to run the firm day-to-day. So there is a divorce between ownership and control. Shareholders do not have much day-to-day control. Shareholders only have the power to appoint/sack directors at meetings. Moreover, it may take a lot of shareholders to appoint/sack directors. Directors and managers have the most control over the firm’s day-to-day running. A firm basically has four objectives to choose from:
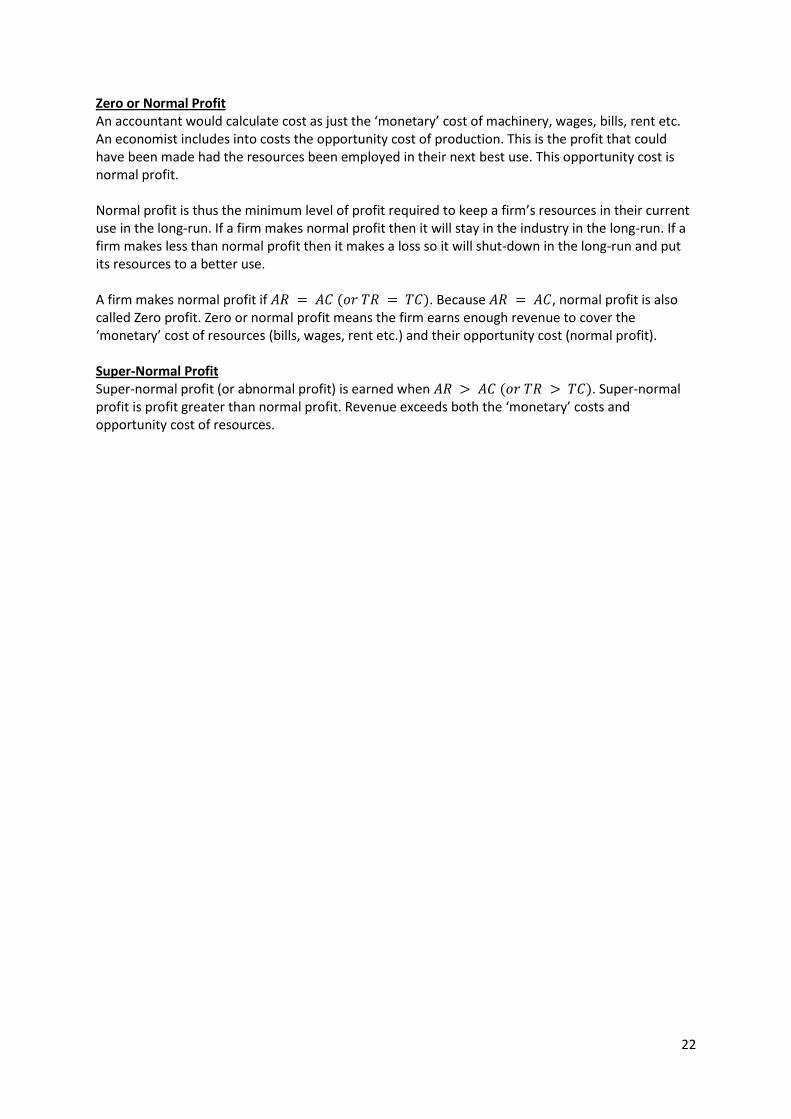
1) Profit Maximization.
Profit Maximization
A firm profit maximizes at . Before Q*, so producing more output will increase total profit. At Q* profits are maximized. After Q*, so producing more output will decrease total profit. Because the firm makes super-normal profit. Shareholders want to profit maximize because their dividends will be maximized.
24
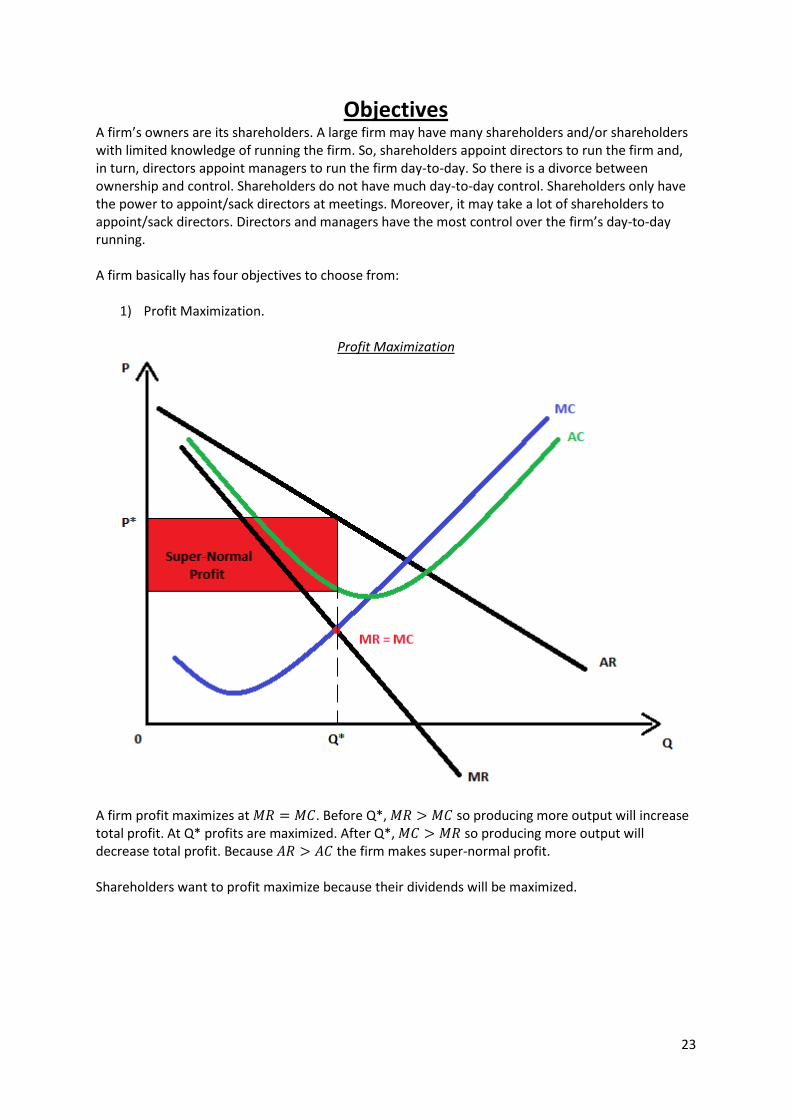
2) Revenue Maximization.
Revenue Maximization
A firm maximizes revenue at . maximizes revenue because before that point so additional output adds to total revenue and after that point so additional output decreases total revenue. Super-normal profit is still made, but it is less than under profit maximization. A firm may want to maximize revenue to raise resources for a big investment. Furthermore, the firm may be trying to increase its market share and monopoly power or drive rivals out of the market. Managers may wish to maximize revenue if their pay is positively linked to revenue. Moreover, managers may revenue maximize for the prestige of maximizing the firm’s assets or stock vale.
25
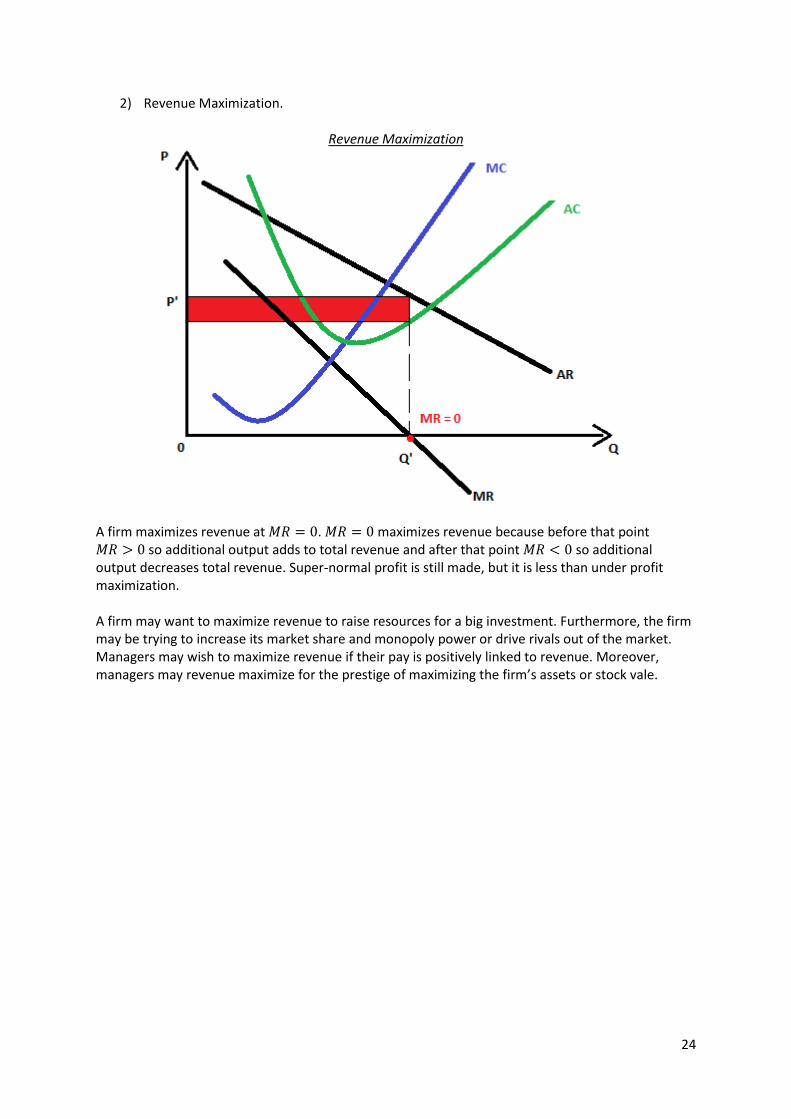
3) Sales Maximization.
Sales Maximization
A firm maximizes sales at . At the firm sells all the output it can without making a loss. The firm breaks-even and earns normal profit only. A firm may maximize sales to build a brand and create a loyal customer base. Furthermore, the firm may be trying to maximize its market share and monopoly power or drive rivals out of the market. Managers may wish to maximize sales if their pay is positively linked to sales. However, shareholders may sack directors/managers because only normal profit is earned, shareholders want super-normal profit to maximize their dividends.
4) Profit Satisfice. Managers could profit satisfice, that is, meet a minimum level of profit to appease shareholders and then they seek to meet targets for their own benefit like increasing sales to increase their salaries, increase their time off work or improve their perks and working conditions.
26
Efficiency
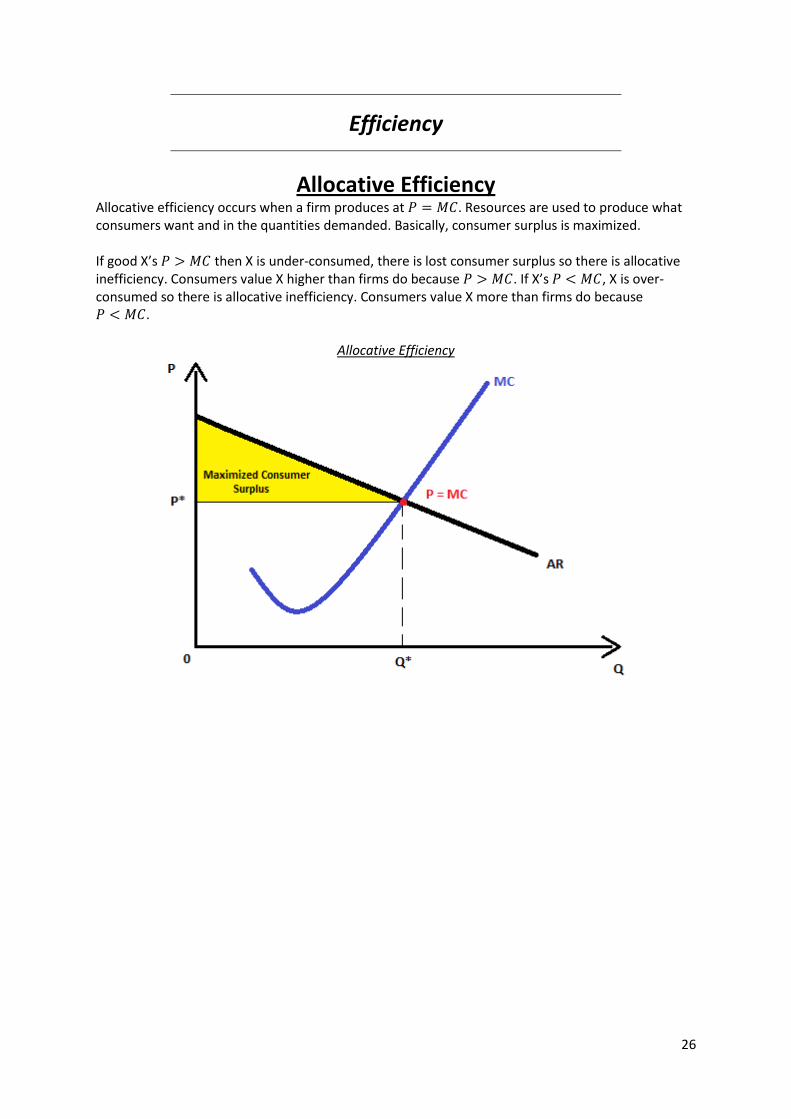
Allocative Efficiency Allocative efficiency occurs when a firm produces at . Resources are used to produce what consumers want and in the quantities demanded. Basically, consumer surplus is maximized. If good X’s then X is under-consumed, there is lost consumer surplus so there is allocative inefficiency. Consumers value X higher than firms do because . If X’s , X is over-consumed so there is allocative inefficiency. Consumers value X more than firms do because .
Allocative Efficiency
27
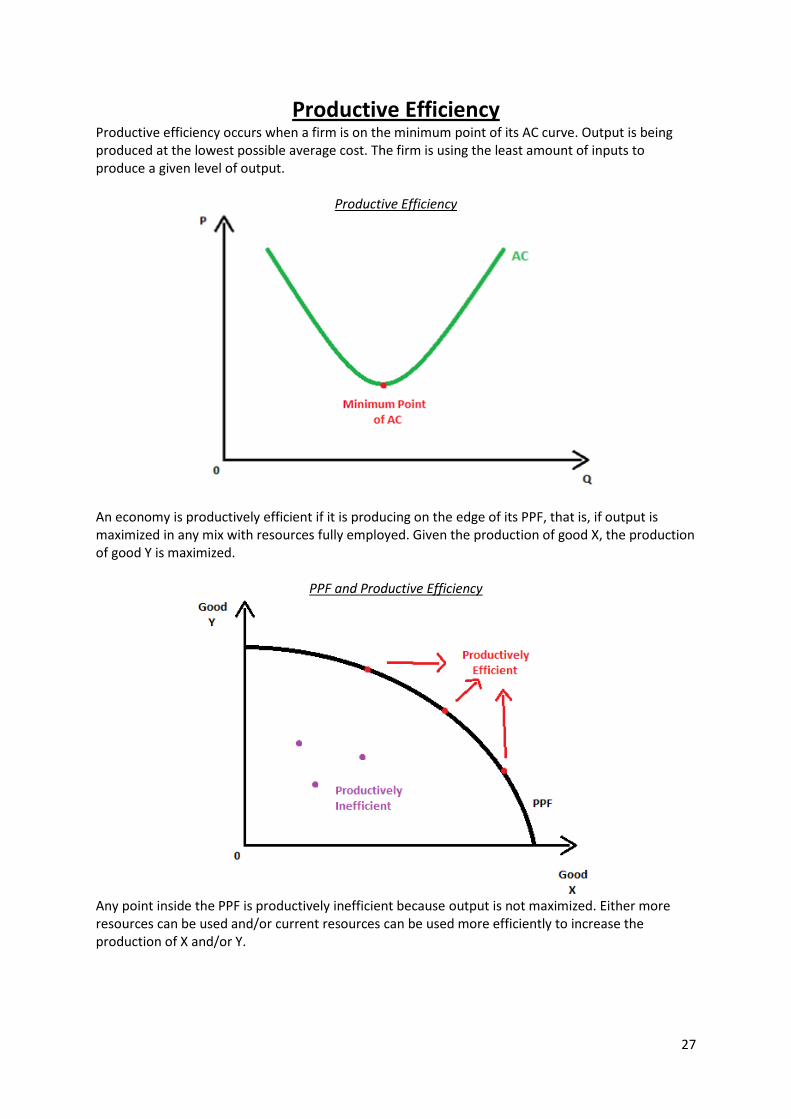
Productive Efficiency Productive efficiency occurs when a firm is on the minimum point of its AC curve. Output is being produced at the lowest possible average cost. The firm is using the least amount of inputs to produce a given level of output.
Productive Efficiency
An economy is productively efficient if it is producing on the edge of its PPF, that is, if output is maximized in any mix with resources fully employed. Given the production of good X, the production of good Y is maximized.
PPF and Productive Efficiency
Any point inside the PPF is productively inefficient because output is not maximized. Either more resources can be used and/or current resources can be used more efficiently to increase the production of X and/or Y.
28
X-Inefficiency A firm is X-inefficient if it does not minimize costs. A monopoly in an uncompetitive and incontestable market has no current or potential threat to its market power and super-normal profit. Workers and managers will relax more at work and put in less effort because they know the firm will not go bankrupt if they do not minimize costs because profits are high. So the monopoly may be disincentivized to minimize costs, will use its technology inefficiently, squander resources, let costs spiral upwards and become X-inefficient.
Pareto Efficiency Pareto efficiency occurs when the only way to make one person better off is to make another worse off.
29
Barriers to Entry and Exit
A barrier to entry is a factor blocking or disincentivizing a new firm from entering a market. Barriers to entry allow incumbent (existing) firms to block the entry of new firms, maintain their own market share/power and keep earning super-normal profit. Many entry barriers exist:
1) Technological Barriers. A potential entrant may not have the knowledge or access to resources necessary to enter an industry. 2) Average Costs (Economies of Scale). A market’s incumbent firms may have large economies of scale and very low AC. Any new firm would not experience economies of scale (because economies of scale occur in the long-run, not as soon as the firm enters the market), so a new firm’s costs may be too high for it to make a profit. So the potential firm is disincentivized from entering the industry. 3) Advertising. Advertising creates a brand image, brand loyalty and makes demand for a firm’s good more inelastic. A potential entrant may need to spend a lot on advertising to compete with incumbent firms, and these higher costs disincentives the firm from entering the market. 4) Start-Up Costs. An industry may require a high start-up cost for a new firm (a runway for an airline). The higher the start-up cost, the more expensive it is to enter the industry. 5) Legal Barriers. After a new good (idea) is invented it can be given a patent, Intellectual Property Right (IPR) or copyright. A patent gives a firm legal protection by the government to be the exclusive producer of a good for a number of years. Only the patent holder can produce the patented good. No new firm can enter the market and produce the same good. 6) Quotas and Tariffs. A new firm cannot enter a market if it is blocked by a quota, the firm requires a license to produce. An international tariff may also block foreign firms entering a domestic market. 7) Limit Pricing. Limit pricing occurs when an incumbent firm sets a price so low that they earn normal profit (or low super-normal profit) to make rivals make a loss (because they are not as efficient). A potential firm will not enter the industry if they expect to make a loss.
30
8) Predatory Pricing. An incumbent firm may use predatory pricing to price below their own AC curve so that both they and rivals make a loss. Potential firms will not enter the industry if they think they will make a loss. The incumbent firm must be deep-pocketed to do this, they must have the funds to be able to make losses. However, the losses cannot be sustained in the long-run, this tactic is a short-run tactic only. Also, predatory pricing is illegal, so the incumbent firm must avoid being caught by authorities.
A barrier to exit is a factor blocking an existing firm from leaving a market quickly and at a low cost. A major exit barrier is sunk cost. Sunk costs are costs that cannot be recovered upon exiting a market. Basically sunk costs are costs associated with advertising and cancelling contracts with suppliers, workers and buyers. The higher are sunk costs, the higher the costs of failure and the more risky it is to enter the industry. An exit barrier therefore acts as an entry barrier because it disincentivizes firms from entering a market.
31
Contestability
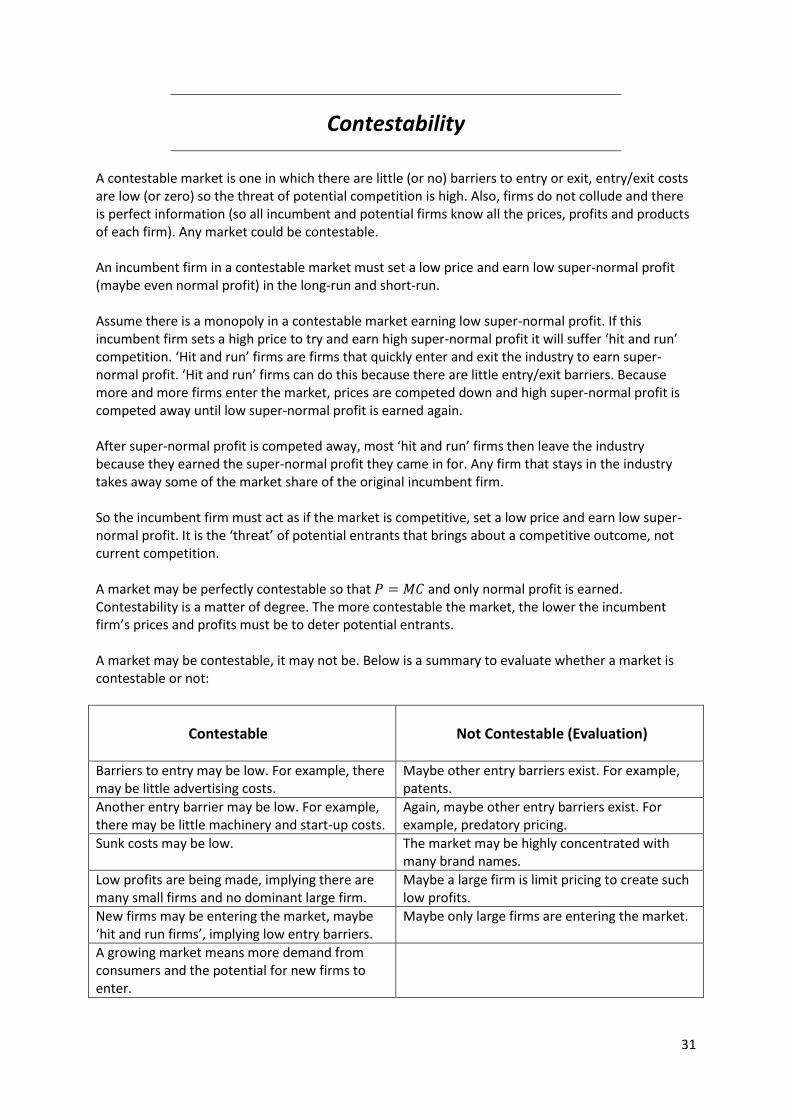
A contestable market is one in which there are little (or no) barriers to entry or exit, entry/exit costs are low (or zero) so the threat of potential competition is high. Also, firms do not collude and there is perfect information (so all incumbent and potential firms know all the prices, profits and products of each firm). Any market could be contestable. An incumbent firm in a contestable market must set a low price and earn low super-normal profit (maybe even normal profit) in the long-run and short-run. Assume there is a monopoly in a contestable market earning low super-normal profit. If this incumbent firm sets a high price to try and earn high super-normal profit it will suffer ‘hit and run’ competition. ‘Hit and run’ firms are firms that quickly enter and exit the industry to earn super-normal profit. ‘Hit and run’ firms can do this because there are little entry/exit barriers. Because more and more firms enter the market, prices are competed down and high super-normal profit is competed away until low super-normal profit is earned again. After super-normal profit is competed away, most ‘hit and run’ firms then leave the industry because they earned the super-normal profit they came in for. Any firm that stays in the industry takes away some of the market share of the original incumbent firm. So the incumbent firm must act as if the market is competitive, set a low price and earn low super-normal profit. It is the ‘threat’ of potential entrants that brings about a competitive outcome, not current competition. A market may be perfectly contestable so that and only normal profit is earned. Contestability is a matter of degree. The more contestable the market, the lower the incumbent firm’s prices and profits must be to deter potential entrants. A market may be contestable, it may not be. Below is a summary to evaluate whether a market is contestable or not:
Contestable
Not Contestable (Evaluation)
Barriers to entry may be low. For example, there may be little advertising costs.
Maybe other entry barriers exist. For example, patents.
Another entry barrier may be low. For example, there may be little machinery and start-up costs.
Again, maybe other entry barriers exist. For example, predatory pricing.
Sunk costs may be low. The market may be highly concentrated with many brand names.
Low profits are being made, implying there are many small firms and no dominant large firm.
Maybe a large firm is limit pricing to create such low profits.
New firms may be entering the market, maybe ‘hit and run firms’, implying low entry barriers.
Maybe only large firms are entering the market.
A growing market means more demand from consumers and the potential for new firms to enter.
32
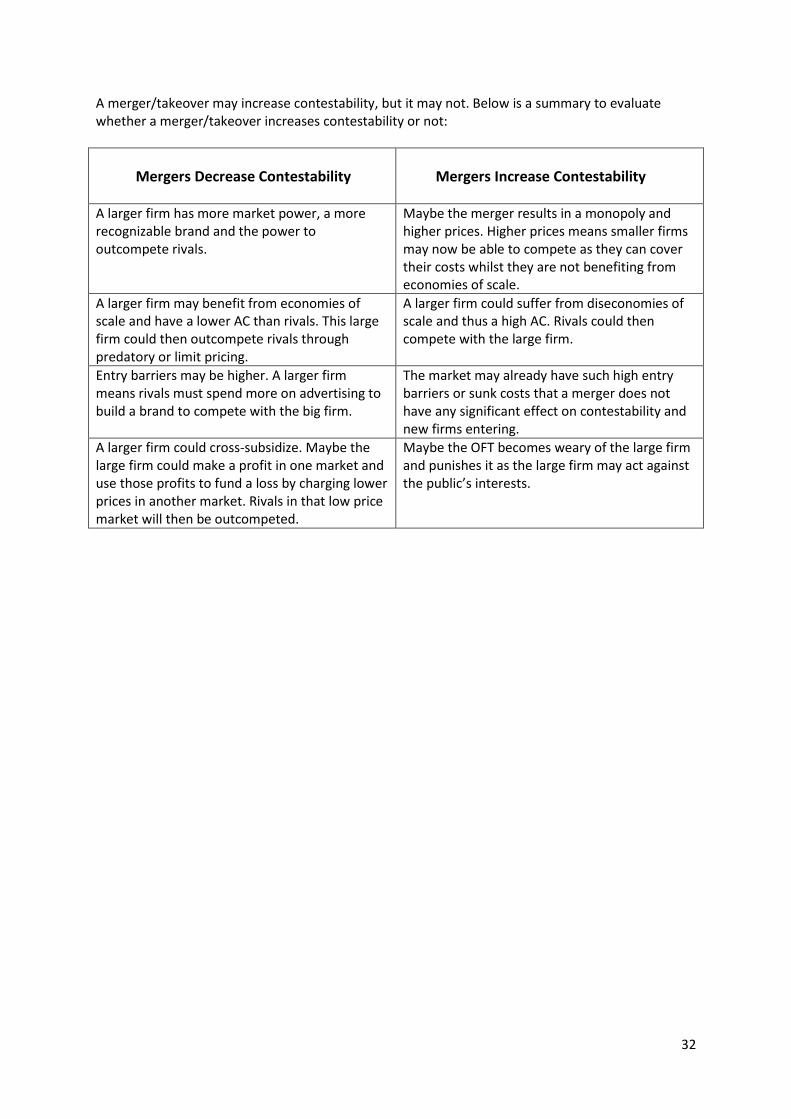
A merger/takeover may increase contestability, but it may not. Below is a summary to evaluate whether a merger/takeover increases contestability or not:
Mergers Decrease Contestability
Mergers Increase Contestability
A larger firm has more market power, a more recognizable brand and the power to outcompete rivals.
Maybe the merger results in a monopoly and higher prices. Higher prices means smaller firms may now be able to compete as they can cover their costs whilst they are not benefiting from economies of scale.
A larger firm may benefit from economies of scale and have a lower AC than rivals. This large firm could then outcompete rivals through predatory or limit pricing.
A larger firm could suffer from diseconomies of scale and thus a high AC. Rivals could then compete with the large firm.
Entry barriers may be higher. A larger firm means rivals must spend more on advertising to build a brand to compete with the big firm.
The market may already have such high entry barriers or sunk costs that a merger does not have any significant effect on contestability and new firms entering.
A larger firm could cross-subsidize. Maybe the large firm could make a profit in one market and use those profits to fund a loss by charging lower prices in another market. Rivals in that low price market will then be outcompeted.
Maybe the OFT becomes weary of the large firm and punishes it as the large firm may act against the public’s interests.
33
Perfect Competition
Perfect competition is a theoretical ideal where all firms are price-takers, earn normal profit and are allocatively and productively efficient in the long-run. Perfect competition is a purely theoretical model, it does not exist in reality. Perfect competition provides an economist with a benchmark to measure monopoly and oligopoly against. An economist may advise the government to make monopolies and oligopolies more like perfect competition to make those industries more efficient. Assumptions:
1) Many Buyers and Sellers. Many sellers means that each firm has a small market share. Many buyers means no buyer has any monopsony power to affect prices.
2) Perfect Information. All information is available at zero cost. All incumbent firms and potential firms know each other’s prices and products. All consumers know each firms’ prices and product.
3) Homogenous Output. All firms produce identical goods. All goods are perfect substitutes.
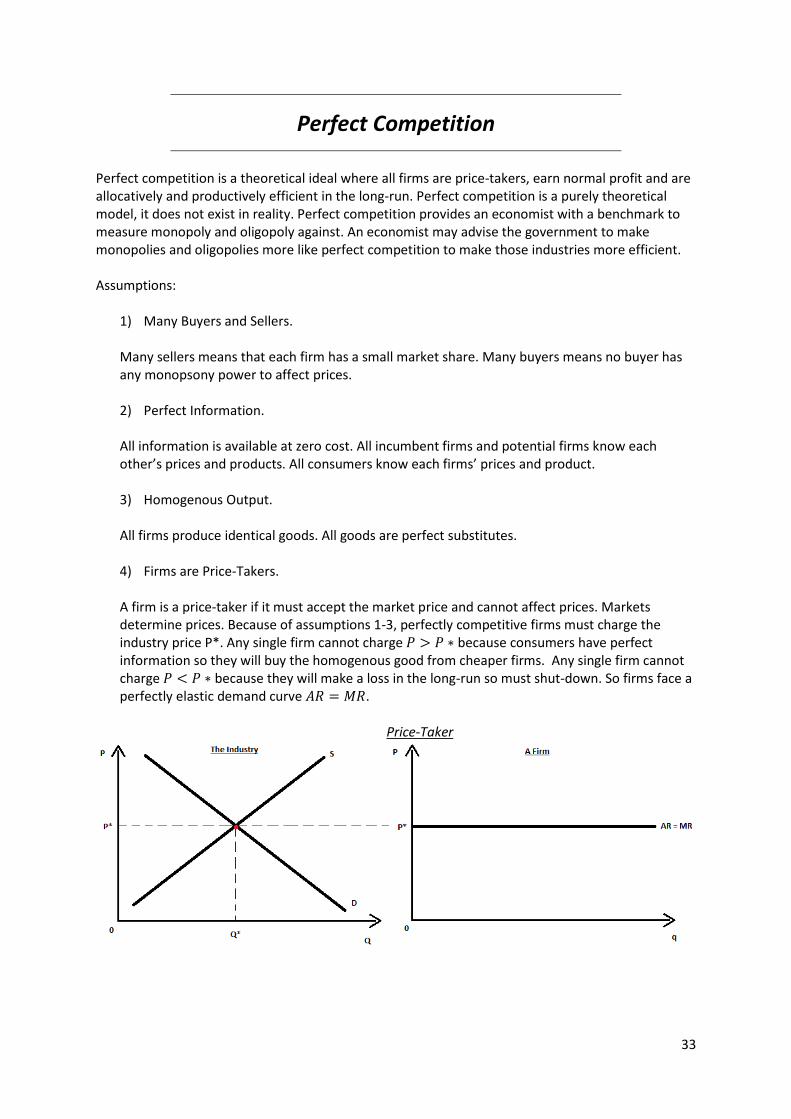
4) Firms are Price-Takers. A firm is a price-taker if it must accept the market price and cannot affect prices. Markets determine prices. Because of assumptions 1-3, perfectly competitive firms must charge the industry price P*. Any single firm cannot charge because consumers have perfect information so they will buy the homogenous good from cheaper firms. Any single firm cannot charge because they will make a loss in the long-run so must shut-down. So firms face a perfectly elastic demand curve .
Price-Taker
34
5) Firms Maximize Profits at .
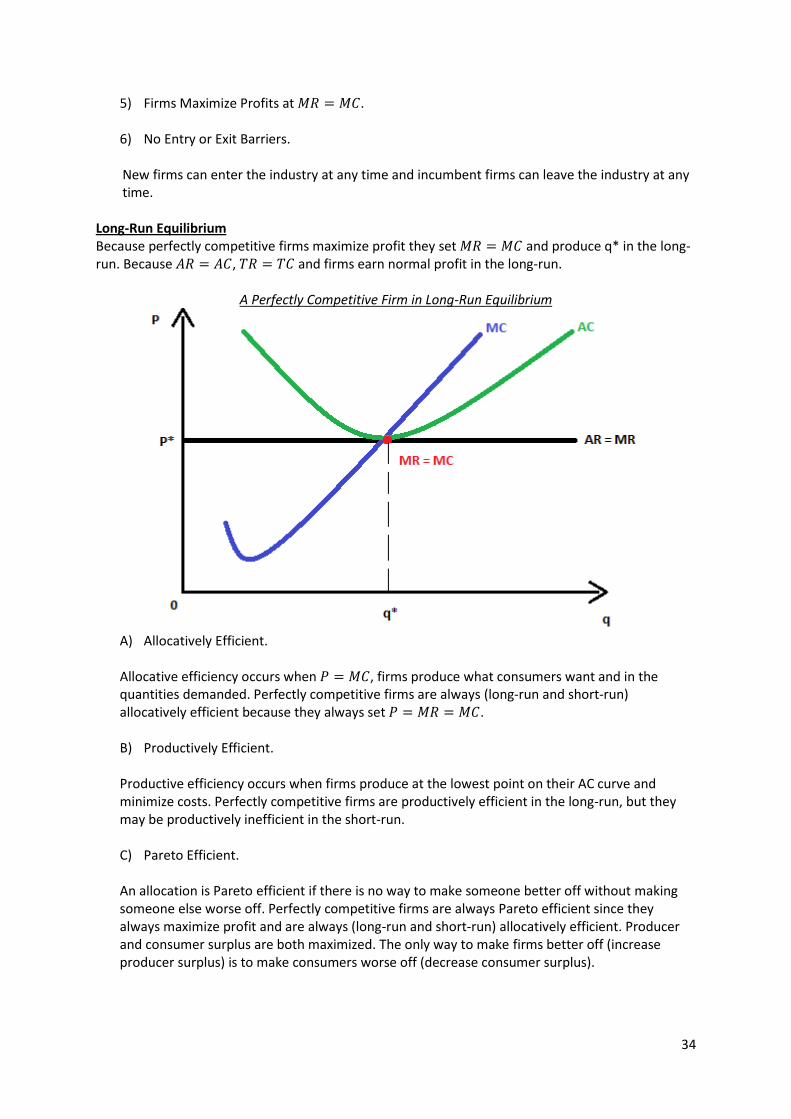
6) No Entry or Exit Barriers. New firms can enter the industry at any time and incumbent firms can leave the industry at any time. Long-Run Equilibrium Because perfectly competitive firms maximize profit they set and produce q* in the long-run. Because , and firms earn normal profit in the long-run.
A Perfectly Competitive Firm in Long-Run Equilibrium
A) Allocatively Efficient. Allocative efficiency occurs when , firms produce what consumers want and in the quantities demanded. Perfectly competitive firms are always (long-run and short-run) allocatively efficient because they always set .
B) Productively Efficient. Productive efficiency occurs when firms produce at the lowest point on their AC curve and minimize costs. Perfectly competitive firms are productively efficient in the long-run, but they may be productively inefficient in the short-run.
C) Pareto Efficient. An allocation is Pareto efficient if there is no way to make someone better off without making someone else worse off. Perfectly competitive firms are always Pareto efficient since they always maximize profit and are always (long-run and short-run) allocatively efficient. Producer and consumer surplus are both maximized. The only way to make firms better off (increase producer surplus) is to make consumers worse off (decrease consumer surplus).
35
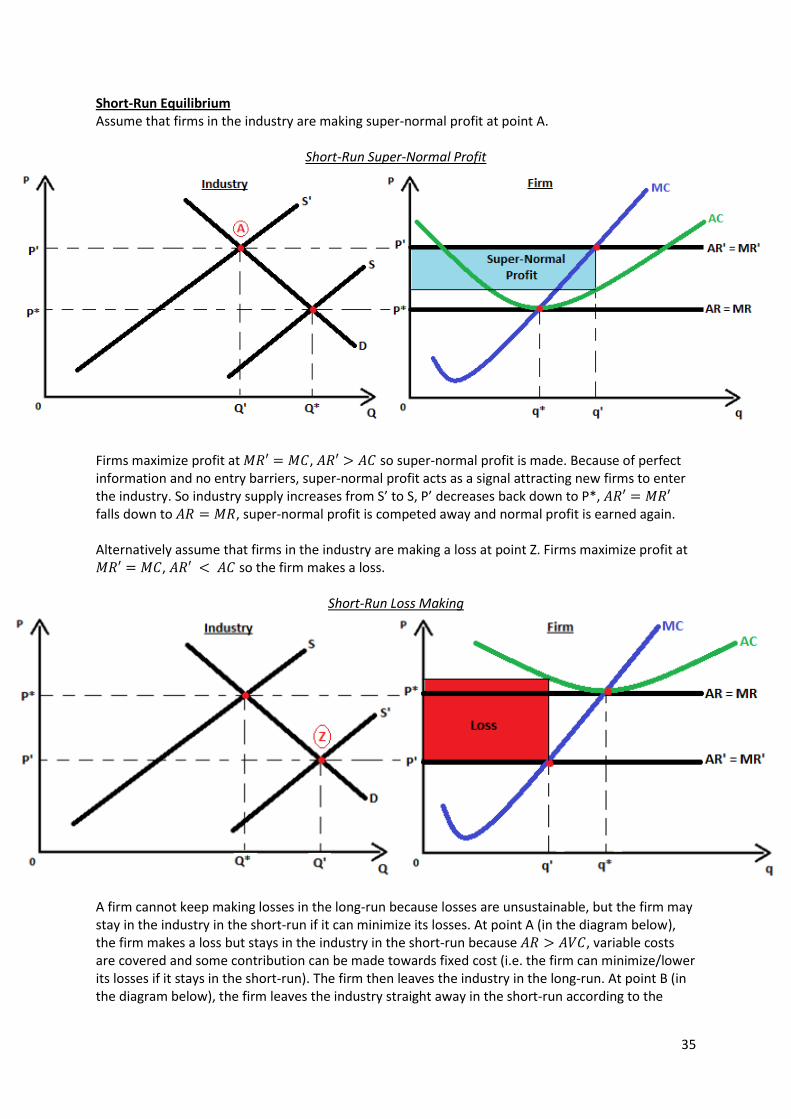
Short-Run Equilibrium Assume that firms in the industry are making super-normal profit at point A.
Short-Run Super-Normal Profit Firms maximize profit at , so super-normal profit is made. Because of perfect information and no entry barriers, super-normal profit acts as a signal attracting new firms to enter the industry. So industry supply increases from S’ to S, P’ decreases back down to P*, falls down to , super-normal profit is competed away and normal profit is earned again. Alternatively assume that firms in the industry are making a loss at point Z. Firms maximize profit at , so the firm makes a loss.
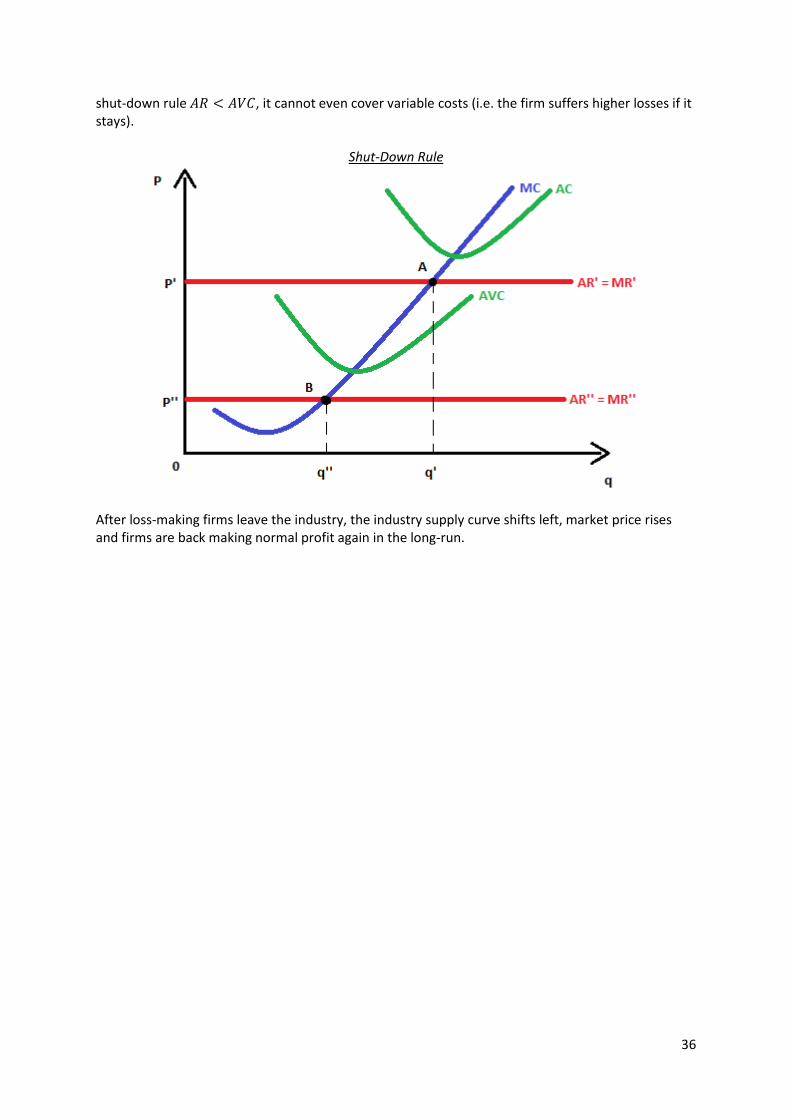
Short-Run Loss Making A firm cannot keep making losses in the long-run because losses are unsustainable, but the firm may stay in the industry in the short-run if it can minimize its losses. At point A (in the diagram below), the firm makes a loss but stays in the industry in the short-run because , variable costs are covered and some contribution can be made towards fixed cost (i.e. the firm can minimize/lower its losses if it stays in the short-run). The firm then leaves the industry in the long-run. At point B (in the diagram below), the firm leaves the industry straight away in the short-run according to the
36
shut-down rule , it cannot even cover variable costs (i.e. the firm suffers higher losses if it stays).
Shut-Down Rule
After loss-making firms leave the industry, the industry supply curve shifts left, market price rises and firms are back making normal profit again in the long-run.
37
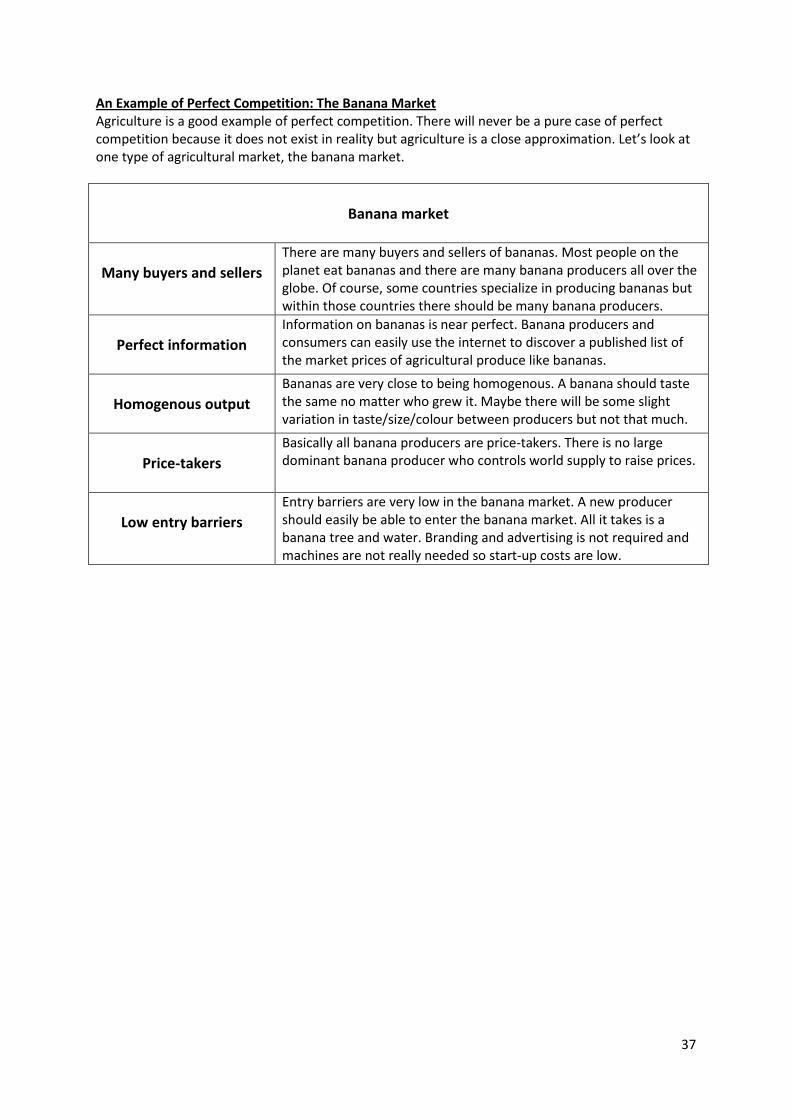
An Example of Perfect Competition: The Banana Market Agriculture is a good example of perfect competition. There will never be a pure case of perfect competition because it does not exist in reality but agriculture is a close approximation. Let’s look at one type of agricultural market, the banana market.
Banana market
Many buyers and sellers
There are many buyers and sellers of bananas. Most people on the planet eat bananas and there are many banana producers all over the globe. Of course, some countries specialize in producing bananas but within those countries there should be many banana producers.
Perfect information
Information on bananas is near perfect. Banana producers and consumers can easily use the internet to discover a published list of the market prices of agricultural produce like bananas.
Homogenous output
Bananas are very close to being homogenous. A banana should taste the same no matter who grew it. Maybe there will be some slight variation in taste/size/colour between producers but not that much.
Price-takers
Basically all banana producers are price-takers. There is no large dominant banana producer who controls world supply to raise prices.
Low entry barriers
Entry barriers are very low in the banana market. A new producer should easily be able to enter the banana market. All it takes is a banana tree and water. Branding and advertising is not required and machines are not really needed so start-up costs are low.
38
Monopoly
In the board game Monopoly, each player plays to buy all the houses/stations/streets and become a monopoly. A monopoly is basically a firm that owns the whole market. A monopoly sets its own price and earns super-normal profit in the long-run. Monopolies are usually allocatively, productively and Pareto inefficient. Assumptions:
1) A Single Seller. A monopoly is the only firm in the market, or it is the most dominant firm with at least 25% market share.
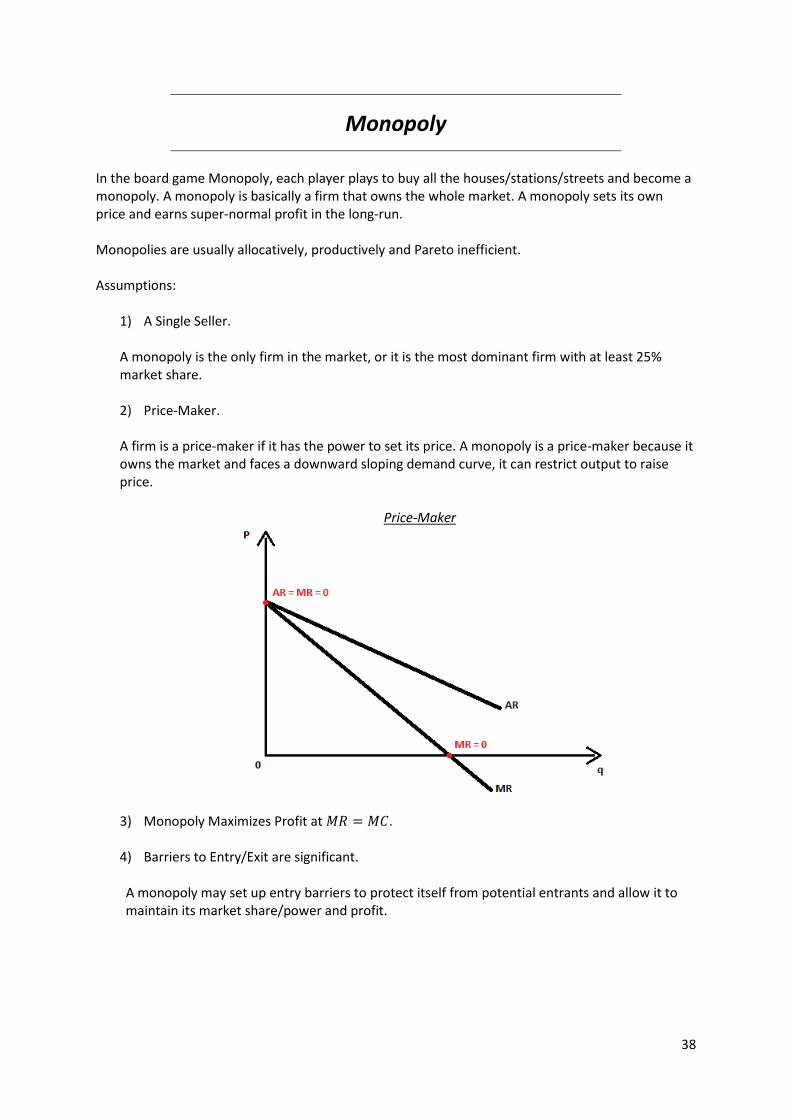
2) Price-Maker. A firm is a price-maker if it has the power to set its price. A monopoly is a price-maker because it owns the market and faces a downward sloping demand curve, it can restrict output to raise price.
Price-Maker
3) Monopoly Maximizes Profit at .
4) Barriers to Entry/Exit are significant. A monopoly may set up entry barriers to protect itself from potential entrants and allow it to maintain its market share/power and profit.
39
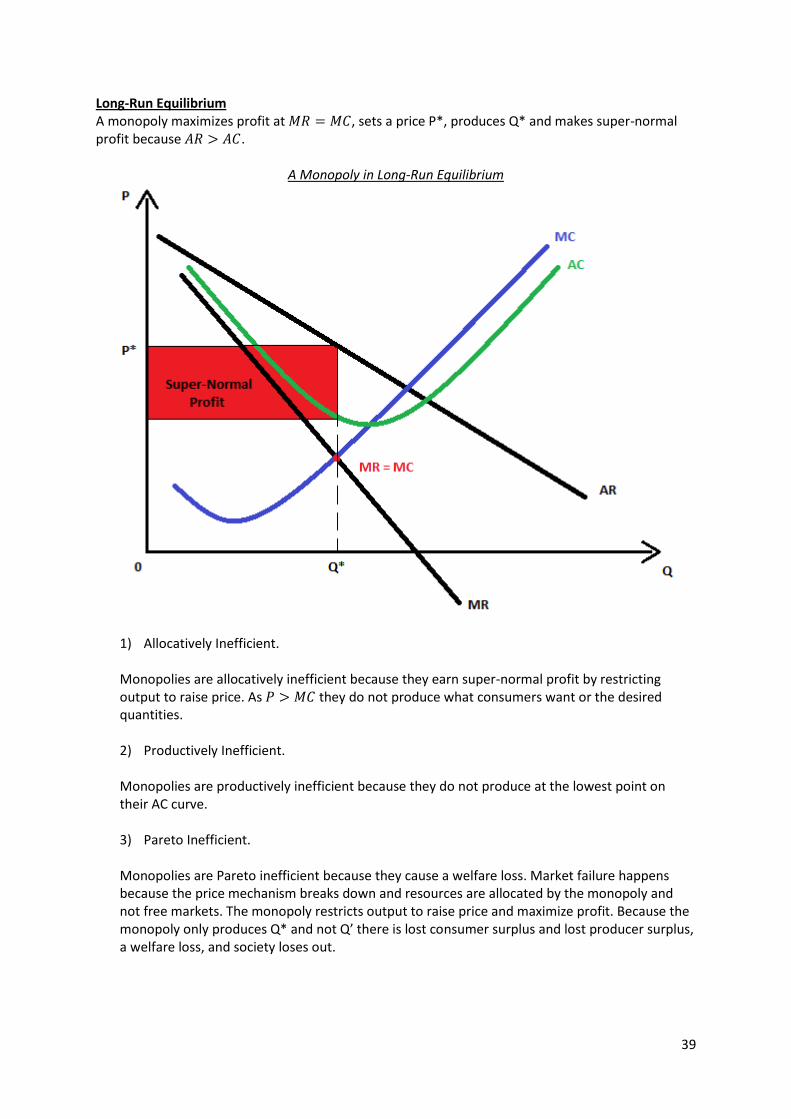
Long-Run Equilibrium A monopoly maximizes profit at , sets a price P*, produces Q* and makes super-normal profit because .
A Monopoly in Long-Run Equilibrium
1) Allocatively Inefficient. Monopolies are allocatively inefficient because they earn super-normal profit by restricting output to raise price. As they do not produce what consumers want or the desired quantities. 2) Productively Inefficient. Monopolies are productively inefficient because they do not produce at the lowest point on their AC curve.
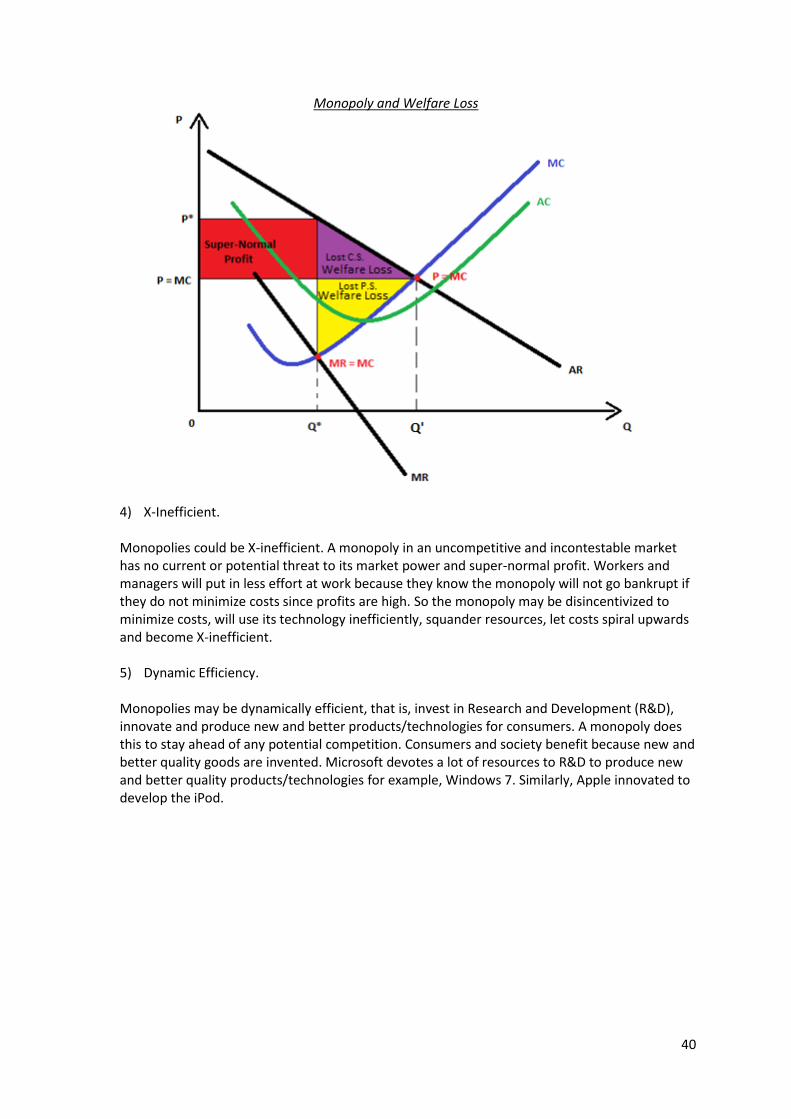
3) Pareto Inefficient. Monopolies are Pareto inefficient because they cause a welfare loss. Market failure happens because the price mechanism breaks down and resources are allocated by the monopoly and not free markets. The monopoly restricts output to raise price and maximize profit. Because the monopoly only produces Q* and not Q’ there is lost consumer surplus and lost producer surplus, a welfare loss, and society loses out.
40
Monopoly and Welfare Loss
4) X-Inefficient. Monopolies could be X-inefficient. A monopoly in an uncompetitive and incontestable market has no current or potential threat to its market power and super-normal profit. Workers and managers will put in less effort at work because they know the monopoly will not go bankrupt if they do not minimize costs since profits are high. So the monopoly may be disincentivized to minimize costs, will use its technology inefficiently, squander resources, let costs spiral upwards and become X-inefficient.
5) Dynamic Efficiency. Monopolies may be dynamically efficient, that is, invest in Research and Development (R&D), innovate and produce new and better products/technologies for consumers. A monopoly does this to stay ahead of any potential competition. Consumers and society benefit because new and better quality goods are invented. Microsoft devotes a lot of resources to R&D to produce new and better quality products/technologies for example, Windows 7. Similarly, Apple innovated to develop the iPod.
41
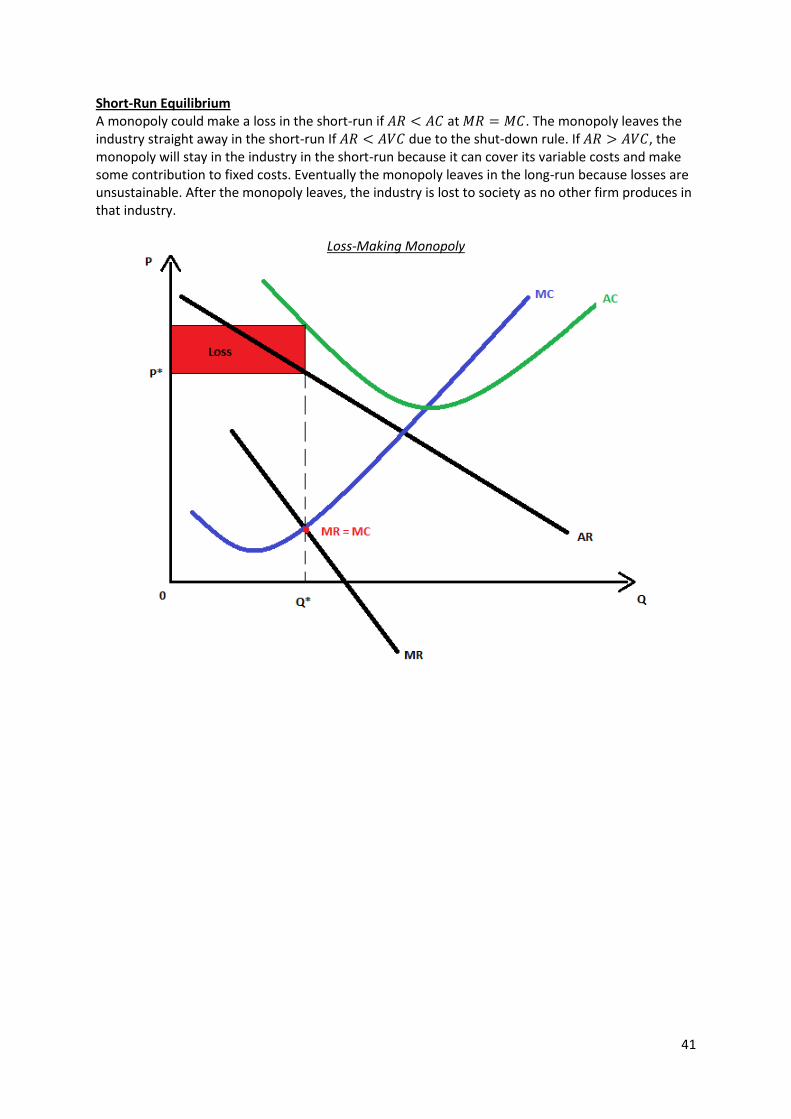
Short-Run Equilibrium A monopoly could make a loss in the short-run if at . The monopoly leaves the industry straight away in the short-run If due to the shut-down rule. If , the monopoly will stay in the industry in the short-run because it can cover its variable costs and make some contribution to fixed costs. Eventually the monopoly leaves in the long-run because losses are unsustainable. After the monopoly leaves, the industry is lost to society as no other firm produces in that industry.
Loss-Making Monopoly
42
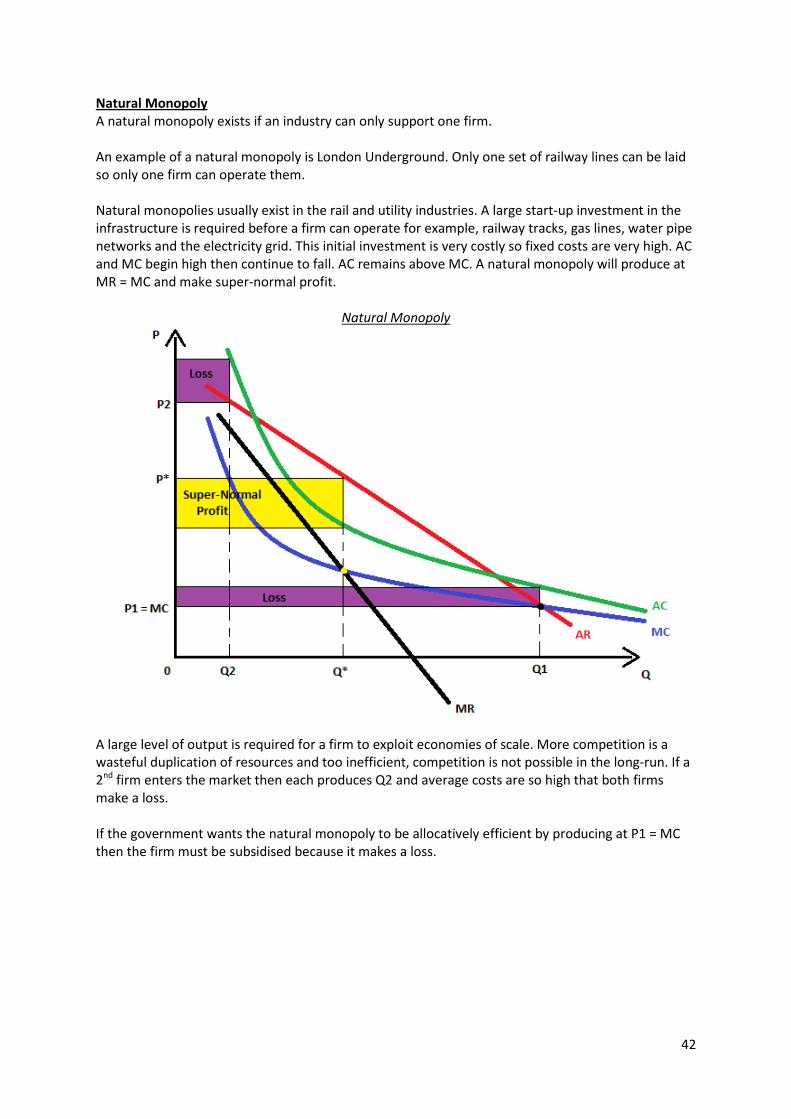
Natural Monopoly A natural monopoly exists if an industry can only support one firm. An example of a natural monopoly is London Underground. Only one set of railway lines can be laid so only one firm can operate them. Natural monopolies usually exist in the rail and utility industries. A large start-up investment in the infrastructure is required before a firm can operate for example, railway tracks, gas lines, water pipe networks and the electricity grid. This initial investment is very costly so fixed costs are very high. AC and MC begin high then continue to fall. AC remains above MC. A natural monopoly will produce at MR = MC and make super-normal profit.
Natural Monopoly
A large level of output is required for a firm to exploit economies of scale. More competition is a wasteful duplication of resources and too inefficient, competition is not possible in the long-run. If a 2nd firm enters the market then each produces Q2 and average costs are so high that both firms make a loss. If the government wants the natural monopoly to be allocatively efficient by producing at P1 = MC then the firm must be subsidised because it makes a loss.
43
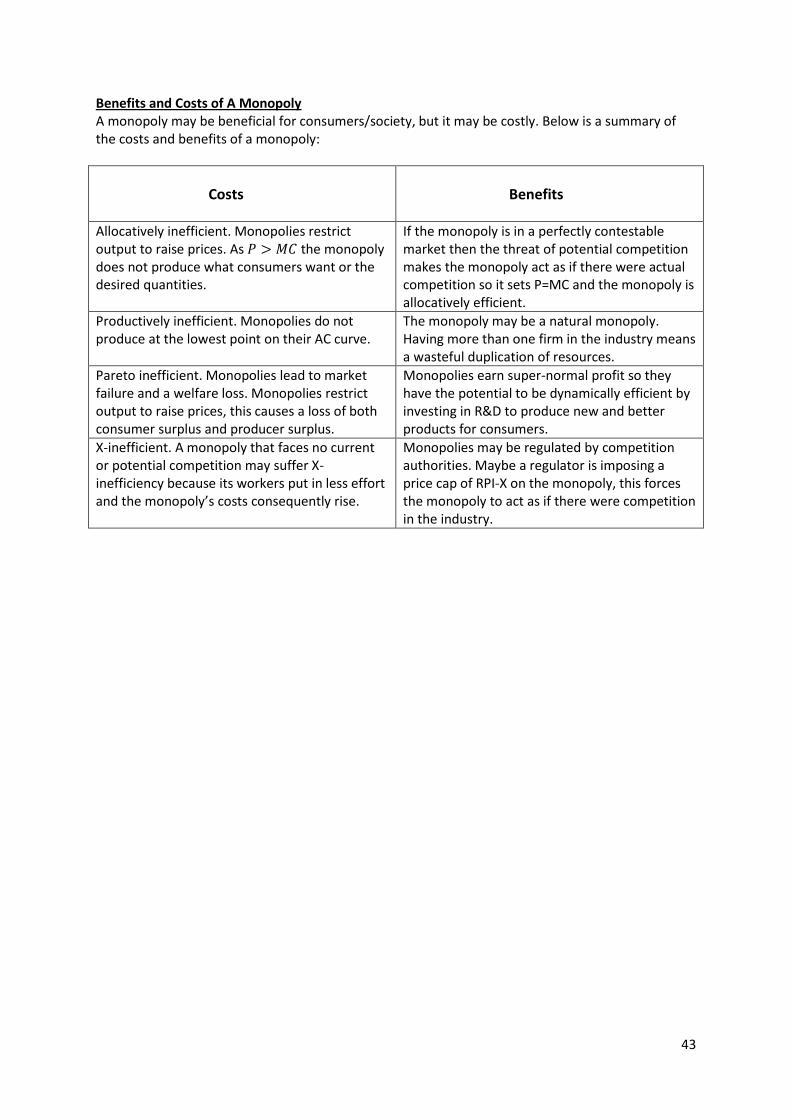
Benefits and Costs of A Monopoly A monopoly may be beneficial for consumers/society, but it may be costly. Below is a summary of the costs and benefits of a monopoly:
Costs
Benefits
Allocatively inefficient. Monopolies restrict output to raise prices. As the monopoly does not produce what consumers want or the desired quantities.
If the monopoly is in a perfectly contestable market then the threat of potential competition makes the monopoly act as if there were actual competition so it sets P=MC and the monopoly is allocatively efficient.
Productively inefficient. Monopolies do not produce at the lowest point on their AC curve.
The monopoly may be a natural monopoly. Having more than one firm in the industry means a wasteful duplication of resources.
Pareto inefficient. Monopolies lead to market failure and a welfare loss. Monopolies restrict output to raise prices, this causes a loss of both consumer surplus and producer surplus.
Monopolies earn super-normal profit so they have the potential to be dynamically efficient by investing in R&D to produce new and better products for consumers.
X-inefficient. A monopoly that faces no current or potential competition may suffer X-inefficiency because its workers put in less effort and the monopoly’s costs consequently rise.
Monopolies may be regulated by competition authorities. Maybe a regulator is imposing a price cap of RPI-X on the monopoly, this forces the monopoly to act as if there were competition in the industry.
44
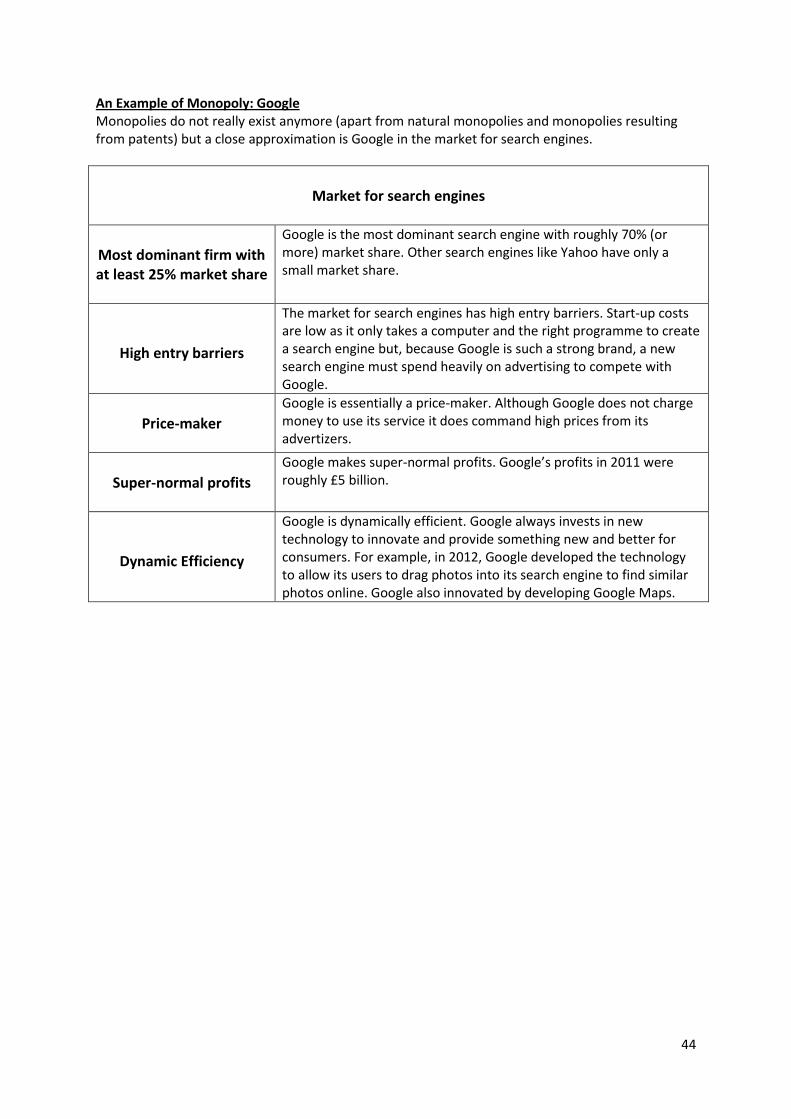
An Example of Monopoly: Google Monopolies do not really exist anymore (apart from natural monopolies and monopolies resulting from patents) but a close approximation is Google in the market for search engines.
Market for search engines
Most dominant firm with at least 25% market share
Google is the most dominant search engine with roughly 70% (or more) market share. Other search engines like Yahoo have only a small market share.
High entry barriers
The market for search engines has high entry barriers. Start-up costs are low as it only takes a computer and the right programme to create a search engine but, because Google is such a strong brand, a new search engine must spend heavily on advertising to compete with Google.
Price-maker
Google is essentially a price-maker. Although Google does not charge money to use its service it does command high prices from its advertizers.
Super-normal profits
Google makes super-normal profits. Google’s profits in 2011 were roughly £5 billion.
Dynamic Efficiency
Google is dynamically efficient. Google always invests in new technology to innovate and provide something new and better for consumers. For example, in 2012, Google developed the technology to allow its users to drag photos into its search engine to find similar photos online. Google also innovated by developing Google Maps.
45
Oligopoly
An oligopoly is a market where there are a few large dominant firms and each firm’s actions affect each other. Examples of oligopolies include banking, supermarkets, car manufacturers and OPEC. Assumptions:
1) A few large firms dominate the market. Many small firms may also exist but with no market power.
2) Large firms are interdependent, their actions affect each other.
3) There are significant entry barriers.
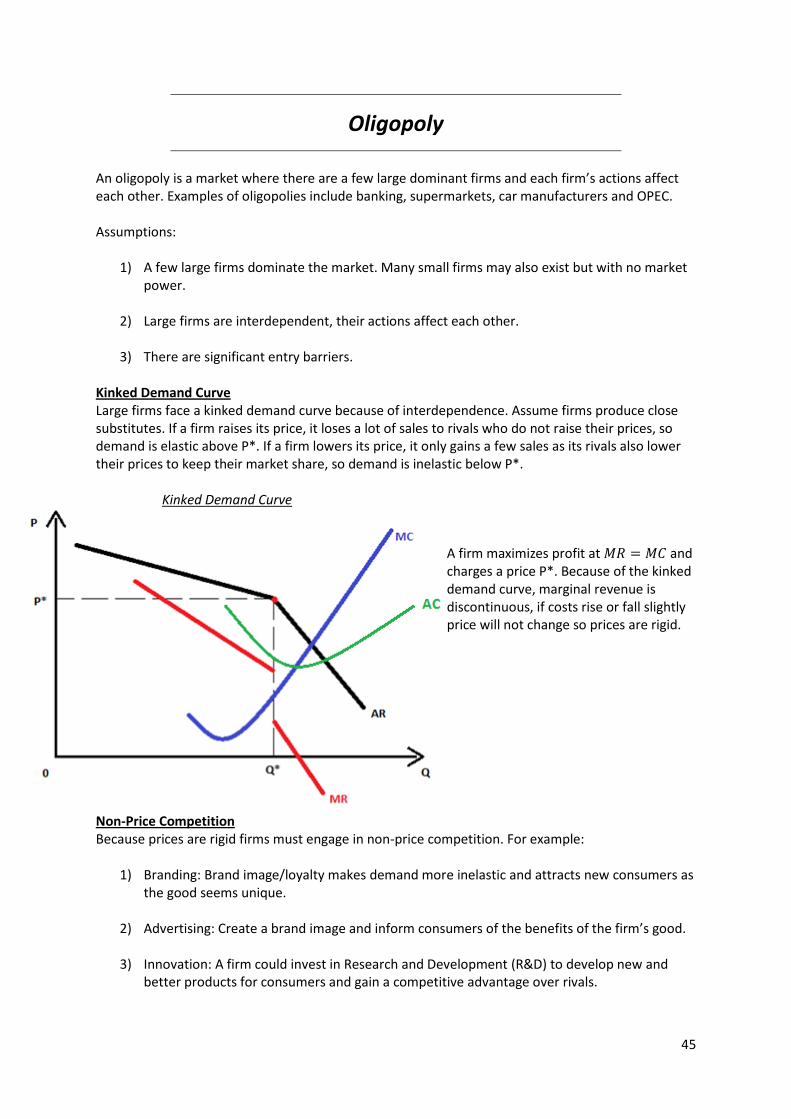
Kinked Demand Curve Large firms face a kinked demand curve because of interdependence. Assume firms produce close substitutes. If a firm raises its price, it loses a lot of sales to rivals who do not raise their prices, so demand is elastic above P*. If a firm lowers its price, it only gains a few sales as its rivals also lower their prices to keep their market share, so demand is inelastic below P*. Kinked Demand Curve A firm maximizes profit at and charges a price P*. Because of the kinked demand curve, marginal revenue is discontinuous, if costs rise or fall slightly price will not change so prices are rigid. Non-Price Competition Because prices are rigid firms must engage in non-price competition. For example:
1) Branding: Brand image/loyalty makes demand more inelastic and attracts new consumers as the good seems unique.
2) Advertising: Create a brand image and inform consumers of the benefits of the firm’s good.
3) Innovation: A firm could invest in Research and Development (R&D) to develop new and
better products for consumers and gain a competitive advantage over rivals.
46
4) Quality: Better quality than rival goods.
5) Loyalty Cards: Incentivizes consumers to keep shopping with a specific firm to gain rewards.
6) Longer Opening Hours: Convenience for consumers.
7) In-Store Services: Crèche, Post-Office, chemist etc. makes it convenient for consumers.
8) Banking and Financial Services: Convenience for consumers as everything is in one place.
9) Internet Shopping: Allows consumers to shop at home.
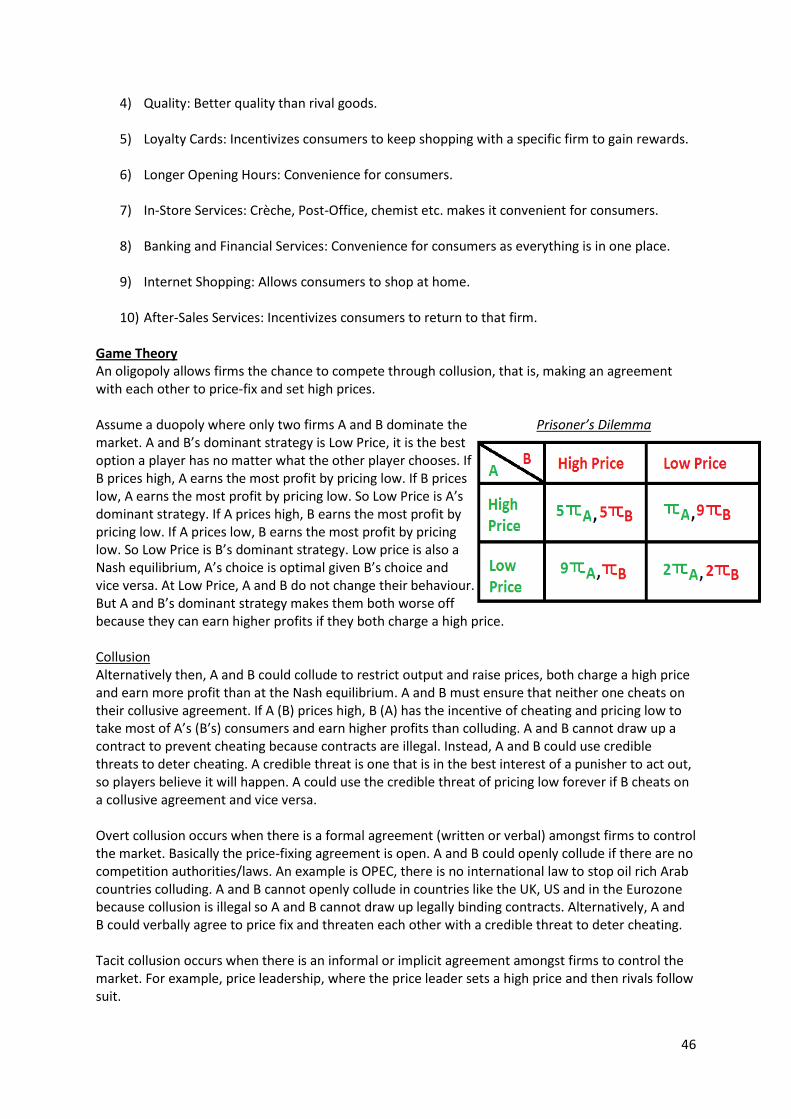
10) After-Sales Services: Incentivizes consumers to return to that firm. Game Theory An oligopoly allows firms the chance to compete through collusion, that is, making an agreement with each other to price-fix and set high prices. Assume a duopoly where only two firms A and B dominate the Prisoner’s Dilemma market. A and B’s dominant strategy is Low Price, it is the best option a player has no matter what the other player chooses. If B prices high, A earns the most profit by pricing low. If B prices low, A earns the most profit by pricing low. So Low Price is A’s dominant strategy. If A prices high, B earns the most profit by pricing low. If A prices low, B earns the most profit by pricing low. So Low Price is B’s dominant strategy. Low price is also a Nash equilibrium, A’s choice is optimal given B’s choice and vice versa. At Low Price, A and B do not change their behaviour. But A and B’s dominant strategy makes them both worse off because they can earn higher profits if they both charge a high price. Collusion Alternatively then, A and B could collude to restrict output and raise prices, both charge a high price and earn more profit than at the Nash equilibrium. A and B must ensure that neither one cheats on their collusive agreement. If A (B) prices high, B (A) has the incentive of cheating and pricing low to take most of A’s (B’s) consumers and earn higher profits than colluding. A and B cannot draw up a contract to prevent cheating because contracts are illegal. Instead, A and B could use credible threats to deter cheating. A credible threat is one that is in the best interest of a punisher to act out, so players believe it will happen. A could use the credible threat of pricing low forever if B cheats on a collusive agreement and vice versa. Overt collusion occurs when there is a formal agreement (written or verbal) amongst firms to control the market. Basically the price-fixing agreement is open. A and B could openly collude if there are no competition authorities/laws. An example is OPEC, there is no international law to stop oil rich Arab countries colluding. A and B cannot openly collude in countries like the UK, US and in the Eurozone because collusion is illegal so A and B cannot draw up legally binding contracts. Alternatively, A and B could verbally agree to price fix and threaten each other with a credible threat to deter cheating. Tacit collusion occurs when there is an informal or implicit agreement amongst firms to control the market. For example, price leadership, where the price leader sets a high price and then rivals follow suit.

47
Batman Interrogating The Joker and Mr Freeze: Confess or Keep Quiet? Assume The Joker and Mr Freeze robbed a bank together and have been caught by Batman and Gotham City’s police. Batman is interrogating The Joker and Mr Freeze in separate rooms, The Joker and Mr Freeze cannot communicate at all. Should The Joker and Mr Freeze confess or keep quiet? If both The Joker and Mr Freeze confess to robbing the bank they will both go to jail for 5 years each. If The Joker confesses and Mr Freeze keeps quiet then Gotham police will let The Joker off for cooperating with them and throw the book at Mr Freeze by jailing him for 30 years and vice versa. If both The Joker and Mr Freeze keep quiet then they will both go to jail for just 1 year each.
If The Joker believes Mr Freeze will keep quiet then The Joker will want to confess and get away with the crime rather than keep quiet too and go to jail for 1 year. Mr Freeze will reason the same way. So both The Joker and Mr Freeze will play their dominant strategy and confess. Both The Joker and Mr Freeze confessing means they will go to jail for 5 years each. So the Nash equilibrium (Confess, Confess) makes The Joker and Mr Freeze worse off than if they both keep quiet. As long as The Joker and Mr Freeze cannot communicate and do not trust each other to keep quiet, they will both confess. If The Joker and Mr Freeze could collude and make an agreement or if they trust each other then they could both keep quiet.
48
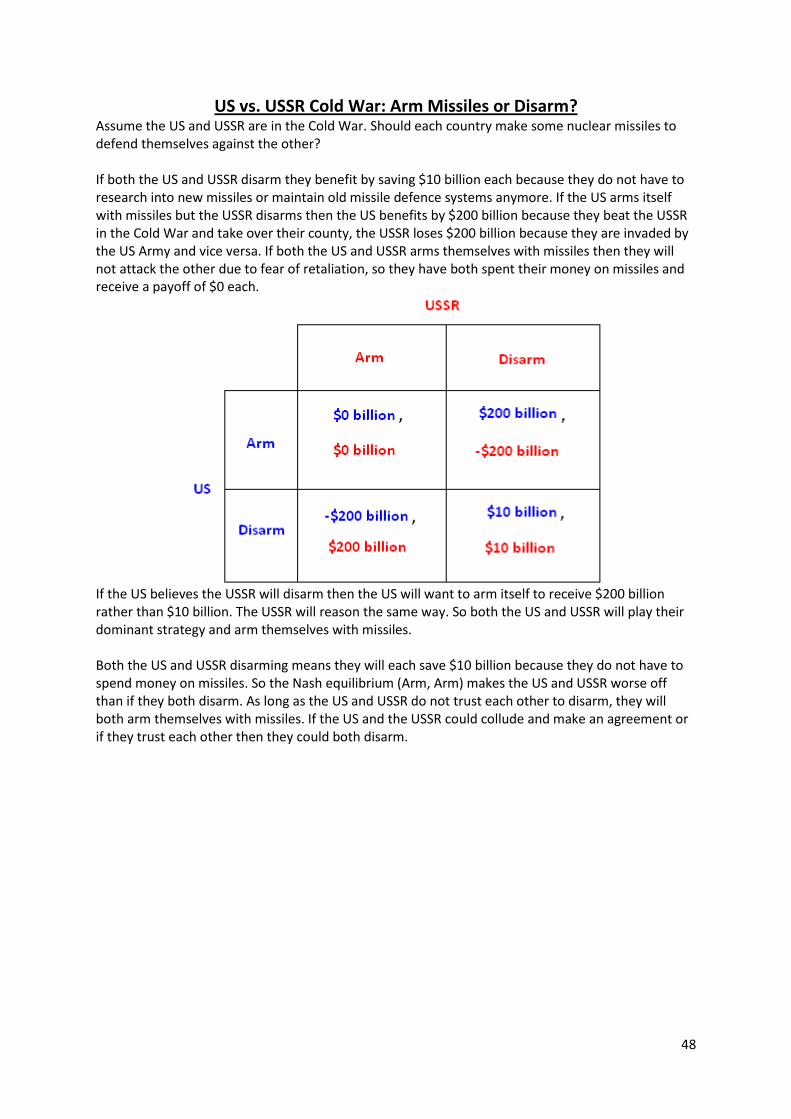
US vs. USSR Cold War: Arm Missiles or Disarm? Assume the US and USSR are in the Cold War. Should each country make some nuclear missiles to defend themselves against the other? If both the US and USSR disarm they benefit by saving $10 billion each because they do not have to research into new missiles or maintain old missile defence systems anymore. If the US arms itself with missiles but the USSR disarms then the US benefits by $200 billion because they beat the USSR in the Cold War and take over their county, the USSR loses $200 billion because they are invaded by the US Army and vice versa. If both the US and USSR arms themselves with missiles then they will not attack the other due to fear of retaliation, so they have both spent their money on missiles and receive a payoff of $0 each.
If the US believes the USSR will disarm then the US will want to arm itself to receive $200 billion rather than $10 billion. The USSR will reason the same way. So both the US and USSR will play their dominant strategy and arm themselves with missiles. Both the US and USSR disarming means they will each save $10 billion because they do not have to spend money on missiles. So the Nash equilibrium (Arm, Arm) makes the US and USSR worse off than if they both disarm. As long as the US and USSR do not trust each other to disarm, they will both arm themselves with missiles. If the US and the USSR could collude and make an agreement or if they trust each other then they could both disarm.

49
Kim Kardashian and Angelina Jolie: Make-Up or No Make-Up? Assume Kim Kardashian and Angelina Jolie spend 30 minutes each day applying their own make-up. Should Kim and Angelina apply make-up or should they use no make-up at all? Let’s say if Kim and Angelina stopped using make-up they receive a payoff of 30 because they do not need to spend 30 minutes each day applying their own make-up. Let’s say Kim believes Angelina will not use make-up, Kim will use make-up because it will make her look more attractive so she receives a payoff of 200, Angelina look less attractive so she receives a payoff of -50 and vice versa. If both Kim and Angelina use make-up they receive a payoff of 0 because they both look equally more attractive than before so it has not changed who looks more attractive than the other and they now lose 30 minutes of their day applying make-up.
If Kim believes Angelina will use no make-up then Kim will want to use make-up to look more attractive than Angelina and receive a payoff of 200 rather than 0. Angelina will reason the same way. So both Kim and Angelina will play their dominant strategy and apply make-up. Both Kim and Angelina using make-up means they will each receive a payoff of 0 because both Kim and Angelina using make-up does not change who looks more attractive and yet they waste 30 minutes applying their own make-up. So the Nash equilibrium (Make-Up, Make-Up) makes Kim and Angelina worse off than if they both use no make-up. As long as Kim and Angelina do not trust each other to use no make-up, they will both use make-up. If Kim and Angelina could collude and make an agreement or if they trust each other then they could both use no make-up.
50
Coca-Cola and Pepsi: Advertise or Do Not Advertise?
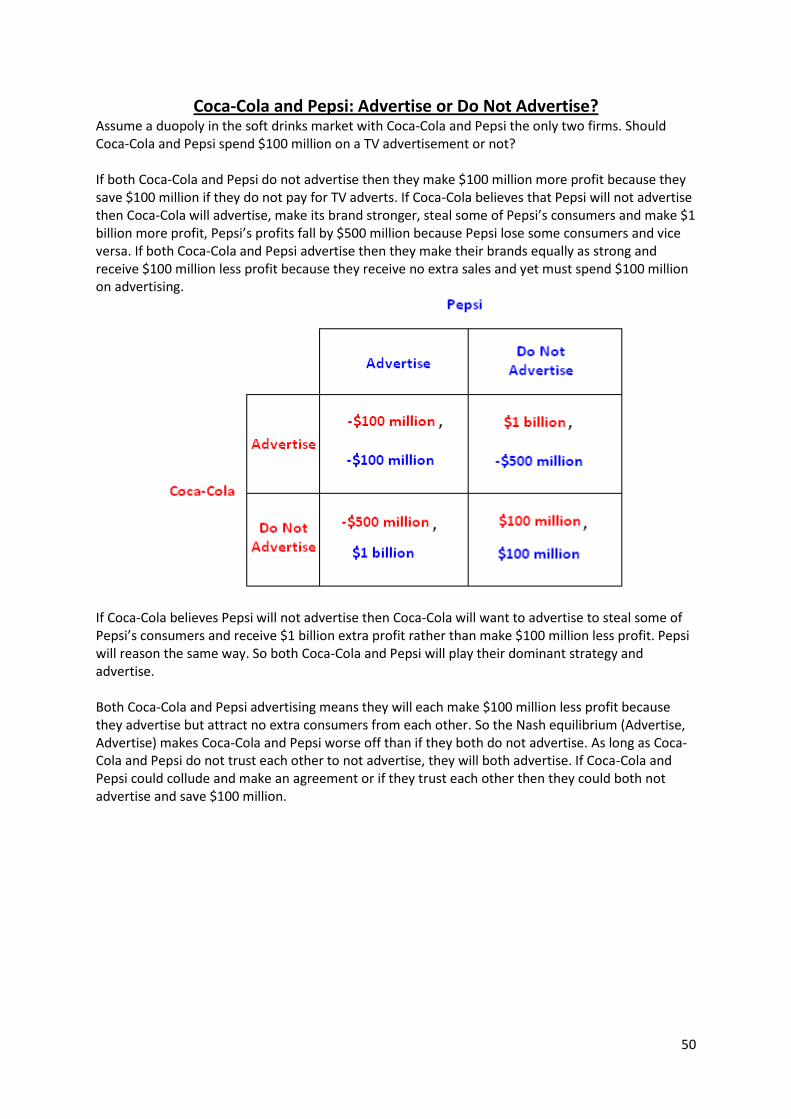
Assume a duopoly in the soft drinks market with Coca-Cola and Pepsi the only two firms. Should Coca-Cola and Pepsi spend $100 million on a TV advertisement or not? If both Coca-Cola and Pepsi do not advertise then they make $100 million more profit because they save $100 million if they do not pay for TV adverts. If Coca-Cola believes that Pepsi will not advertise then Coca-Cola will advertise, make its brand stronger, steal some of Pepsi’s consumers and make $1 billion more profit, Pepsi’s profits fall by $500 million because Pepsi lose some consumers and vice versa. If both Coca-Cola and Pepsi advertise then they make their brands equally as strong and receive $100 million less profit because they receive no extra sales and yet must spend $100 million on advertising.
If Coca-Cola believes Pepsi will not advertise then Coca-Cola will want to advertise to steal some of Pepsi’s consumers and receive $1 billion extra profit rather than make $100 million less profit. Pepsi will reason the same way. So both Coca-Cola and Pepsi will play their dominant strategy and advertise. Both Coca-Cola and Pepsi advertising means they will each make $100 million less profit because they advertise but attract no extra consumers from each other. So the Nash equilibrium (Advertise, Advertise) makes Coca-Cola and Pepsi worse off than if they both do not advertise. As long as Coca-Cola and Pepsi do not trust each other to not advertise, they will both advertise. If Coca-Cola and Pepsi could collude and make an agreement or if they trust each other then they could both not advertise and save $100 million.
51
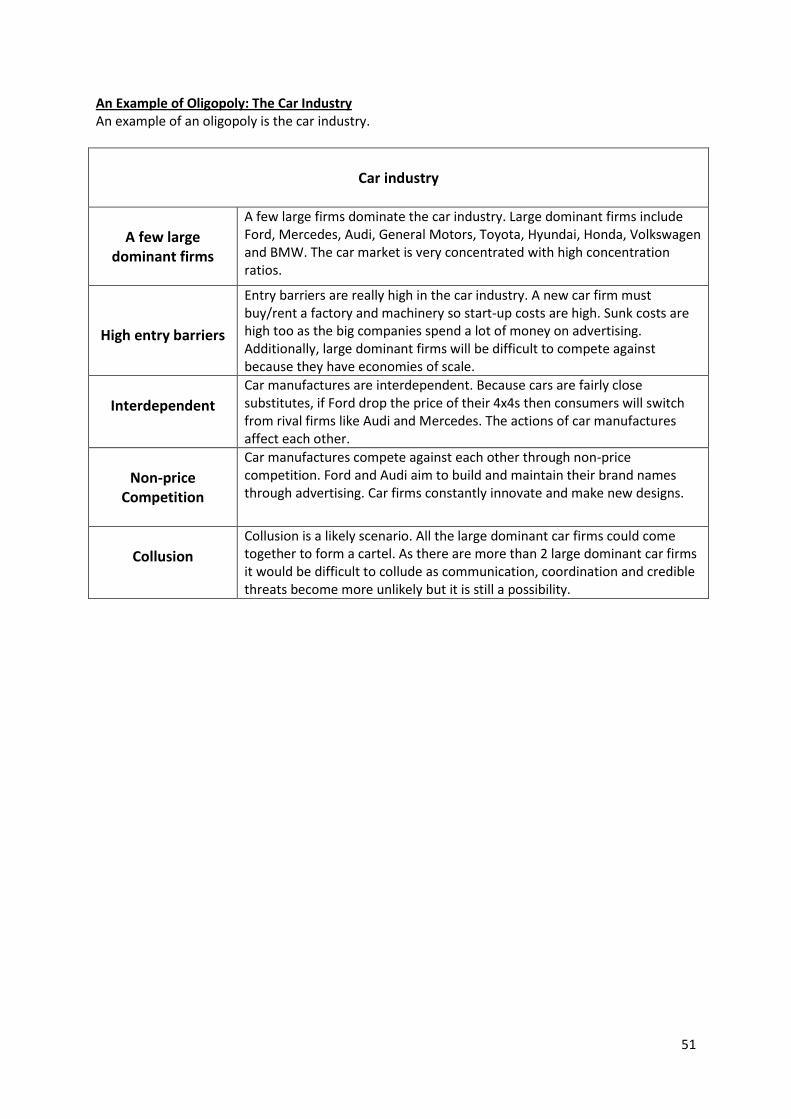
An Example of Oligopoly: The Car Industry An example of an oligopoly is the car industry.
Car industry
A few large
dominant firms
A few large firms dominate the car industry. Large dominant firms include Ford, Mercedes, Audi, General Motors, Toyota, Hyundai, Honda, Volkswagen and BMW. The car market is very concentrated with high concentration ratios.
High entry barriers
Entry barriers are really high in the car industry. A new car firm must buy/rent a factory and machinery so start-up costs are high. Sunk costs are high too as the big companies spend a lot of money on advertising. Additionally, large dominant firms will be difficult to compete against because they have economies of scale.
Interdependent
Car manufactures are interdependent. Because cars are fairly close substitutes, if Ford drop the price of their 4x4s then consumers will switch from rival firms like Audi and Mercedes. The actions of car manufactures affect each other.
Non-price
Competition
Car manufactures compete against each other through non-price competition. Ford and Audi aim to build and maintain their brand names through advertising. Car firms constantly innovate and make new designs.
Collusion
Collusion is a likely scenario. All the large dominant car firms could come together to form a cartel. As there are more than 2 large dominant car firms it would be difficult to collude as communication, coordination and credible threats become more unlikely but it is still a possibility.
52
Monopolistic Competition
Monopolistic competition combines the price-making of monopoly with the many firms of perfect competition. Monopolistically competitive firms earn normal profit and are allocatively and productively inefficient in both the short-run and long-run. Monopolistic competition is very common in reality, some examples include: restaurants, salons, clothes, hotels, toothpaste, fast-food shops and newsagents. Assumptions:
1) Many Buyers and Sellers. Many sellers means that each firm has a small market share. Many buyers means no buyer has any monopsony power to affect prices.
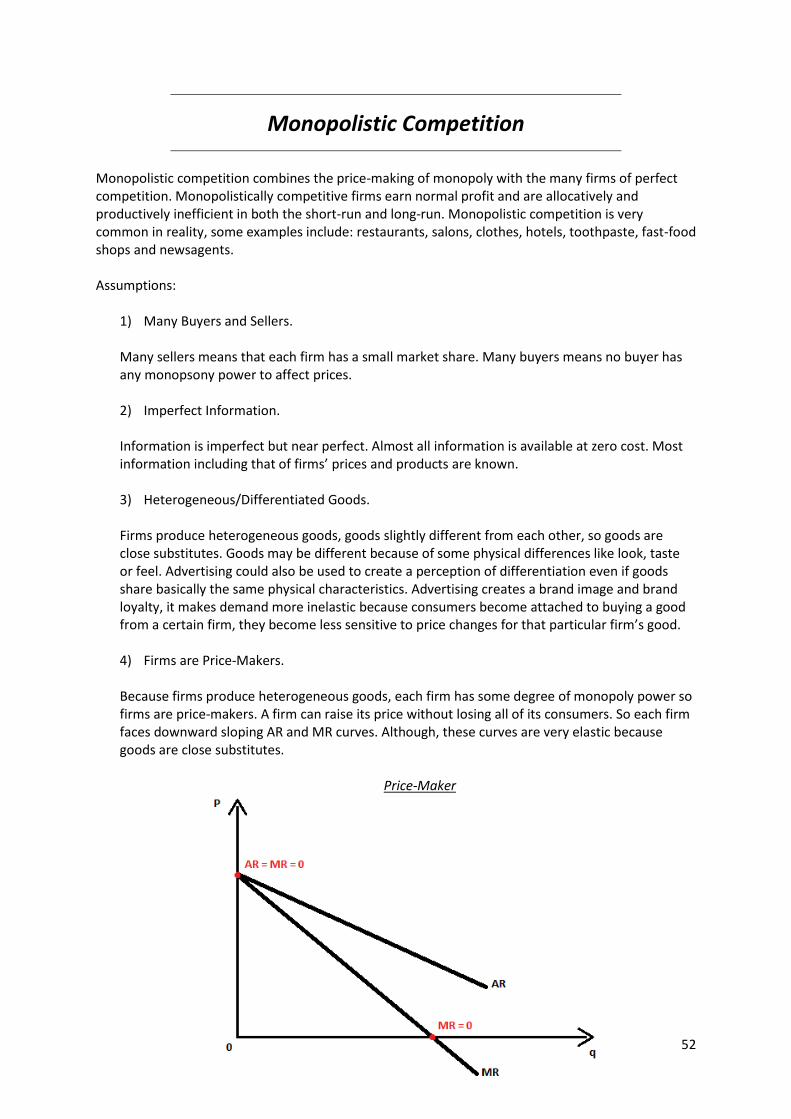
2) Imperfect Information. Information is imperfect but near perfect. Almost all information is available at zero cost. Most information including that of firms’ prices and products are known. 3) Heterogeneous/Differentiated Goods. Firms produce heterogeneous goods, goods slightly different from each other, so goods are close substitutes. Goods may be different because of some physical differences like look, taste or feel. Advertising could also be used to create a perception of differentiation even if goods share basically the same physical characteristics. Advertising creates a brand image and brand loyalty, it makes demand more inelastic because consumers become attached to buying a good from a certain firm, they become less sensitive to price changes for that particular firm’s good. 4) Firms are Price-Makers. Because firms produce heterogeneous goods, each firm has some degree of monopoly power so firms are price-makers. A firm can raise its price without losing all of its consumers. So each firm faces downward sloping AR and MR curves. Although, these curves are very elastic because goods are close substitutes.
Price-Maker
53
A firm’s demand curve depends on the number of rival firms in the market. As the number of firms in the market rises, each firm’s demand curve shifts left because consumers become more spread out over each firm (buy less from each particular firm).
5) Firms Maximize Profit at . 6) Low Entry or Exit Barriers. New firms can easily enter the industry at any time and incumbent firms can easily leave the industry at any time.
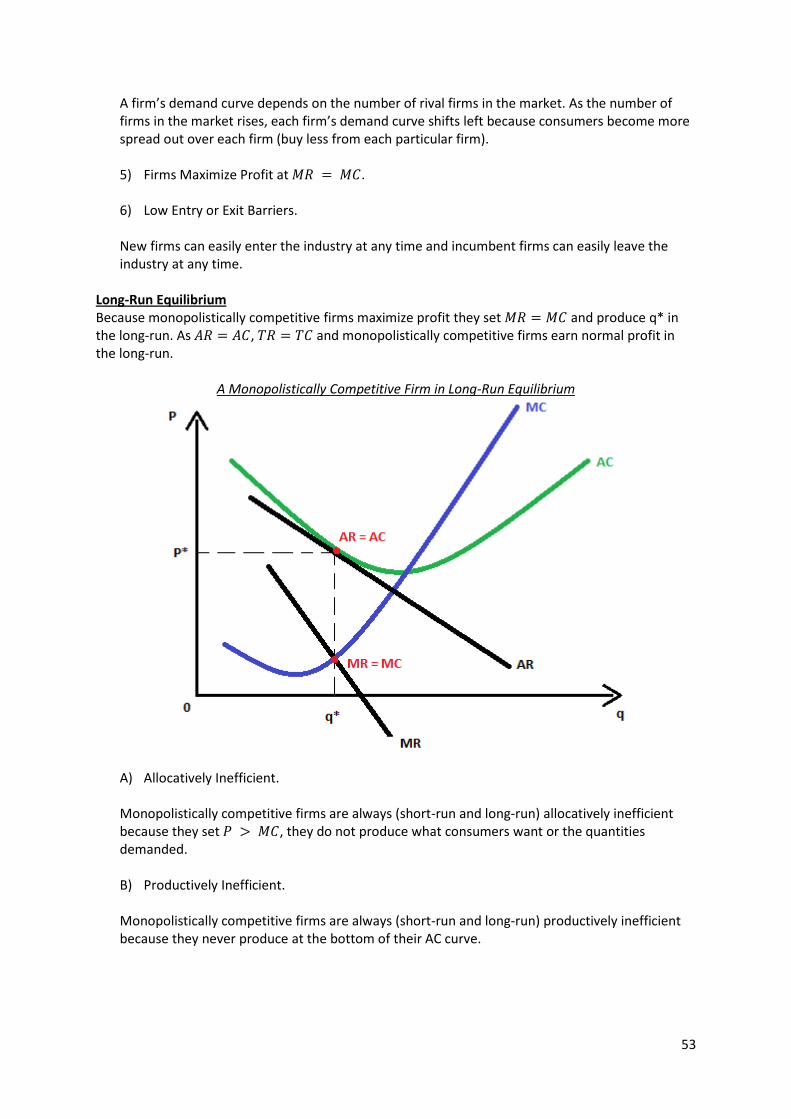
Long-Run Equilibrium Because monopolistically competitive firms maximize profit they set and produce q* in the long-run. As , and monopolistically competitive firms earn normal profit in the long-run.
A Monopolistically Competitive Firm in Long-Run Equilibrium
A) Allocatively Inefficient. Monopolistically competitive firms are always (short-run and long-run) allocatively inefficient because they set , they do not produce what consumers want or the quantities demanded.
B) Productively Inefficient. Monopolistically competitive firms are always (short-run and long-run) productively inefficient because they never produce at the bottom of their AC curve.

54
Short-Run Equilibrium Assume an increase in industry demand occurs and each firms’ AR and MR curves shift rightwards.
An Increase in Demand
As the MR and AR curves shift rightwards, a higher market price is received and more is produced. At , so firms are now making super-normal profit. Because of perfect information and no entry barriers, super-normal profit acts as a signal attracting new firms to enter the industry. New firms take away some of the existing firms’ consumers until and both shift back to their long-run equilibrium levels. Super-normal profit is competed away and normal profit is earned again.
55
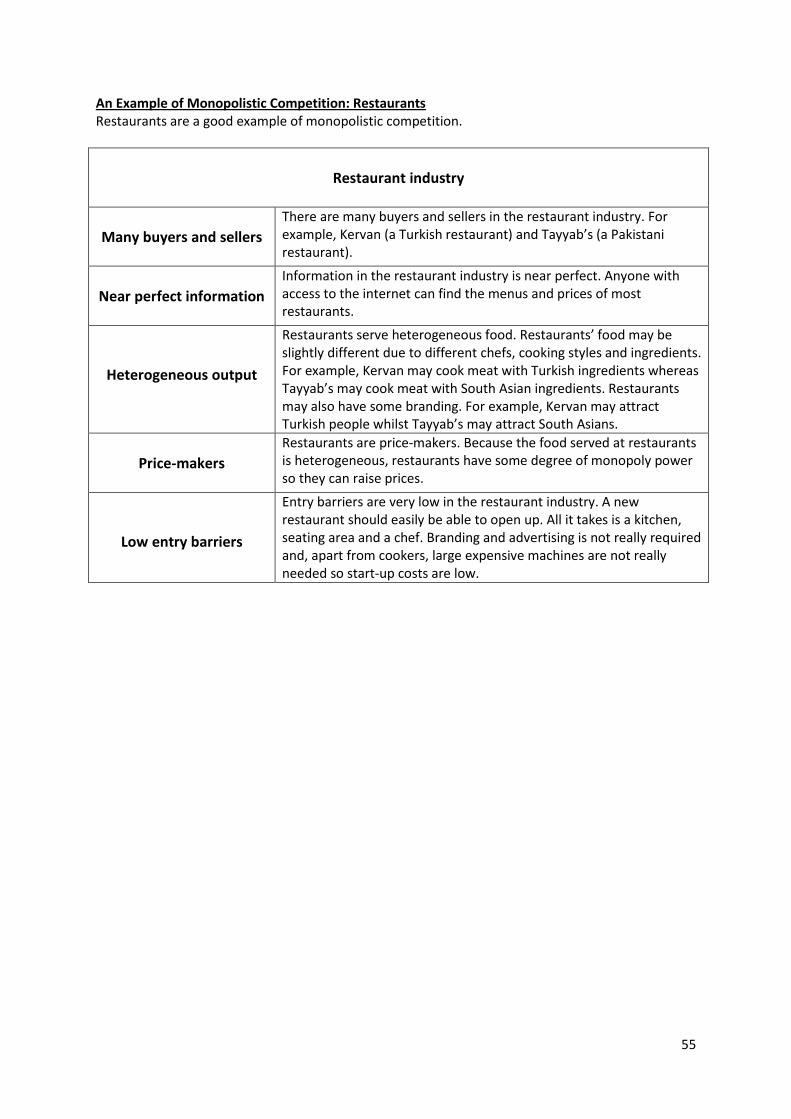
An Example of Monopolistic Competition: Restaurants Restaurants are a good example of monopolistic competition.
Restaurant industry
Many buyers and sellers
There are many buyers and sellers in the restaurant industry. For example, Kervan (a Turkish restaurant) and Tayyab’s (a Pakistani restaurant).
Near perfect information
Information in the restaurant industry is near perfect. Anyone with access to the internet can find the menus and prices of most restaurants.
Heterogeneous output
Restaurants serve heterogeneous food. Restaurants’ food may be slightly different due to different chefs, cooking styles and ingredients. For example, Kervan may cook meat with Turkish ingredients whereas Tayyab’s may cook meat with South Asian ingredients. Restaurants may also have some branding. For example, Kervan may attract Turkish people whilst Tayyab’s may attract South Asians.
Price-makers
Restaurants are price-makers. Because the food served at restaurants is heterogeneous, restaurants have some degree of monopoly power so they can raise prices.
Low entry barriers
Entry barriers are very low in the restaurant industry. A new restaurant should easily be able to open up. All it takes is a kitchen, seating area and a chef. Branding and advertising is not really required and, apart from cookers, large expensive machines are not really needed so start-up costs are low.
56
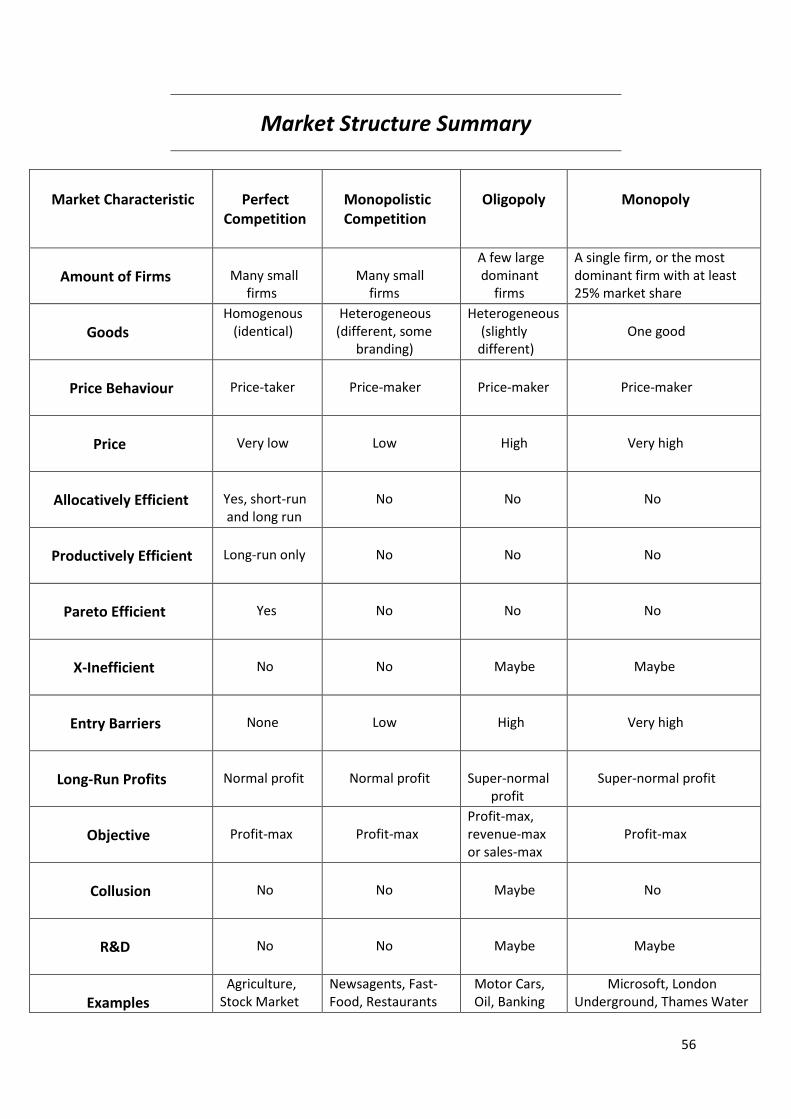
Market Structure Summary
Market Characteristic
Perfect Competition
Monopolistic Competition
Oligopoly
Monopoly
Amount of Firms
Many small firms
Many small firms
A few large dominant firms
A single firm, or the most dominant firm with at least 25% market share
Goods
Homogenous (identical)
Heterogeneous (different, some branding)
Heterogeneous (slightly different)
One good
Price Behaviour
Price-taker
Price-maker
Price-maker
Price-maker
Price
Very low
Low
High
Very high
Allocatively Efficient
Yes, short-run and long run
No
No
No
Productively Efficient
Long-run only
No
No
No
Pareto Efficient
Yes
No
No
No
X-Inefficient
No
No
Maybe
Maybe
Entry Barriers
None
Low
High
Very high
Long-Run Profits
Normal profit
Normal profit
Super-normal profit
Super-normal profit
Objective
Profit-max
Profit-max
Profit-max, revenue-max or sales-max
Profit-max
Collusion
No
No
Maybe
No
R&D
No
No
Maybe
Maybe
Examples
Agriculture, Stock Market
Newsagents, Fast-Food, Restaurants
Motor Cars, Oil, Banking
Microsoft, London Underground, Thames Water
57
Concentration Ratio
A concentration ratio measures the combined market share of the largest ‘N’ firms in an industry. A four firm concentration ratio of 97% is written:
This means the largest 4 firms own a combined market share of 97%. A concentrated market is one in which a few large firms dominate. A few large produces have a large market share. is high. A diluted market is one in which there are many small firms. There is a lot of competition and no firms dominate the market. is low.
58
Monopsony
A monopsony is the only buyer in the market. Conditions for a monopsony:
- The monopsony must have market power. - Sellers must not be able to sell their goods to buyers outside of their market.
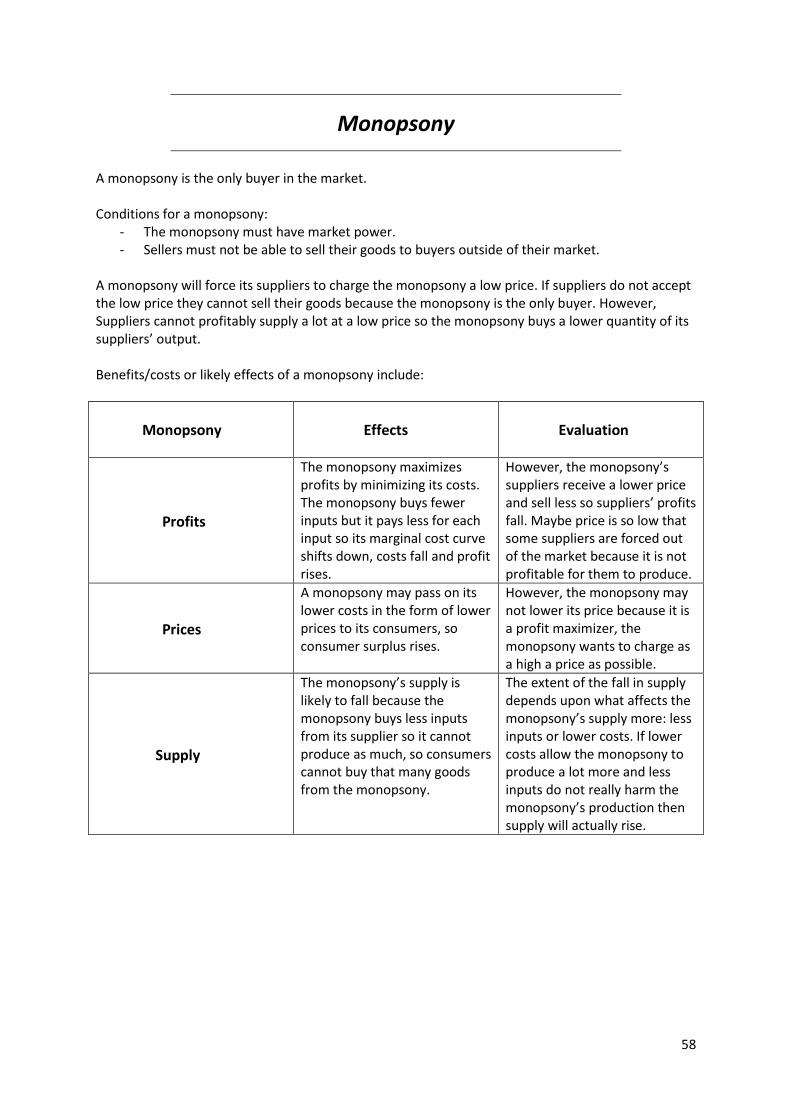
A monopsony will force its suppliers to charge the monopsony a low price. If suppliers do not accept the low price they cannot sell their goods because the monopsony is the only buyer. However, Suppliers cannot profitably supply a lot at a low price so the monopsony buys a lower quantity of its suppliers’ output. Benefits/costs or likely effects of a monopsony include:
Monopsony
Effects
Evaluation
Profits
The monopsony maximizes profits by minimizing its costs. The monopsony buys fewer inputs but it pays less for each input so its marginal cost curve shifts down, costs fall and profit rises.
However, the monopsony’s suppliers receive a lower price and sell less so suppliers’ profits fall. Maybe price is so low that some suppliers are forced out of the market because it is not profitable for them to produce.
Prices
A monopsony may pass on its lower costs in the form of lower prices to its consumers, so consumer surplus rises.
However, the monopsony may not lower its price because it is a profit maximizer, the monopsony wants to charge as a high a price as possible.
Supply
The monopsony’s supply is likely to fall because the monopsony buys less inputs from its supplier so it cannot produce as much, so consumers cannot buy that many goods from the monopsony.
The extent of the fall in supply depends upon what affects the monopsony’s supply more: less inputs or lower costs. If lower costs allow the monopsony to produce a lot more and less inputs do not really harm the monopsony’s production then supply will actually rise.
59
Price Discrimination
A monopoly seeks to price discriminate to increase profit. Price discrimination occurs when a firm charges different consumers different prices for identical goods. Assumptions:
1) Monopoly Power. The firm must control the price and supply of the good.
2) Different Elasticities. Different consumers must have different price elasticities of demand. A higher price is charged to those with a more inelastic demand. A lower price is charged to those with a more elastic demand. The monopoly must identify each consumer’s elasticity.
3) No Market Seepage (No Arbitrage). A consumer must not be able to buy the good at a low price and re-sell it to another consumer for a higher price. Otherwise the monopoly does not benefit because it does not earn the higher prices and profits.
4) Market Separating Costs. The costs of separating different consumers into different market segments must not exceed the additional revenue generated by price discrimination. Otherwise price discrimination is not profitable.
60
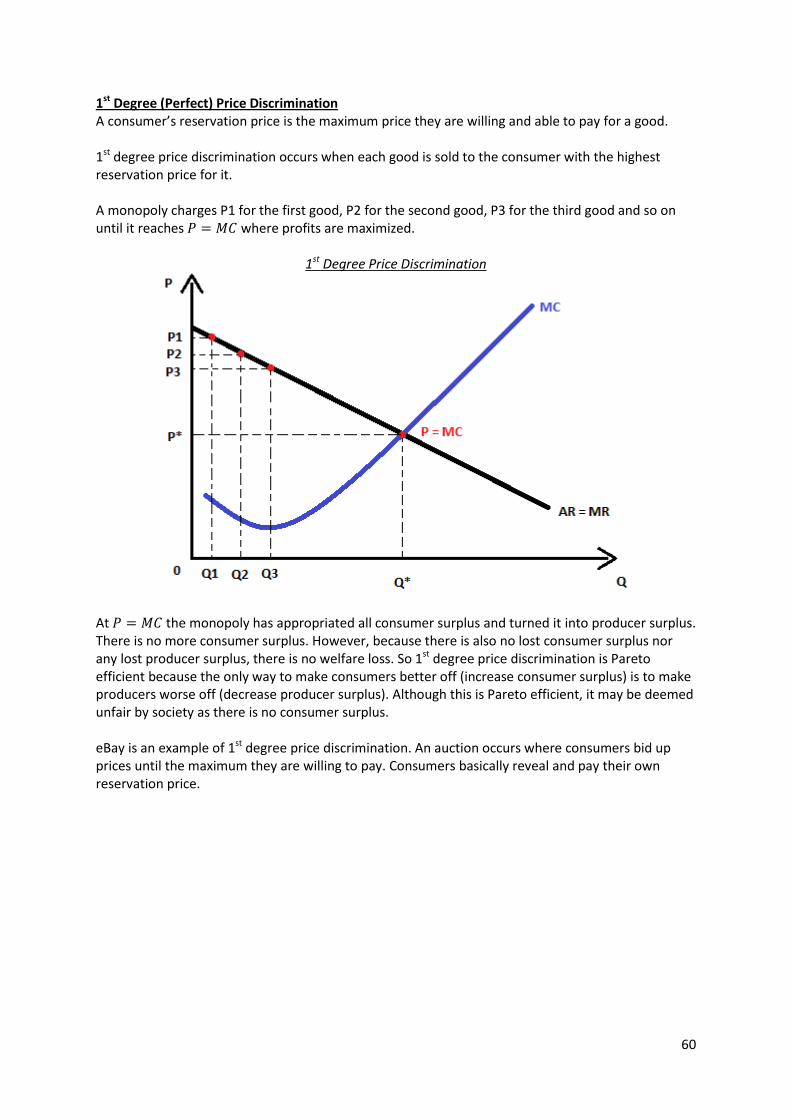
1st Degree (Perfect) Price Discrimination A consumer’s reservation price is the maximum price they are willing and able to pay for a good. 1st degree price discrimination occurs when each good is sold to the consumer with the highest reservation price for it. A monopoly charges P1 for the first good, P2 for the second good, P3 for the third good and so on until it reaches where profits are maximized.
1st Degree Price Discrimination
At the monopoly has appropriated all consumer surplus and turned it into producer surplus. There is no more consumer surplus. However, because there is also no lost consumer surplus nor any lost producer surplus, there is no welfare loss. So 1st degree price discrimination is Pareto efficient because the only way to make consumers better off (increase consumer surplus) is to make producers worse off (decrease producer surplus). Although this is Pareto efficient, it may be deemed unfair by society as there is no consumer surplus. eBay is an example of 1st degree price discrimination. An auction occurs where consumers bid up prices until the maximum they are willing to pay. Consumers basically reveal and pay their own reservation price.
61
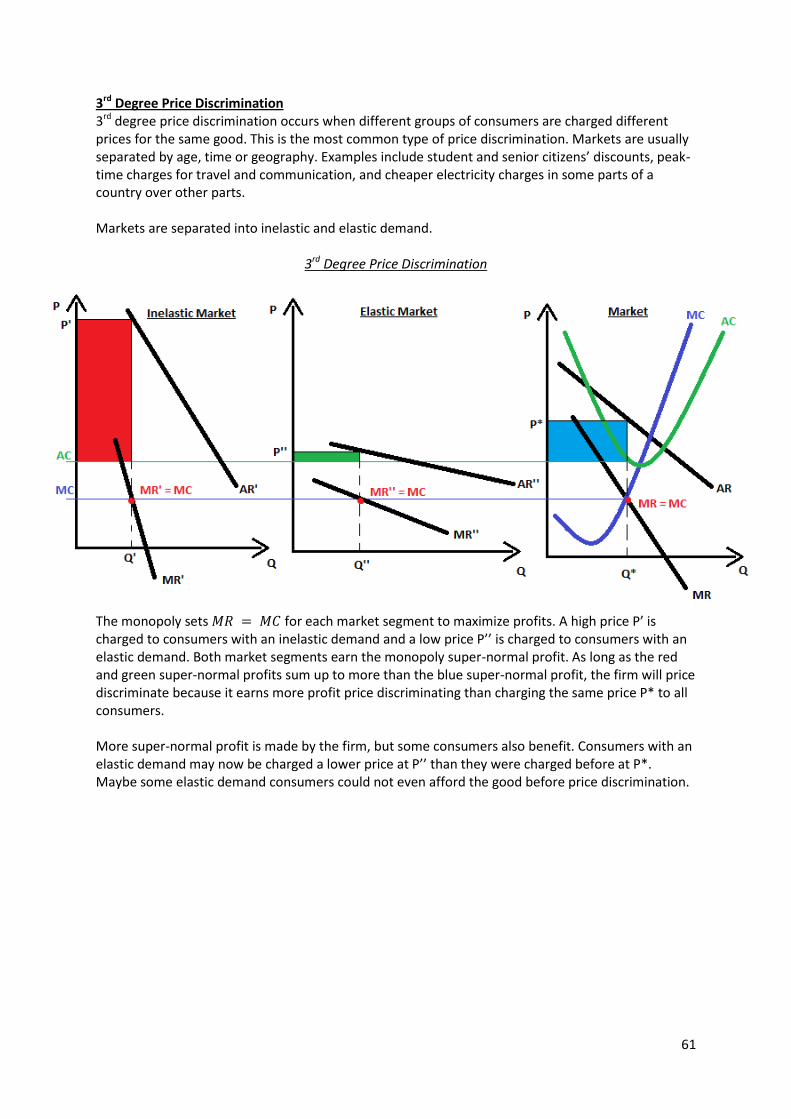
3rd Degree Price Discrimination 3rd degree price discrimination occurs when different groups of consumers are charged different prices for the same good. This is the most common type of price discrimination. Markets are usually separated by age, time or geography. Examples include student and senior citizens’ discounts, peak-time charges for travel and communication, and cheaper electricity charges in some parts of a country over other parts. Markets are separated into inelastic and elastic demand.
3rd Degree Price Discrimination The monopoly sets for each market segment to maximize profits. A high price P’ is charged to consumers with an inelastic demand and a low price P’’ is charged to consumers with an elastic demand. Both market segments earn the monopoly super-normal profit. As long as the red and green super-normal profits sum up to more than the blue super-normal profit, the firm will price discriminate because it earns more profit price discriminating than charging the same price P* to all consumers. More super-normal profit is made by the firm, but some consumers also benefit. Consumers with an elastic demand may now be charged a lower price at P’’ than they were charged before at P*. Maybe some elastic demand consumers could not even afford the good before price discrimination.
62
Why Firms Grow
A firm grows for three main reasons:
1) Market Power: A larger firm has more market share, a recognizable brand and market power to raise prices and earn higher profits.
2) Economies of Scale: A larger firm can benefit from economies of scale. For example,
marketing, financial and production economies can be experienced by a growing firm. This means costs are lower and profits are higher.
3) Diversification: A firm may grow to diversify and reduce risk. A car company may be at risk of
fluctuating demand but a supermarket may not be. A car company could become a conglomerate and take over a supermarket to diversify and reduce risk.
Internal Growth vs. External Growth A firm could grow internally by re-investing its profits to increase production. Maybe the firm builds and opens new stores. A firm could also grow externally by a takeover, merger or amalgamation. A takeover occurs when one firm buys another firm. A merger/amalgamation occurs when two or more firms join together under common ownership. There are three types of mergers:
1) Horizontal Merger. A horizontal merger is a merger between two firms in the same industry at the same stage of production. For example, a merger between the car manufacturers Ford and Audi. 2) Vertical Merger. A vertical merger is a merger between two firms in the same industry at different stages of production. Let’s take the car industry as an example where there is the car manufacturer Ford and the tyre manufacturer Michelin, Ford buys tyres from the supplier Michelin. Backward integration occurs when a buyer buys a supplier, Ford buying Michelin. Forward integration occurs when a supplier buys a buyer, Michelin buying Ford. 3) Conglomerate Merger. A conglomerate merger occurs when two firms who have no common production interests merge. For example, a merger between Ford and Coca Cola.
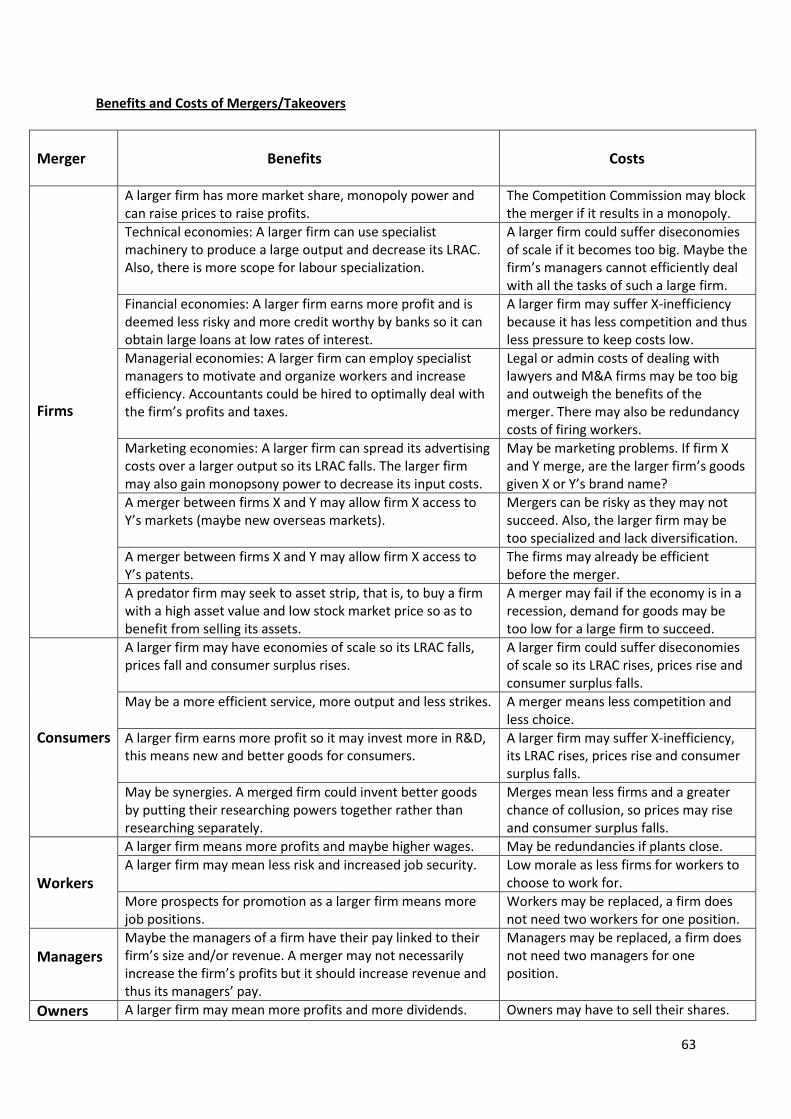
63
Benefits and Costs of Mergers/Takeovers
Merger
Benefits
Costs
Firms
A larger firm has more market share, monopoly power and can raise prices to raise profits.
The Competition Commission may block the merger if it results in a monopoly.
Technical economies: A larger firm can use specialist machinery to produce a large output and decrease its LRAC. Also, there is more scope for labour specialization.
A larger firm could suffer diseconomies of scale if it becomes too big. Maybe the firm’s managers cannot efficiently deal with all the tasks of such a large firm.
Financial economies: A larger firm earns more profit and is deemed less risky and more credit worthy by banks so it can obtain large loans at low rates of interest.
A larger firm may suffer X-inefficiency because it has less competition and thus less pressure to keep costs low.
Managerial economies: A larger firm can employ specialist managers to motivate and organize workers and increase efficiency. Accountants could be hired to optimally deal with the firm’s profits and taxes.
Legal or admin costs of dealing with lawyers and M&A firms may be too big and outweigh the benefits of the merger. There may also be redundancy costs of firing workers.
Marketing economies: A larger firm can spread its advertising costs over a larger output so its LRAC falls. The larger firm may also gain monopsony power to decrease its input costs.
May be marketing problems. If firm X and Y merge, are the larger firm’s goods given X or Y’s brand name?
A merger between firms X and Y may allow firm X access to Y’s markets (maybe new overseas markets).
Mergers can be risky as they may not succeed. Also, the larger firm may be too specialized and lack diversification.
A merger between firms X and Y may allow firm X access to Y’s patents.
The firms may already be efficient before the merger.
A predator firm may seek to asset strip, that is, to buy a firm with a high asset value and low stock market price so as to benefit from selling its assets.
A merger may fail if the economy is in a recession, demand for goods may be too low for a large firm to succeed.
Consumers
A larger firm may have economies of scale so its LRAC falls, prices fall and consumer surplus rises.
A larger firm could suffer diseconomies of scale so its LRAC rises, prices rise and consumer surplus falls.
May be a more efficient service, more output and less strikes. A merger means less competition and less choice.
A larger firm earns more profit so it may invest more in R&D, this means new and better goods for consumers.
A larger firm may suffer X-inefficiency, its LRAC rises, prices rise and consumer surplus falls.
May be synergies. A merged firm could invent better goods by putting their researching powers together rather than researching separately.
Merges mean less firms and a greater chance of collusion, so prices may rise and consumer surplus falls.
Workers
A larger firm means more profits and maybe higher wages. May be redundancies if plants close.
A larger firm may mean less risk and increased job security. Low morale as less firms for workers to choose to work for.
More prospects for promotion as a larger firm means more job positions.
Workers may be replaced, a firm does not need two workers for one position.
Managers
Maybe the managers of a firm have their pay linked to their firm’s size and/or revenue. A merger may not necessarily increase the firm’s profits but it should increase revenue and thus its managers’ pay.
Managers may be replaced, a firm does not need two managers for one position.
Owners A larger firm may mean more profits and more dividends. Owners may have to sell their shares.
64
A demerger occurs when a firm splits into two or more separate firms. Reasons for demerges:
1) Diseconomies of Scale: Maybe the firm is so large that it cannot operate efficiently and suffers diseconomies of scale. For example, a firm’s managers may be using up too much time running the large firm that they cannot work efficiently.
2) Core Activities: Maybe a firm wants to focus on a smaller range of markets. It may be more
profitable for a firm to dominate a few markets than to just exist in a lot of markets. 3) Stock Market Price: Maybe the flourishing part of the firm wants to exist separately from the
poor performing part of the firm so as to maximize the stock market price of the flourishing part.
Large Firms vs. Small Firms A large firm may exist because:
1) Economies of Scale: A large firm likely operates at the minimum efficient scale so it is minimizing average costs and can charge low prices. Small firms cannot compete because they suffer diseconomies of scale, their costs are too high to allow them to charge low prices.
2) Barriers to Entry: A large firm is likely to be protected from entry barriers such as a brand
and advertising costs. A small firm may exist because:
1) Low Economies of Scale: Maybe the level of output required to benefit from economies of scale is very small, so small firms can exist because their costs are low. Also, larger firms may suffer diseconomies of scale, making it easier for smaller firms to compete.
2) Low Entry Barriers: Maybe barriers to entry are very low. For example, no advertising costs or small sunk costs. This makes it cheaper for a small firm to enter the market and establish itself.
3) Avoid Attention: A firm may remain small to avoid attention and a takeover from potential buyers.
4) Niche Market: Maybe a small firm operates in a niche market. The small firm will not grow because the market is so small. Large firms will not enter the market because it may be too costly to enter into such a small and specialized market.
5) Personal Service: A small firm may offer a more personal service and better customer care that the consumer appreciates. For example, the owner of a local newsagent will interact with a consumer whilst the self-service machine in a large supermarket will not.
6) Informal Labour Market: A small firm may hire labour from informal labour markets, meaning it faces a lower cost than a large firm hiring labour from formal labour markets. The smaller firm would face low wage costs so it may be able to compete with bigger firms.
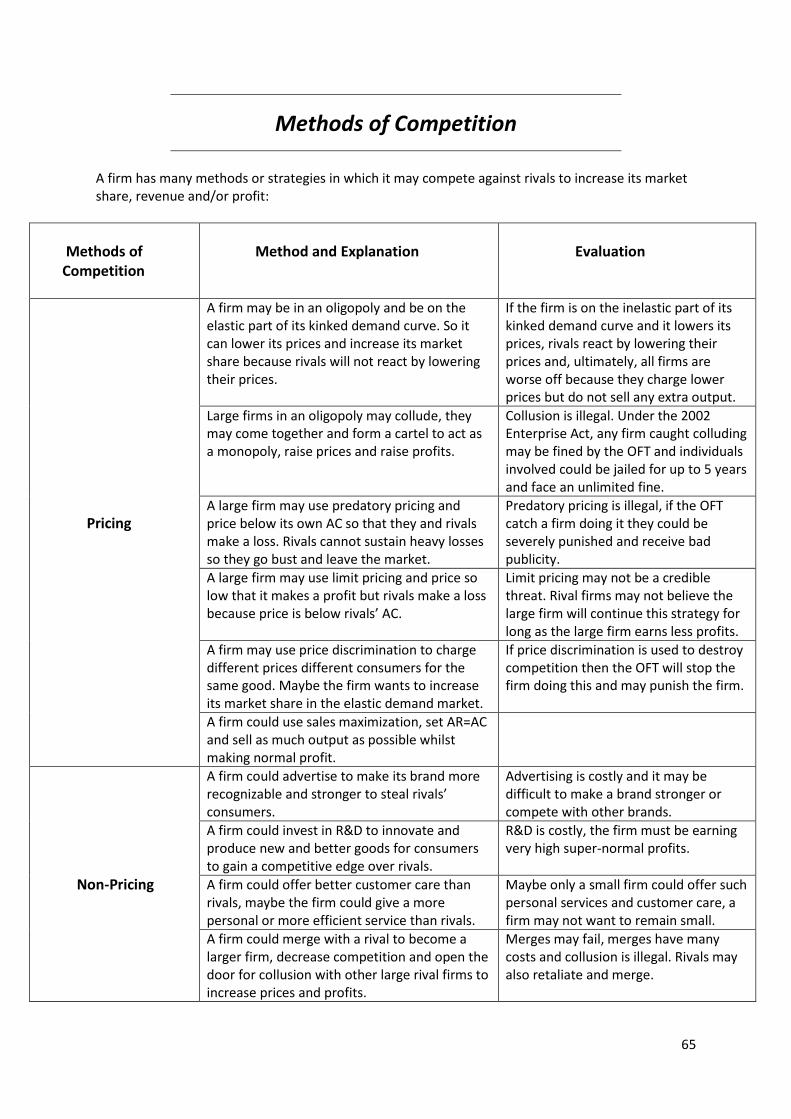
65
Methods of Competition
A firm has many methods or strategies in which it may compete against rivals to increase its market share, revenue and/or profit:
Methods of Competition
Method and Explanation
Evaluation
Pricing
A firm may be in an oligopoly and be on the elastic part of its kinked demand curve. So it can lower its prices and increase its market share because rivals will not react by lowering their prices.
If the firm is on the inelastic part of its kinked demand curve and it lowers its prices, rivals react by lowering their prices and, ultimately, all firms are worse off because they charge lower prices but do not sell any extra output.
Large firms in an oligopoly may collude, they may come together and form a cartel to act as a monopoly, raise prices and raise profits.
Collusion is illegal. Under the 2002 Enterprise Act, any firm caught colluding may be fined by the OFT and individuals involved could be jailed for up to 5 years and face an unlimited fine.
A large firm may use predatory pricing and price below its own AC so that they and rivals make a loss. Rivals cannot sustain heavy losses so they go bust and leave the market.
Predatory pricing is illegal, if the OFT catch a firm doing it they could be severely punished and receive bad publicity.
A large firm may use limit pricing and price so low that it makes a profit but rivals make a loss because price is below rivals’ AC.
Limit pricing may not be a credible threat. Rival firms may not believe the large firm will continue this strategy for long as the large firm earns less profits.
A firm may use price discrimination to charge different prices different consumers for the same good. Maybe the firm wants to increase its market share in the elastic demand market.
If price discrimination is used to destroy competition then the OFT will stop the firm doing this and may punish the firm.
A firm could use sales maximization, set AR=AC and sell as much output as possible whilst making normal profit.
Non-Pricing
A firm could advertise to make its brand more recognizable and stronger to steal rivals’ consumers.
Advertising is costly and it may be difficult to make a brand stronger or compete with other brands.
A firm could invest in R&D to innovate and produce new and better goods for consumers to gain a competitive edge over rivals.
R&D is costly, the firm must be earning very high super-normal profits.
A firm could offer better customer care than rivals, maybe the firm could give a more personal or more efficient service than rivals.
Maybe only a small firm could offer such personal services and customer care, a firm may not want to remain small.
A firm could merge with a rival to become a larger firm, decrease competition and open the door for collusion with other large rival firms to increase prices and profits.
Merges may fail, merges have many costs and collusion is illegal. Rivals may also retaliate and merge.
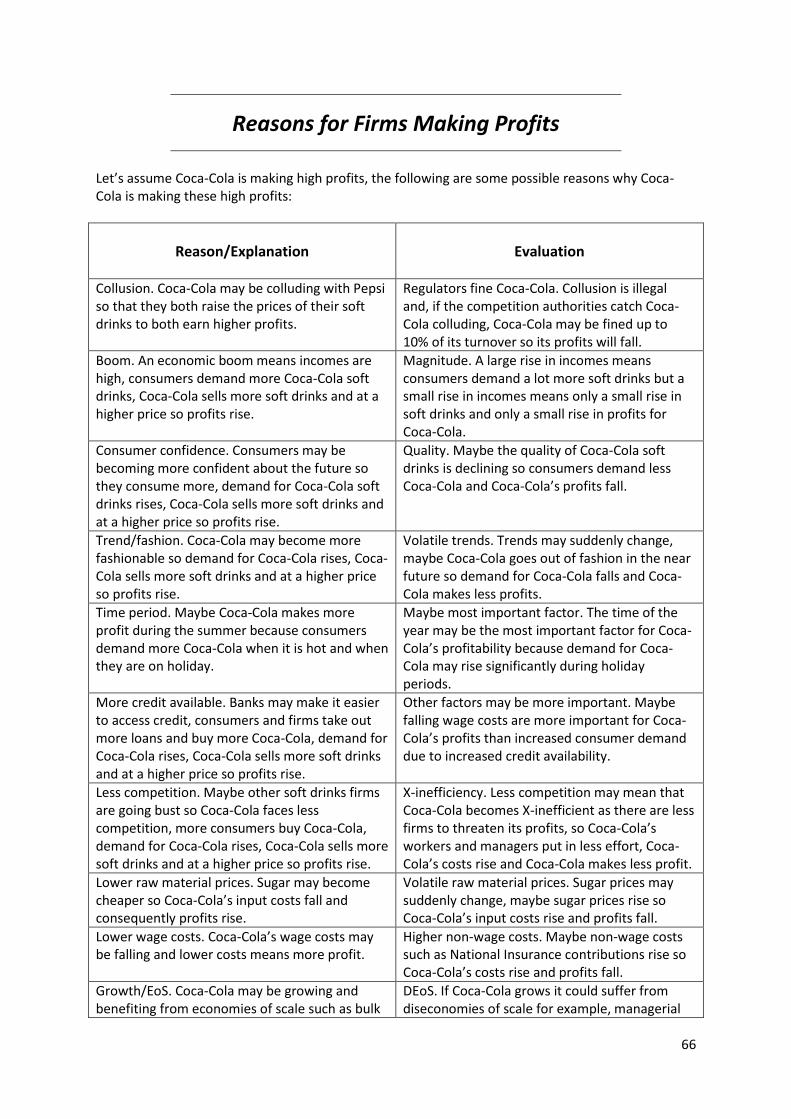
66
Reasons for Firms Making Profits
Let’s assume Coca-Cola is making high profits, the following are some possible reasons why Coca-Cola is making these high profits:
Reason/Explanation
Evaluation
Collusion. Coca-Cola may be colluding with Pepsi so that they both raise the prices of their soft drinks to both earn higher profits.
Regulators fine Coca-Cola. Collusion is illegal and, if the competition authorities catch Coca-Cola colluding, Coca-Cola may be fined up to 10% of its turnover so its profits will fall.
Boom. An economic boom means incomes are high, consumers demand more Coca-Cola soft drinks, Coca-Cola sells more soft drinks and at a higher price so profits rise.
Magnitude. A large rise in incomes means consumers demand a lot more soft drinks but a small rise in incomes means only a small rise in soft drinks and only a small rise in profits for Coca-Cola.
Consumer confidence. Consumers may be becoming more confident about the future so they consume more, demand for Coca-Cola soft drinks rises, Coca-Cola sells more soft drinks and at a higher price so profits rise.
Quality. Maybe the quality of Coca-Cola soft drinks is declining so consumers demand less Coca-Cola and Coca-Cola’s profits fall.
Trend/fashion. Coca-Cola may become more fashionable so demand for Coca-Cola rises, Coca-Cola sells more soft drinks and at a higher price so profits rise.
Volatile trends. Trends may suddenly change, maybe Coca-Cola goes out of fashion in the near future so demand for Coca-Cola falls and Coca-Cola makes less profits.
Time period. Maybe Coca-Cola makes more profit during the summer because consumers demand more Coca-Cola when it is hot and when they are on holiday.
Maybe most important factor. The time of the year may be the most important factor for Coca-Cola’s profitability because demand for Coca-Cola may rise significantly during holiday periods.
More credit available. Banks may make it easier to access credit, consumers and firms take out more loans and buy more Coca-Cola, demand for Coca-Cola rises, Coca-Cola sells more soft drinks and at a higher price so profits rise.
Other factors may be more important. Maybe falling wage costs are more important for Coca-Cola’s profits than increased consumer demand due to increased credit availability.
Less competition. Maybe other soft drinks firms are going bust so Coca-Cola faces less competition, more consumers buy Coca-Cola, demand for Coca-Cola rises, Coca-Cola sells more soft drinks and at a higher price so profits rise.
X-inefficiency. Less competition may mean that Coca-Cola becomes X-inefficient as there are less firms to threaten its profits, so Coca-Cola’s workers and managers put in less effort, Coca-Cola’s costs rise and Coca-Cola makes less profit.
Lower raw material prices. Sugar may become cheaper so Coca-Cola’s input costs fall and consequently profits rise.
Volatile raw material prices. Sugar prices may suddenly change, maybe sugar prices rise so Coca-Cola’s input costs rise and profits fall.
Lower wage costs. Coca-Cola’s wage costs may be falling and lower costs means more profit.
Higher non-wage costs. Maybe non-wage costs such as National Insurance contributions rise so Coca-Cola’s costs rise and profits fall.
Growth/EoS. Coca-Cola may be growing and benefiting from economies of scale such as bulk
DEoS. If Coca-Cola grows it could suffer from diseconomies of scale for example, managerial

67
buying so Coca-Cola’s costs fall and profits rise. diseconomies so Coca-Cola’s managers find it more difficult to run the bigger firm, Coca-Cola’s costs rise and profits fall.
Less regulation. The government may loosen regulation on Coca-Cola for example, by removing fire safety laws in Coca-Cola factories, so Coca-Cola’s costs fall and profits rise.
Accidents. Taking away fire safety laws means there may be more serious accidents at Coca-Cola factories as there may be less fire extinguishers and fire exits.
Lower VAT. A fall in VAT means Coca-Cola pays less indirect tax on its soft drinks so total costs fall and profits rise.
Time lag. Maybe VAT has not fallen yet, it may have just been announced by the government that VAT will fall, so it will take some time to effect Coca-Cola’s costs and profits.
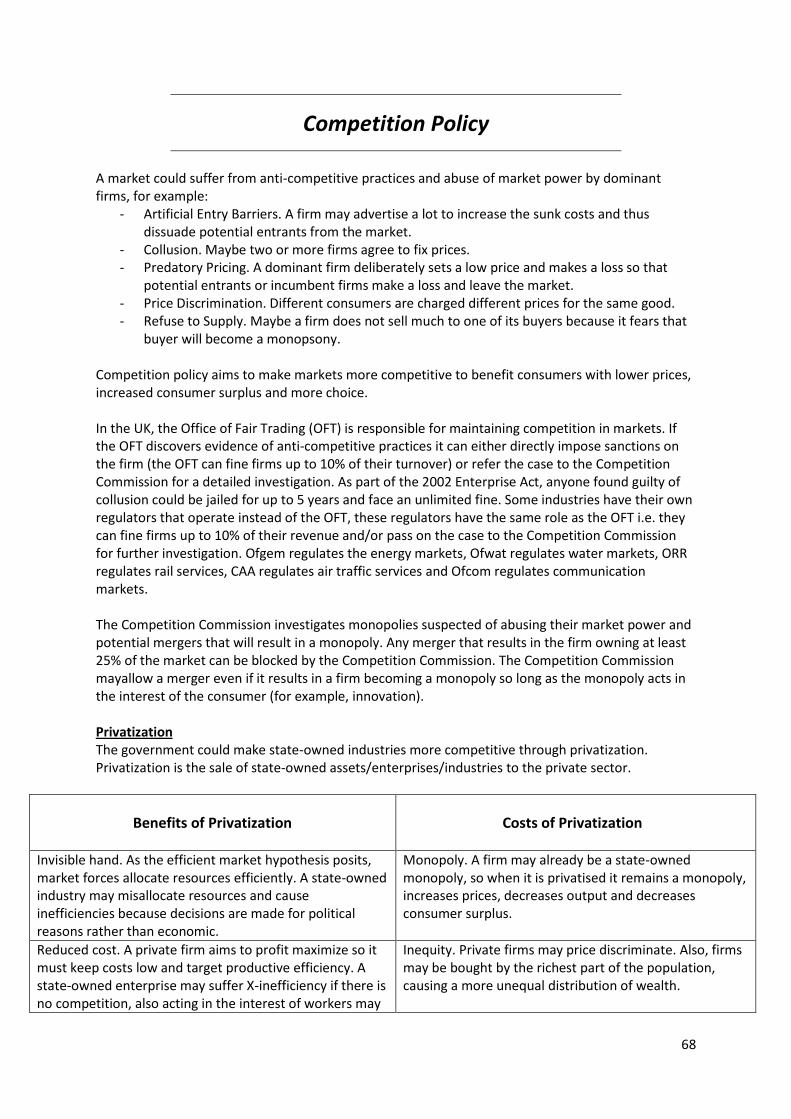
68
Competition Policy
A market could suffer from anti-competitive practices and abuse of market power by dominant firms, for example:
- Artificial Entry Barriers. A firm may advertise a lot to increase the sunk costs and thus dissuade potential entrants from the market.
- Collusion. Maybe two or more firms agree to fix prices. - Predatory Pricing. A dominant firm deliberately sets a low price and makes a loss so that
potential entrants or incumbent firms make a loss and leave the market. - Price Discrimination. Different consumers are charged different prices for the same good. - Refuse to Supply. Maybe a firm does not sell much to one of its buyers because it fears that
buyer will become a monopsony. Competition policy aims to make markets more competitive to benefit consumers with lower prices, increased consumer surplus and more choice. In the UK, the Office of Fair Trading (OFT) is responsible for maintaining competition in markets. If the OFT discovers evidence of anti-competitive practices it can either directly impose sanctions on the firm (the OFT can fine firms up to 10% of their turnover) or refer the case to the Competition Commission for a detailed investigation. As part of the 2002 Enterprise Act, anyone found guilty of collusion could be jailed for up to 5 years and face an unlimited fine. Some industries have their own regulators that operate instead of the OFT, these regulators have the same role as the OFT i.e. they can fine firms up to 10% of their revenue and/or pass on the case to the Competition Commission for further investigation. Ofgem regulates the energy markets, Ofwat regulates water markets, ORR regulates rail services, CAA regulates air traffic services and Ofcom regulates communication markets. The Competition Commission investigates monopolies suspected of abusing their market power and potential mergers that will result in a monopoly. Any merger that results in the firm owning at least 25% of the market can be blocked by the Competition Commission. The Competition Commission mayallow a merger even if it results in a firm becoming a monopoly so long as the monopoly acts in the interest of the consumer (for example, innovation). Privatization The government could make state-owned industries more competitive through privatization. Privatization is the sale of state-owned assets/enterprises/industries to the private sector.
Benefits of Privatization
Costs of Privatization
Invisible hand. As the efficient market hypothesis posits, market forces allocate resources efficiently. A state-owned industry may misallocate resources and cause inefficiencies because decisions are made for political reasons rather than economic.
Monopoly. A firm may already be a state-owned monopoly, so when it is privatised it remains a monopoly, increases prices, decreases output and decreases consumer surplus.
Reduced cost. A private firm aims to profit maximize so it must keep costs low and target productive efficiency. A state-owned enterprise may suffer X-inefficiency if there is no competition, also acting in the interest of workers may
Inequity. Private firms may price discriminate. Also, firms may be bought by the richest part of the population, causing a more unequal distribution of wealth.
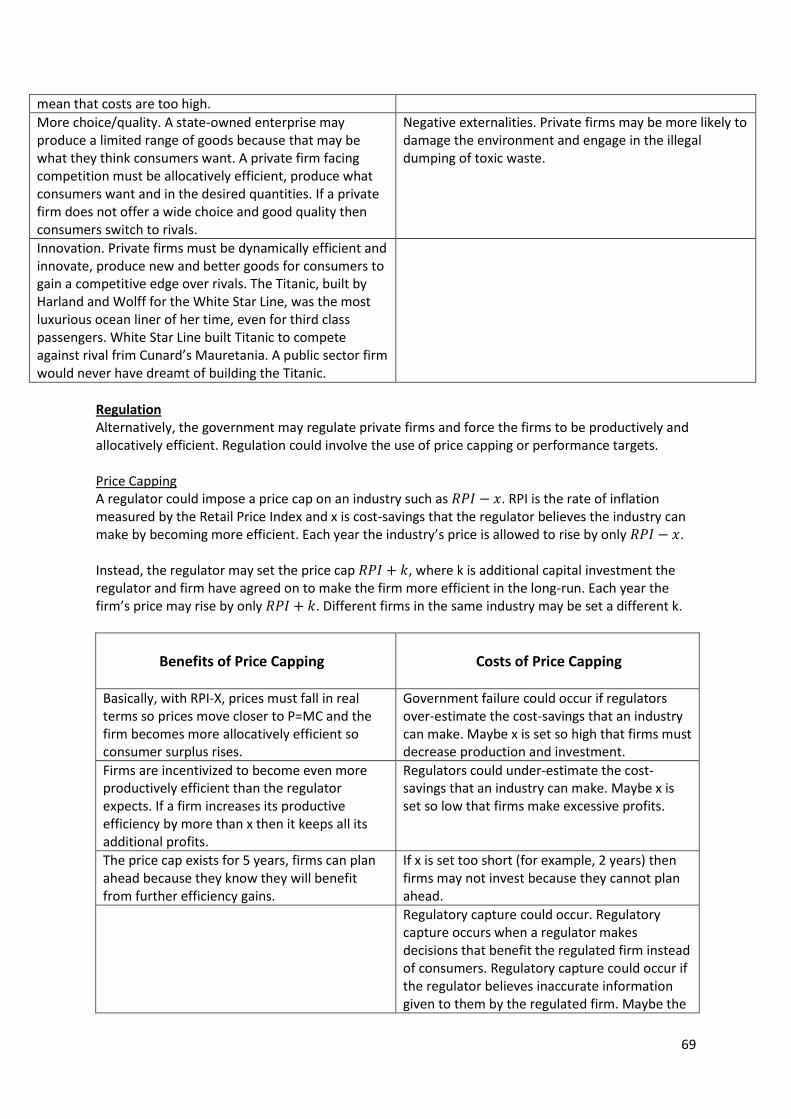
69
mean that costs are too high.
More choice/quality. A state-owned enterprise may produce a limited range of goods because that may be what they think consumers want. A private firm facing competition must be allocatively efficient, produce what consumers want and in the desired quantities. If a private firm does not offer a wide choice and good quality then consumers switch to rivals.
Negative externalities. Private firms may be more likely to damage the environment and engage in the illegal dumping of toxic waste.
Innovation. Private firms must be dynamically efficient and innovate, produce new and better goods for consumers to gain a competitive edge over rivals. The Titanic, built by Harland and Wolff for the White Star Line, was the most luxurious ocean liner of her time, even for third class passengers. White Star Line built Titanic to compete against rival frim Cunard’s Mauretania. A public sector firm would never have dreamt of building the Titanic.
Regulation Alternatively, the government may regulate private firms and force the firms to be productively and allocatively efficient. Regulation could involve the use of price capping or performance targets. Price Capping A regulator could impose a price cap on an industry such as . RPI is the rate of inflation measured by the Retail Price Index and x is cost-savings that the regulator believes the industry can make by becoming more efficient. Each year the industry’s price is allowed to rise by only . Instead, the regulator may set the price cap , where k is additional capital investment the regulator and firm have agreed on to make the firm more efficient in the long-run. Each year the firm’s price may rise by only . Different firms in the same industry may be set a different k.
Benefits of Price Capping
Costs of Price Capping
Basically, with RPI-X, prices must fall in real terms so prices move closer to P=MC and the firm becomes more allocatively efficient so consumer surplus rises.
Government failure could occur if regulators over-estimate the cost-savings that an industry can make. Maybe x is set so high that firms must decrease production and investment.
Firms are incentivized to become even more productively efficient than the regulator expects. If a firm increases its productive efficiency by more than x then it keeps all its additional profits.
Regulators could under-estimate the cost-savings that an industry can make. Maybe x is set so low that firms make excessive profits.
The price cap exists for 5 years, firms can plan ahead because they know they will benefit from further efficiency gains.
If x is set too short (for example, 2 years) then firms may not invest because they cannot plan ahead.
Regulatory capture could occur. Regulatory capture occurs when a regulator makes decisions that benefit the regulated firm instead of consumers. Regulatory capture could occur if the regulator believes inaccurate information given to them by the regulated firm. Maybe the
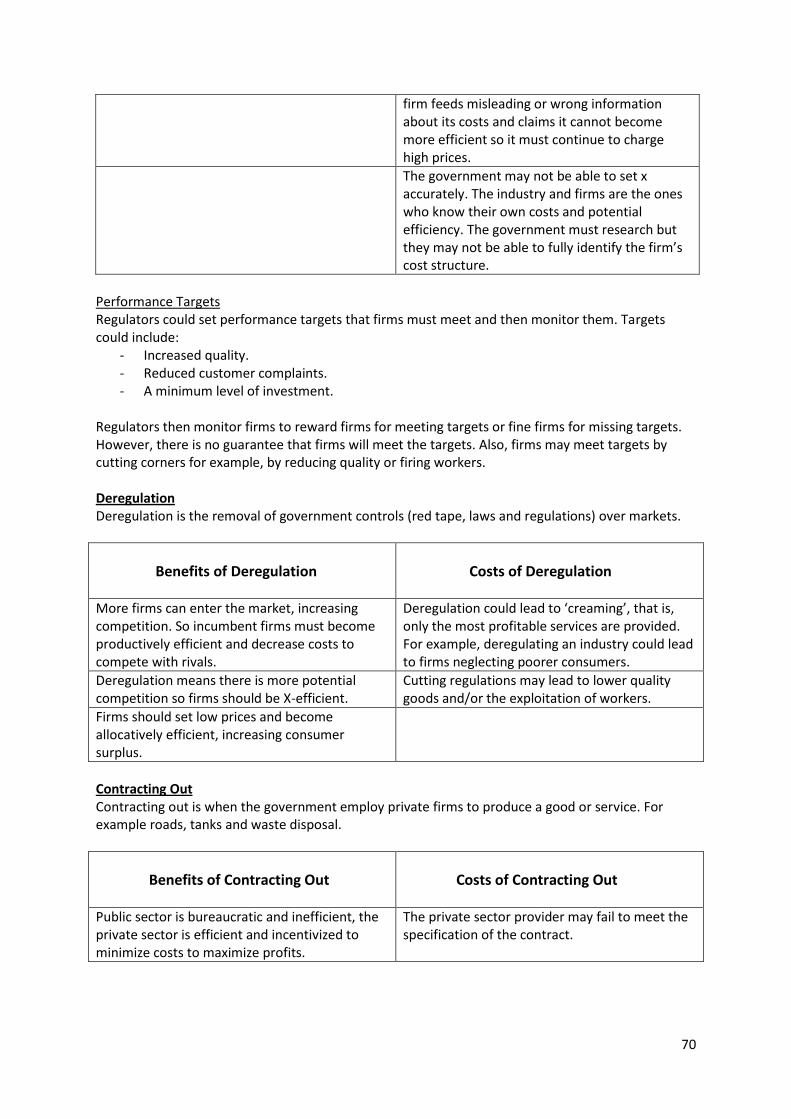
70
firm feeds misleading or wrong information about its costs and claims it cannot become more efficient so it must continue to charge high prices.
The government may not be able to set x accurately. The industry and firms are the ones who know their own costs and potential efficiency. The government must research but they may not be able to fully identify the firm’s cost structure.
Performance Targets Regulators could set performance targets that firms must meet and then monitor them. Targets could include:
- Increased quality. - Reduced customer complaints. - A minimum level of investment.
Regulators then monitor firms to reward firms for meeting targets or fine firms for missing targets. However, there is no guarantee that firms will meet the targets. Also, firms may meet targets by cutting corners for example, by reducing quality or firing workers. Deregulation Deregulation is the removal of government controls (red tape, laws and regulations) over markets.
Benefits of Deregulation
Costs of Deregulation
More firms can enter the market, increasing competition. So incumbent firms must become productively efficient and decrease costs to compete with rivals.
Deregulation could lead to ‘creaming’, that is, only the most profitable services are provided. For example, deregulating an industry could lead to firms neglecting poorer consumers.
Deregulation means there is more potential competition so firms should be X-efficient.
Cutting regulations may lead to lower quality goods and/or the exploitation of workers.
Firms should set low prices and become allocatively efficient, increasing consumer surplus.
Contracting Out Contracting out is when the government employ private firms to produce a good or service. For example roads, tanks and waste disposal.
Benefits of Contracting Out
Costs of Contracting Out
Public sector is bureaucratic and inefficient, the private sector is efficient and incentivized to minimize costs to maximize profits.
The private sector provider may fail to meet the specification of the contract.
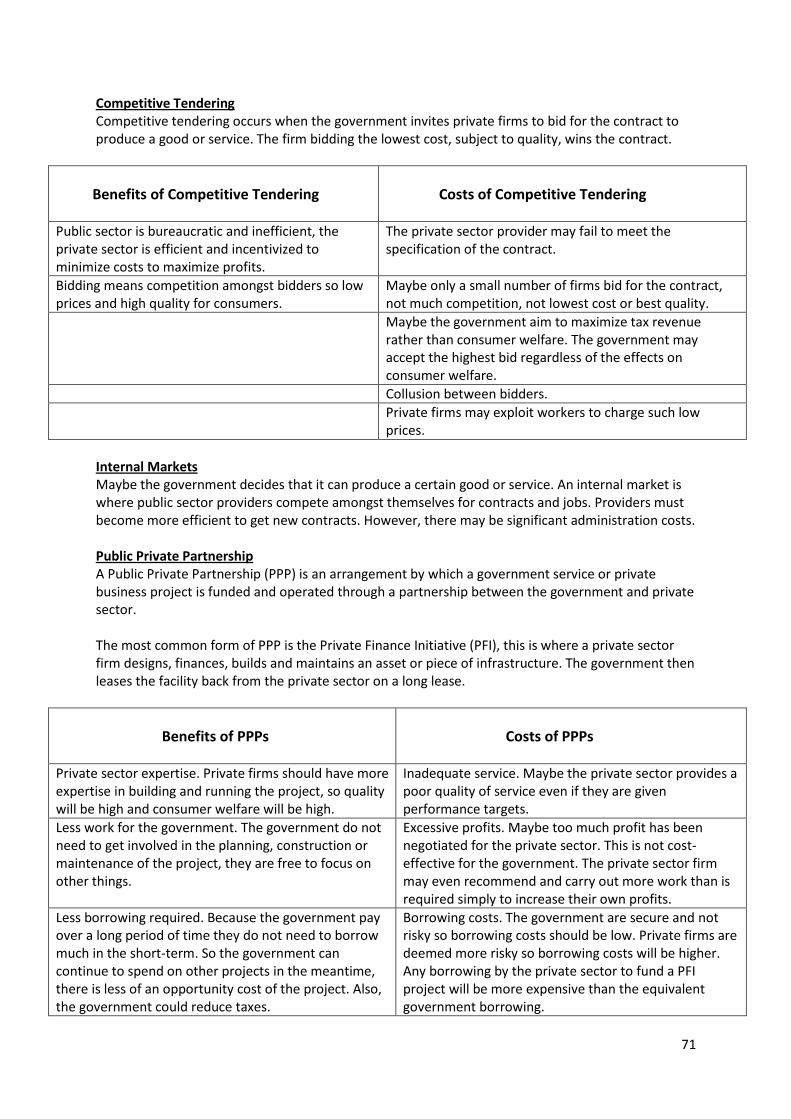
71
Competitive Tendering Competitive tendering occurs when the government invites private firms to bid for the contract to produce a good or service. The firm bidding the lowest cost, subject to quality, wins the contract.
Benefits of Competitive Tendering
Costs of Competitive Tendering
Public sector is bureaucratic and inefficient, the private sector is efficient and incentivized to minimize costs to maximize profits.
The private sector provider may fail to meet the specification of the contract.
Bidding means competition amongst bidders so low prices and high quality for consumers.
Maybe only a small number of firms bid for the contract, not much competition, not lowest cost or best quality.
Maybe the government aim to maximize tax revenue rather than consumer welfare. The government may accept the highest bid regardless of the effects on consumer welfare.
Collusion between bidders.
Private firms may exploit workers to charge such low prices.
Internal Markets Maybe the government decides that it can produce a certain good or service. An internal market is where public sector providers compete amongst themselves for contracts and jobs. Providers must become more efficient to get new contracts. However, there may be significant administration costs. Public Private Partnership A Public Private Partnership (PPP) is an arrangement by which a government service or private business project is funded and operated through a partnership between the government and private sector. The most common form of PPP is the Private Finance Initiative (PFI), this is where a private sector firm designs, finances, builds and maintains an asset or piece of infrastructure. The government then leases the facility back from the private sector on a long lease.
Benefits of PPPs
Costs of PPPs
Private sector expertise. Private firms should have more expertise in building and running the project, so quality will be high and consumer welfare will be high.
Inadequate service. Maybe the private sector provides a poor quality of service even if they are given performance targets.
Less work for the government. The government do not need to get involved in the planning, construction or maintenance of the project, they are free to focus on other things.
Excessive profits. Maybe too much profit has been negotiated for the private sector. This is not cost-effective for the government. The private sector firm may even recommend and carry out more work than is required simply to increase their own profits.
Less borrowing required. Because the government pay over a long period of time they do not need to borrow much in the short-term. So the government can continue to spend on other projects in the meantime, there is less of an opportunity cost of the project. Also, the government could reduce taxes.
Borrowing costs. The government are secure and not risky so borrowing costs should be low. Private firms are deemed more risky so borrowing costs will be higher. Any borrowing by the private sector to fund a PFI project will be more expensive than the equivalent government borrowing.
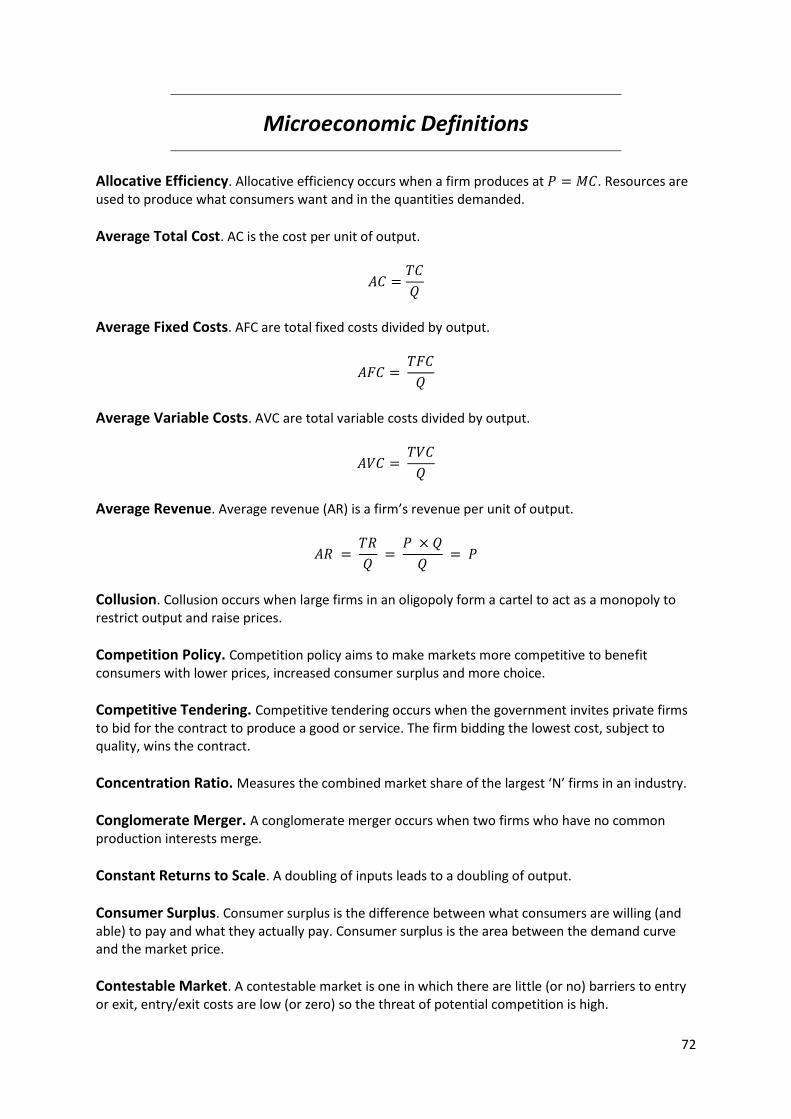
72
Microeconomic Definitions
Allocative Efficiency. Allocative efficiency occurs when a firm produces at . Resources are used to produce what consumers want and in the quantities demanded.
Average Total Cost. AC is the cost per unit of output.
Average Fixed Costs. AFC are total fixed costs divided by output.
Average Variable Costs. AVC are total variable costs divided by output.
Average Revenue. Average revenue (AR) is a firm’s revenue per unit of output.
Collusion. Collusion occurs when large firms in an oligopoly form a cartel to act as a monopoly to restrict output and raise prices.
Competition Policy. Competition policy aims to make markets more competitive to benefit consumers with lower prices, increased consumer surplus and more choice.
Competitive Tendering. Competitive tendering occurs when the government invites private firms to bid for the contract to produce a good or service. The firm bidding the lowest cost, subject to quality, wins the contract.
Concentration Ratio. Measures the combined market share of the largest ‘N’ firms in an industry.
Conglomerate Merger. A conglomerate merger occurs when two firms who have no common production interests merge.
Constant Returns to Scale. A doubling of inputs leads to a doubling of output.
Consumer Surplus. Consumer surplus is the difference between what consumers are willing (and able) to pay and what they actually pay. Consumer surplus is the area between the demand curve and the market price.
Contestable Market. A contestable market is one in which there are little (or no) barriers to entry or exit, entry/exit costs are low (or zero) so the threat of potential competition is high.
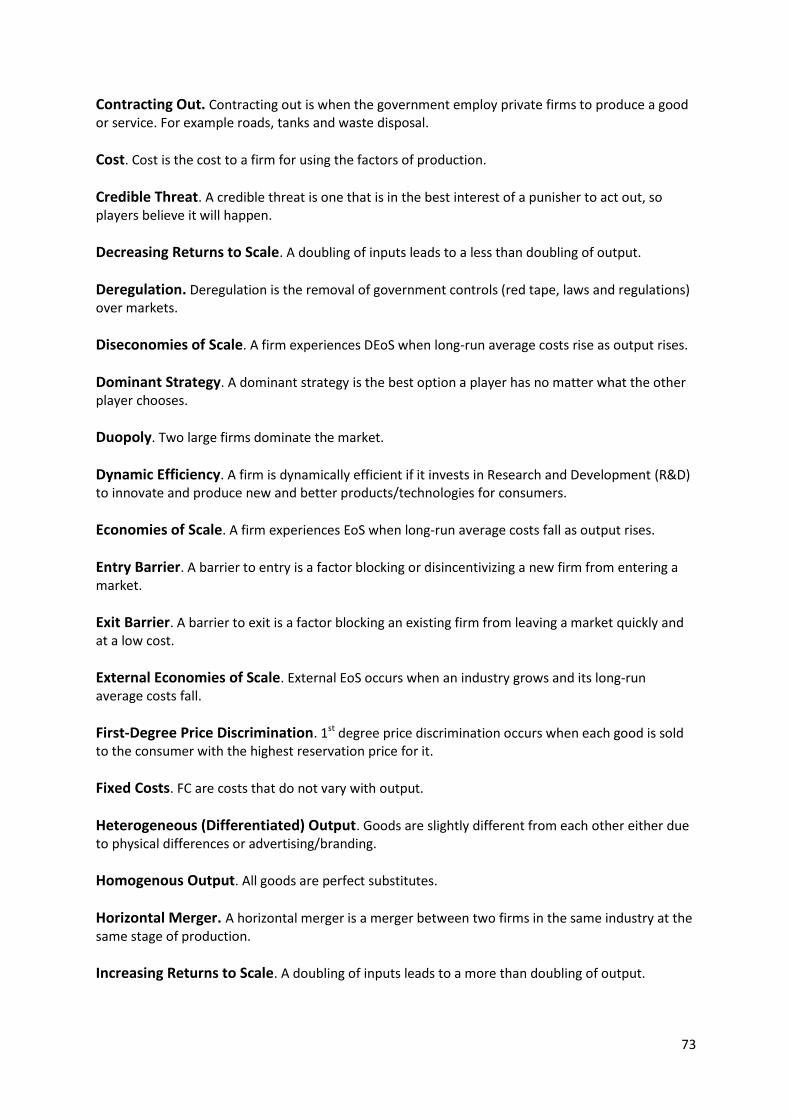
73
Contracting Out. Contracting out is when the government employ private firms to produce a good or service. For example roads, tanks and waste disposal.
Cost. Cost is the cost to a firm for using the factors of production.
Credible Threat. A credible threat is one that is in the best interest of a punisher to act out, so players believe it will happen.
Decreasing Returns to Scale. A doubling of inputs leads to a less than doubling of output.
Deregulation. Deregulation is the removal of government controls (red tape, laws and regulations) over markets.
Diseconomies of Scale. A firm experiences DEoS when long-run average costs rise as output rises.
Dominant Strategy. A dominant strategy is the best option a player has no matter what the other player chooses.
Duopoly. Two large firms dominate the market.
Dynamic Efficiency. A firm is dynamically efficient if it invests in Research and Development (R&D) to innovate and produce new and better products/technologies for consumers.
Economies of Scale. A firm experiences EoS when long-run average costs fall as output rises.
Entry Barrier. A barrier to entry is a factor blocking or disincentivizing a new firm from entering a market.
Exit Barrier. A barrier to exit is a factor blocking an existing firm from leaving a market quickly and at a low cost.
External Economies of Scale. External EoS occurs when an industry grows and its long-run average costs fall.
First-Degree Price Discrimination. 1st degree price discrimination occurs when each good is sold to the consumer with the highest reservation price for it.
Fixed Costs. FC are costs that do not vary with output.
Heterogeneous (Differentiated) Output. Goods are slightly different from each other either due to physical differences or advertising/branding.
Homogenous Output. All goods are perfect substitutes.
Horizontal Merger. A horizontal merger is a merger between two firms in the same industry at the same stage of production.
Increasing Returns to Scale. A doubling of inputs leads to a more than doubling of output.
74
Internal Market. An internal market is where public sector providers compete amongst themselves for contracts and jobs. Providers must become more efficient to get new contracts.
Limit Pricing. Limit pricing occurs when an incumbent firm sets a price so low that they earn normal profit (or low super-normal profit) to make rivals make a loss (because they are not as efficient).
Loss. A firm makes a loss if AC > AR.
Marginal Cost. MC is the change in total costs from producing an additional unit of output.
Marginal Revenue. Marginal revenue (MR) is the change in total revenue from producing an additional unit of output.
Market Failure. Market failure occurs when the price mechanism allocates resources inefficiently. There is a welfare loss. Market failure could occur due to: Monopoly, Public Goods, Externalities or Asymmetric Information.
Minimum Efficient Scale. MES is the minimum scale to fully benefit from economies of scale.
Market Share. A firm’s share of the market’s sales or revenue.
Merger. A merger/amalgamation occurs when two or more firms join together under common ownership.
Monopolistic Competition. A monopolistically competitive market has many buyers and sellers, perfect information, heterogeneous output, price-making firms, profit maximizers and low entry/exit barriers.
Monopoly. A monopoly is a single seller (or the most dominant firm with at least 25% market share), is a price-maker, a profit maximizer and has significant entry/exit barriers.
Monopoly Power. The power to restrict output to raise price.
Monopsony. A monopsony is the only buyer in a market.
Nash Equilibrium. A Nash equilibrium occurs when player A’s choice is optimal given player B’s choice and vice versa.
Natural Monopoly. A natural monopoly exists if an industry can only support one firm.
Normal Profit (Zero Profit). Normal profit is the profit that could have been made had the resources been employed in their next best use. Normal profit is the minimum level of profit required to keep a firm’s resources in their current use in the long-run.
75
Oligopoly. An oligopoly occurs when there are a few large dominant firms, large firms are interdependent and there are significant entry/exit barriers.
Overt Collusion. A formal agreement (written or verbal) amongst firms to control the market.
Pareto Efficiency. Pareto efficiency occurs when the only way to make one person better off is to make another worse off.
Perfect Competition. A perfectly competitive market has many buyers and sellers, perfect information, homogenous output, price-taking firms, profit maximizers and no entry/exit barriers.
Predatory Pricing. An incumbent firm may use predatory pricing to price below their own AC curve so that both they and rivals make a loss.
Price Capping. . RPI is the rate of inflation measured by the Retail Price Index and x is cost-savings that the regulator believes the industry can make by becoming more efficient. Each year the industry’s price is allowed to rise by only .
Price Discrimination. Price discrimination occurs when a firm charges different consumers different prices for identical goods.
Price-Maker. A firm is a price-maker if it has the power to set its price.
Price-Taker. A firm is a price-taker if it must accept the market price and cannot affect prices.
Privatization. Privatization is the sale of state-owned assets/enterprises/industries to the private sector.
Producer Surplus. Producer surplus is the difference between the price producers are willing (and able) to supply at and what they actually receive. Producer surplus is the area between the market price and the supply curve.
Productive Efficiency. Productive efficiency occurs when a firm is on the minimum point of its AC curve. An economy is productively efficient if it is producing on the edge of its PPF, that is, if output is maximized in any mix with resources fully employed.
Profit. Profit is the difference between revenue and costs.
Profit Maximization. Profit maximization occurs at .
Public Private Partnership. A Public Private Partnership is an arrangement by which a government service or private business project is funded and operated through a partnership between the government and private sector.
Revenue. Revenue is money earned by a firm for selling its output.
Revenue Maximization. Revenue maximization occurs at
Sales Maximization. Sales maximization occurs at .
76
Sunk Costs. Costs that cannot be recovered upon exiting a market.
Super-Normal Profit (Abnormal Profit). Super-normal profit is profit greater than normal profit, .
Third-Degree Price Discrimination. 3rd degree price discrimination occurs when different groups of consumers are charged different prices for the same good.
Tacit Collusion. An informal or implicit agreement amongst firms to control the market. For example, price leadership, where the price leader sets a high price and then rivals follow suit.
Total Costs. TC are TFC and TVC added together.
Total Fixed Costs. TFC equals all FC added together.
Total Variable Cost. TVC equals all VC added together.
Total Revenue. Total revenue (TR) is the total money earned by a firm for selling its output.
Variable Costs. VC are costs that vary directly with output.
Vertical Merger. A vertical merger is a merger between two firms in the same industry at different stages of production. Backward integration occurs when a buyer buys a supplier. Forward integration occurs when a supplier buys a buyer.
Welfare Loss. A loss to society due to market failure.
X-Inefficiency. A firm is X-inefficient if there is no competition so its workers become slack and its costs are not minimized.

77
Macroeconomics

78
Macroeconomics
Macroeconomics looks at the aggregate economy. Aggregate means added up, total or whole. Macroeconomics looks at all the economy’s markets added together, the whole economy, and studies aggregate level variables such as aggregate demand (AD), inflation, unemployment, Gross Domestic Product (GDP), economic growth and international trade. Macroeconomics is concerned with the performance of the entire economy over time and in comparison to other countries for example the UK vs. the US. Macroeconomics seeks to address questions such as “What are the benefits of the UK economy growing”?, “What are the effects of a rise in the average price level”?, “How does a strong dollar affect the UK”? and “Should the government spend more money to boost the economy”?
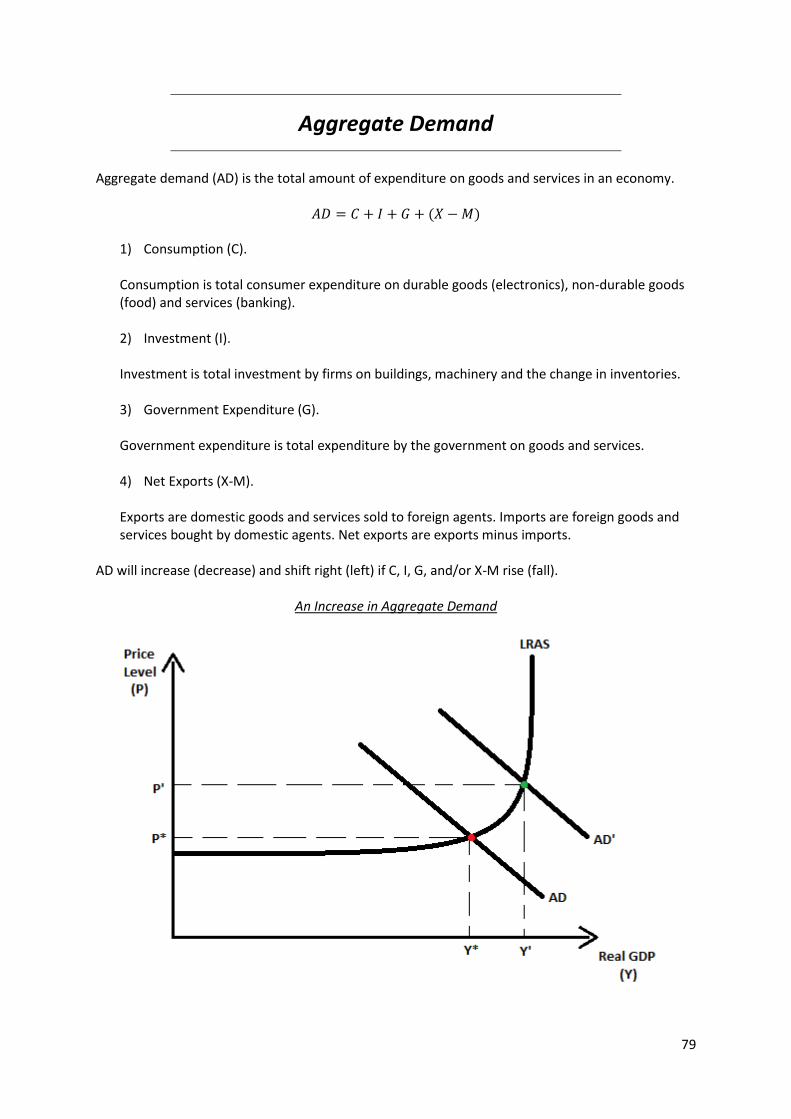
79
Aggregate Demand
Aggregate demand (AD) is the total amount of expenditure on goods and services in an economy.
1) Consumption (C). Consumption is total consumer expenditure on durable goods (electronics), non-durable goods (food) and services (banking). 2) Investment (I). Investment is total investment by firms on buildings, machinery and the change in inventories. 3) Government Expenditure (G). Government expenditure is total expenditure by the government on goods and services. 4) Net Exports (X-M). Exports are domestic goods and services sold to foreign agents. Imports are foreign goods and services bought by domestic agents. Net exports are exports minus imports.
AD will increase (decrease) and shift right (left) if C, I, G, and/or X-M rise (fall).
An Increase in Aggregate Demand
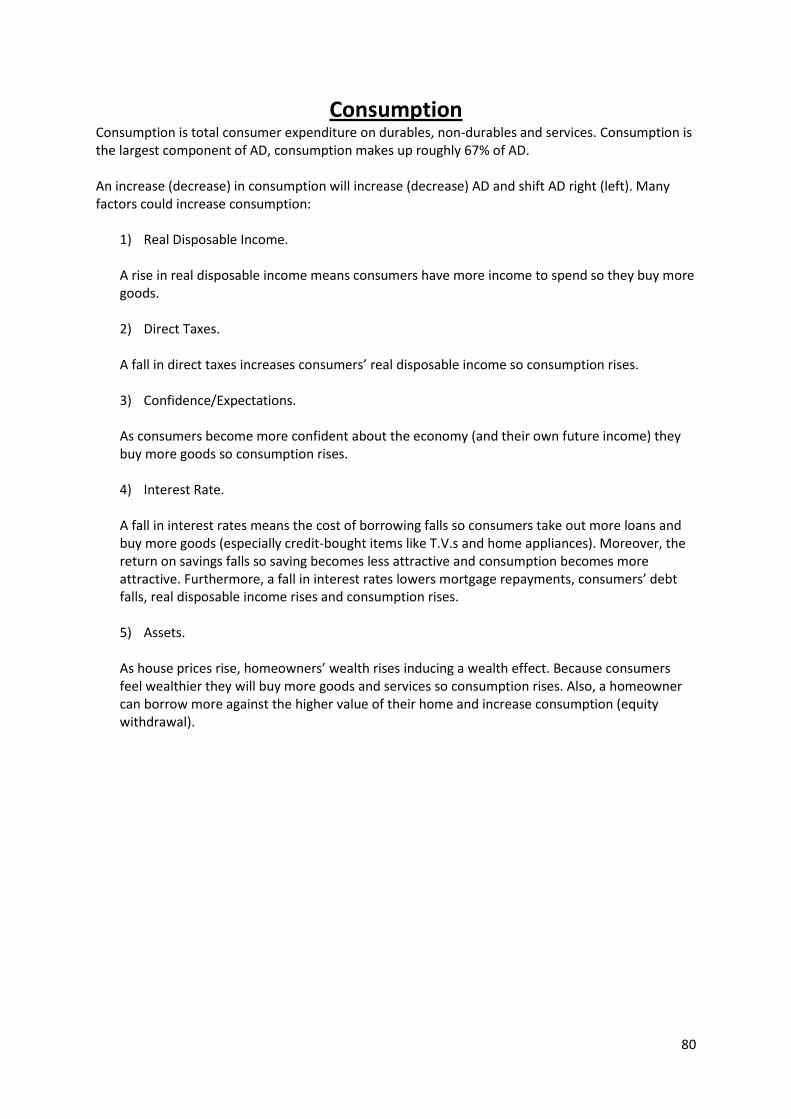
80
Consumption Consumption is total consumer expenditure on durables, non-durables and services. Consumption is the largest component of AD, consumption makes up roughly 67% of AD. An increase (decrease) in consumption will increase (decrease) AD and shift AD right (left). Many factors could increase consumption:
1) Real Disposable Income. A rise in real disposable income means consumers have more income to spend so they buy more goods. 2) Direct Taxes. A fall in direct taxes increases consumers’ real disposable income so consumption rises. 3) Confidence/Expectations. As consumers become more confident about the economy (and their own future income) they buy more goods so consumption rises. 4) Interest Rate. A fall in interest rates means the cost of borrowing falls so consumers take out more loans and buy more goods (especially credit-bought items like T.V.s and home appliances). Moreover, the return on savings falls so saving becomes less attractive and consumption becomes more attractive. Furthermore, a fall in interest rates lowers mortgage repayments, consumers’ debt falls, real disposable income rises and consumption rises. 5) Assets. As house prices rise, homeowners’ wealth rises inducing a wealth effect. Because consumers feel wealthier they will buy more goods and services so consumption rises. Also, a homeowner can borrow more against the higher value of their home and increase consumption (equity withdrawal).
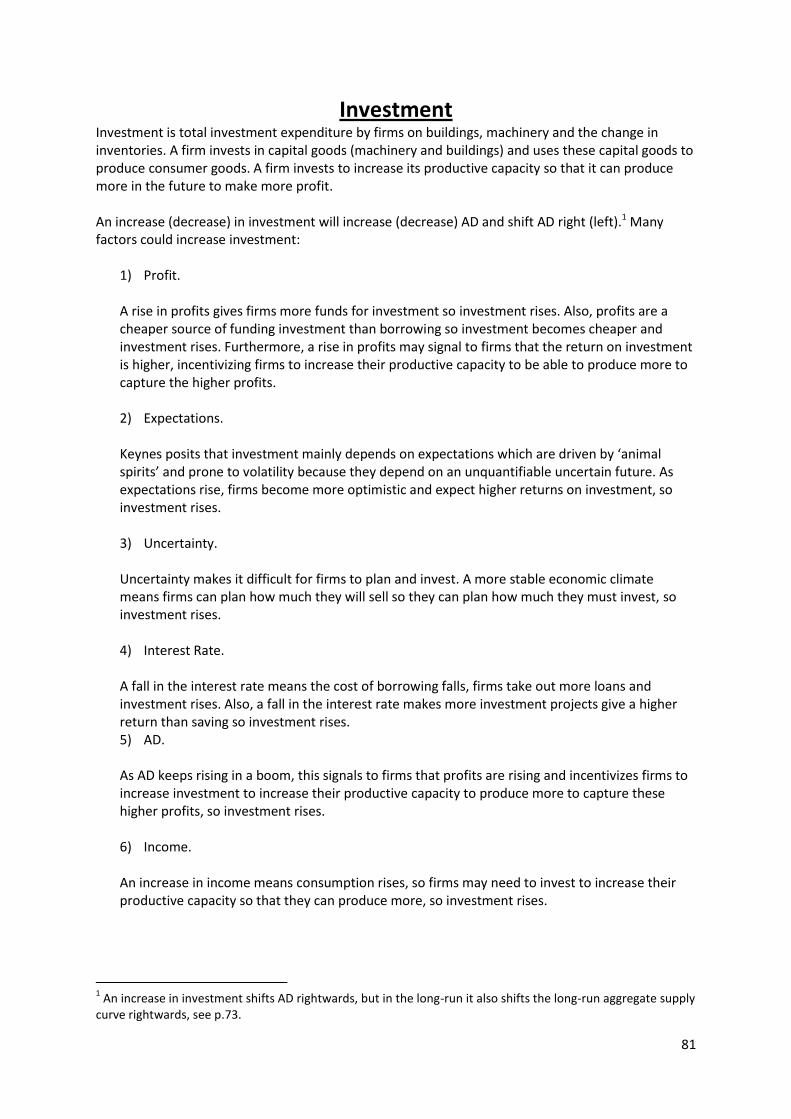
81
Investment Investment is total investment expenditure by firms on buildings, machinery and the change in inventories. A firm invests in capital goods (machinery and buildings) and uses these capital goods to produce consumer goods. A firm invests to increase its productive capacity so that it can produce more in the future to make more profit. An increase (decrease) in investment will increase (decrease) AD and shift AD right (left).1 Many factors could increase investment:
1) Profit. A rise in profits gives firms more funds for investment so investment rises. Also, profits are a cheaper source of funding investment than borrowing so investment becomes cheaper and investment rises. Furthermore, a rise in profits may signal to firms that the return on investment is higher, incentivizing firms to increase their productive capacity to be able to produce more to capture the higher profits. 2) Expectations. Keynes posits that investment mainly depends on expectations which are driven by ‘animal spirits’ and prone to volatility because they depend on an unquantifiable uncertain future. As expectations rise, firms become more optimistic and expect higher returns on investment, so investment rises. 3) Uncertainty. Uncertainty makes it difficult for firms to plan and invest. A more stable economic climate means firms can plan how much they will sell so they can plan how much they must invest, so investment rises. 4) Interest Rate. A fall in the interest rate means the cost of borrowing falls, firms take out more loans and investment rises. Also, a fall in the interest rate makes more investment projects give a higher return than saving so investment rises. 5) AD. As AD keeps rising in a boom, this signals to firms that profits are rising and incentivizes firms to increase investment to increase their productive capacity to produce more to capture these higher profits, so investment rises. 6) Income. An increase in income means consumption rises, so firms may need to invest to increase their productive capacity so that they can produce more, so investment rises.
1 An increase in investment shifts AD rightwards, but in the long-run it also shifts the long-run aggregate supply
curve rightwards, see p.73.
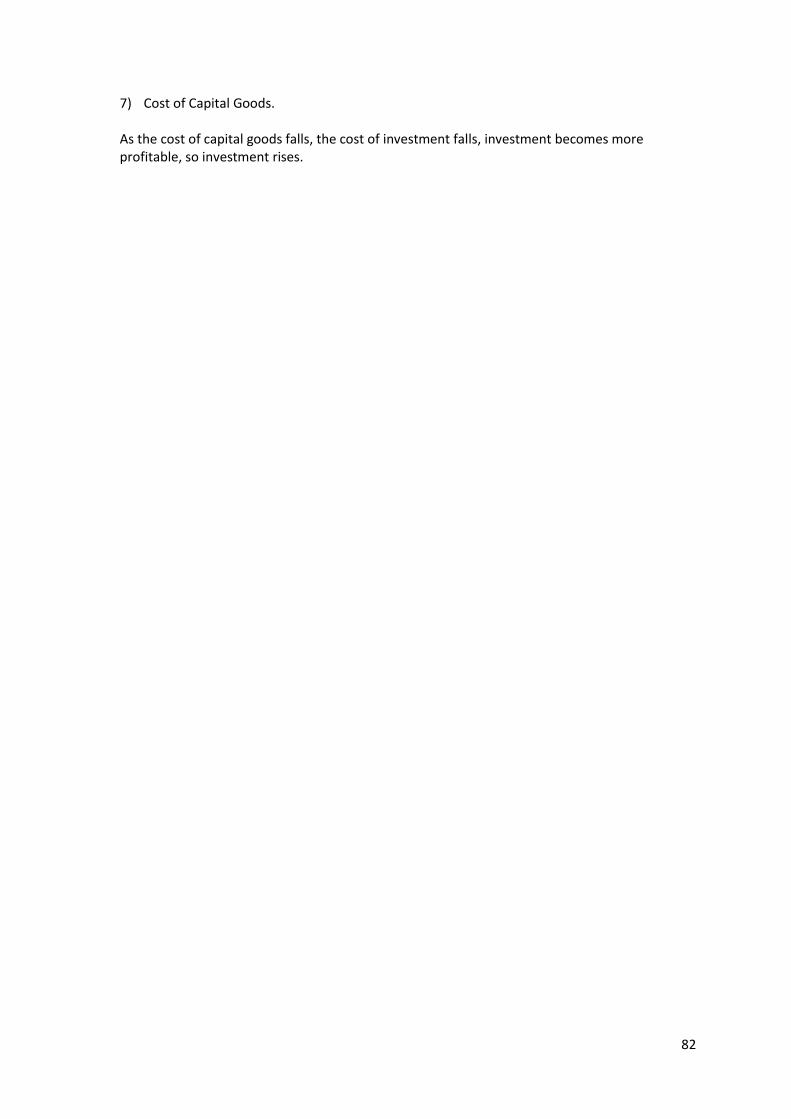
82
7) Cost of Capital Goods. As the cost of capital goods falls, the cost of investment falls, investment becomes more profitable, so investment rises.
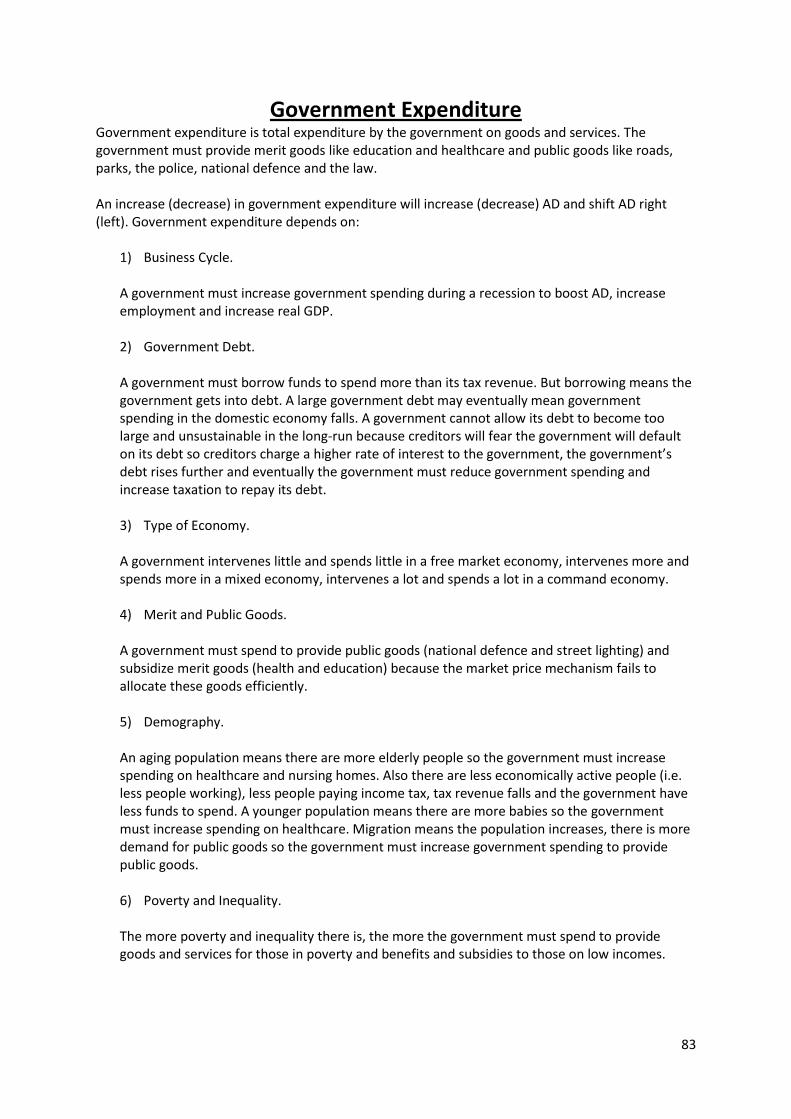
83
Government Expenditure Government expenditure is total expenditure by the government on goods and services. The government must provide merit goods like education and healthcare and public goods like roads, parks, the police, national defence and the law. An increase (decrease) in government expenditure will increase (decrease) AD and shift AD right (left). Government expenditure depends on:
1) Business Cycle. A government must increase government spending during a recession to boost AD, increase employment and increase real GDP. 2) Government Debt. A government must borrow funds to spend more than its tax revenue. But borrowing means the government gets into debt. A large government debt may eventually mean government spending in the domestic economy falls. A government cannot allow its debt to become too large and unsustainable in the long-run because creditors will fear the government will default on its debt so creditors charge a higher rate of interest to the government, the government’s debt rises further and eventually the government must reduce government spending and increase taxation to repay its debt. 3) Type of Economy. A government intervenes little and spends little in a free market economy, intervenes more and spends more in a mixed economy, intervenes a lot and spends a lot in a command economy. 4) Merit and Public Goods. A government must spend to provide public goods (national defence and street lighting) and subsidize merit goods (health and education) because the market price mechanism fails to allocate these goods efficiently. 5) Demography. An aging population means there are more elderly people so the government must increase spending on healthcare and nursing homes. Also there are less economically active people (i.e. less people working), less people paying income tax, tax revenue falls and the government have less funds to spend. A younger population means there are more babies so the government must increase spending on healthcare. Migration means the population increases, there is more demand for public goods so the government must increase government spending to provide public goods. 6) Poverty and Inequality. The more poverty and inequality there is, the more the government must spend to provide goods and services for those in poverty and benefits and subsidies to those on low incomes.
84
7) Elections. The government may increase government expenditure on merit and public goods building up to election times.
85
Net Exports Exports are domestic goods and services sold to foreign agents. Imports are foreign goods and services bought by domestic agents. Net exports are exports minus imports (X-M). An increase (decrease) in net exports will increase (decrease) AD and shift AD right (left). Many factors could increase net exports:
1) Exchange Rate. A fall in the domestic country’s exchange rate means the domestic economy becomes more internationally price competitive, exports become cheaper and rise, imports become dearer and fall so AD rises. 2) Rest of the World. Booms can spread from one country to another. A boom in country X means X’s income rises and their consumers demand more imports. Country Y exports to country X so Y’s exports rise and AD rises. 3) Quality. If the quality of the domestic economy’s goods rises, foreign consumers will demand the domestic economy’s goods, exports rise and AD rises. 4) Inflation. A fall in country X’s inflation makes X’s goods more internationally price competitive, exports are cheaper and rise, imports are dearer and fall so AD rises. 5) Income. A fall in the domestic country’s income means consumers buy less luxury goods so imports fall and AD rises.
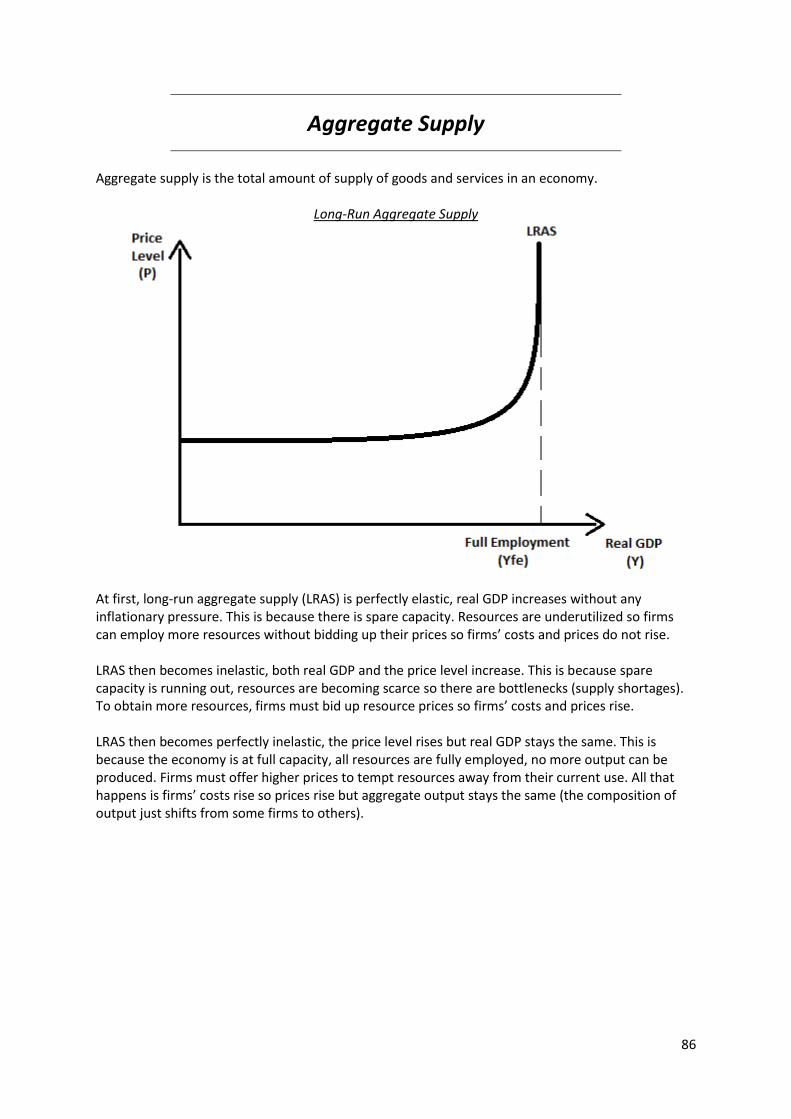
86
Aggregate Supply
Aggregate supply is the total amount of supply of goods and services in an economy.
Long-Run Aggregate Supply
At first, long-run aggregate supply (LRAS) is perfectly elastic, real GDP increases without any inflationary pressure. This is because there is spare capacity. Resources are underutilized so firms can employ more resources without bidding up their prices so firms’ costs and prices do not rise. LRAS then becomes inelastic, both real GDP and the price level increase. This is because spare capacity is running out, resources are becoming scarce so there are bottlenecks (supply shortages). To obtain more resources, firms must bid up resource prices so firms’ costs and prices rise. LRAS then becomes perfectly inelastic, the price level rises but real GDP stays the same. This is because the economy is at full capacity, all resources are fully employed, no more output can be produced. Firms must offer higher prices to tempt resources away from their current use. All that happens is firms’ costs rise so prices rise but aggregate output stays the same (the composition of output just shifts from some firms to others).
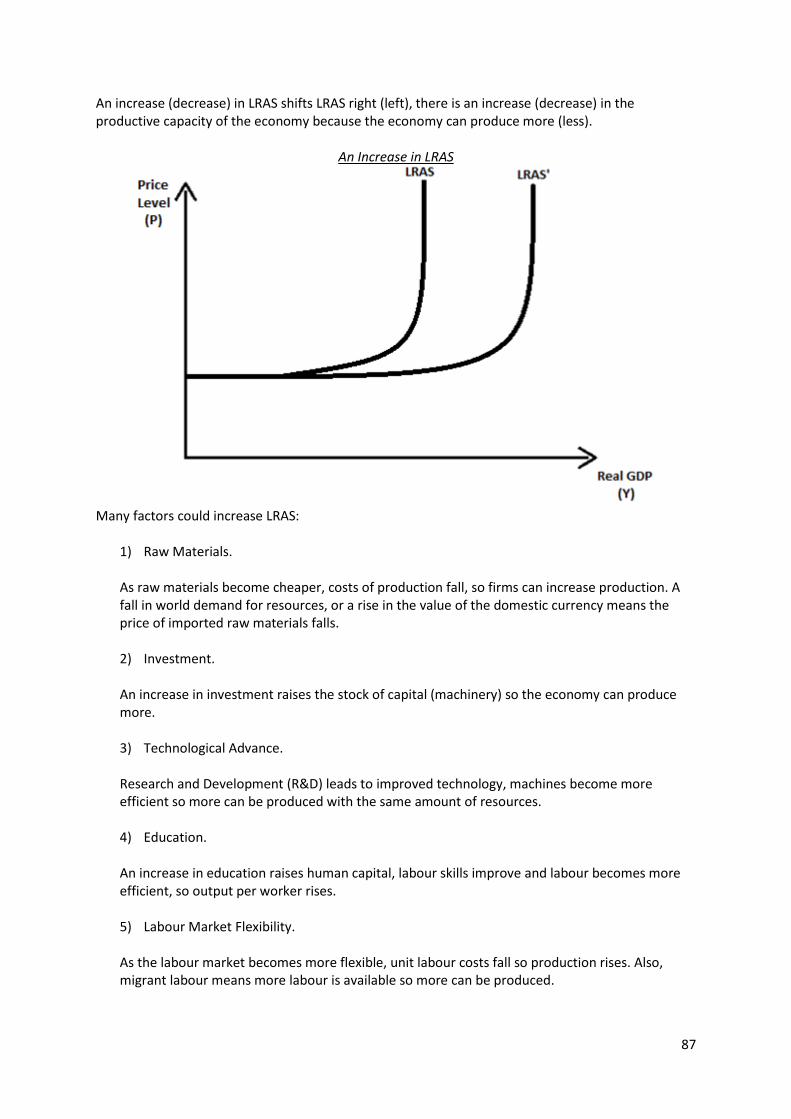
87
An increase (decrease) in LRAS shifts LRAS right (left), there is an increase (decrease) in the productive capacity of the economy because the economy can produce more (less).
An Increase in LRAS
Many factors could increase LRAS:
1) Raw Materials. As raw materials become cheaper, costs of production fall, so firms can increase production. A fall in world demand for resources, or a rise in the value of the domestic currency means the price of imported raw materials falls. 2) Investment. An increase in investment raises the stock of capital (machinery) so the economy can produce more. 3) Technological Advance. Research and Development (R&D) leads to improved technology, machines become more efficient so more can be produced with the same amount of resources. 4) Education. An increase in education raises human capital, labour skills improve and labour becomes more efficient, so output per worker rises. 5) Labour Market Flexibility. As the labour market becomes more flexible, unit labour costs fall so production rises. Also, migrant labour means more labour is available so more can be produced.
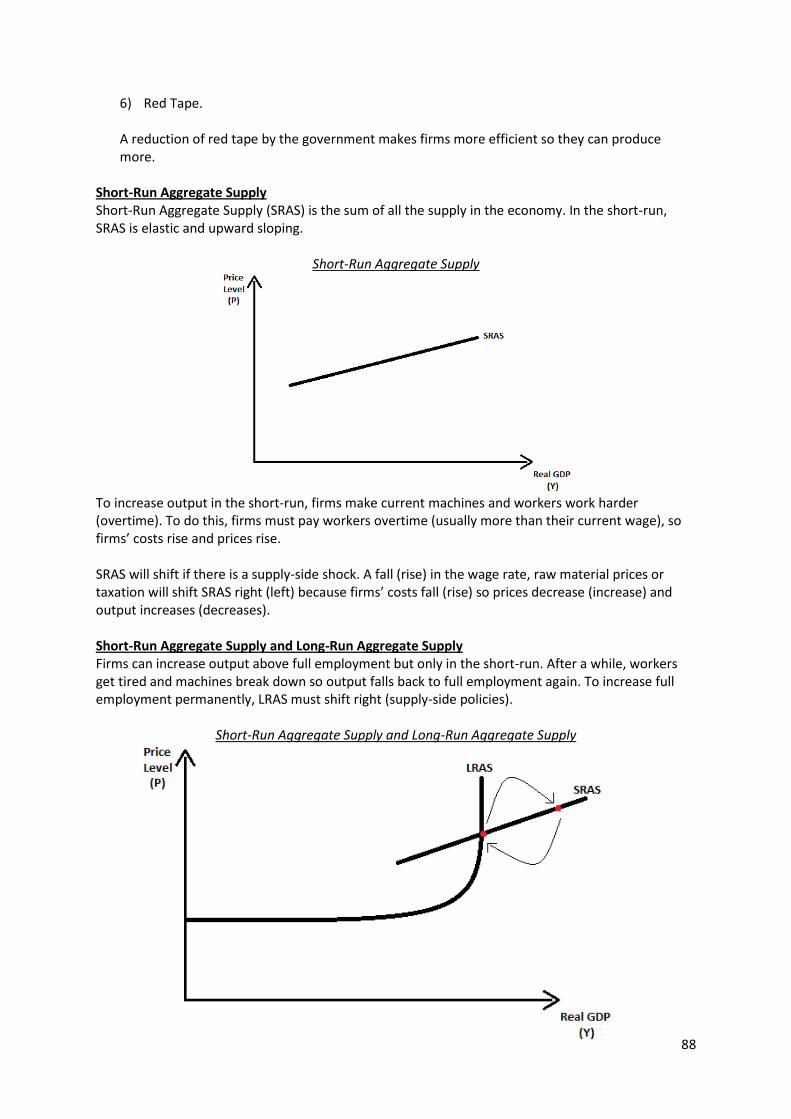
88
6) Red Tape. A reduction of red tape by the government makes firms more efficient so they can produce more.
Short-Run Aggregate Supply Short-Run Aggregate Supply (SRAS) is the sum of all the supply in the economy. In the short-run, SRAS is elastic and upward sloping.
Short-Run Aggregate Supply
To increase output in the short-run, firms make current machines and workers work harder (overtime). To do this, firms must pay workers overtime (usually more than their current wage), so firms’ costs rise and prices rise. SRAS will shift if there is a supply-side shock. A fall (rise) in the wage rate, raw material prices or taxation will shift SRAS right (left) because firms’ costs fall (rise) so prices decrease (increase) and output increases (decreases). Short-Run Aggregate Supply and Long-Run Aggregate Supply Firms can increase output above full employment but only in the short-run. After a while, workers get tired and machines break down so output falls back to full employment again. To increase full employment permanently, LRAS must shift right (supply-side policies).
Short-Run Aggregate Supply and Long-Run Aggregate Supply
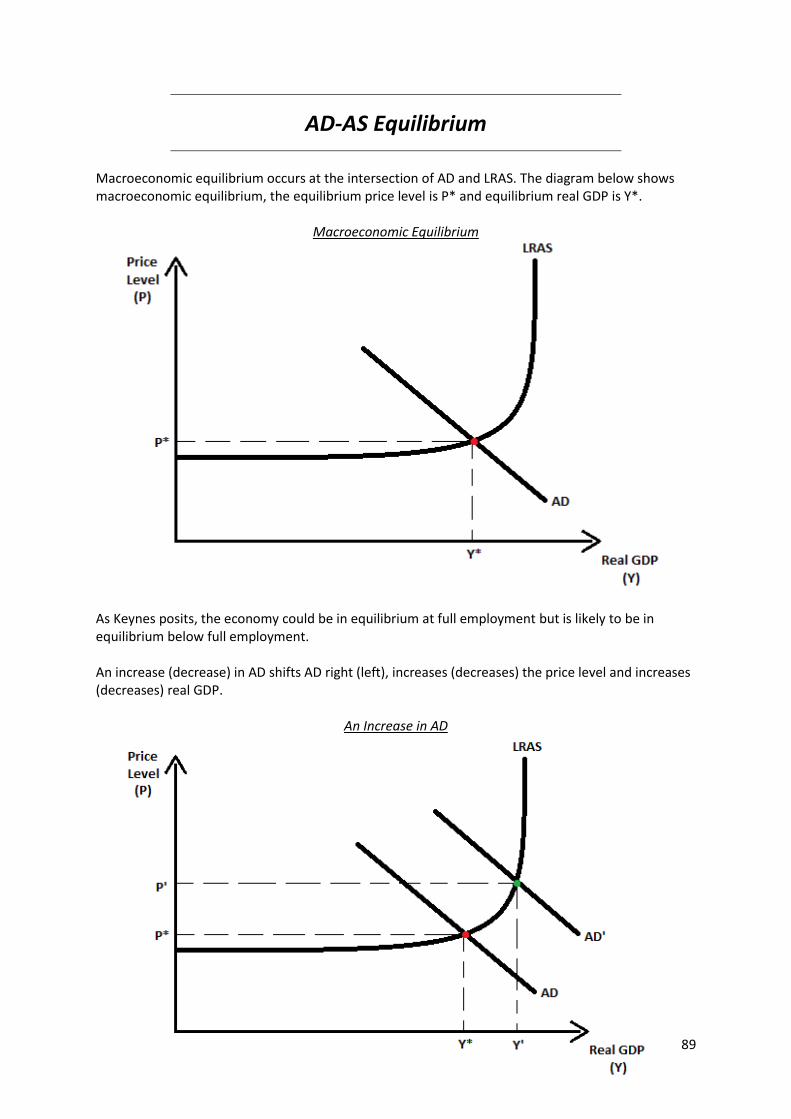
89
AD-AS Equilibrium
Macroeconomic equilibrium occurs at the intersection of AD and LRAS. The diagram below shows macroeconomic equilibrium, the equilibrium price level is P* and equilibrium real GDP is Y*.
Macroeconomic Equilibrium
As Keynes posits, the economy could be in equilibrium at full employment but is likely to be in equilibrium below full employment. An increase (decrease) in AD shifts AD right (left), increases (decreases) the price level and increases (decreases) real GDP.
An Increase in AD
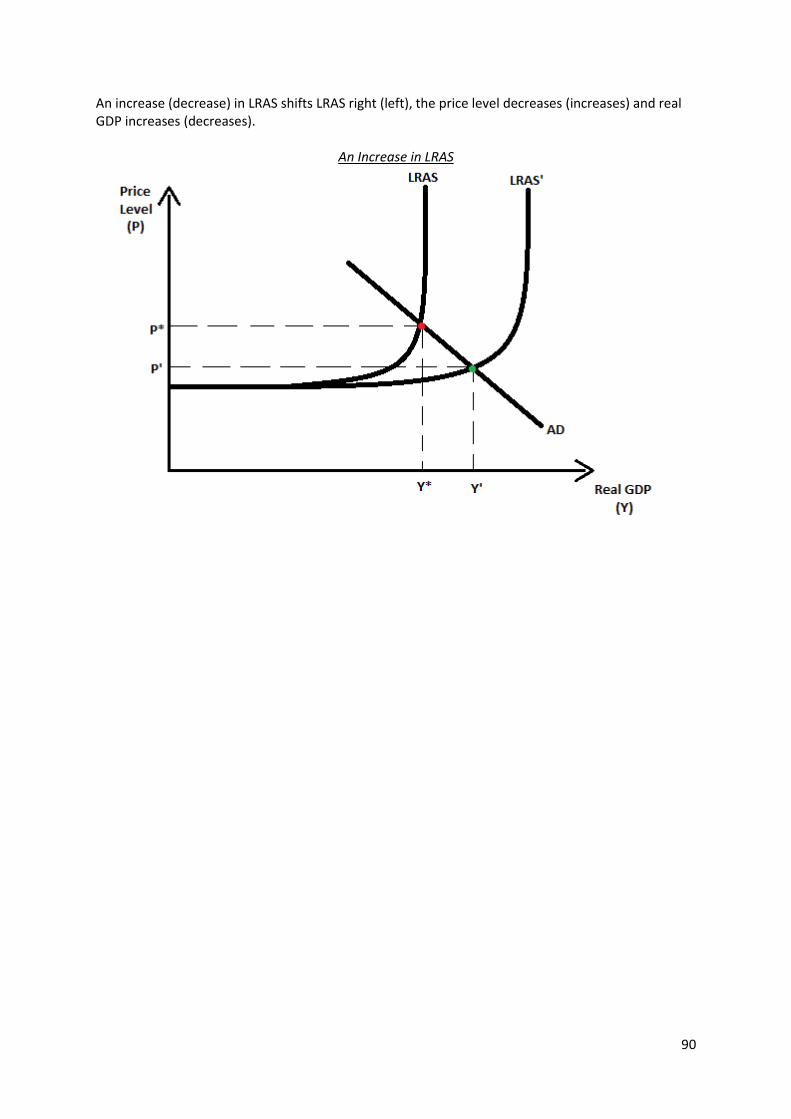
90
An increase (decrease) in LRAS shifts LRAS right (left), the price level decreases (increases) and real GDP increases (decreases).
An Increase in LRAS
91
Balance of Payments
The balance of payments (BoP) is a record of all external financial transactions between one economy and the rest of the world. The two main components of the BoP are the current account and financial account. The BoP must sum up to zero. Current Account The current account includes:
- Trade in goods/visibles (raw materials, manufacture goods, cars etc.). - Trade in services/invisibles (banking, insurance, transport etc.). - Investment income (profits, dividends and interest on assets abroad).
Money from the use of capital abroad. - Transfers including aid, remittances (money sent to relatives abroad) and
EU contributions. Financial Account The financial account includes:
- Multinational companies or foreign direct investment (foreign owned factories and plants).
- Portfolio investment (shares and bonds). Reasons for Foreign Capital Flows Foreign capital flows affect the financial account. Reasons for foreign capital flows include:
1) Multinational Companies. Multinational companies (MNCs) looking to enter a new foreign market will need to invest in that country to set up a factory to produce, this causes an inflow of foreign direct investment (FDI) into that country. 2) Foreign Trade. Consumers may take out loans from foreign banks to buy foreign goods. 3) Private Transfers. Agents may transfer funds abroad to avoid or evade domestic taxes and fund holiday homes. 4) Bank Loans. Banks in one country may lend money to, or take the savings of, agents in another country. 5) Speculation. Speculators may buy/sell foreign debt and shares to make a quick profit. 6) Government Bonds. A government may sell bonds to foreign agents to raise funds for government spending.
92
Current Account Surplus and Deficit A current account surplus means the exports of goods and services is greater than the imports of goods and services and money flows into the domestic economy. This is matched by a financial account deficit. A financial account deficit means domestic residents invest more overseas than foreign residents invest in the domestic economy. A current account deficit means the imports of goods and services is greater than the exports of goods and services and money flows out of the domestic economy. This is funded by a financial account surplus. A financial account surplus means foreign residents invest more in the domestic economy than domestic residents invest overseas. Causes of A Current Account Deficit Many factors could cause a current account deficit:
1) Exchange Rate Appreciation. An appreciation/rise in the domestic country’s exchange rate means the domestic economy becomes less internationally price competitive, exports become dearer and fall, imports become cheaper and rise so the current account moves towards a deficit. 2) Global Recession. A global recession means foreign consumers have a lower income so they buy less UK exports, UK exports fall and the current account moves towards a deficit. 3) Poor Quality Goods. If the quality of the domestic economy’s goods falls, foreign consumers will demand less of the domestic economy’s goods so exports fall, domestic consumers buy more foreign goods so imports rise and the current account moves towards a deficit. 4) Inflation. A rise in country A’s inflation makes A’s goods less internationally price competitive, exports are dearer and fall, imports are cheaper and rise so the current account moves towards a deficit. 5) Domestic Income. A rise in the domestic country’s income means consumers buy more domestic and foreign goods so imports rise, domestic firms sell more to domestic consumers so exports fall, and the current account moves towards a deficit.
Significance of A Current Account Deficit A current account deficit may or may not be a problem, it depends on the size of the deficit and what caused the deficit. If the current account deficit is small and sustainable then it is not a problem, the domestic economy can easily fund it. A large sustainable current account deficit is not a problem because the domestic economy can fund it. Moreover, a current account deficit may not be a problem if the domestic economy imports a lot of capital goods. Machinery may be imported so the domestic economy’s productive capacity rises, LRAS shifts right and in the future the domestic economy can produce
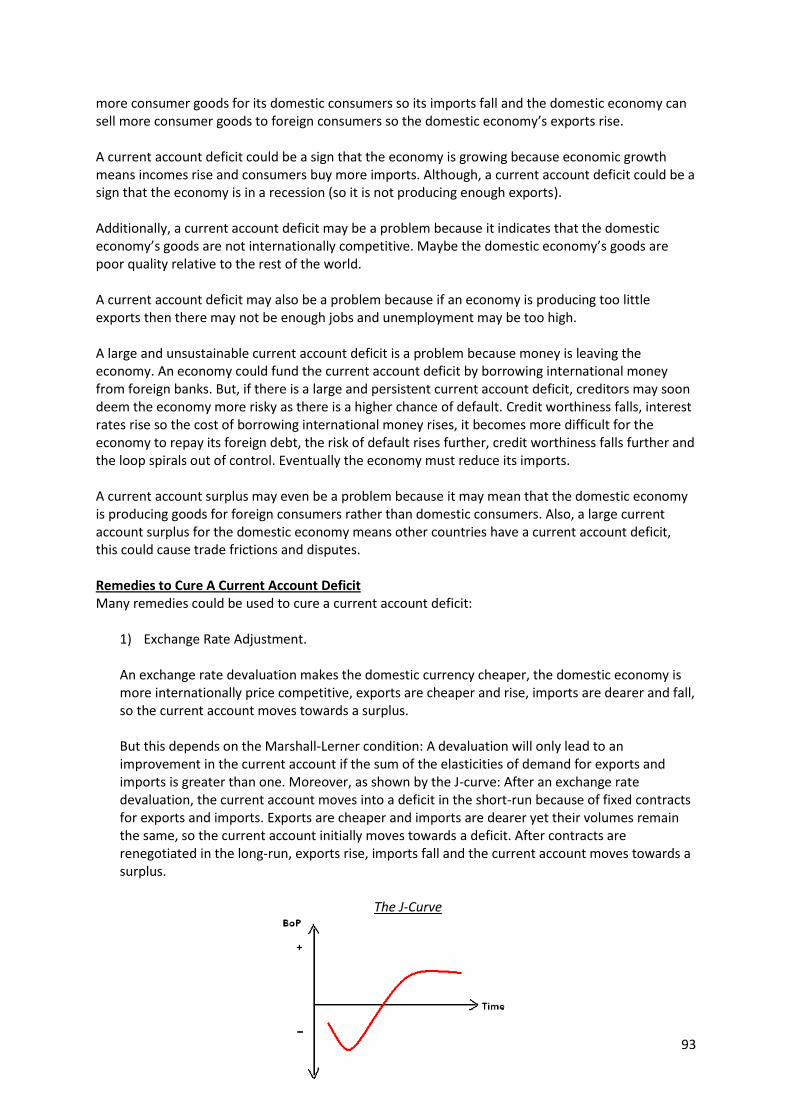
93
more consumer goods for its domestic consumers so its imports fall and the domestic economy can sell more consumer goods to foreign consumers so the domestic economy’s exports rise. A current account deficit could be a sign that the economy is growing because economic growth means incomes rise and consumers buy more imports. Although, a current account deficit could be a sign that the economy is in a recession (so it is not producing enough exports). Additionally, a current account deficit may be a problem because it indicates that the domestic economy’s goods are not internationally competitive. Maybe the domestic economy’s goods are poor quality relative to the rest of the world. A current account deficit may also be a problem because if an economy is producing too little exports then there may not be enough jobs and unemployment may be too high. A large and unsustainable current account deficit is a problem because money is leaving the economy. An economy could fund the current account deficit by borrowing international money from foreign banks. But, if there is a large and persistent current account deficit, creditors may soon deem the economy more risky as there is a higher chance of default. Credit worthiness falls, interest rates rise so the cost of borrowing international money rises, it becomes more difficult for the economy to repay its foreign debt, the risk of default rises further, credit worthiness falls further and the loop spirals out of control. Eventually the economy must reduce its imports. A current account surplus may even be a problem because it may mean that the domestic economy is producing goods for foreign consumers rather than domestic consumers. Also, a large current account surplus for the domestic economy means other countries have a current account deficit, this could cause trade frictions and disputes. Remedies to Cure A Current Account Deficit Many remedies could be used to cure a current account deficit:
1) Exchange Rate Adjustment. An exchange rate devaluation makes the domestic currency cheaper, the domestic economy is more internationally price competitive, exports are cheaper and rise, imports are dearer and fall, so the current account moves towards a surplus. But this depends on the Marshall-Lerner condition: A devaluation will only lead to an improvement in the current account if the sum of the elasticities of demand for exports and imports is greater than one. Moreover, as shown by the J-curve: After an exchange rate devaluation, the current account moves into a deficit in the short-run because of fixed contracts for exports and imports. Exports are cheaper and imports are dearer yet their volumes remain the same, so the current account initially moves towards a deficit. After contracts are renegotiated in the long-run, exports rise, imports fall and the current account moves towards a surplus.
The J-Curve
94
2) AD Management. A fall in AD means income falls, at a lower income the marginal propensity to import is lower, so imports fall and the current account moves towards a surplus. The initial decrease in AD could be caused by a rise in interest rates or a rise in taxation. But in the short-run, a higher domestic interest rate attracts foreign savings, so the value of the domestic currency rises, exports become dearer and fall, imports become cheaper and rise, so the current account moves towards a deficit. The domestic economy could raise taxes to decrease AD instead, but taxes take time to come into effect. 3) Supply-Side Policies. Supply-side polices could be used to increase LRAS and increase the productive capacity of the domestic economy so that it is able to meet its own consumption needs. But this costs money and a large investment so in the short-run AD will rise, inflation will rise, the domestic economy loses international price competitiveness, exports become dearer and fall, imports become cheaper and rise, so the current account moves towards a deficit. Moreover, supply-side policies only come into effect in the long-run.
95
Monetary Policy
Monetary policy is the manipulation of monetary variables (interest rate and money supply) by the MPC to influence AD and inflation. An economy’s central bank controls the interest rate and money supply. In the UK the central bank is the Bank of England (BoE). However, it is not the BoE who decide on interest rate changes, instead this is decided by the Monetary Policy Committee (MPC). The MPC is a group of 9 economists, 5 are from the BoE and 4 are independent experts and they are responsible for controlling inflation in the UK. The MPC use the CPI measure of inflation and target inflation of 2% plus or minus 1%. The MPC use the interest rate and money supply to influence AD and control inflation. The MPC are independent from the government and apolitical so they have credibility in inflation targeting. The MPC meet once a month and consider all the factors affecting inflation over the next 2 years:
- Economic growth. Higher growth causes income and consumption to rise and demand-pull inflation.
- Consumption. An increase in consumption causes demand-pull inflation. - Asset prices. A rise in house prices induces a wealth effect that increases consumption and
causes demand-pull inflation. - Unemployment. Lower unemployment means income and consumption rise so there is
demand-pull inflation. - Exchange Rate. A fall in the exchange rate causes exports to rise, imports to fall and
demand-pull inflation. Also, imports are more expensive so there is cost-push inflation. - Commodity prices. A rise in commodity prices means imported commodities are more
expensive and firms’ costs rise so there is cost-push inflation. - Less Developed Country (LDC) wages. UK workers must compete with low wages in LDCs to
attract MNCs and find employment, this leads to lower wages for UK firms and cost-push deflation.
After considering all the factors affecting inflation, the MPC predict inflation over the next two years and decide on what should happen to interest rates to keep inflation within its target. If inflation is too low, the MPC will use loose monetary policy to decrease interest rates and increase inflation. If inflation is too high, the MPC will use tight monetary policy to increase interest rates and decrease inflation.
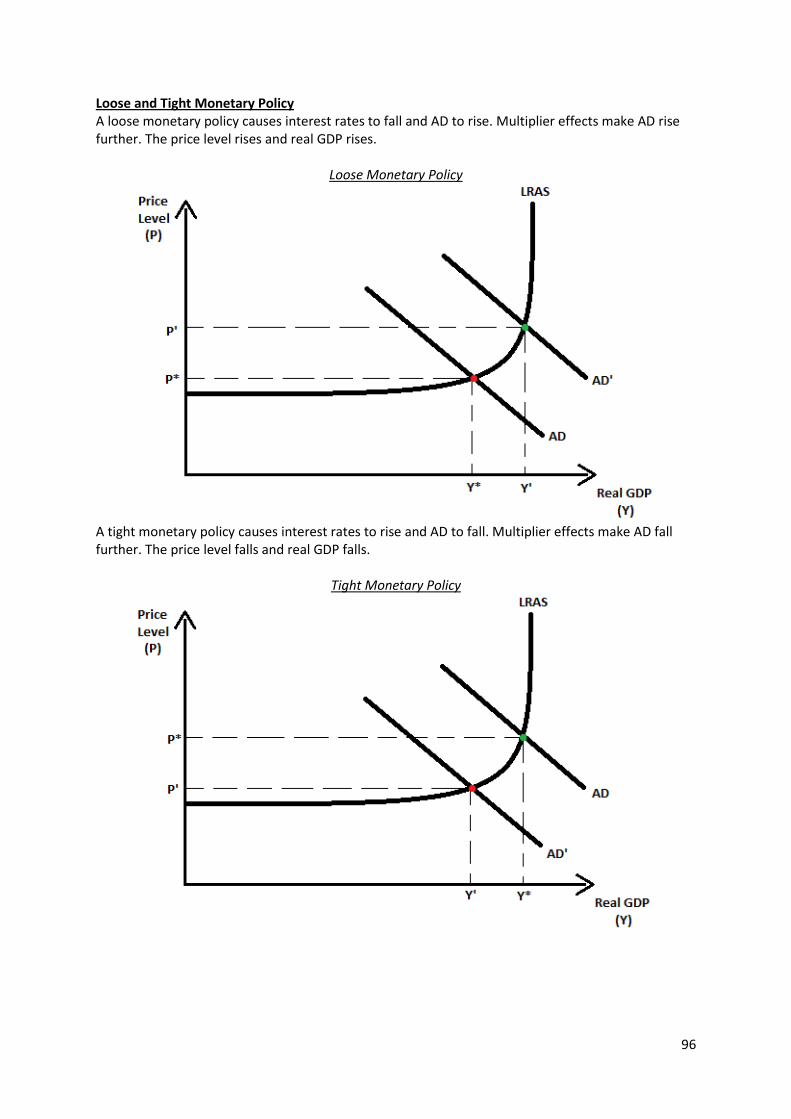
96
Loose and Tight Monetary Policy A loose monetary policy causes interest rates to fall and AD to rise. Multiplier effects make AD rise further. The price level rises and real GDP rises.
Loose Monetary Policy
A tight monetary policy causes interest rates to rise and AD to fall. Multiplier effects make AD fall further. The price level falls and real GDP falls.
Tight Monetary Policy
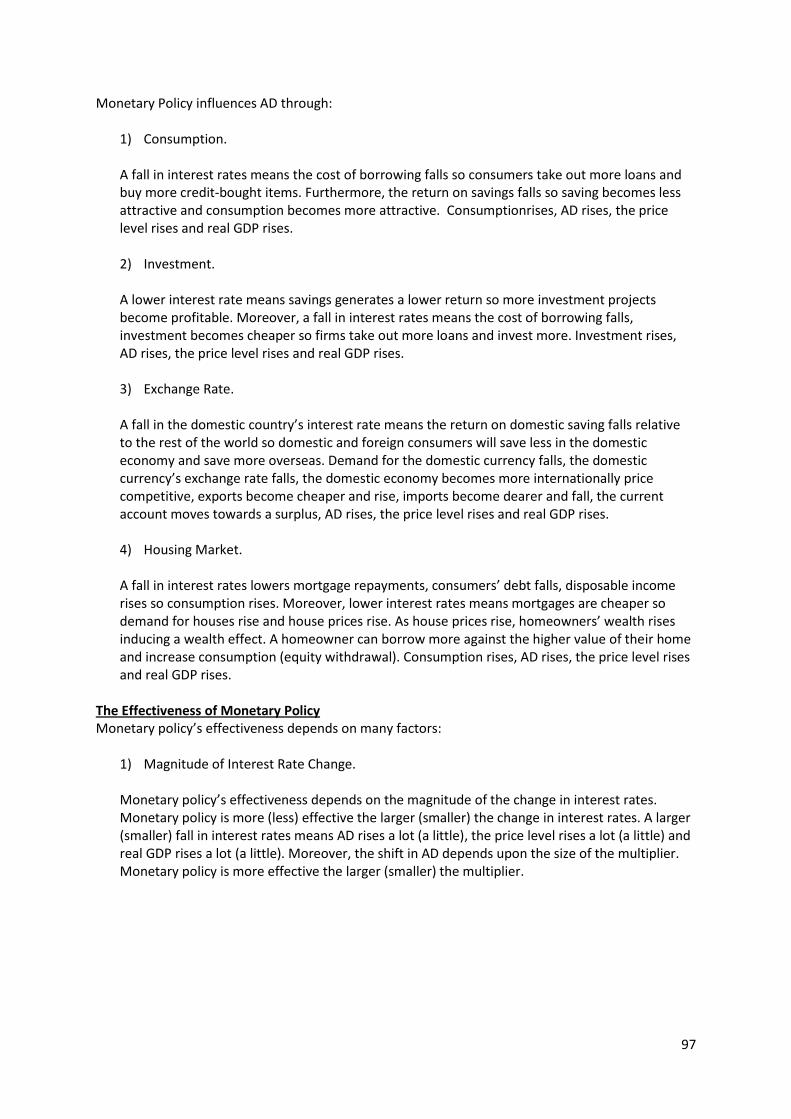
97
Monetary Policy influences AD through:
1) Consumption. A fall in interest rates means the cost of borrowing falls so consumers take out more loans and buy more credit-bought items. Furthermore, the return on savings falls so saving becomes less attractive and consumption becomes more attractive. Consumptionrises, AD rises, the price level rises and real GDP rises. 2) Investment. A lower interest rate means savings generates a lower return so more investment projects become profitable. Moreover, a fall in interest rates means the cost of borrowing falls, investment becomes cheaper so firms take out more loans and invest more. Investment rises, AD rises, the price level rises and real GDP rises. 3) Exchange Rate. A fall in the domestic country’s interest rate means the return on domestic saving falls relative to the rest of the world so domestic and foreign consumers will save less in the domestic economy and save more overseas. Demand for the domestic currency falls, the domestic currency’s exchange rate falls, the domestic economy becomes more internationally price competitive, exports become cheaper and rise, imports become dearer and fall, the current account moves towards a surplus, AD rises, the price level rises and real GDP rises. 4) Housing Market. A fall in interest rates lowers mortgage repayments, consumers’ debt falls, disposable income rises so consumption rises. Moreover, lower interest rates means mortgages are cheaper so demand for houses rise and house prices rise. As house prices rise, homeowners’ wealth rises inducing a wealth effect. A homeowner can borrow more against the higher value of their home and increase consumption (equity withdrawal). Consumption rises, AD rises, the price level rises and real GDP rises.
The Effectiveness of Monetary Policy Monetary policy’s effectiveness depends on many factors:
1) Magnitude of Interest Rate Change. Monetary policy’s effectiveness depends on the magnitude of the change in interest rates. Monetary policy is more (less) effective the larger (smaller) the change in interest rates. A larger (smaller) fall in interest rates means AD rises a lot (a little), the price level rises a lot (a little) and real GDP rises a lot (a little). Moreover, the shift in AD depends upon the size of the multiplier. Monetary policy is more effective the larger (smaller) the multiplier.
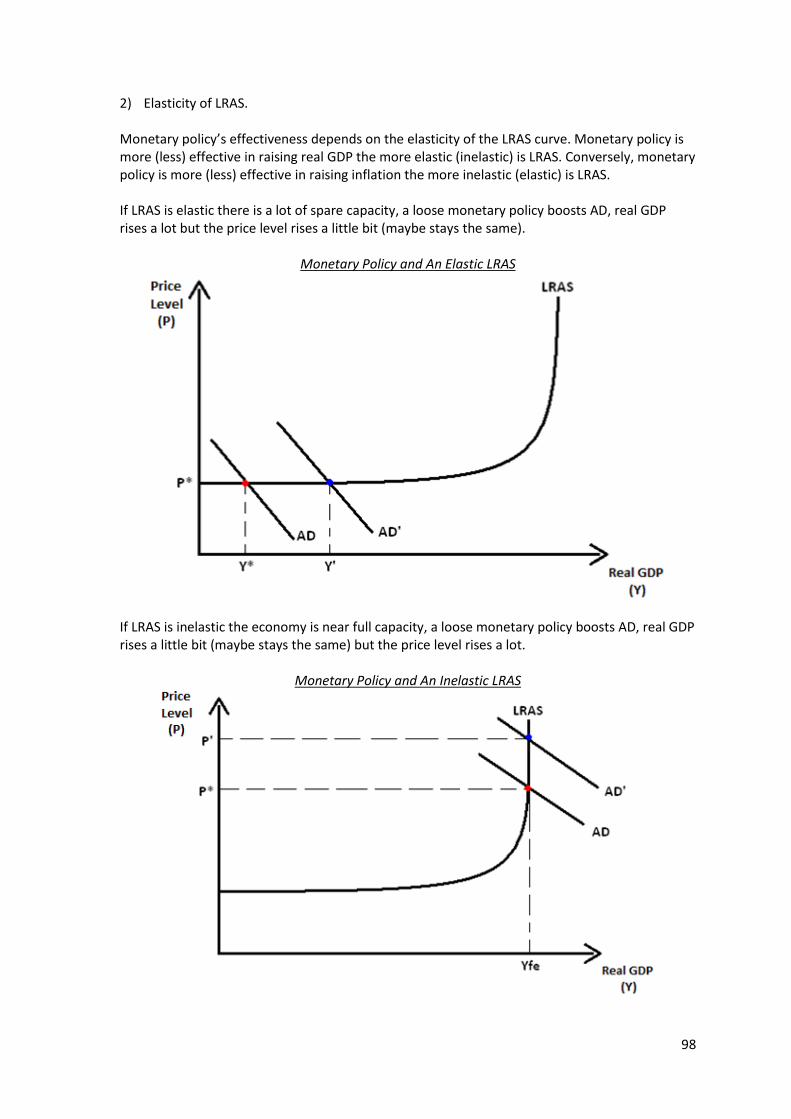
98
2) Elasticity of LRAS. Monetary policy’s effectiveness depends on the elasticity of the LRAS curve. Monetary policy is more (less) effective in raising real GDP the more elastic (inelastic) is LRAS. Conversely, monetary policy is more (less) effective in raising inflation the more inelastic (elastic) is LRAS. If LRAS is elastic there is a lot of spare capacity, a loose monetary policy boosts AD, real GDP rises a lot but the price level rises a little bit (maybe stays the same).
Monetary Policy and An Elastic LRAS
If LRAS is inelastic the economy is near full capacity, a loose monetary policy boosts AD, real GDP rises a little bit (maybe stays the same) but the price level rises a lot.
Monetary Policy and An Inelastic LRAS
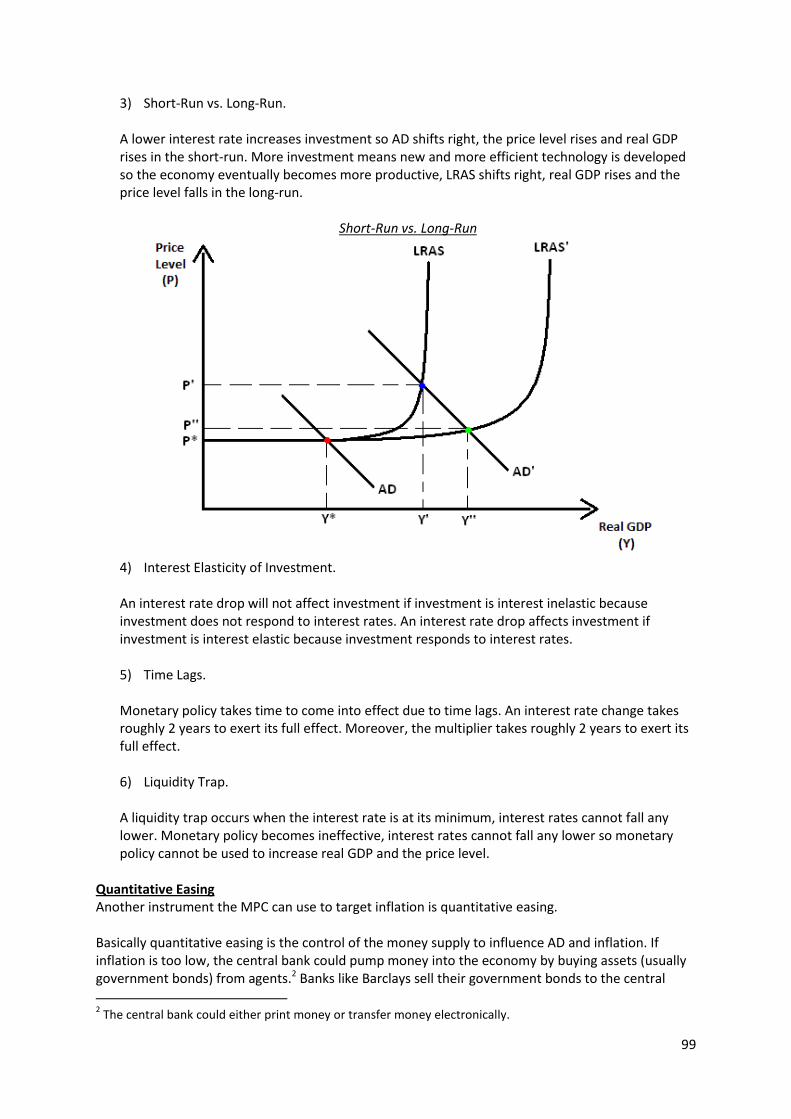
99
3) Short-Run vs. Long-Run. A lower interest rate increases investment so AD shifts right, the price level rises and real GDP rises in the short-run. More investment means new and more efficient technology is developed so the economy eventually becomes more productive, LRAS shifts right, real GDP rises and the price level falls in the long-run.
Short-Run vs. Long-Run
4) Interest Elasticity of Investment. An interest rate drop will not affect investment if investment is interest inelastic because investment does not respond to interest rates. An interest rate drop affects investment if investment is interest elastic because investment responds to interest rates. 5) Time Lags. Monetary policy takes time to come into effect due to time lags. An interest rate change takes roughly 2 years to exert its full effect. Moreover, the multiplier takes roughly 2 years to exert its full effect. 6) Liquidity Trap. A liquidity trap occurs when the interest rate is at its minimum, interest rates cannot fall any lower. Monetary policy becomes ineffective, interest rates cannot fall any lower so monetary policy cannot be used to increase real GDP and the price level.
Quantitative Easing Another instrument the MPC can use to target inflation is quantitative easing. Basically quantitative easing is the control of the money supply to influence AD and inflation. If inflation is too low, the central bank could pump money into the economy by buying assets (usually government bonds) from agents.2 Banks like Barclays sell their government bonds to the central
2 The central bank could either print money or transfer money electronically.
100
bank, so Barclays has more money to lend, consumers can take out more loans so consumption rises, firms can take out more loans so investment rises and AD rises. Multiplier effects make AD shift further and inflation increases. However, quantitative easing is relatively untried in the UK, it was first used in 2009, so its effects may be unpredictable. Maybe quantitative easing is dangerous, it could make inflation rise above target and become out of control. Problems Facing the MPC The MPC face many problems when setting interest rates to target inflation:
1) Trade-Offs. Higher interest rates reduce inflation but they may also reduce AD, income, employment and real GDP. This causes a conflict with the government’s macroeconomic objectives. 2) Lags. It takes time to change interest rates. Also, it takes roughly two years for interest rates to exert their full effect on investment and consumption. This makes it more difficult to plan what should happen to interest rates. 3) Uncertainty. Some events cannot be predicted (maybe oil price shocks or financial crises). Resultantly, the MPC will fail to implement an effective policy response, interest rates may be too high or too low so inflation will be off target. Maybe new economic models need to be built to explain these shocks. 4) Data Reliability. Data may be imperfect, and if the MPC plan and act with inaccurate information they will set the wrong type of interest rate response. 5) Conflicting Data. Conflicting data makes it more difficult for the MPC to decide on the interest rate response. Some data could indicate that inflation is rising so interest rates must rise whilst other data indicates that inflation is falling so interest rates must fall. 6) Models. Economists do not agree on the ‘correct’ model of the economy (for example Keynesian models vs. Classical models). MPC members may not agree on models, some may argue that interest rates must rise whilst others may argue that interest rates must fall.
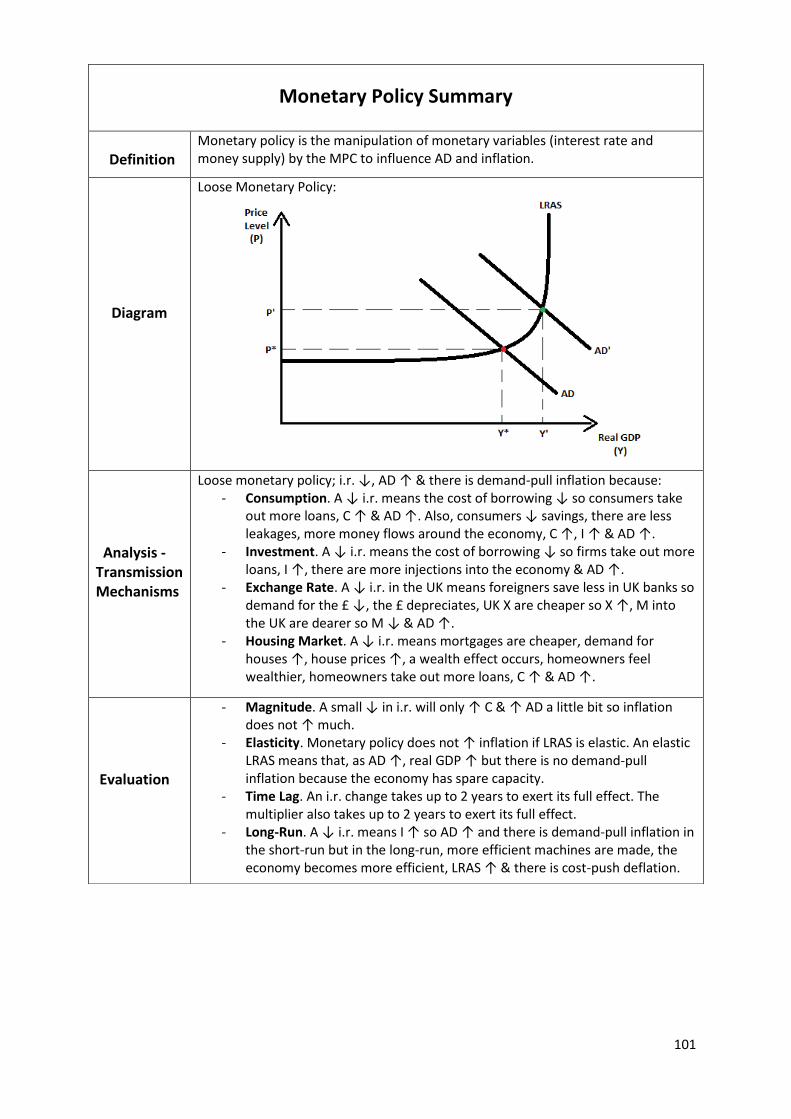
101
Monetary Policy Summary
Definition
Monetary policy is the manipulation of monetary variables (interest rate and money supply) by the MPC to influence AD and inflation.
Diagram
Loose Monetary Policy:
Analysis - Transmission Mechanisms
Loose monetary policy; i.r. ↓, AD ↑ & there is demand-pull inflation because: - Consumption. A ↓ i.r. means the cost of borrowing ↓ so consumers take
out more loans, C ↑ & AD ↑. Also, consumers ↓ savings, there are less leakages, more money flows around the economy, C ↑, I ↑ & AD ↑.
- Investment. A ↓ i.r. means the cost of borrowing ↓ so firms take out more loans, I ↑, there are more injections into the economy & AD ↑.
- Exchange Rate. A ↓ i.r. in the UK means foreigners save less in UK banks so demand for the £ ↓, the £ depreciates, UK X are cheaper so X ↑, M into the UK are dearer so M ↓ & AD ↑.
- Housing Market. A ↓ i.r. means mortgages are cheaper, demand for houses ↑, house prices ↑, a wealth effect occurs, homeowners feel wealthier, homeowners take out more loans, C ↑ & AD ↑.
Evaluation
- Magnitude. A small ↓ in i.r. will only ↑ C & ↑ AD a little bit so inflation does not ↑ much.
- Elasticity. Monetary policy does not ↑ inflation if LRAS is elastic. An elastic LRAS means that, as AD ↑, real GDP ↑ but there is no demand-pull inflation because the economy has spare capacity.
- Time Lag. An i.r. change takes up to 2 years to exert its full effect. The multiplier also takes up to 2 years to exert its full effect.
- Long-Run. A ↓ i.r. means I ↑ so AD ↑ and there is demand-pull inflation in the short-run but in the long-run, more efficient machines are made, the economy becomes more efficient, LRAS ↑ & there is cost-push deflation.
102
Fiscal Policy
Fiscal policy is the manipulation of government expenditure (G) and taxation (T) by the government to influence macroeconomic variables. Government expenditure is total expenditure by the government on goods and services like merit goods (education and healthcare) and public goods (roads, the police, national defence and the law). Taxes are either direct or indirect. Direct taxes are taxes on consumers’ income (income tax) or firms’ profits (corporation tax). Indirect taxes are taxes on expenditure (VAT). The fiscal budget is tax revenue minus government expenditure . A balanced budget means so . A budget surplus means so . A budget deficit means so . Public Sector Net Cash Requirement Public sector net cash requirement (PSNCR) is government borrowing over a period of time, the difference between government expenditure and tax revenue. A budget deficit means G>T so the government must borrow funds to spend and the government goes into debt and the PSNCR is positive. A budget surplus means G<T so the government is receiving more tax revenue than it is spending and the PSNCR is negative. National Debt National debt is the sum of all the past unpaid government borrowing. Problems with a large national debt:
- A large national debt means the government may increase taxes in the future to repay the debt, so there is an opportunity cost to future generations who must suffer higher taxes.
- Maybe existing consumers decrease their own consumption to save and pay for an anticipated future tax increase, so AD falls and real GDP falls.
- A large debt may be unsustainable because it means a higher risk of default, lower credit worthiness, higher interest rates and the debt spirals out of control. The government could become riddled with financial troubles. But, if the government borrowed to develop the infrastructure and education then LRAS shifts right, real GDP rises, the government’s tax revenue rises and it can repay its debt in the future.
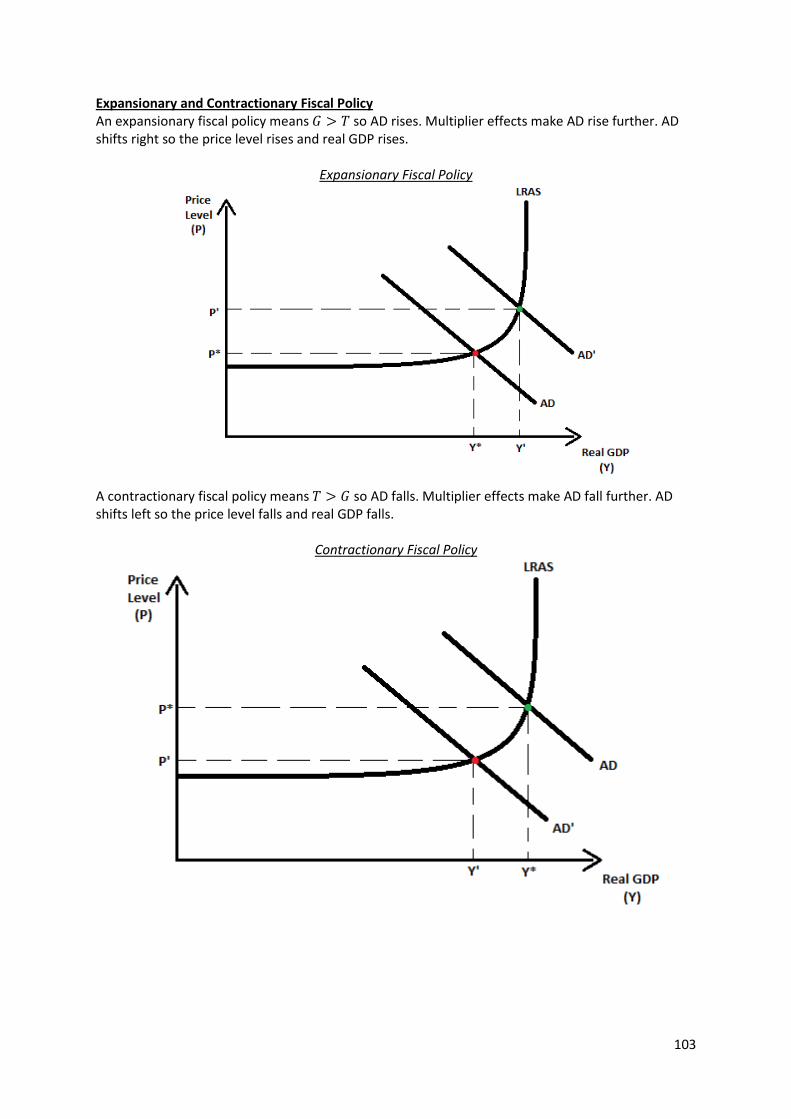
103
Expansionary and Contractionary Fiscal Policy An expansionary fiscal policy means so AD rises. Multiplier effects make AD rise further. AD shifts right so the price level rises and real GDP rises.
Expansionary Fiscal Policy A contractionary fiscal policy means so AD falls. Multiplier effects make AD fall further. AD shifts left so the price level falls and real GDP falls.
Contractionary Fiscal Policy
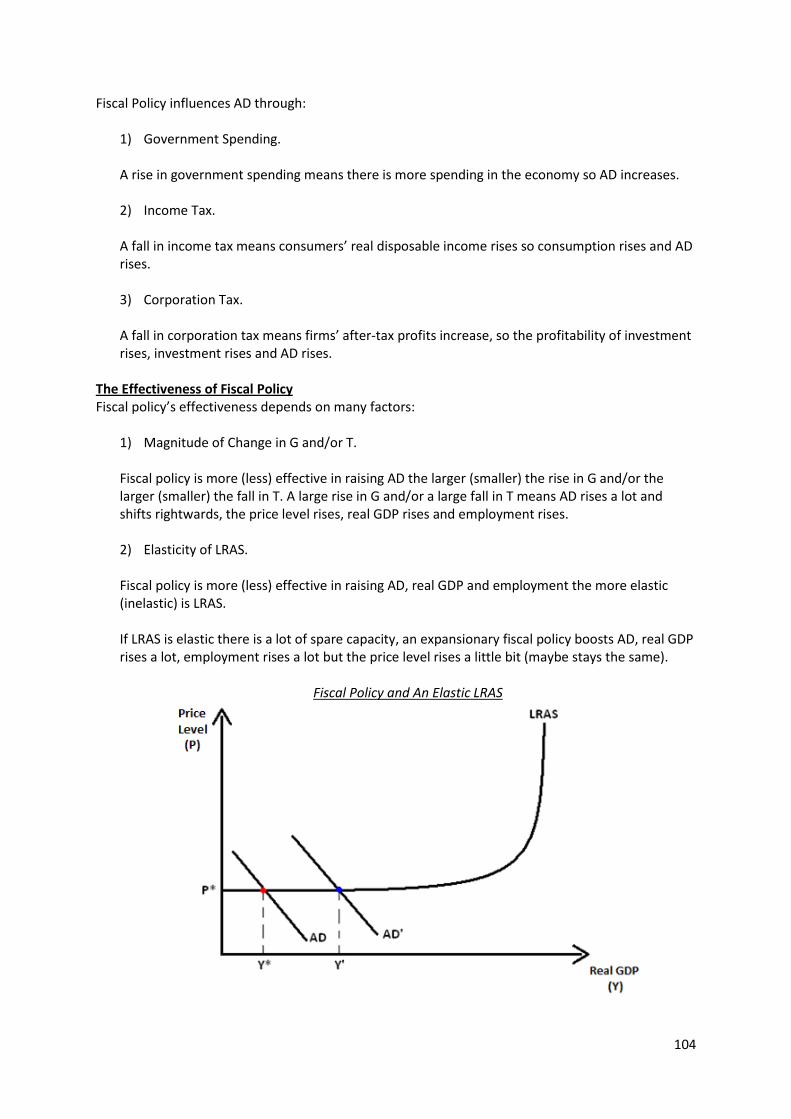
104
Fiscal Policy influences AD through:
1) Government Spending. A rise in government spending means there is more spending in the economy so AD increases. 2) Income Tax. A fall in income tax means consumers’ real disposable income rises so consumption rises and AD rises. 3) Corporation Tax. A fall in corporation tax means firms’ after-tax profits increase, so the profitability of investment rises, investment rises and AD rises.
The Effectiveness of Fiscal Policy Fiscal policy’s effectiveness depends on many factors:
1) Magnitude of Change in G and/or T. Fiscal policy is more (less) effective in raising AD the larger (smaller) the rise in G and/or the larger (smaller) the fall in T. A large rise in G and/or a large fall in T means AD rises a lot and shifts rightwards, the price level rises, real GDP rises and employment rises. 2) Elasticity of LRAS. Fiscal policy is more (less) effective in raising AD, real GDP and employment the more elastic (inelastic) is LRAS. If LRAS is elastic there is a lot of spare capacity, an expansionary fiscal policy boosts AD, real GDP rises a lot, employment rises a lot but the price level rises a little bit (maybe stays the same).
Fiscal Policy and An Elastic LRAS
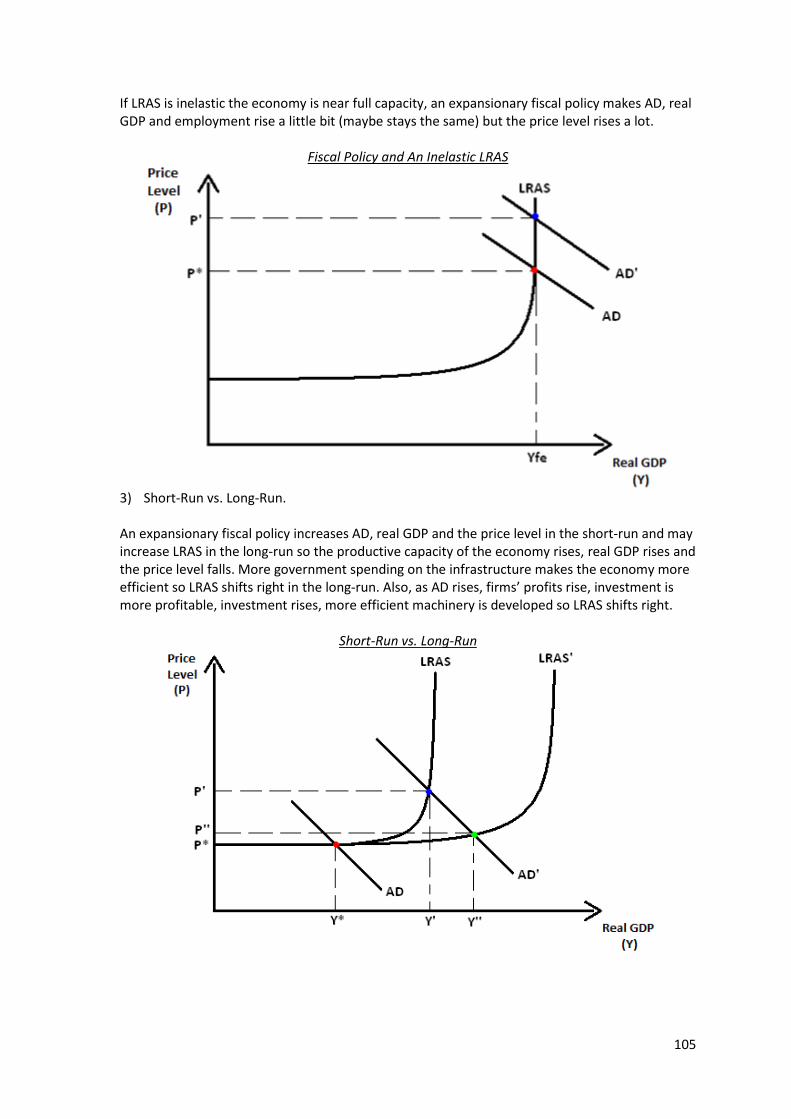
105
If LRAS is inelastic the economy is near full capacity, an expansionary fiscal policy makes AD, real GDP and employment rise a little bit (maybe stays the same) but the price level rises a lot.
Fiscal Policy and An Inelastic LRAS
3) Short-Run vs. Long-Run. An expansionary fiscal policy increases AD, real GDP and the price level in the short-run and may increase LRAS in the long-run so the productive capacity of the economy rises, real GDP rises and the price level falls. More government spending on the infrastructure makes the economy more efficient so LRAS shifts right in the long-run. Also, as AD rises, firms’ profits rise, investment is more profitable, investment rises, more efficient machinery is developed so LRAS shifts right.
Short-Run vs. Long-Run
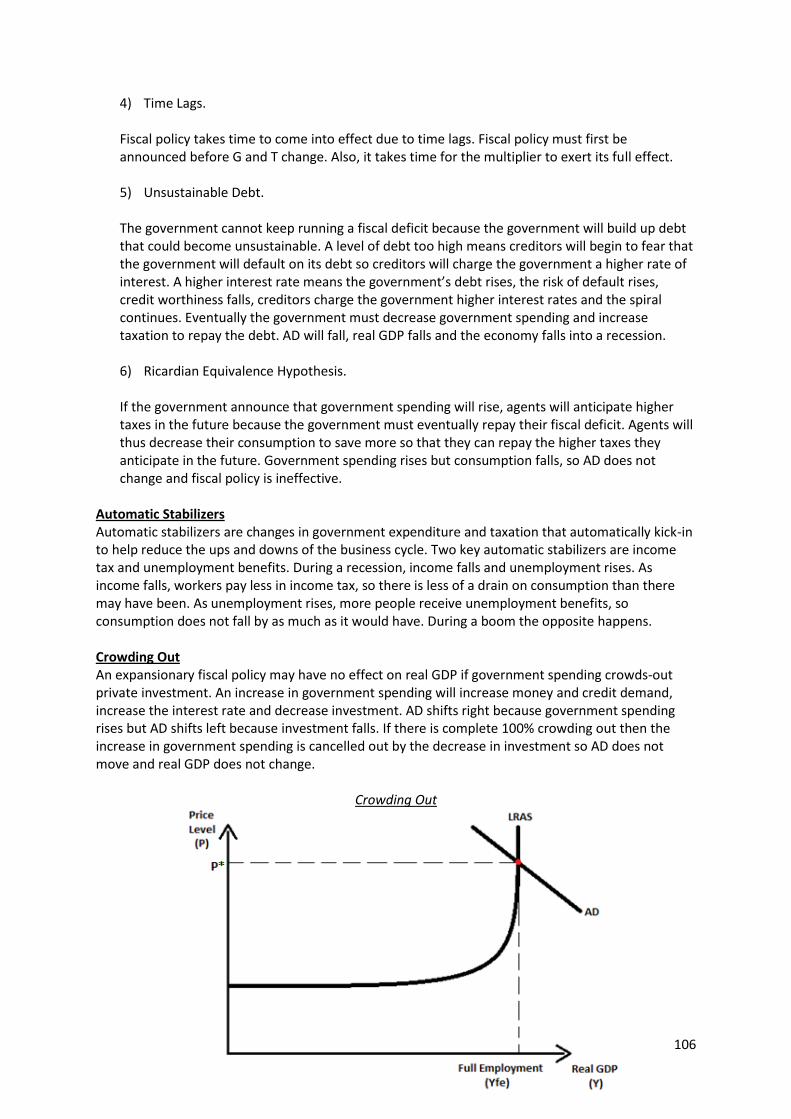
106
4) Time Lags. Fiscal policy takes time to come into effect due to time lags. Fiscal policy must first be announced before G and T change. Also, it takes time for the multiplier to exert its full effect. 5) Unsustainable Debt. The government cannot keep running a fiscal deficit because the government will build up debt that could become unsustainable. A level of debt too high means creditors will begin to fear that the government will default on its debt so creditors will charge the government a higher rate of interest. A higher interest rate means the government’s debt rises, the risk of default rises, credit worthiness falls, creditors charge the government higher interest rates and the spiral continues. Eventually the government must decrease government spending and increase taxation to repay the debt. AD will fall, real GDP falls and the economy falls into a recession. 6) Ricardian Equivalence Hypothesis. If the government announce that government spending will rise, agents will anticipate higher taxes in the future because the government must eventually repay their fiscal deficit. Agents will thus decrease their consumption to save more so that they can repay the higher taxes they anticipate in the future. Government spending rises but consumption falls, so AD does not change and fiscal policy is ineffective.
Automatic Stabilizers Automatic stabilizers are changes in government expenditure and taxation that automatically kick-in to help reduce the ups and downs of the business cycle. Two key automatic stabilizers are income tax and unemployment benefits. During a recession, income falls and unemployment rises. As income falls, workers pay less in income tax, so there is less of a drain on consumption than there may have been. As unemployment rises, more people receive unemployment benefits, so consumption does not fall by as much as it would have. During a boom the opposite happens. Crowding Out An expansionary fiscal policy may have no effect on real GDP if government spending crowds-out private investment. An increase in government spending will increase money and credit demand, increase the interest rate and decrease investment. AD shifts right because government spending rises but AD shifts left because investment falls. If there is complete 100% crowding out then the increase in government spending is cancelled out by the decrease in investment so AD does not move and real GDP does not change.
Crowding Out
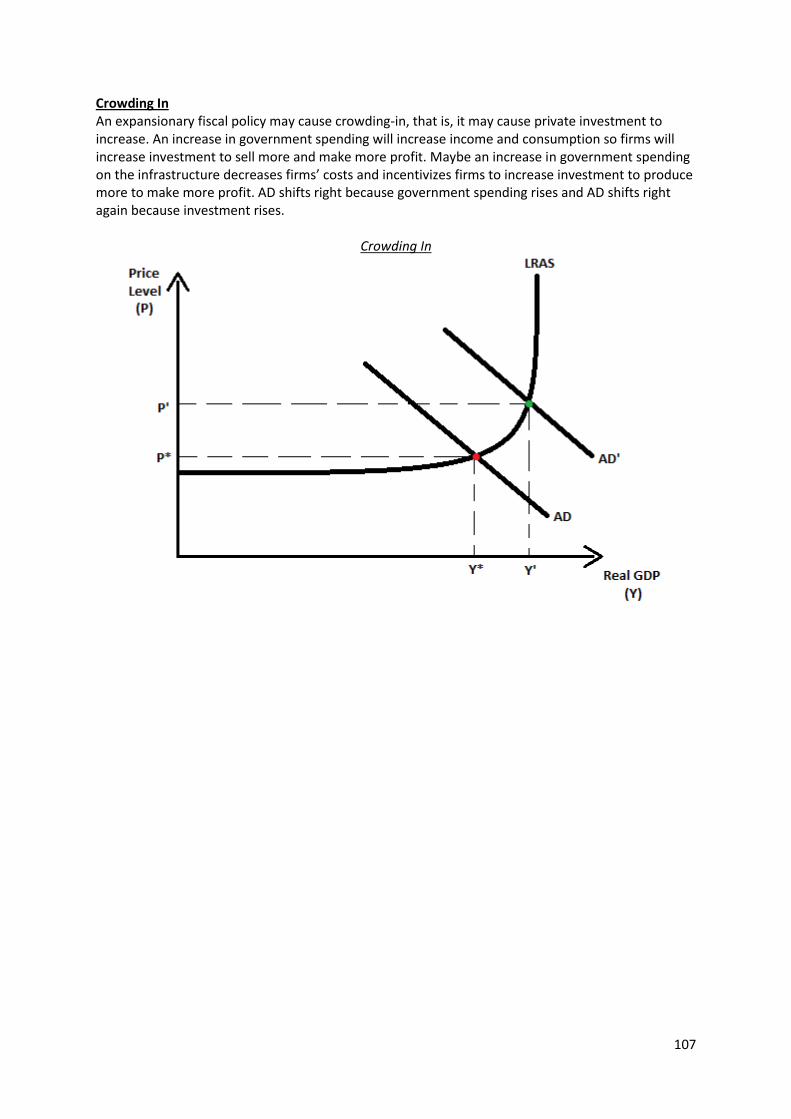
107
Crowding In An expansionary fiscal policy may cause crowding-in, that is, it may cause private investment to increase. An increase in government spending will increase income and consumption so firms will increase investment to sell more and make more profit. Maybe an increase in government spending on the infrastructure decreases firms’ costs and incentivizes firms to increase investment to produce more to make more profit. AD shifts right because government spending rises and AD shifts right again because investment rises.
Crowding In
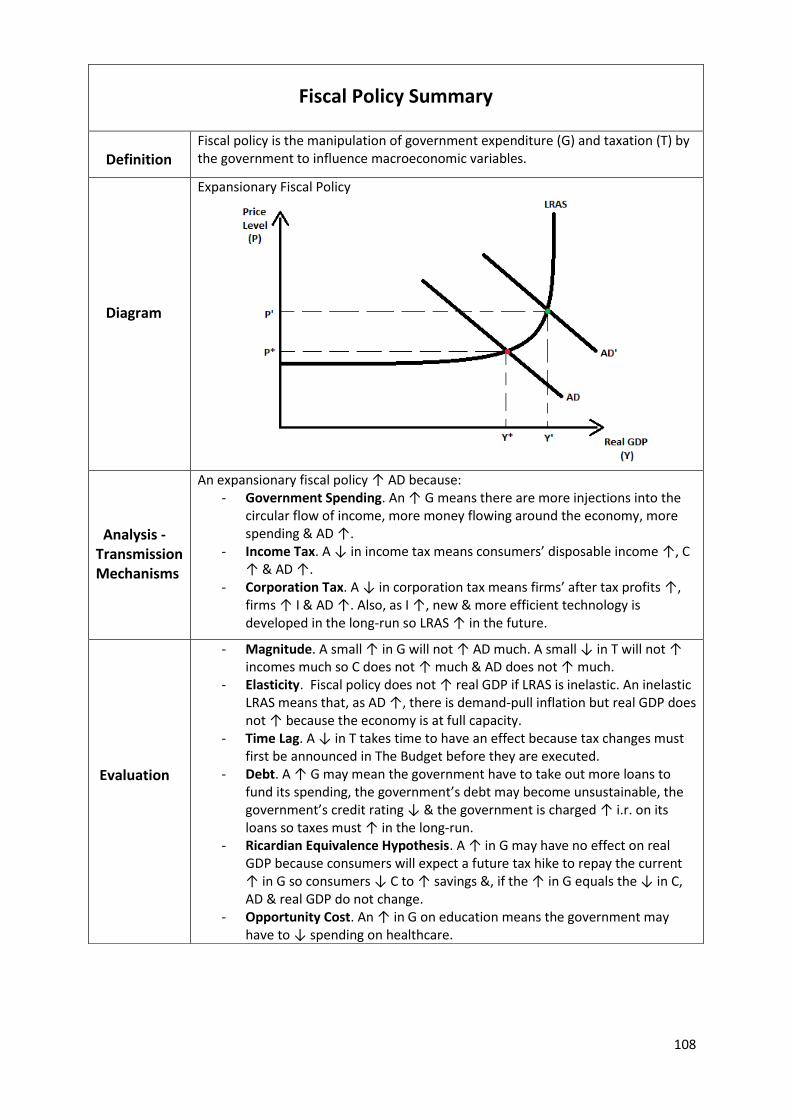
108
Fiscal Policy Summary
Definition
Fiscal policy is the manipulation of government expenditure (G) and taxation (T) by the government to influence macroeconomic variables.
Diagram
Expansionary Fiscal Policy
Analysis - Transmission Mechanisms
An expansionary fiscal policy ↑ AD because: - Government Spending. An ↑ G means there are more injections into the
circular flow of income, more money flowing around the economy, more spending & AD ↑.
- Income Tax. A ↓ in income tax means consumers’ disposable income ↑, C ↑ & AD ↑.
- Corporation Tax. A ↓ in corporation tax means firms’ after tax profits ↑, firms ↑ I & AD ↑. Also, as I ↑, new & more efficient technology is developed in the long-run so LRAS ↑ in the future.
Evaluation
- Magnitude. A small ↑ in G will not ↑ AD much. A small ↓ in T will not ↑ incomes much so C does not ↑ much & AD does not ↑ much.
- Elasticity. Fiscal policy does not ↑ real GDP if LRAS is inelastic. An inelastic LRAS means that, as AD ↑, there is demand-pull inflation but real GDP does not ↑ because the economy is at full capacity.
- Time Lag. A ↓ in T takes time to have an effect because tax changes must first be announced in The Budget before they are executed.
- Debt. A ↑ G may mean the government have to take out more loans to fund its spending, the government’s debt may become unsustainable, the government’s credit rating ↓ & the government is charged ↑ i.r. on its loans so taxes must ↑ in the long-run.
- Ricardian Equivalence Hypothesis. A ↑ in G may have no effect on real GDP because consumers will expect a future tax hike to repay the current ↑ in G so consumers ↓ C to ↑ savings &, if the ↑ in G equals the ↓ in C, AD & real GDP do not change.
- Opportunity Cost. An ↑ in G on education means the government may have to ↓ spending on healthcare.

109
Supply-Side Policies
Supply-side policies are designed to increase productivity/efficiency and shift LRAS right. The productive capacity of the economy increases because more can be produced. As LRAS shifts right, the price level falls and real GDP rises.
Supply-Side Policy
The government could make the labour market more flexible to increase the quantity and quality of labour, encourage firms to invest, develop the infrastructure and cut red tape. Many supply-side policies can be used:
1) Education and Training. Education and training improves workers’ human capital. Labour becomes more skilled and efficient, the marginal productivity of labour rises so workers produce more and LRAS shifts right. Also, better trained labour means less structural unemployment as workers can adapt more easily to different jobs, and more employment means more can be produced.
2) Reduce Income Tax. A decrease in income tax is likely to increase labour supply, so the economy can produce more and LRAS shifts right. A lower tax acts through the substitution effect to incentivize workers to work more because they can earn more. A lower tax acts through the income effect to disincentivize workers from working because they can earn the same income as before by working less. As long as the substitution effect is greater than the income effect, a fall in taxes will increase labour supply. Although, if the income effect is greater than the substitution effect, a fall in income tax means a decrease in labour supply, the economy produces less and LRAS shifts left.
110
3) Reduce Unemployment Benefits. Reduce unemployment benefits to encourage the unemployed to work so LRAS shifts right. Although, the unemployed still may not work because wages after taxes may be too low. The government must also decrease taxes at the same time to encourage the unemployed to work. 4) Remove Minimum Wages. Remove minimum wages, wages fall, firms demand more labour so employment rises, more can be produced and LRAS shifts right.
5) Reduce Trade Union Power. Remove (or reduce the power of) trade unions, wages fall so firms demand more labour, employment rises, more can be produced and LRAS shifts right. Also, less strikes occur so workers take less days off work.
6) Corporation Tax. If the government reduce corporation tax, firms’ after-tax profits rise, investment is incentivized because firms keep more of their profits, investment rises, better technology and more efficient machinery is developed, so more output can be produced and LRAS shifts right. 7) Infrastructure. An increase in government spending on the infrastructure means better roads, railways, ports, utility networks and telecommunications, the economy becomes more efficient and firms can produce more so LRAS shifts right. 8) Research and Development (R&D). R&D grants could be used to encourage firms to invest and innovate to develop new and more efficient technology so LRAS shifts right. 9) Red Tape. Red tape could be reduced (for example less laws and form-filling), firms’ costs fall so firms can produce more and LRAS shifts right. Also, more firms can enter the market so competition increases, firms must become more efficient and reduce costs to compete with rivals. 10) Privatization. Privatization is the sale of state-owned assets or enterprises to the private sector. A private frim aims to profit maximize so it is likely to be efficient and minimize costs so LRAS shifts right.
111
Effectiveness of Supply-Side Policies The effectiveness of supply-side policies depends on many factors:
1) Magnitude. A small cut in income tax or a small increase in government spending on the infrastructure will not increase efficiency that much so LRAS only shifts a little bit. 2) Time Lags. Most supply-side policies exert their effect in the long-run. It takes time to educate and train workers, build roads and telecommunication networks and to develop new and more efficient technology. 3) Short-Run vs. Long-Run. In the short-run AD rises because investment is higher, so AD shifts right, spare capacity runs out, the price level rises and real GDP rises. So supply-side policies have inflationary effects in the short-run. Although in the long-run, the price level falls because LRAS shifts right. 4) Opportunity Cost. Supply-side policies may be very expensive so there is an opportunity cost involved. For example, an increase in government spending on the infrastructure may mean less spending on education or healthcare.
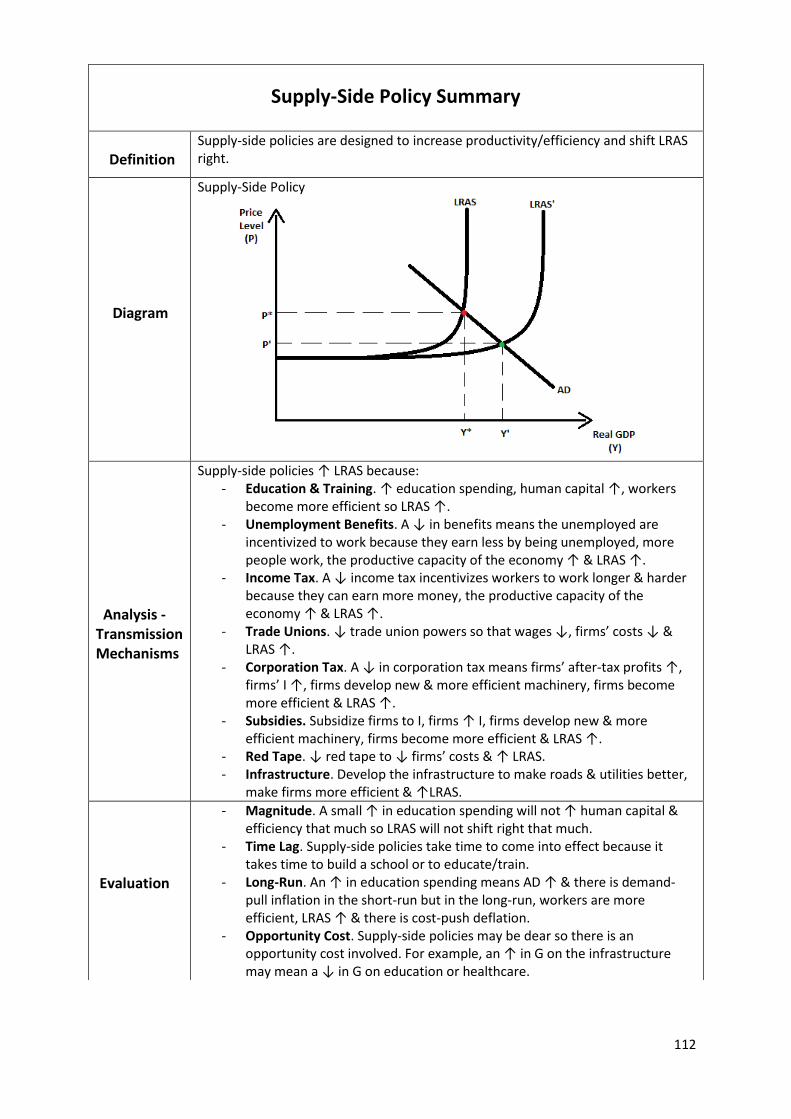
112
Supply-Side Policy Summary
Definition
Supply-side policies are designed to increase productivity/efficiency and shift LRAS right.
Diagram
Supply-Side Policy
Analysis - Transmission Mechanisms
Supply-side policies ↑ LRAS because: - Education & Training. ↑ education spending, human capital ↑, workers
become more efficient so LRAS ↑. - Unemployment Benefits. A ↓ in benefits means the unemployed are
incentivized to work because they earn less by being unemployed, more people work, the productive capacity of the economy ↑ & LRAS ↑.
- Income Tax. A ↓ income tax incentivizes workers to work longer & harder because they can earn more money, the productive capacity of the economy ↑ & LRAS ↑.
- Trade Unions. ↓ trade union powers so that wages ↓, firms’ costs ↓ & LRAS ↑.
- Corporation Tax. A ↓ in corporation tax means firms’ after-tax profits ↑, firms’ I ↑, firms develop new & more efficient machinery, firms become more efficient & LRAS ↑.
- Subsidies. Subsidize firms to I, firms ↑ I, firms develop new & more efficient machinery, firms become more efficient & LRAS ↑.
- Red Tape. ↓ red tape to ↓ firms’ costs & ↑ LRAS. - Infrastructure. Develop the infrastructure to make roads & utilities better,
make firms more efficient & ↑LRAS.
Evaluation
- Magnitude. A small ↑ in education spending will not ↑ human capital & efficiency that much so LRAS will not shift right that much.
- Time Lag. Supply-side policies take time to come into effect because it takes time to build a school or to educate/train.
- Long-Run. An ↑ in education spending means AD ↑ & there is demand-pull inflation in the short-run but in the long-run, workers are more efficient, LRAS ↑ & there is cost-push deflation.
- Opportunity Cost. Supply-side policies may be dear so there is an opportunity cost involved. For example, an ↑ in G on the infrastructure may mean a ↓ in G on education or healthcare.
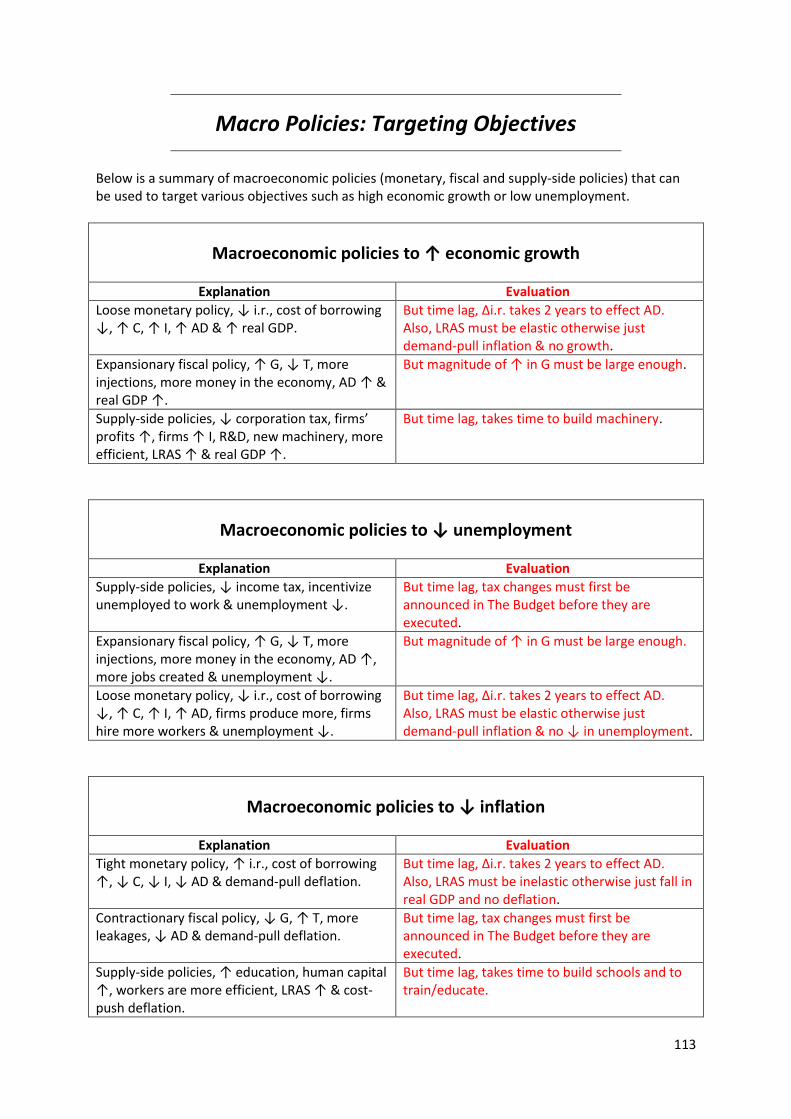
113
Macro Policies: Targeting Objectives
Below is a summary of macroeconomic policies (monetary, fiscal and supply-side policies) that can be used to target various objectives such as high economic growth or low unemployment.
Macroeconomic policies to ↑ economic growth
Explanation Evaluation
Loose monetary policy, ↓ i.r., cost of borrowing ↓, ↑ C, ↑ I, ↑ AD & ↑ real GDP.
But time lag, ∆i.r. takes 2 years to effect AD. Also, LRAS must be elastic otherwise just demand-pull inflation & no growth.
Expansionary fiscal policy, ↑ G, ↓ T, more injections, more money in the economy, AD ↑ & real GDP ↑.
But magnitude of ↑ in G must be large enough.
Supply-side policies, ↓ corporation tax, firms’ profits ↑, firms ↑ I, R&D, new machinery, more efficient, LRAS ↑ & real GDP ↑.
But time lag, takes time to build machinery.
Macroeconomic policies to ↓ unemployment
Explanation Evaluation
Supply-side policies, ↓ income tax, incentivize unemployed to work & unemployment ↓.
But time lag, tax changes must first be announced in The Budget before they are executed.
Expansionary fiscal policy, ↑ G, ↓ T, more injections, more money in the economy, AD ↑, more jobs created & unemployment ↓.
But magnitude of ↑ in G must be large enough.
Loose monetary policy, ↓ i.r., cost of borrowing ↓, ↑ C, ↑ I, ↑ AD, firms produce more, firms hire more workers & unemployment ↓.
But time lag, ∆i.r. takes 2 years to effect AD. Also, LRAS must be elastic otherwise just demand-pull inflation & no ↓ in unemployment.
Macroeconomic policies to ↓ inflation
Explanation Evaluation
Tight monetary policy, ↑ i.r., cost of borrowing ↑, ↓ C, ↓ I, ↓ AD & demand-pull deflation.
But time lag, ∆i.r. takes 2 years to effect AD. Also, LRAS must be inelastic otherwise just fall in real GDP and no deflation.
Contractionary fiscal policy, ↓ G, ↑ T, more leakages, ↓ AD & demand-pull deflation.
But time lag, tax changes must first be announced in The Budget before they are executed.
Supply-side policies, ↑ education, human capital ↑, workers are more efficient, LRAS ↑ & cost-push deflation.
But time lag, takes time to build schools and to train/educate.
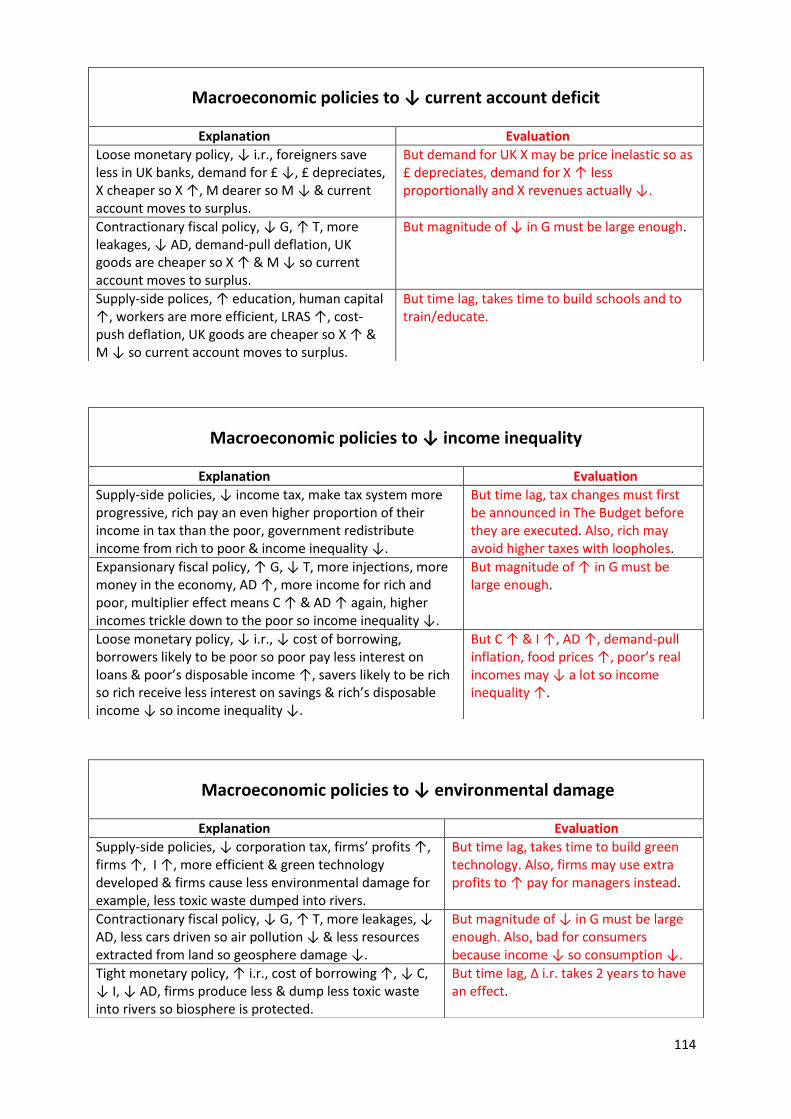
114
Macroeconomic policies to ↓ current account deficit
Explanation Evaluation
Loose monetary policy, ↓ i.r., foreigners save less in UK banks, demand for £ ↓, £ depreciates, X cheaper so X ↑, M dearer so M ↓ & current account moves to surplus.
But demand for UK X may be price inelastic so as £ depreciates, demand for X ↑ less proportionally and X revenues actually ↓.
Contractionary fiscal policy, ↓ G, ↑ T, more leakages, ↓ AD, demand-pull deflation, UK goods are cheaper so X ↑ & M ↓ so current account moves to surplus.
But magnitude of ↓ in G must be large enough.
Supply-side polices, ↑ education, human capital ↑, workers are more efficient, LRAS ↑, cost-push deflation, UK goods are cheaper so X ↑ & M ↓ so current account moves to surplus.
But time lag, takes time to build schools and to train/educate.
Macroeconomic policies to ↓ income inequality
Explanation Evaluation
Supply-side policies, ↓ income tax, make tax system more progressive, rich pay an even higher proportion of their income in tax than the poor, government redistribute income from rich to poor & income inequality ↓.
But time lag, tax changes must first be announced in The Budget before they are executed. Also, rich may avoid higher taxes with loopholes.
Expansionary fiscal policy, ↑ G, ↓ T, more injections, more money in the economy, AD ↑, more income for rich and poor, multiplier effect means C ↑ & AD ↑ again, higher incomes trickle down to the poor so income inequality ↓.
But magnitude of ↑ in G must be large enough.
Loose monetary policy, ↓ i.r., ↓ cost of borrowing, borrowers likely to be poor so poor pay less interest on loans & poor’s disposable income ↑, savers likely to be rich so rich receive less interest on savings & rich’s disposable income ↓ so income inequality ↓.
But C ↑ & I ↑, AD ↑, demand-pull inflation, food prices ↑, poor’s real incomes may ↓ a lot so income inequality ↑.
Macroeconomic policies to ↓ environmental damage
Explanation Evaluation
Supply-side policies, ↓ corporation tax, firms’ profits ↑, firms ↑, I ↑, more efficient & green technology developed & firms cause less environmental damage for example, less toxic waste dumped into rivers.
But time lag, takes time to build green technology. Also, firms may use extra profits to ↑ pay for managers instead.
Contractionary fiscal policy, ↓ G, ↑ T, more leakages, ↓ AD, less cars driven so air pollution ↓ & less resources extracted from land so geosphere damage ↓.
But magnitude of ↓ in G must be large enough. Also, bad for consumers because income ↓ so consumption ↓.
Tight monetary policy, ↑ i.r., cost of borrowing ↑, ↓ C, ↓ I, ↓ AD, firms produce less & dump less toxic waste into rivers so biosphere is protected.
But time lag, ∆ i.r. takes 2 years to have an effect.
115
Taxation A direct tax is a tax levied directly on a consumer (income tax) or firm (corporation tax). An indirect tax is a tax levied on a good or service (VAT). Progressive, regressive and proportional taxes:
- A progressive tax is one in which the proportion of income paid in tax rises as income rises. - A regressive tax is one in which the proportion of income paid in tax falls as income rises. - A proportional tax is one in which the proportion of income paid in tax stays the same as
income rises. A good tax system is one that:
- Raises enough revenue to fund government spending. - Does not distort the economy by creating inefficiencies (i.e. no government failure). - Is transparent, that is, taxpayers know who has to pay what tax, how much tax must be paid
and when the tax must be paid. - Allows the taxpayer to pay the tax adequately or fairly. - Is compatible with foreign tax systems.
Reasons for taxation:
1) Government Spending. A government must raise tax revenue to fund government spending. The government could borrow funds from banks and other governments but borrowing is unsustainable in the long-run and must be repaid by taxes. 2) Market failure. A government must tax to correct market failure. For example an indirect tax must be placed on goods that create a negative externality so that the externality is internalized and the Pareto efficient allocation of resources is achieved. 3) Business Cycle. A government must increase government spending and decrease taxation in a recession. 4) Redistribute Income. A government may need to tax the rich to redistribute income to the poor if poverty and inequality is high.
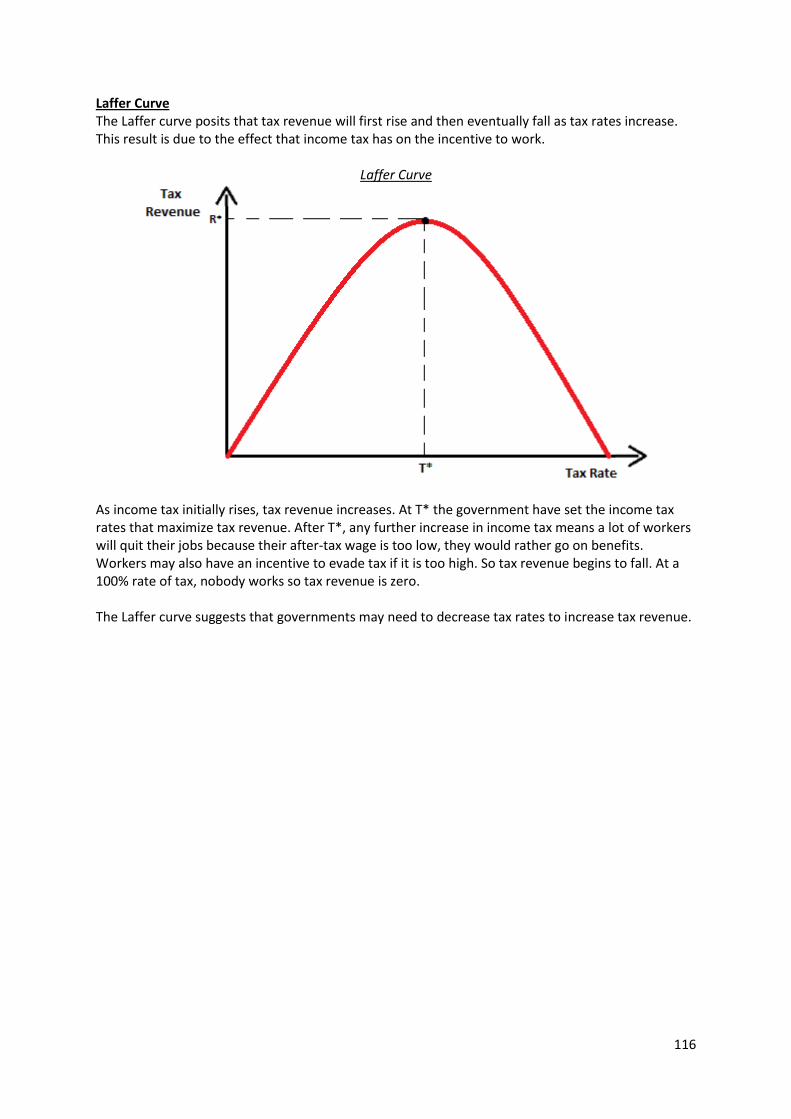
116
Laffer Curve The Laffer curve posits that tax revenue will first rise and then eventually fall as tax rates increase. This result is due to the effect that income tax has on the incentive to work.
Laffer Curve
As income tax initially rises, tax revenue increases. At T* the government have set the income tax rates that maximize tax revenue. After T*, any further increase in income tax means a lot of workers will quit their jobs because their after-tax wage is too low, they would rather go on benefits. Workers may also have an incentive to evade tax if it is too high. So tax revenue begins to fall. At a 100% rate of tax, nobody works so tax revenue is zero. The Laffer curve suggests that governments may need to decrease tax rates to increase tax revenue.
117
A Rise in Direct Tax Rates
A rise in direct tax rates (let’s say income tax rates) may have the following effects:
1) More Equal Income Distribution. An increase in income tax rates should make income tax more progressive, so the richer you get the more income tax you pay in percentage terms. Income distribution becomes more equal because the rich pay even more income tax than the poor in terms of the percentage of their income, so the Gini coefficient will fall. Also, the government could use the increased tax revenue from taxing the rich more to subsidise poor families to decrease inequality and the Gini coefficient even further. However, the rich may be incentivized to pay for accountants to find loopholes and dodge paying the higher tax rates. Furthermore, the rich may divert their savings towards foreign tax havens to avoid paying increased taxes in the UK. More tax avoidance (legal) and tax evasion (illegal) will occur. Additionally, increased taxes may decrease AD and lead to job losses for the lowest paid workers. So income distribution may not become that much more equal. 2) Higher Unemployment. An increase in income tax rates means people get less disposable income from working because their after-tax wage is lower, this disincentivizes people from working. Unemployment will rise because the unemployed have even less incentive to enter the work force and some workers quit their jobs if unemployment benefits give them more than wages. Moreover, the higher tax rates will discourage workers from working over-time or seeking promotion because their net pay is lower than before the tax hike. But, the government may also increase the tax-free allowance at the same time, this will encourage the low income workers to remain employed and may encourage the unemployed to enter the work force. Also, workers seeking promotion may continue to do so anyway because their disposable income still rises even if tax rates rise. 3) Lower Economic Growth. An increase in income tax rates may decrease economic growth. An increase in income tax means disposable income falls, consumers have less money to spend so consumption falls, AD falls and real GDP falls. Additionally, if an increase in income tax disincentivizes people from working then labour hours fall, the PPF shifts left and real GDP falls. Furthermore, firms may be discouraged from investing because consumers have less disposable income, so investment falls, AD falls and real GDP falls further. Multiplier effects mean AD and real GDP will fall even further. There is an increase in leakages and a fall in injections and the economy may fall into a recession. The extent of the fall in real GDP depends on the magnitude of the rise in income tax rates. A large rise in income tax rates will decrease disposable income, consumption, AD and real GDP significantly. Also, the more elastic are AD and LRAS, the larger the fall in real GDP. 4) More Tax Revenue. An increase in income tax rates should increase the government’s tax revenue. As income tax rises, workers pay a higher proportion of their income in tax so the government receives more tax revenue. This gives the government more funds to increase spending on health and education to increase the economy’s efficiency and shift LRAS right. Although, the Laffer curve suggests that an increase in income tax rates may decrease the government’s tax revenue. After T* on the above diagram, any further increase in income tax means a lot of workers will quit their jobs because their after-tax wage is too low, they would rather go on benefits.
118
A Rise in Indirect Tax Rates An increase in indirect tax rates (let’s say VAT) may have the following effects:
1) Lower Economic Growth. An increase in VAT discourages consumers from buying goods so consumption falls. Also, a rise in VAT means firms’ costs rise and their profits fall, so firms are discouraged from investing and investment falls. AD falls, the multiplier effect makes AD fall further, and real GDP decreases. There are more leakages from the circular flow of income so the economy contracts. Moreover, because firms’ costs rise, LRAS shifts left and real GDP decreases further. But, the extent of the shifts in AD and LRAS depends on the degree of the rise in VAT. A small rise in VAT will have only a small effect on AD, LRAS and real GDP. Furthermore, other factors like export-led growth may cause AD and real GDP to increase even if VAT rises. Additionally, the government may have to increase VAT if the economy grows too fast. 2) Tax Revenue. An increase in VAT may increase tax revenue for the government. Consumers will be paying more in VAT every time they buy a good so more tax revenue should be collected. The government will then have more revenue to spend on health, education and the infrastructure to develop the economy. However, a rise in VAT will only increase tax revenue if demand for goods and services is price inelastic. An increase in VAT when demand is elastic means consumers pay more VAT for each good but quantity demanded falls so far that the total amount of revenue collected from VAT falls. 3) Inflation. An increase in VAT means firms’ costs rise so they must increase their prices and consequently inflation increases. Additionally, if prices rise then real wages fall, workers and trade unions will demand increased money wages to bring real wages back up to their level before prices rose. Increased money wages means firms’ costs rise so firms increase prices further, workers again demand increased money wages and the wage-price spiral escalates. At the extreme this could cause hyperinflation. But, the possibility of a wage-price spiral depends on the strength of trade unions, if trade unions are weak then money wages may not rise much. Also, if workers suffer from money illusion then they do not consider their real wage and thus do not demand increased money wages. 4) Inequality. An increase in VAT may increase inequality because VAT is effectively regressive, that is, the poor pay a higher proportion of their income in VAT than the rich do. This is because poor people are more likely to spend most of their income and save only a small amount compared to rich people who are likely to save a larger proportion of their income. However, the extent of the rise in inequality depends on what goods are hit by the increase in VAT. If alcohol, gambling, petrol and tobacco do not suffer a rise in VAT then the poor may not be affected much. Maybe the rise in VAT is on goods that are bought mainly by rich people, making the rise in VAT progressive.
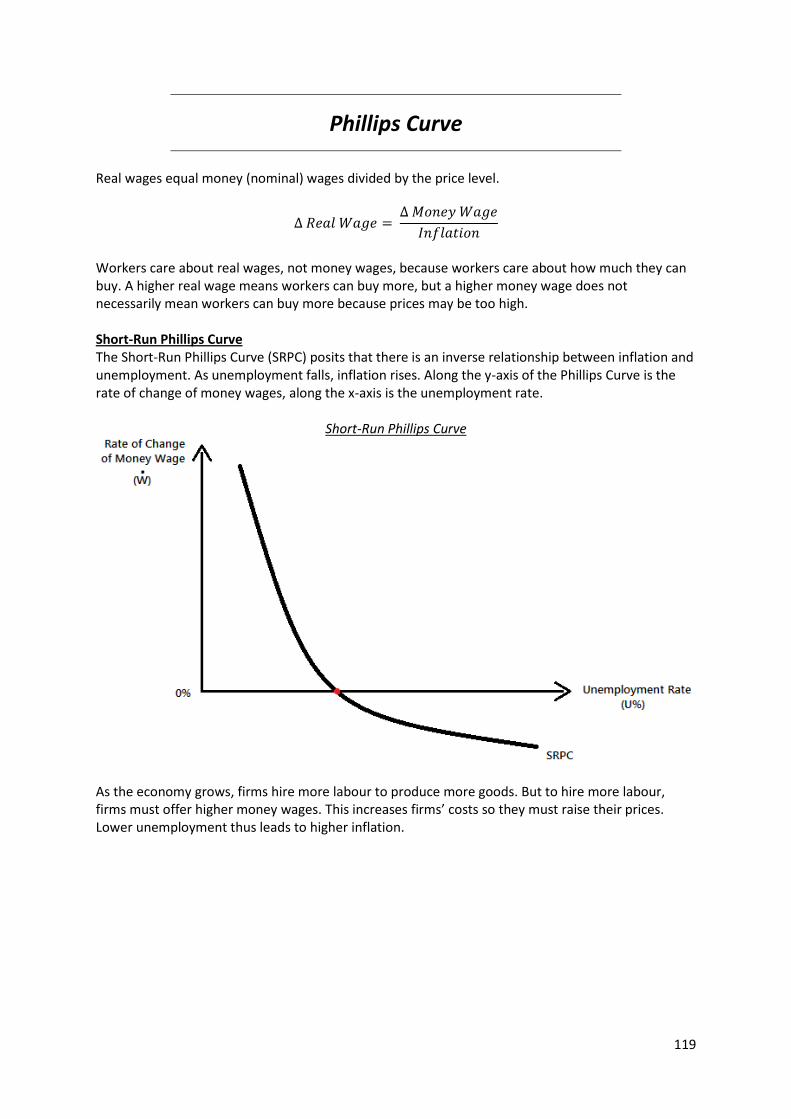
119
Phillips Curve Real wages equal money (nominal) wages divided by the price level.
Workers care about real wages, not money wages, because workers care about how much they can buy. A higher real wage means workers can buy more, but a higher money wage does not necessarily mean workers can buy more because prices may be too high. Short-Run Phillips Curve The Short-Run Phillips Curve (SRPC) posits that there is an inverse relationship between inflation and unemployment. As unemployment falls, inflation rises. Along the y-axis of the Phillips Curve is the rate of change of money wages, along the x-axis is the unemployment rate.
Short-Run Phillips Curve
As the economy grows, firms hire more labour to produce more goods. But to hire more labour, firms must offer higher money wages. This increases firms’ costs so they must raise their prices. Lower unemployment thus leads to higher inflation.
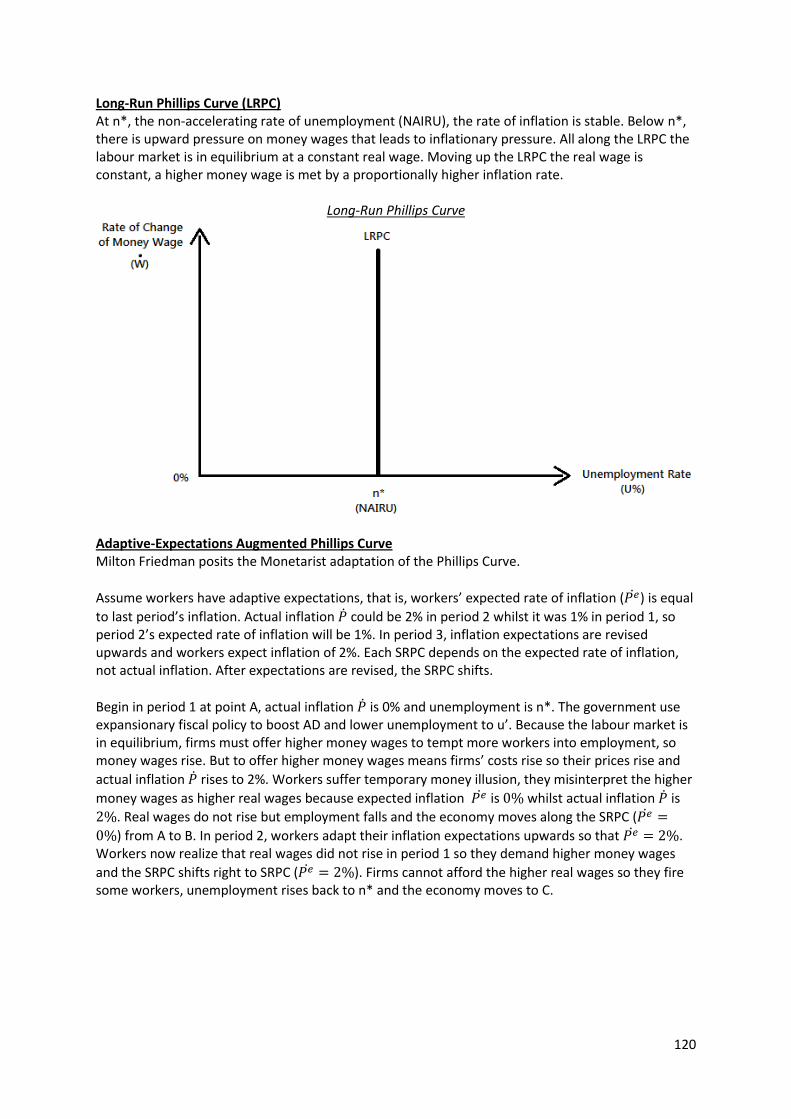
120
Long-Run Phillips Curve (LRPC) At n*, the non-accelerating rate of unemployment (NAIRU), the rate of inflation is stable. Below n*, there is upward pressure on money wages that leads to inflationary pressure. All along the LRPC the labour market is in equilibrium at a constant real wage. Moving up the LRPC the real wage is constant, a higher money wage is met by a proportionally higher inflation rate.
Long-Run Phillips Curve
Adaptive-Expectations Augmented Phillips Curve Milton Friedman posits the Monetarist adaptation of the Phillips Curve.
Assume workers have adaptive expectations, that is, workers’ expected rate of inflation ( ̇) is equal
to last period’s inflation. Actual inflation ̇ could be 2% in period 2 whilst it was 1% in period 1, so period 2’s expected rate of inflation will be 1%. In period 3, inflation expectations are revised upwards and workers expect inflation of 2%. Each SRPC depends on the expected rate of inflation, not actual inflation. After expectations are revised, the SRPC shifts.
Begin in period 1 at point A, actual inflation ̇ is 0% and unemployment is n*. The government use expansionary fiscal policy to boost AD and lower unemployment to u’. Because the labour market is in equilibrium, firms must offer higher money wages to tempt more workers into employment, so money wages rise. But to offer higher money wages means firms’ costs rise so their prices rise and
actual inflation ̇ rises to 2%. Workers suffer temporary money illusion, they misinterpret the higher
money wages as higher real wages because expected inflation ̇ is whilst actual inflation ̇ is
. Real wages do not rise but employment falls and the economy moves along the SRPC ( ̇
) from A to B. In period 2, workers adapt their inflation expectations upwards so that ̇ . Workers now realize that real wages did not rise in period 1 so they demand higher money wages
and the SRPC shifts right to SRPC ( ̇ ). Firms cannot afford the higher real wages so they fire some workers, unemployment rises back to n* and the economy moves to C.
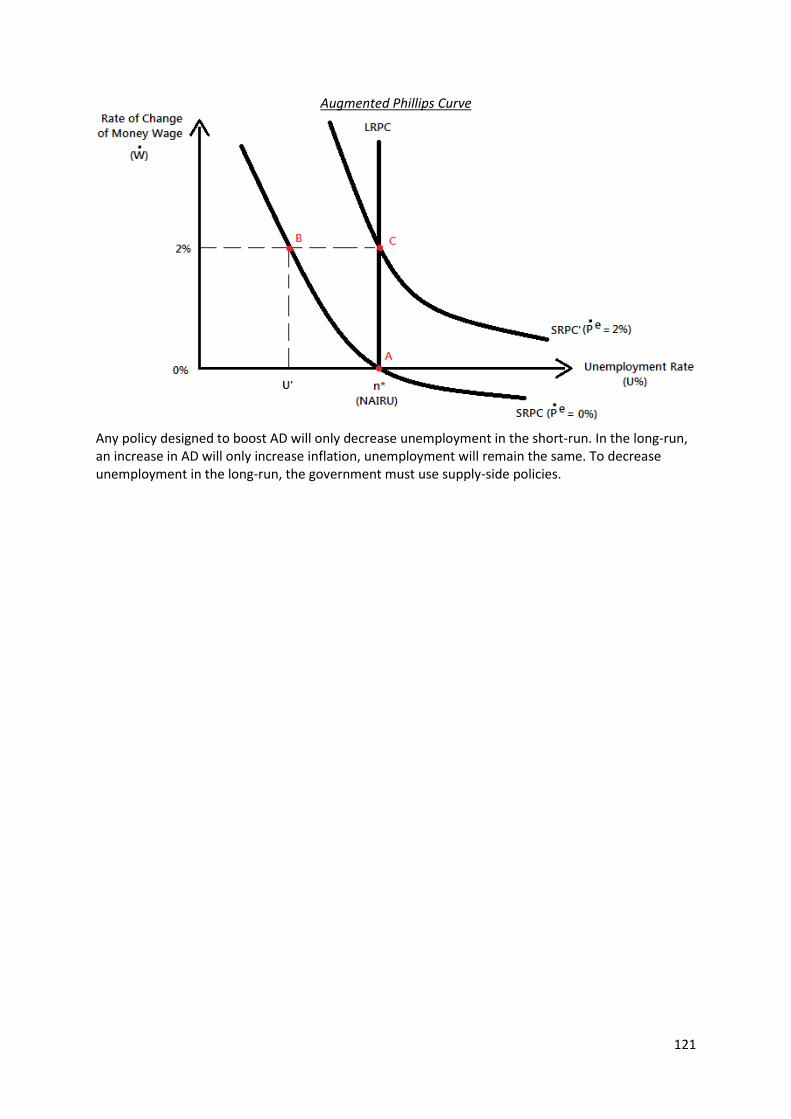
121
Augmented Phillips Curve
Any policy designed to boost AD will only decrease unemployment in the short-run. In the long-run, an increase in AD will only increase inflation, unemployment will remain the same. To decrease unemployment in the long-run, the government must use supply-side policies.
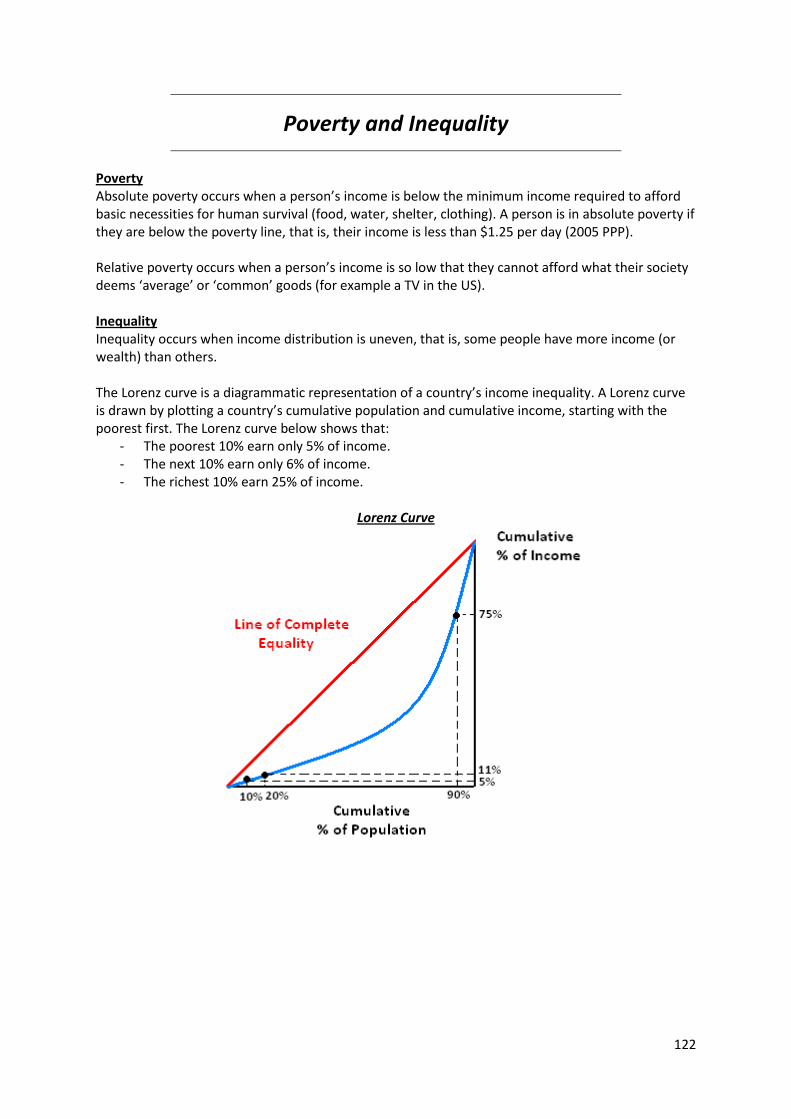
122
Poverty and Inequality
Poverty Absolute poverty occurs when a person’s income is below the minimum income required to afford basic necessities for human survival (food, water, shelter, clothing). A person is in absolute poverty if they are below the poverty line, that is, their income is less than $1.25 per day (2005 PPP). Relative poverty occurs when a person’s income is so low that they cannot afford what their society deems ‘average’ or ‘common’ goods (for example a TV in the US). Inequality Inequality occurs when income distribution is uneven, that is, some people have more income (or wealth) than others. The Lorenz curve is a diagrammatic representation of a country’s income inequality. A Lorenz curve is drawn by plotting a country’s cumulative population and cumulative income, starting with the poorest first. The Lorenz curve below shows that:
- The poorest 10% earn only 5% of income. - The next 10% earn only 6% of income. - The richest 10% earn 25% of income.
Lorenz Curve
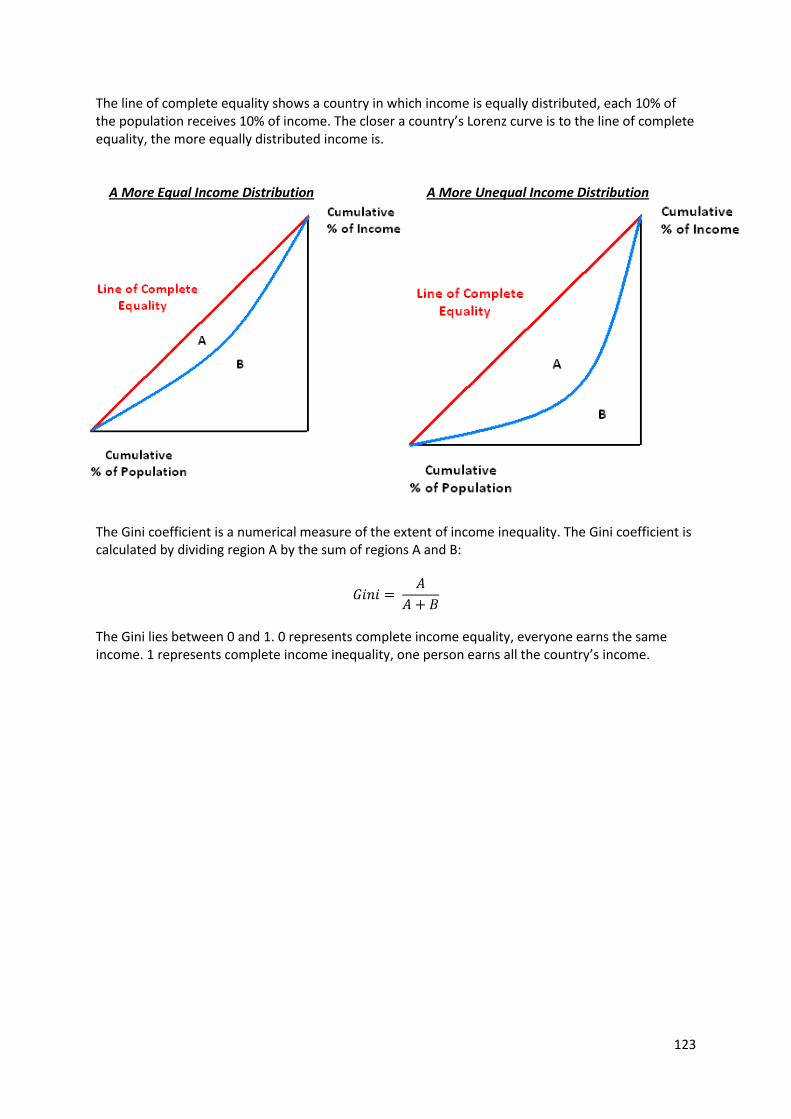
123
The line of complete equality shows a country in which income is equally distributed, each 10% of the population receives 10% of income. The closer a country’s Lorenz curve is to the line of complete equality, the more equally distributed income is. A More Equal Income Distribution A More Unequal Income Distribution The Gini coefficient is a numerical measure of the extent of income inequality. The Gini coefficient is calculated by dividing region A by the sum of regions A and B:
The Gini lies between 0 and 1. 0 represents complete income equality, everyone earns the same income. 1 represents complete income inequality, one person earns all the country’s income.
124
Causes of Poverty and Inequality Many factors could cause poverty and inequality including:
Causes of Poverty
Causes of Inequality
Unemployment An unemployed person earns no wage, they may not be able to buy necessities (water, food and clothing) and fall into absolute poverty. An unemployed person could receive benefits to take them out of absolute poverty but their income may still be inadequate to afford a TV or radio so they fall into relative poverty. But, people may be voluntarily unemployed, they may be rich enough to afford luxuries so they are not in poverty. Also, an unemployed person may have savings or other sources of income. For example, they may have an asset earning them an income (a house earning rent).
Unemployment Anyone who is unemployed earns no wage, people who are employed earn a wage, so the employed get richer while the unemployed do not, income inequality increases and the Gini rises. Although, the tax system should make income distribution more even. If the tax system is progressive then the rich get taxed a higher proportion of their income than the poor do, so the distribution of income becomes more even and the Gini falls.
Education A poor education means a person has low human capital, their skills and marginal productivity of labour are low so they are likely to get low paid jobs and fall into absolute poverty. In the UK, someone with a university degree earns on average £100k more in their lifetime than someone without. However, the type and quality of education will affect how much someone earns. A Palaeontology degree at university may not earn an individual that much money once in a job digging up dinosaur bones.
Education Rich people can afford a better education and private tutors, develop better human capital, better skills and receive a higher paid job. Poor people cannot afford as good an education and remain on low paid jobs. So the rich get richer faster than the poor get richer, income inequality increases and the Gini rises. Although, a person who is motivated to work and study should achieve high grades no matter what school they go to.
Assets/Inheritance/Wealth A person born into a poor family will not inherit any assets or wealth (houses, stocks, shares or businesses). Wealth generates an income, so little wealth means little income and the possibility of falling into absolute or relative poverty. In the UK in 1999, 93% of all wealth was held by the wealthiest 50% of the population. By 2002, the richest 2.4m households owned £1,300bn worth of assets while the poorest 12m households owned just £150m worth of assets. But, wealth is not the only determinant of income. A person with no wealth could become rich by taking a risk on the stock market, setting up a business or getting an education and obtaining a high paid job.
Assets/Inheritance/Wealth Rich families remain rich because they pass their wealth down to their kids. Poor families remain poor because they have no wealth to pass on. So rich families get richer faster than poor families get richer, income inequality increases and the Gini rises. Between 1988-2000 in the UK, the wealthiest 1% have increased their share of the UK’s wealth from 17% to 23% and the Gini increased from 65 to 69. But, inheritance tax may mean that less wealth is passed on to kids, so the income gap between the rich and poor may not widen that much.
125
Health AIDS or other health problems mean workers are less productive and they cannot work as hard or as long. They may also need to take many days off work. So the worker receives less income and may fall into absolute or relative poverty. However, an ill person could go to hospital and get treatment, cure their illness and return to work.
Health A rich person can afford private healthcare and get over their illness quicker than a poor person who must go to the NHS (or skip healthcare altogether). Rich people can continue to earn high incomes whilst poor people continue to earn low incomes, so income inequality rises and the Gini increases. But, the government could increase spending on the NHS and make it more efficient, this will allow poor people to recover and return to work quicker.
Access to Credit/Capital Markets Most poor people have no access to credit as they have no collateral. A bank will not lend to a poor person with no wealth as they are too risky. Also, in LDCs especially, there may be asymmetric information as banks may not know rural farmers’ credit worthiness so banks do not lend to them. This means the poor may not have access to credit to develop a business or their human capital so they remain on low incomes and are stuck in poverty. But, the development of microfinance means it is now easier for the poor to obtain small loans and help themselves out of poverty.
Access to Credit/Capital Markets Rich people have more assets and thus more collateral than poor people, so it is easier for the rich to obtain bank loans because the rich are less risky. This means the rich can take out large loans and help develop their businesses and human capital whilst the poor cannot, so income inequality rises and the Gini rises. However, the development of microfinance means it is now easier for the poor to obtain small loans and close the income gap.
Effects of Poverty and Inequality The effects of poverty and inequality include:
1) Lost Output. A person in poverty cannot work as hard as other people, some of the economy’s labour is not being used efficiently (or not being used at all if those in poverty are unemployed) so the economy is inside its PPF, there is lost output and a welfare loss. 2) Crime. A person in poverty cannot afford to buy many goods or services so they may turn to illegal activities and crime to get what they want. 3) Poor Health. A poor person may not be able to afford healthcare and consequently become ill. Also, a poor person may have to buy poor quality food, limit their calorie intake and suffer from poor nutrition.
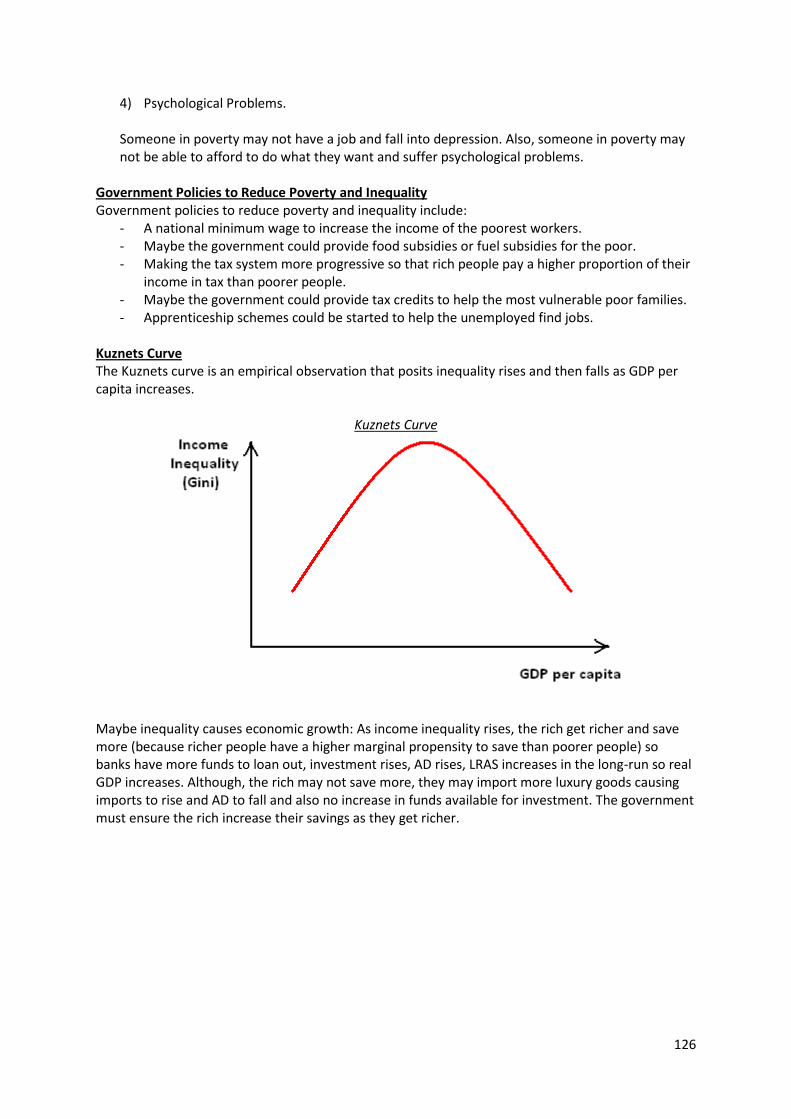
126
4) Psychological Problems. Someone in poverty may not have a job and fall into depression. Also, someone in poverty may not be able to afford to do what they want and suffer psychological problems.
Government Policies to Reduce Poverty and Inequality Government policies to reduce poverty and inequality include:
- A national minimum wage to increase the income of the poorest workers. - Maybe the government could provide food subsidies or fuel subsidies for the poor. - Making the tax system more progressive so that rich people pay a higher proportion of their
income in tax than poorer people. - Maybe the government could provide tax credits to help the most vulnerable poor families. - Apprenticeship schemes could be started to help the unemployed find jobs.
Kuznets Curve The Kuznets curve is an empirical observation that posits inequality rises and then falls as GDP per capita increases.
Kuznets Curve
Maybe inequality causes economic growth: As income inequality rises, the rich get richer and save more (because richer people have a higher marginal propensity to save than poorer people) so banks have more funds to loan out, investment rises, AD rises, LRAS increases in the long-run so real GDP increases. Although, the rich may not save more, they may import more luxury goods causing imports to rise and AD to fall and also no increase in funds available for investment. The government must ensure the rich increase their savings as they get richer.
127
International Economics
Foreign Trade Below are the benefits and costs of foreign trade.
Benefits of Foreign Trade
Costs of Foreign Trade
Comparative advantage. An economy has a comparative advantage in good X if it can produce X at a lower opportunity cost than any other country. As long as economies specialize in their comparative advantage, world output rises and, after international trade, all economies consume more than under autarky. Adam Smith posits that all economies will benefit from foreign trade so long as economies have a different comparative advantage.
Declining terms of trade. An economy could suffer declining terms of trade (export prices divided by import prices) if it specializes in primary products. Over time this means its export prices fall and its import prices rise. So the value of its exports will fall, the value of its imports will rise and its current account moves towards a deficit.
Export-led growth. More trade means exports can increase, the current account moves towards a surplus, AD rises and real GDP rises.
Lower economic growth. An economy could import too many consumer goods, the current account moves towards a deficit, AD falls and real GDP falls.
More foreign currency. Foreign trade allows an economy to earn more foreign currency reserves and use these to repay international debt or import vital capital goods that it may not be able to make domestically.
Demand-pull inflation. More exports means the current account moves towards a surplus, AD rises and demand-pull inflation rises.
Booms spreading. Booms could spread. Let’s say countries A and B trade. A boom in A means A’s income rises and demand for imports rise so B’s exports rise, B’s income rises and B’s real GDP rises.
Recessions spreading. Recessions could spread. Let’s say countries A and B trade. A recession in A means A’s income falls and demand for imports fall so B’s exports fall, B’s income falls and B’s real GDP falls.
Economies of scale. More trade means a larger market, more output can be produced so a country can exploit economies of scale.
Dependency. An economy could become dependent on exports and/or imports. Economy A’s GDP could be largely made up of a particular exported good. A shock fall in world demand for that good means A’s exports fall dramatically, the current account moves towards a deficit, AD falls and real GDP falls. Economy B could be reliant on cheap imports of a particular good. A shock rise in the world price for that good means B’s imports become more expensive, the current account moves towards a deficit, AD falls and real GDP falls.
Innovation. More trade means more competition so domestic firms must innovate to put new and better goods on the market and reduce costs to gain a competitive advantage.
Environmental damage. More trade means more transportation, more aeroplane and shipping usage, more pollution and increased environmental damage.
128
Higher consumer welfare. Consumer welfare increases because consumers have access to, and the choice of, goods all over the planet. Consumer surplus also rises because consumers buy goods from the cheapest countries.
Lower consumer welfare. A global monopoly or cartel could form and restrict output to raise prices. Consumer surplus falls because prices are higher.
World Trade Organization The World Trade Organization (WTO) promotes free trade between all of its member countries. The WTO provides a forum for free trade negotiations by conducting rounds, a series of negotiations designed to lead to major free trade agreements. The WTO also settles trade disputes between member countries and sets trade rules. The WTO has two principles behind its agreements. The first is the ‘most favoured nation principle’, any WTO member who reduces a tariff on another member’s goods must reduce the tariff for all other members. The second is ‘national treatment’, member countries must treat their own goods and imports from other member countries the same, they cannot discriminate. Let’s say the US and Germany are two member countries of the WTO and Germany puts up a tariff on cars imported from the US. The US can appeal to the WTO who should then either make Germany remove the tariff or let the US put up a tariff against cars imported from Germany to cause an equal amount of damage as the original German tariff. The WTO’s powers, however, are fairly weak. The WTO can only influence the trade actions of member countries. Also, fines may be more effective but the WTO are not allowed to fine members. Moreover, the WTO may favour rich countries over LDCs. Rich countries may be treated differently than LDCs, for example, many rich countries have tariffs against imports from LDCs. Trading Blocs A trading bloc is a group of countries that allow free trade within their bloc but may impose tariffs on countries outside the bloc. There are three types of trading blocs:
1) Free Trade Area. A free trade area is one in which all trade barriers are removed between member countries. Each member can impose its own restrictions on goods from outside the free trade area. A free trade area exists between the US, Canada and Mexico, this is called the North Atlantic Free Trade Agreement (NAFTA). Another free trade area exists between Brunei, Cambodia, Indonesia, Lao PDR, Malaysia, Myanmar, Philippines, Singapore, Thailand and Vietnam, this is called the Association of South East Asian Nations (ASEAN). 2) Customs Union. A customs union is where there is free trade within the trading bloc and a common external tariff on goods coming from outside the bloc.
129
3) Monetary Union. A monetary union is a customs union with a common currency between members. A central bank must control the single currency, monetary and exchange rate policy for all members. An example is the European Monetary Union (EMU).
Conflict Between the WTO and Trading Blocs The WTO promotes free trade and will be happy with the free trade that exists within a trading bloc because this leads to trade creation, that is, the production of goods moves from high cost countries to low cost countries. But, the WTO will be unhappy with the tariffs and quotas that trading blocs impose on countries outside the bloc because this leads to trade diversion, that is, the production of goods moves from low cost countries outside the bloc to high cost countries within the bloc.
130
Protectionism Free trade refers to international trade conducted without any restrictions on trade (i.e. no tariffs or quotas). Protectionism refers to a country imposing trade barriers to restrict imports. Reasons for Protectionism:
1) Infant Industry. An infant industry is new, it needs time to grow and become efficient to be able to compete internationally. So the infant industry must initially be protected from foreign competition. After the infant industry has grown, created a brand and benefited from economies of scale, protectionism can be dropped because the industry can compete internationally. An infant industry such as shipbuilding must initially be protected until it becomes efficient.
2) Key Industries/National Security. A certain industry like agriculture may be protected for self-sufficiency. Also, a country may protect industries key to its national defence (military equipment and energy) because it does not want to become dependent on, and vulnerable to, other countries. 3) Domestic Employment. An economy could use protectionism to stop its consumers importing certain goods and instead buy them from domestic firms, increasing domestic employment. 4) Dumping. Dumping occurs when country A sells its goods in country B below the cost of production. Cheap imports flood B’s economy and B’s firms go bust because they cannot compete against this unfair competition. A country may be dumping to destroy foreign competition or simply because it subsidized its exports and produced too much and wishes to release its excess of goods. 5) Cheap Labour. Country A’s rivals may have lower wages and thus can produce cheaper and outcompete A’s domestic firms. A could use protectionism to increase its import prices so that its domestic firms can compete on a level playing field.
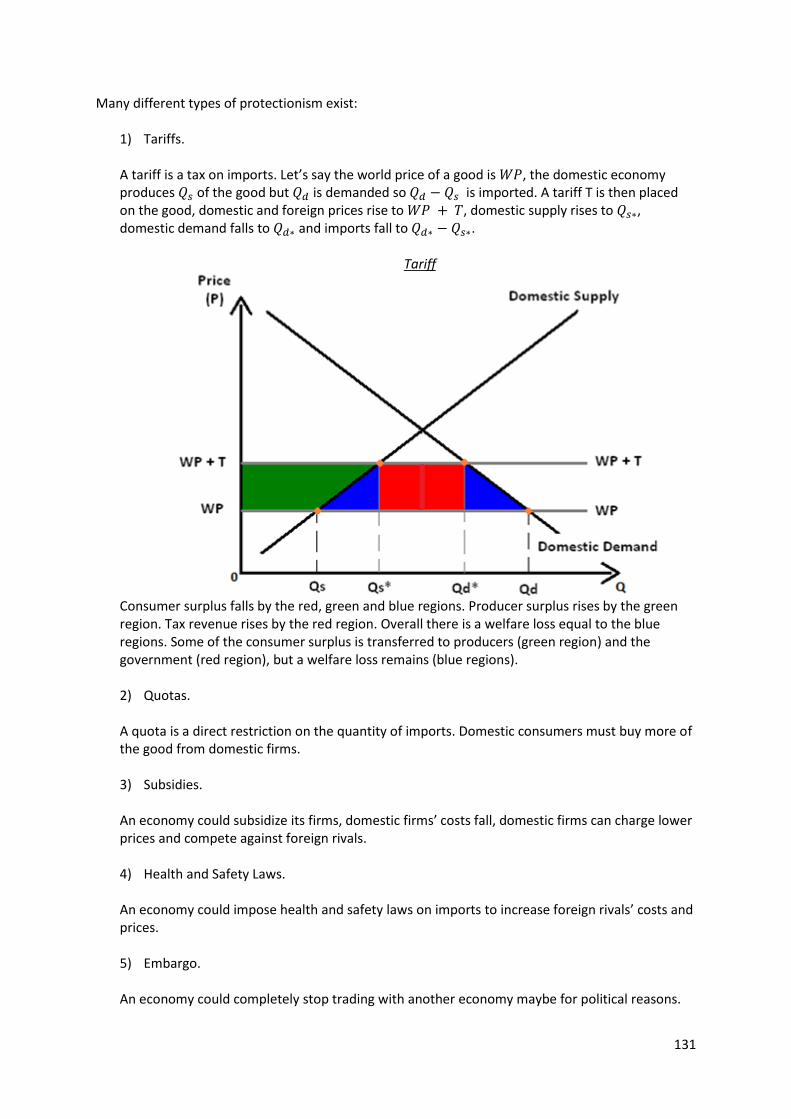
131
Many different types of protectionism exist:
1) Tariffs. A tariff is a tax on imports. Let’s say the world price of a good is , the domestic economy produces of the good but is demanded so is imported. A tariff T is then placed on the good, domestic and foreign prices rise to , domestic supply rises to , domestic demand falls to and imports fall to .
Tariff
Consumer surplus falls by the red, green and blue regions. Producer surplus rises by the green region. Tax revenue rises by the red region. Overall there is a welfare loss equal to the blue regions. Some of the consumer surplus is transferred to producers (green region) and the government (red region), but a welfare loss remains (blue regions). 2) Quotas. A quota is a direct restriction on the quantity of imports. Domestic consumers must buy more of the good from domestic firms.
3) Subsidies. An economy could subsidize its firms, domestic firms’ costs fall, domestic firms can charge lower prices and compete against foreign rivals.
4) Health and Safety Laws. An economy could impose health and safety laws on imports to increase foreign rivals’ costs and prices.
5) Embargo. An economy could completely stop trading with another economy maybe for political reasons.
132
Effects of Protectionism on Resource Allocation Protectionism has many negative consequences for resource allocation:
- Resources are allocated inefficiently, there is a welfare loss because resources do not match each country’s comparative advantage, so world output falls.
- Protectionism means higher prices for domestic consumers so consumer surplus falls and living standards fall.
- If a country protects one of its industries from foreign competition, that industry faces less competition and may become X-inefficient and waste resources.
- Trade wars could occur. If country A places tariffs on its imports then other countries could retaliate and do the same. A then retaliates by increasing its tariff and the war escalates.
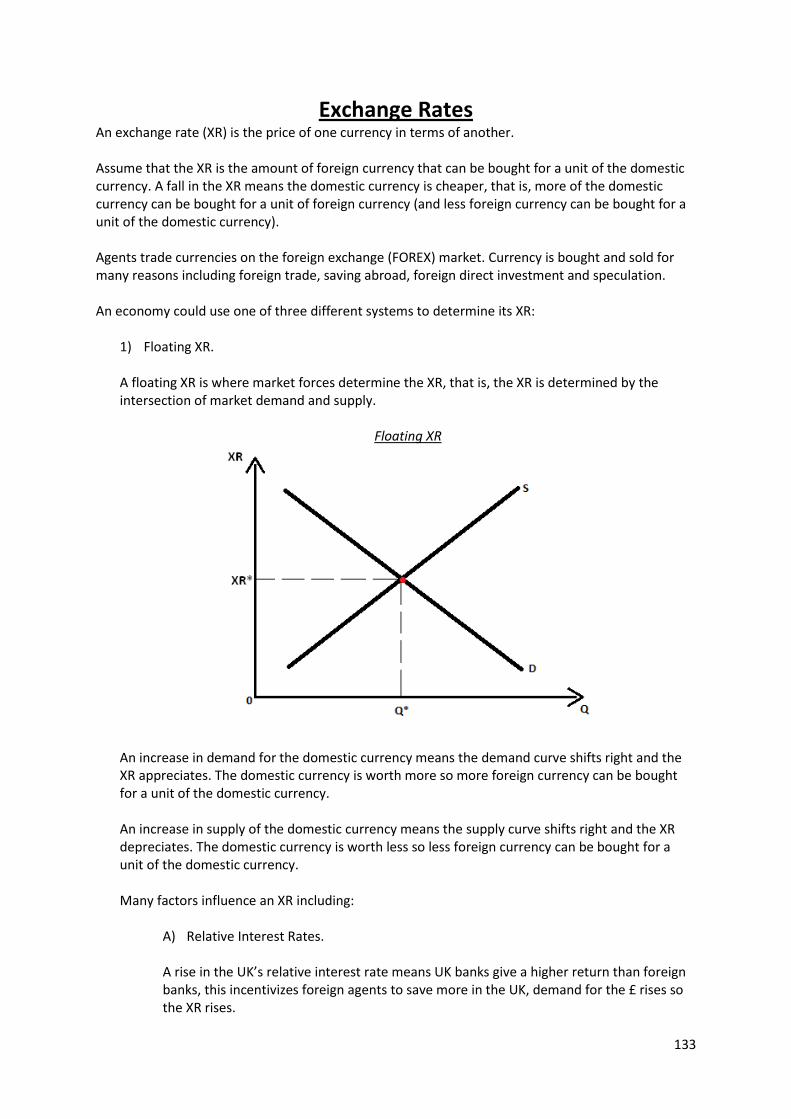
133
Exchange Rates An exchange rate (XR) is the price of one currency in terms of another. Assume that the XR is the amount of foreign currency that can be bought for a unit of the domestic currency. A fall in the XR means the domestic currency is cheaper, that is, more of the domestic currency can be bought for a unit of foreign currency (and less foreign currency can be bought for a unit of the domestic currency). Agents trade currencies on the foreign exchange (FOREX) market. Currency is bought and sold for many reasons including foreign trade, saving abroad, foreign direct investment and speculation. An economy could use one of three different systems to determine its XR:
1) Floating XR. A floating XR is where market forces determine the XR, that is, the XR is determined by the intersection of market demand and supply.
Floating XR
An increase in demand for the domestic currency means the demand curve shifts right and the XR appreciates. The domestic currency is worth more so more foreign currency can be bought for a unit of the domestic currency. An increase in supply of the domestic currency means the supply curve shifts right and the XR depreciates. The domestic currency is worth less so less foreign currency can be bought for a unit of the domestic currency. Many factors influence an XR including:
A) Relative Interest Rates. A rise in the UK’s relative interest rate means UK banks give a higher return than foreign banks, this incentivizes foreign agents to save more in the UK, demand for the £ rises so the XR rises.
134
B) Relative Inflation Rates. Purchasing power parity (PPP) means the market XR between two countries equals the ratio of the two country’s prices for the same bundle of goods. Market XRs are influenced by the purchasing power of currencies. If the UK’s inflation is higher than Spain’s, UK rise faster than Spain’s, the same bundle of goods in the UK now costs more than in Spain, UK consumers buy more euros to buy the bundle of goods from Spain, supply of the £ rises and demand for the euro rises until PPP is restored. C) Boom. A boom in the UK means that UK consumers’ income rises and they buy more domestic and foreign goods and services, so imports rise and supply of the £ rises so the XR falls. A boom in foreign countries means foreign incomes rise, foreign agents buy more UK exports, demand for the £ rises and the XR rises. D) Multinational Companies and Foreign Direct Investment. Multinational Companies may want to set up production in the UK if the UK economy is booming, so they must buy the £, demand for the £ rises and the XR rises. E) Speculation. A major determinant of short-term XRs is speculation. Agents may trade currencies to make a profit by buying low and selling high. If agents expect a currency to rise they will buy that currency while the price is low and sell it after its value has risen to make a profit. Speculation that the £ will appreciate means speculators buy the £, there is an inflow of ‘hot money’ into the UK and the XR rises.
A floating XR is determined by market forces, but market forces can be unstable. An economy’s XR could become unstable if demand and supply for its currency keeps changing. Instability creates uncertainty, and uncertainty means agents cannot plan so they cannot invest. 2) Fixed XR. A fixed XR is where the central bank buys and sells the domestic currency to keep the XR at a chosen fixed level. A central bank can revalue the XR by using its foreign currency reserves to buy up more of the domestic currency so that the value of the domestic currency rises. A central bank can devalue the XR by using domestic currency to buy foreign currency so that the value of the domestic currency falls. A fixed XR creates stability, stability makes the future more certain so it is easier to plan and invest. A central bank could devalue its domestic currency to make the domestic currency more internationally price competitive so that the current account moves towards a surplus. However, if country A uses a fixed XR to gain international price competitiveness other countries could do the same in retaliation so that there is no change in global XRs. Moreover, a central bank cannot keep buying domestic currency with its foreign exchange reserves because eventually those reserves will deplete.
135
3) Managed XR. A managed XR is where the central bank set a target for the XR and allows the XR to float around that target, the central bank will buy/sell the domestic currency to make sure the XR stays close enough to its target. A managed XR means the domestic currency’s value maintains a degree of stability because the central bank will not let it rise too far above or fall too far below the band it sets. The XR can fluctuate but the target provides some stability, making it easier to plan and invest in the domestic economy.
Effects of An XR Change A fall in the XR causes:
1) Current Account Surplus. If the £ is weaker, UK exports are cheaper so exports rise, imports are dearer so imports fall and the current account moves towards a surplus. 2) Economic Growth. If the £ is weaker, UK exports are cheaper so exports rise, imports are dearer so imports fall, the current account moves towards a surplus, AD rises and shifts right so real GDP increases. 3) Inflation. If the £ is weaker, UK exports are cheaper so exports rise, imports are dearer so imports fall, the current account moves towards a surplus, AD rises and shifts right so there is demand-pull inflation. Also, because imports are dearer, UK firms’ imported raw materials are dearer, UK firms’ costs rise and there is cost-push inflation. 4) More Employment. If the £ is weaker, UK exports are cheaper, demand for UK exports rise, UK firms must produce more to export so they must hire more workers and unemployment falls. Additionally, imports are dearer so UK consumers switch to buying more UK goods because they are relatively cheaper, UK firms must produce more so they must hire more workers and unemployment falls.
136
International Competitiveness International competitiveness is the ability of a country to compete with rival countries in terms of prices and/or quality. A rise in the UK’s international price competitiveness means UK goods are cheaper, UK consumers buy more UK goods so imports fall and foreign consumers buy more UK goods so UK exports rise. Measures of International Competitiveness The international competitiveness of an economy can be measured by:
1) Relative Unit Labour Costs. Unit labour cost is the cost per unit of labour, that is, total wages divided by total output. Unit labour costs move inversely with labour productivity, so as labour productivity rises unit labour costs fall. A decrease in relative unit labour costs for the UK means it becomes cheaper for UK firms to produce compared to rival countries, so the UK becomes more internationally price competitive. 2) Relative Export Prices. Relative export prices are the export prices of one country compared to the export prices of rival countries (maybe their main trading partners). An increase in relative export prices for the UK means UK exports become more expensive compared to rival countries, so the UK becomes less internationally price competitive. 3) Infrastructure. A country’s infrastructure includes its roads, utilities and telecommunications. As the UK’s infrastructure improves relative to other countries, the UK’s transport and communication costs fall so the UK becomes more internationally price competitive.
Factors Effecting International Competitiveness Many factors effect international competitiveness including:
1) Real Exchange Rate. A country’s real exchange rate is its nominal exchange rate times its price level and divided by the foreign price level:
The UK becomes more internationally price competitive if its real XR falls. The UK’s real XR will fall if the UK’s nominal XR falls, domestic prices fall and/or foreign prices rise, ceteris paribus. If the UK’s real XR depreciates then imports become more expensive so UK consumers buy more goods from UK firms and imports fall, exports become cheaper so foreign consumers buy more UK goods and the UK’s exports rise. 2) Wage and Non-Wage Costs. Wages costs are what firms pay directly to workers in return for work. Non-wage costs include taxes, National Insurance (NI) contributions and pensions. A fall in the UK’s wage or non-wage
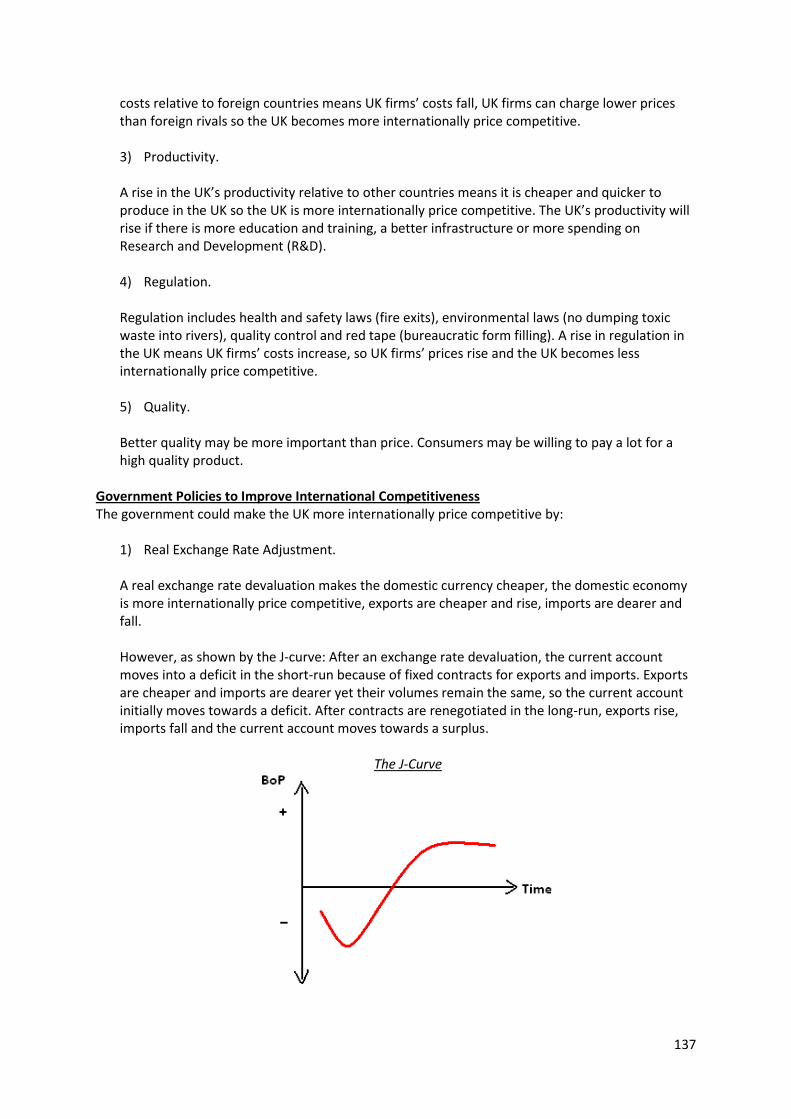
137
costs relative to foreign countries means UK firms’ costs fall, UK firms can charge lower prices than foreign rivals so the UK becomes more internationally price competitive. 3) Productivity. A rise in the UK’s productivity relative to other countries means it is cheaper and quicker to produce in the UK so the UK is more internationally price competitive. The UK’s productivity will rise if there is more education and training, a better infrastructure or more spending on Research and Development (R&D). 4) Regulation. Regulation includes health and safety laws (fire exits), environmental laws (no dumping toxic waste into rivers), quality control and red tape (bureaucratic form filling). A rise in regulation in the UK means UK firms’ costs increase, so UK firms’ prices rise and the UK becomes less internationally price competitive. 5) Quality. Better quality may be more important than price. Consumers may be willing to pay a lot for a high quality product.
Government Policies to Improve International Competitiveness The government could make the UK more internationally price competitive by:
1) Real Exchange Rate Adjustment. A real exchange rate devaluation makes the domestic currency cheaper, the domestic economy is more internationally price competitive, exports are cheaper and rise, imports are dearer and fall. However, as shown by the J-curve: After an exchange rate devaluation, the current account moves into a deficit in the short-run because of fixed contracts for exports and imports. Exports are cheaper and imports are dearer yet their volumes remain the same, so the current account initially moves towards a deficit. After contracts are renegotiated in the long-run, exports rise, imports fall and the current account moves towards a surplus.
The J-Curve

138
2) Supply-Side Policies. Supply-side polices could be used to increase LRAS and increase the efficiency of the domestic economy so that its firms can charge lower prices and compete internationally. But this costs money and a large investment so in the short-run AD will rise, inflation will rise, the domestic economy loses international price competitiveness, exports become dearer and fall, imports become cheaper and rise. Moreover, supply-side policies only come into effect in the long-run.
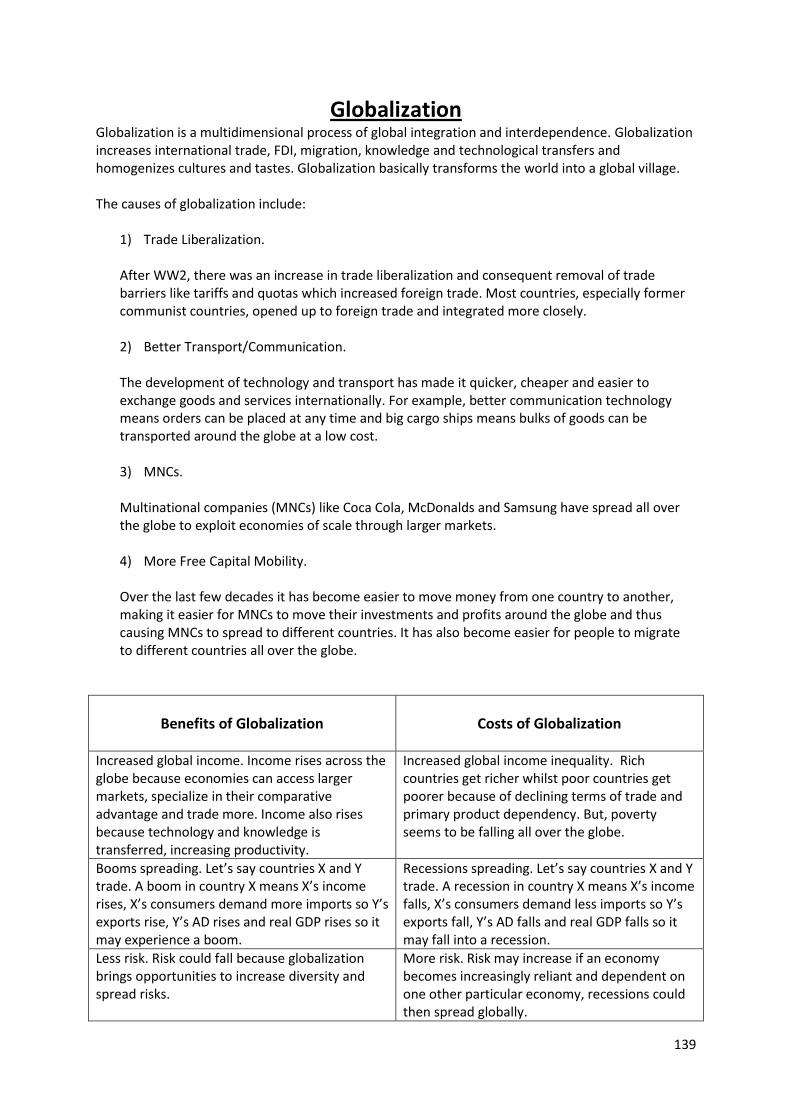
139
Globalization Globalization is a multidimensional process of global integration and interdependence. Globalization increases international trade, FDI, migration, knowledge and technological transfers and homogenizes cultures and tastes. Globalization basically transforms the world into a global village. The causes of globalization include:
1) Trade Liberalization. After WW2, there was an increase in trade liberalization and consequent removal of trade barriers like tariffs and quotas which increased foreign trade. Most countries, especially former communist countries, opened up to foreign trade and integrated more closely. 2) Better Transport/Communication. The development of technology and transport has made it quicker, cheaper and easier to exchange goods and services internationally. For example, better communication technology means orders can be placed at any time and big cargo ships means bulks of goods can be transported around the globe at a low cost. 3) MNCs. Multinational companies (MNCs) like Coca Cola, McDonalds and Samsung have spread all over the globe to exploit economies of scale through larger markets. 4) More Free Capital Mobility. Over the last few decades it has become easier to move money from one country to another, making it easier for MNCs to move their investments and profits around the globe and thus causing MNCs to spread to different countries. It has also become easier for people to migrate to different countries all over the globe.
Benefits of Globalization
Costs of Globalization
Increased global income. Income rises across the globe because economies can access larger markets, specialize in their comparative advantage and trade more. Income also rises because technology and knowledge is transferred, increasing productivity.
Increased global income inequality. Rich countries get richer whilst poor countries get poorer because of declining terms of trade and primary product dependency. But, poverty seems to be falling all over the globe.
Booms spreading. Let’s say countries X and Y trade. A boom in country X means X’s income rises, X’s consumers demand more imports so Y’s exports rise, Y’s AD rises and real GDP rises so it may experience a boom.
Recessions spreading. Let’s say countries X and Y trade. A recession in country X means X’s income falls, X’s consumers demand less imports so Y’s exports fall, Y’s AD falls and real GDP falls so it may fall into a recession.
Less risk. Risk could fall because globalization brings opportunities to increase diversity and spread risks.
More risk. Risk may increase if an economy becomes increasingly reliant and dependent on one other particular economy, recessions could then spread globally.
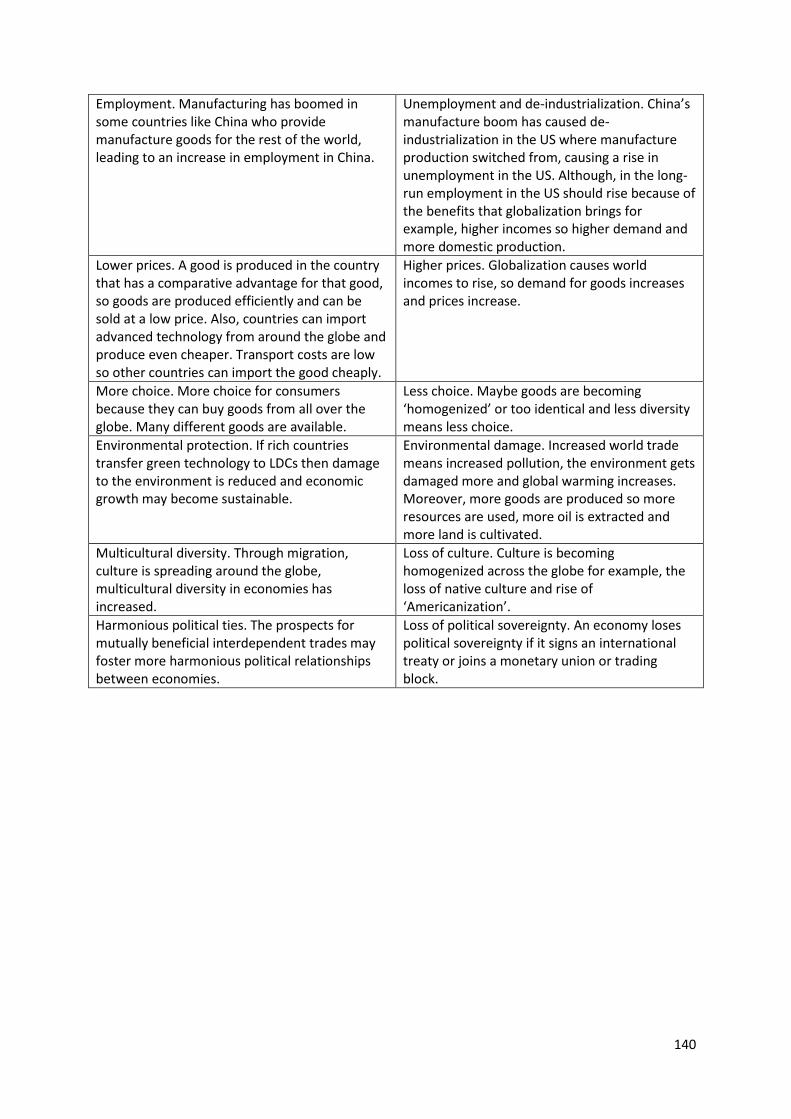
140
Employment. Manufacturing has boomed in some countries like China who provide manufacture goods for the rest of the world, leading to an increase in employment in China.
Unemployment and de-industrialization. China’s manufacture boom has caused de-industrialization in the US where manufacture production switched from, causing a rise in unemployment in the US. Although, in the long-run employment in the US should rise because of the benefits that globalization brings for example, higher incomes so higher demand and more domestic production.
Lower prices. A good is produced in the country that has a comparative advantage for that good, so goods are produced efficiently and can be sold at a low price. Also, countries can import advanced technology from around the globe and produce even cheaper. Transport costs are low so other countries can import the good cheaply.
Higher prices. Globalization causes world incomes to rise, so demand for goods increases and prices increase.
More choice. More choice for consumers because they can buy goods from all over the globe. Many different goods are available.
Less choice. Maybe goods are becoming ‘homogenized’ or too identical and less diversity means less choice.
Environmental protection. If rich countries transfer green technology to LDCs then damage to the environment is reduced and economic growth may become sustainable.
Environmental damage. Increased world trade means increased pollution, the environment gets damaged more and global warming increases. Moreover, more goods are produced so more resources are used, more oil is extracted and more land is cultivated.
Multicultural diversity. Through migration, culture is spreading around the globe, multicultural diversity in economies has increased.
Loss of culture. Culture is becoming homogenized across the globe for example, the loss of native culture and rise of ‘Americanization’.
Harmonious political ties. The prospects for mutually beneficial interdependent trades may foster more harmonious political relationships between economies.
Loss of political sovereignty. An economy loses political sovereignty if it signs an international treaty or joins a monetary union or trading block.
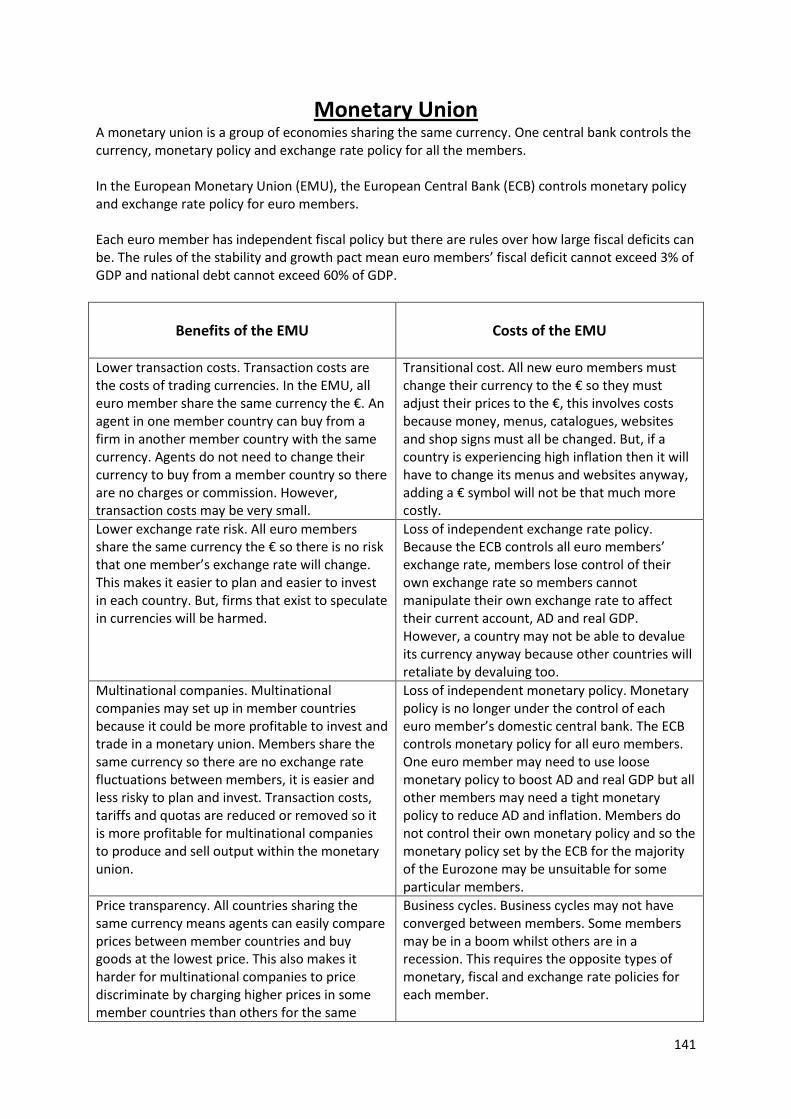
141
Monetary Union A monetary union is a group of economies sharing the same currency. One central bank controls the currency, monetary policy and exchange rate policy for all the members. In the European Monetary Union (EMU), the European Central Bank (ECB) controls monetary policy and exchange rate policy for euro members. Each euro member has independent fiscal policy but there are rules over how large fiscal deficits can be. The rules of the stability and growth pact mean euro members’ fiscal deficit cannot exceed 3% of GDP and national debt cannot exceed 60% of GDP.
Benefits of the EMU
Costs of the EMU
Lower transaction costs. Transaction costs are the costs of trading currencies. In the EMU, all euro member share the same currency the €. An agent in one member country can buy from a firm in another member country with the same currency. Agents do not need to change their currency to buy from a member country so there are no charges or commission. However, transaction costs may be very small.
Transitional cost. All new euro members must change their currency to the € so they must adjust their prices to the €, this involves costs because money, menus, catalogues, websites and shop signs must all be changed. But, if a country is experiencing high inflation then it will have to change its menus and websites anyway, adding a € symbol will not be that much more costly.
Lower exchange rate risk. All euro members share the same currency the € so there is no risk that one member’s exchange rate will change. This makes it easier to plan and easier to invest in each country. But, firms that exist to speculate in currencies will be harmed.
Loss of independent exchange rate policy. Because the ECB controls all euro members’ exchange rate, members lose control of their own exchange rate so members cannot manipulate their own exchange rate to affect their current account, AD and real GDP. However, a country may not be able to devalue its currency anyway because other countries will retaliate by devaluing too.
Multinational companies. Multinational companies may set up in member countries because it could be more profitable to invest and trade in a monetary union. Members share the same currency so there are no exchange rate fluctuations between members, it is easier and less risky to plan and invest. Transaction costs, tariffs and quotas are reduced or removed so it is more profitable for multinational companies to produce and sell output within the monetary union.
Loss of independent monetary policy. Monetary policy is no longer under the control of each euro member’s domestic central bank. The ECB controls monetary policy for all euro members. One euro member may need to use loose monetary policy to boost AD and real GDP but all other members may need a tight monetary policy to reduce AD and inflation. Members do not control their own monetary policy and so the monetary policy set by the ECB for the majority of the Eurozone may be unsuitable for some particular members.
Price transparency. All countries sharing the same currency means agents can easily compare prices between member countries and buy goods at the lowest price. This also makes it harder for multinational companies to price discriminate by charging higher prices in some member countries than others for the same
Business cycles. Business cycles may not have converged between members. Some members may be in a boom whilst others are in a recession. This requires the opposite types of monetary, fiscal and exchange rate policies for each member.
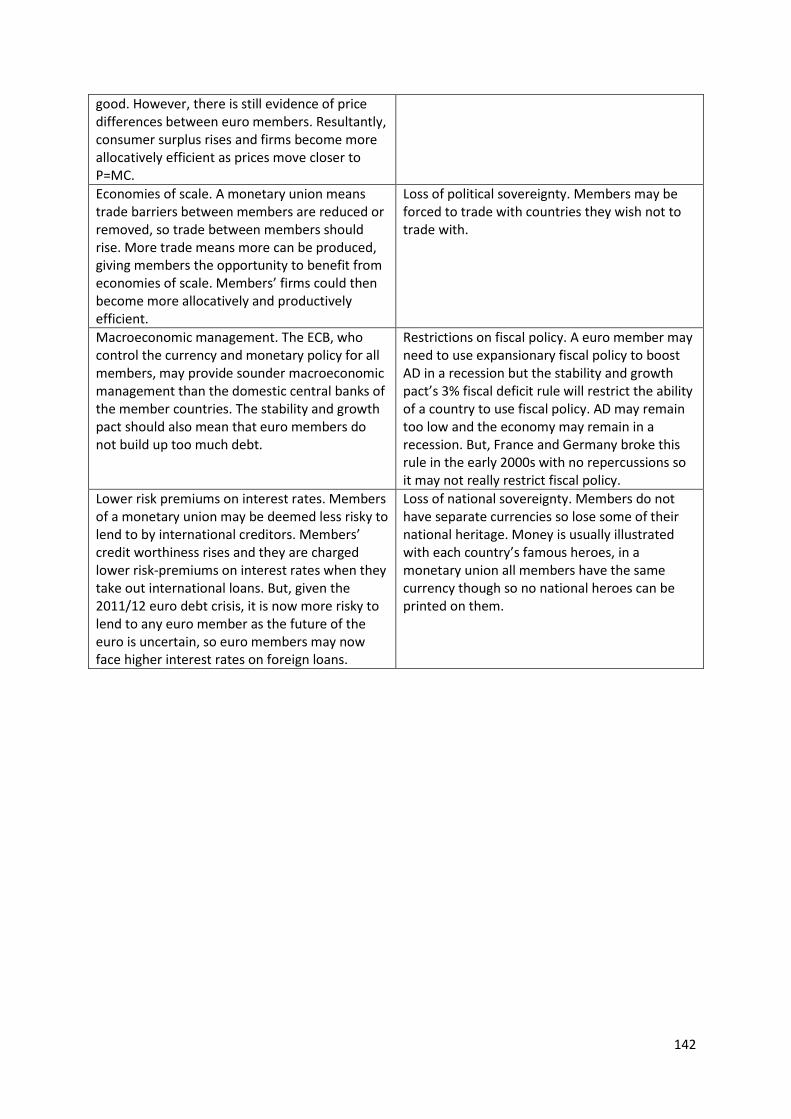
142
good. However, there is still evidence of price differences between euro members. Resultantly, consumer surplus rises and firms become more allocatively efficient as prices move closer to P=MC.
Economies of scale. A monetary union means trade barriers between members are reduced or removed, so trade between members should rise. More trade means more can be produced, giving members the opportunity to benefit from economies of scale. Members’ firms could then become more allocatively and productively efficient.
Loss of political sovereignty. Members may be forced to trade with countries they wish not to trade with.
Macroeconomic management. The ECB, who control the currency and monetary policy for all members, may provide sounder macroeconomic management than the domestic central banks of the member countries. The stability and growth pact should also mean that euro members do not build up too much debt.
Restrictions on fiscal policy. A euro member may need to use expansionary fiscal policy to boost AD in a recession but the stability and growth pact’s 3% fiscal deficit rule will restrict the ability of a country to use fiscal policy. AD may remain too low and the economy may remain in a recession. But, France and Germany broke this rule in the early 2000s with no repercussions so it may not really restrict fiscal policy.
Lower risk premiums on interest rates. Members of a monetary union may be deemed less risky to lend to by international creditors. Members’ credit worthiness rises and they are charged lower risk-premiums on interest rates when they take out international loans. But, given the 2011/12 euro debt crisis, it is now more risky to lend to any euro member as the future of the euro is uncertain, so euro members may now face higher interest rates on foreign loans.
Loss of national sovereignty. Members do not have separate currencies so lose some of their national heritage. Money is usually illustrated with each country’s famous heroes, in a monetary union all members have the same currency though so no national heroes can be printed on them.
143
Macroeconomic Definitions
Absolute Advantage. An economy has an absolute advantage in good X if it can produce more of X than any other country using the same resources.
Absolute Poverty. Absolute poverty occurs when a person’s income is below the minimum income required to afford basic necessities for human survival (food, water, shelter, clothing).
Actual GDP Growth. Actual GDP growth is the growth in real GDP that currently occurs.
Aggregate Demand. Aggregate demand (AD) is the total amount of expenditure on goods and services in an economy.
Aggregate Supply. Aggregate supply is the total amount of supply of goods and services in an economy.
Automatic Stabilizers. Automatic stabilizers are changes in government expenditure and taxation that automatically kick-in to help reduce the ups and downs of the business cycle.
Balance of Payments. The balance of payments (BoP) is a record of all external financial transactions between one economy and the rest of the world.
Business Cycles. Business cycles are the pattern of booms and recessions in an economy over a period of time. Business cycles are the fluctuation of real GDP around the long-term trend growth rate.
Capital Flight. A dangerous situation, capital flight occurs when international investors suddenly lose confidence in an economy and rapidly withdraw their capital from that economy.
Comparative Advantage. An economy has a comparative advantage in good X if it can produce X at a lower opportunity cost than any other country.
Consumption. Consumption is total consumer expenditure on durables, non-durables and services.
Contractionary Fiscal Policy. A contractionary fiscal policy means so AD falls. Multiplier effects make AD fall further. AD shifts left so inflation falls and real GDP falls.
Cost-Push Inflation. Cost-push inflation occurs when LRAS shifts left because resource prices rise or wages rise, firms’ costs rise and their prices rise.
Credit Crunch. A situation where banks and other financial institutions decrease their lending or stop lending altogether.
Crowding In. An increase in government spending causes an increase in private investment (maybe the government invests in the infrastructure which encourages private firms to invest).
144
Crowding Out. An increase in government spending causes a decrease in private investment (maybe the government uses resources that private firms would have used).
Current Account. A record of an economy’s international trade in goods, services and investment income.
Customs Union. A customs union is where there is free trade within the trading bloc and a common external tariff on goods coming from outside the bloc.
Deflation. Deflation is a fall in the average price level over a given time period.
Demand-Pull Inflation. Demand-pull inflation occurs when AD rises, spare capacity falls, resources begin to run out so firms’ costs rise and prices rise.
Direct Tax. Direct taxes are taxes on consumers’ income (income tax) or firms’ profits (corporation tax).
Dumping. Dumping occurs when country A sells its goods in country B below the cost of production.
Economic Growth. Economic growth is the percentage change in real GDP over a given time period.
Exports. Exports are domestic goods and services sold to foreign agents.
Exchange Rate. An exchange rate (XR) is the price of one currency in terms of another.
Expansionary Fiscal Policy. An expansionary fiscal policy means so AD rises. Multiplier effects make AD rise further. AD shifts right so inflation rises and real GDP rises.
Financial Account. A record of an economy’s international capital flows including multinational companies’ investment, FDI and portfolio investment.
Fiscal Policy. Fiscal policy is the manipulation of government expenditure (G) and taxation (T) by the government to influence macroeconomic variables.
Fixed Exchange Rate. A fixed XR is where the central bank buys and sells the domestic currency to keep the XR at a fixed level.
Floating Exchange Rate. A floating XR is where market forces determine the XR, that is, the XR is determined by the intersection of market demand and supply.
Free Trade. Free trade refers to international trade conducted without any restrictions on trade.
Free Trade Area. A free trade area is one in which all trade barriers are removed between member countries. Each member can impose its own restrictions on goods from outside the free trade area.
Full Employment. An economy is at full employment if all resources are fully employed, no more can be produced.
145
Gini Coefficient. The Gini coefficient is a numerical measure of the extent of income inequality. The Gini lies between 0 and 1. 0 represents complete income equality, everyone earns the same income. 1 represents complete income inequality, one person earns all the country’s income.
Globalization. Globalization refers to the increasing interdependence and connectivity of different economies around the world, economies integrate into a single global economy.
Government Expenditure. Government expenditure is total expenditure by the government on goods and services.
Gross Domestic Product. Gross Domestic Product (GDP) measures the monetary value of output produced by an economy during a given time period.
Hot Money. Money that international investors move around the globe to seek the highest returns. An unstable form of investment because investors could easily switch money from one economy to another depending on relative interest rates, confidence in an economy and expected XR movements.
Hyperinflation. A period of rapid inflation.
Imports. Imports are foreign goods and services bought by domestic agents.
Indirect Tax. Indirect taxes are taxes on expenditure (Ad valorem or specific taxes).
Infant Industry. An infant industry is new, it needs time to grow and become efficient to be able to compete internationally. So the infant industry must initially be protected from foreign competition.
Inflation. Inflation is a rise in the average price level over a given time period.
Interest Elasticity of Investment. The responsiveness of investment to a change in interest rates.
International Competitiveness. International competitiveness is the ability of a country to compete with rival countries in terms of prices and/or quality.
Investment. Investment is total investment expenditure by firms on buildings, machinery and the change in inventories.
J-Curve. After an exchange rate devaluation, the current account moves into a deficit in the short-run because of fixed contracts for exports and imports. Exports are cheaper and imports are dearer yet their volumes remain the same, so the current account initially moves towards a deficit. After contracts are renegotiated in the long-run, exports rise, imports fall and the current account moves towards a surplus.
LDC. Less developed country.
Leakage. A leakage from the circular flow is money leaving the economy (saving, taxes and imports).
Liquidity Trap. A liquidity trap occurs when the interest rate is at its minimum, interest rates cannot fall any lower.
146
Loose Monetary Policy. A loose monetary policy causes interest rates to fall and AD to rise. Multiplier effects make AD rise further. Inflation rises and real GDP rises.
Long-Term Trend Growth Rate. The long-term trend growth rate is potential real GDP growth, the GDP growth that will occur if all resources are fully and efficiently employed. This increases if technology and knowledge improve.
Lorenz Curve. The Lorenz curve is a diagrammatic representation of a country’s income inequality.
Managed Exchange Rate. A managed XR is where the central bank set a target for the XR and allows the XR to float around that target, the central bank will buy/sell the domestic currency to make sure the XR stays close enough to its target.
Marshall-Lerner Condition. A devaluation will only lead to an improvement in the current account if the sum of the elasticities of demand for exports and imports is greater than one.
Monetary Policy. Monetary policy is the manipulation of monetary variables (interest rate and money supply) by the MPC to influence AD and inflation.
Monetary Union. A monetary union is a group of economies sharing the same currency. One central bank controls the currency, monetary policy and exchange rate policy for all the members.
Multinational Company. A multinational company (MNC) is a firm operating in more than one country.
Negative Output Gap. Occurs when real GDP is below the trend growth rate.
Net Exports. Net exports are exports minus imports (X-M).
Output Gap. The difference between actual or real GDP and the trend growth rate.
Positive Output Gap. Occurs when real GDP is above the trend growth rate.
Productive Capacity. Productive capacity refers to how much output an economy can produce.
Productivity. Productivity is output per worker.
Protectionism. Protectionism refers to a country imposing trade barriers to restrict imports.
Public Sector Net Cash Requirement. Public sector net cash requirement (PSNCR) is government borrowing over a period of time, the difference between government expenditure and tax revenue.
Quantitative Easing. Quantitative easing is the control of the money supply by the MPC to influence AD and inflation.
Quota. A quota is a direct restriction on the quantity of imports.
147
Real GDP. Real GDP is GDP adjusted for inflation.
Real Exchange Rate. A country’s real exchange rate is its nominal exchange rate times its price level and divided by the foreign price level:
The UK becomes more internationally price competitive if its real XR falls. The UK’s real XR will fall if the UK’s nominal XR falls, domestic prices fall and/or foreign prices rise, ceteris paribus.
Recession. A recession occurs if real GDP falls for two consecutive quarters.
Relative Poverty. Relative poverty occurs when a person’s income is so low that they cannot afford what their society deems ‘average’ or ‘common’ goods (for example a TV in the US).
Ricardian Equivalence Hypothesis. A rise in government spending will trigger a fall in consumption. A rise in government spending will make agents anticipate higher future tax revenues, agents consume less to save more so that they can repay high future taxes, AD does not change because government spending rises but consumption falls, fiscal policy is ineffective.
Spare Capacity. An economy has spare capacity if resources are underutilized. More resources can be employed and more can be produced.
Stagflation. A period of rising inflation and rising unemployment.
Supply-Side Policies. Supply-side policies are designed to increase productivity and shift LRAS right.
Tariff. A tariff is a tax on imports.
Tight Monetary Policy. A tight monetary policy causes interest rates to rise and AD to fall. Multiplier effects make AD fall further. Inflation falls and real GDP falls.
Trading Bloc. A trading bloc is a group of countries that allow free trade within their bloc but may impose tariffs on countries outside the bloc.
World Trade Organization. The World Trade Organization (WTO) promotes free trade between all of its member countries. The WTO provides a forum for free trade negotiations by conducting rounds, a series of negotiations designed to lead to major free trade agreements. The WTO also settles trade disputes between member countries and sets trade rules.

148
149
Development Economics
150
Development Economics Development economics studies how economies develop from less developed countries (LDCs) to high income countries (HICs). Across the planet there are developed and developing countries. HICs are typically characterized by high GDP per capita, high living standards and social freedoms. HICs include the US, UK, Germany, Japan, Spain, Canada and New Zealand among others. LDCs are typically characterized by low GDP per capita, low living standards and civil unrest. LDCs include African countries like Rwanda and Sierra Leone, Middle Eastern countries like Yemen and Asian countries like Cambodia among others. What is Development? An increase in economic growth means GDP per capita rises, income increases and consumers can buy more basic foods so their diet improves. Moreover, as incomes keep rising, consumers can buy electrical goods like televisions and enjoy life so living standards rise further. However, an increase in economic growth does not necessarily mean there is economic development. Economic growth is necessary but not sufficient for development. Economic development is multidimensional and includes health, nutrition, education, happiness, social and political freedoms. Better education and literacy means people can read books. Social freedoms give people the right to meet friends and engage in activities they enjoy. Political freedoms mean people can vote and speak freely.
151
Constraints on Growth and Development
Many factors constrain the economic growth and development of LDCs including:
- Poverty cycle. - Population. - Poor human capital. - Poor infrastructure. - Civil war. - Corruption. - Foreign exchange gap. - Foreign debt. - Capital flight. - Primary product dependency. - Declining terms of trade.
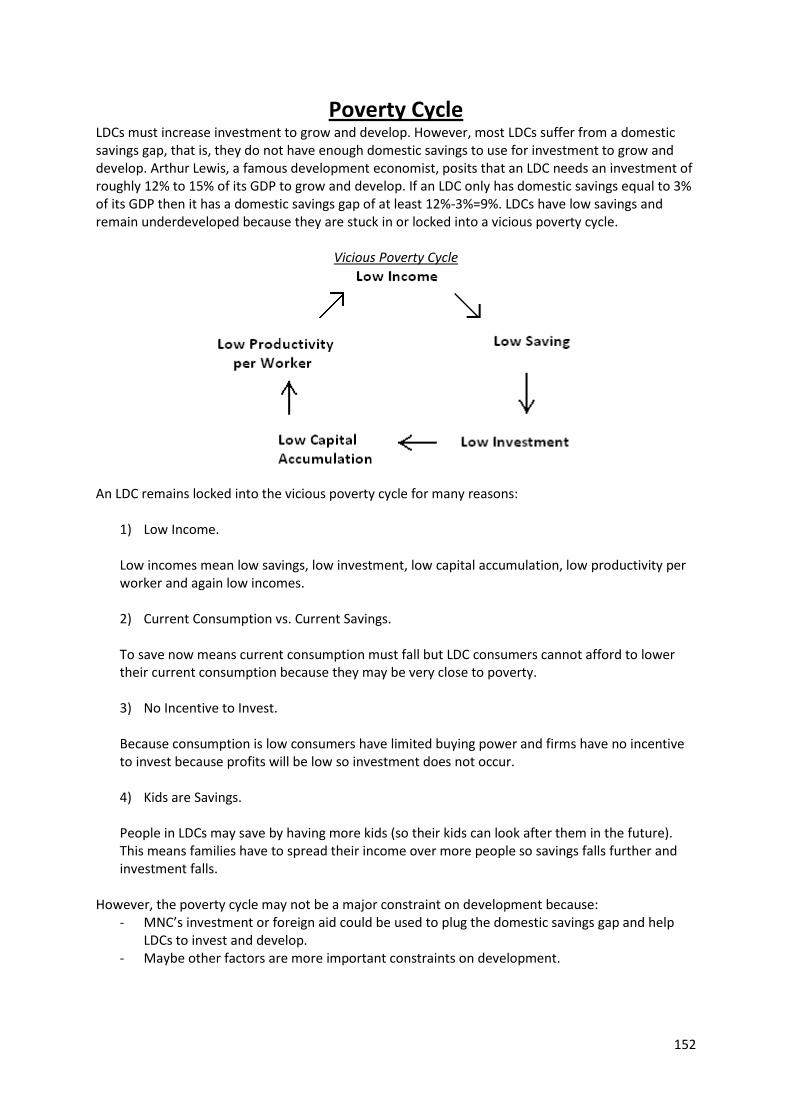
152
Poverty Cycle LDCs must increase investment to grow and develop. However, most LDCs suffer from a domestic savings gap, that is, they do not have enough domestic savings to use for investment to grow and develop. Arthur Lewis, a famous development economist, posits that an LDC needs an investment of roughly 12% to 15% of its GDP to grow and develop. If an LDC only has domestic savings equal to 3% of its GDP then it has a domestic savings gap of at least 12%-3%=9%. LDCs have low savings and remain underdeveloped because they are stuck in or locked into a vicious poverty cycle.
Vicious Poverty Cycle
An LDC remains locked into the vicious poverty cycle for many reasons:
1) Low Income. Low incomes mean low savings, low investment, low capital accumulation, low productivity per worker and again low incomes. 2) Current Consumption vs. Current Savings. To save now means current consumption must fall but LDC consumers cannot afford to lower their current consumption because they may be very close to poverty. 3) No Incentive to Invest. Because consumption is low consumers have limited buying power and firms have no incentive to invest because profits will be low so investment does not occur. 4) Kids are Savings. People in LDCs may save by having more kids (so their kids can look after them in the future). This means families have to spread their income over more people so savings falls further and investment falls.
However, the poverty cycle may not be a major constraint on development because:
- MNC’s investment or foreign aid could be used to plug the domestic savings gap and help LDCs to invest and develop.
- Maybe other factors are more important constraints on development.
153
Population Most LDCs’ birth rates are significantly higher than their death rates, so their population growth is rapid. A high population growth has many negative impacts on economic development:
1) Food Shortages. Malthus posits that food supply only increases arithmetically (2, 4, 6, 8 ... ) but population increases geometrically (2, 4, 16, 256 ... ). Eventually population growth overtakes the growth in food supply. Also, maybe farmers cannot keep using new technology to increase crop yields because there is a limit to how much they can fertilize and develop new strains. Additionally there may be a limit on how much food the planet can provide. Resultantly, the population soon begins to run out of food, some people do not eat enough food so their calorie intake falls and living standards fall. Many people live at subsistence level, eating just enough to survive. Large famines could arise where many people starve and die. 2) Lower GDP Per Capita. As the population rapidly increases, population growth may exceed GDP growth, so GDP per capita falls. People cannot buy as much, living standards fall, some people fall into poverty and live at subsistence level and others may die. 3) Resource Pressure. A higher population means more pressure on the factors of production to provide food and other goods and services required for basic living. Consequently, this means there are less resources available for investment in the manufacture sector and service sector, LDCs’ GDP growth is then restricted and they cannot grow or develop. 4) Environmental Damage. As the population increases, more resources are extracted from the ground so the geosphere is damaged, more land is used and trees cut down so the biosphere is damaged. More people drive and use electrical goods, requiring more fossil fuels to be burned, so there are more dirty emissions pumped into the air and the atmosphere is damaged. 5) Dependency Ratio. As an LDC’s population grows, the age structure may change drastically. An LDC usually sees more babies born, so there are more economically inactive people in the economy and the dependency ratio (the number of dependents divided by the number of workers) rises. Resultantly, people may not be able to afford basic food, clothes, education and/or healthcare for their growing families so they fall into poverty. Furthermore, the government have to spend more on healthcare for babies and education for children, so there is an opportunity cost of spending in other parts of the economy like the manufacture sector. Taxes may also need to rise to meet the increased healthcare and education spending, causing poverty to increase further.
However, population growth may not be a major constraint on development because:
- In developed countries there does not seem to be any problem of food shortages as average daily calorie intake has increased over the years.
- The US, Canada and EU have been limiting their agricultural production so there is scope to provide more food for the planet.
154
- Amartya Sen asserts that people may be starving because they do not have the money or access/entitlement to buy food, not because there is not enough food available.
- Recycling could be used, dirty emissions capped, the government could monitor environmental damage and develop green technology.
- Maybe other factors are more important constraints on development.
155
Poor Human Capital Human capital includes the education, skills and health of workers. An economy with poor human capital will likely suffer lower economic growth and development because:
1) Low Labour Productivity. A low level of education means workers have limited skills and, due to illiteracy, find it difficult to learn new skills. So workers are unproductive and the economy suffers because productivity, the PPF and output are constrained. 2) Repelled MNCs. If a country’s workers are unproductive then domestic firms may not invest and MNCs may be discouraged from entering the country because they face higher costs associated with educating and training workers. So investment is constrained and the potential for economic growth and development is constrained. 3) Families. With little education people may not be able to look after themselves and their families properly so living standards are lower. 4) Poor Education Persists. If parents have a poor education then they may not pass on many skills to their children, so the economy’s population may remain poorly educated even in the long-run.
However, poor human capital may not be a major constraint on development because:
- Agriculture and industry may not require that much education. Workers may not need an education to work productively on farms or to operate machinery in industry. Low education may in fact be advantageous in a monotonous job.
- MNCs may be attracted to LDCs for other reasons like weaker environmental laws. Also, MNCs may just employ their own HIC labour anyway.
- Maybe other factors are more important development constraints. For example, government corruption could mean the LDC’s funds are never used to develop the economy.
156
Poor Infrastructure An economy’s infrastructure includes roads, railways, ports, utilities (electricity, water and gas) and telecommunications. A poor infrastructure harms development because:
1) Lower Productivity. As the quality of an economy’s roads, railways, airports and ports worsens, transport costs rise and productivity declines. So the PPF, productive capacity and output are constrained. Lower output means lower economic growth and less goods and services available for consumers so lower living standards. Japan developed Taiwan’s roads, ports and railroads during colonial rule (1905-1945), thisacted as a growth pole for industry from the 1950s. 2) Less Exchange. As the quality of telecommunications worsens, exchange costs rise and agents are disincentivized to trade so AD falls. 3) Repelled MNCs. If utilities are poor then electricity costs are high and there may be unpredictable black-outs, so domestic firms may not invest and MNCs may be deterred from entering the country. So investment is constrained and the potential for growth and development is constrained.
However, poor infrastructure may not be a major constraint on development because:
- LDCs may be able to upgrade their infrastructure quicker than HICs did in the past. For example, LDCs could jump straight to fibre optic cables to provide the most efficient internet.
- MNCs may still be attracted to LDCs to take advantage of cheap labour or weaker environmental laws even if the infrastructure is poor.
- Maybe other factors are more important development constraints. For example, a civil war means the LDC’s population is fighting so investment is disincentivized no matter the quality of the infrastructure.
157
Civil War An LDC in a state of civil war will remain poor because:
1) Social Capital. Social capital is damaged because a civil war means the LDC’s citizens are fighting, they do not trust each other and there is social fragmentation. 2) Physical Capital. Physical capital is also destroyed for example roads, utilities and political institutions. So the economy’s productivity is seriously damaged. 3) Human Capital. People are being harmed and killed so health and human capital will be adversely affected. People lose out on their education because they must flee their homes and schools. In the long-run this will cause the economy to be less efficient so the PPF and real GDP is constrained. Uganda’s former dictator General Idi Amin killed 300,000 people who opposed the ‘President for life’. 4) Repelled Investors. Property may be destroyed and is at constant risk so investment is disincentivized. Firms will not invest if they fear their profits and property will be destroyed or stolen. 5) Opportunity Cost. The government’s funds are diverted away from development and towards fighting crime. 6) Repelled Tourists. The tourist sector will be adversely affected because people do not holiday in war zones. Tourism is a crucial source of revenue and foreign currency for LDCs.
However, a civil war may not be a major constraint on development because:
- The civil war may be isolated, it may only affect a small part of the LDC, the rest of the economy may not feel any of its effects.
- A civil war may be necessary to embrace political change in an LDC to topple a dictator. After the civil war has finished, a democratic government can be elected and the LDC can develop. After Uganda’s Idi Amin was toppled in 1979, Yoweri Museveni came to power and helped to reduce illiteracy and AIDS.
- Maybe other factors are more important development constraints.
158
Corruption Corruption is the abuse of public power for private gain. Corruption acts as a major constraint on development because:
1) Resources Allocated Inefficiently. A corrupt government will accept bribes from the rich elite and thus make decisions that benefit themselves and a small minority instead of developing the economy for the majority. So there is government failure and consequently an inefficient allocation of resources. Maybe the government prints a lot of money for themselves to spend, this causes hyperinflation. Living standards for the majority of the population falls because prices are too high and the value of people’s life savings are destroyed so many people will fall into poverty. 2) Resources Stolen. The government may be setting extremely high taxes on the population and siphoning the economy’s money off to private bank accounts. Resources are not used to develop the infrastructure or invest in health and education. Even if an LDC has the money to develop it cannot develop because its government is corrupt and basically steals the money. 3) Political Instability. A corrupt government brings political instability, domestic and foreign agents cannot plan so they cannot invest. 4) High Prices. Corruption could lead to monopolies forming in the economy, higher prices and thus lower living standards for the poor.
However, corruption may not be a major constraint on development because:
- Arguably most (maybe all?) governments are corrupt, corruption becomes a development constraint when the degree of corruption is large.
- Maybe other factors are more important development constraints.
159
Foreign Exchange Gap LDCs may not have enough foreign currency reserves to grow and develop, that is, they suffer from a foreign exchange gap. Maybe export revenues are low because of declining terms of trade, debt servicing or capital flight. A foreign exchange gap constrains development because:
1) Limits Vital Imports. LDC export revenues become insufficient to fund the growing need for importing large amounts of capital goods and raw materials required for development but not available domestically. So the economy’s investment and productivity is constrained. 2) Default on Foreign Debt. The economy may not have enough foreign currency reserves to repay its international debt. 3) Famine. The LDC may run out of foreign exchange reserves that could be used to buy food for the domestic population, so living standards fall and poverty may increase as people starve.
However, a foreign exchange gap may not be a major constraint on development because:
- LDCs could seek foreign aid to plug their foreign exchange gap. Maybe LDCs could seek assistance from the World Bank for foreign loans.
- LDCs could receive humanitarian aid if they are suffering from a famine due to a lack of food imports.
- Maybe other factors are more important development constraints.
160
Foreign Debt An economy’s development may be restricted by an unsustainable amount of foreign debt because:
1) Opportunity Cost. A large foreign debt in terms of GDP means the country must pay a high rate of interest (debt service), so funds are diverted away from spending on the domestic economy. Between 1980-1990, Sub-Saharan Africa’s external debt rose by 163%. This resulted in the ‘lost decade of growth’ as domestic spending was diverted towards debt service. GDP per capita fell by 2.5%, consumption per capita fell by 40% and investment fell by 29.7%. 2) Loss of Credit Rating. Maybe debt is so high that the country has a low credit rating and cannot borrow more money, then it may need to divert even more spending away from the domestic economy. Advanced economies may even lose their AAA credit rating if they run up large unsustainable foreign debts for example the US economy in 2011. 3) Repelled MNCs. MNCs will be discouraged from entering an LDC with a large foreign debt because MNCs will expect the LDC government to spend on debt service rather than the infrastructure and tax breaks.
However, foreign debt may not be a major constraint on development because:
- Most countries have foreign debt, debt is only a problem when it becomes unsustainable. - It may be necessary for an LDC to get into debt first to raise funds for development. After
investment has come to fruition the debt can be repaid. - An LDC could get into debt and seek debt cancellation. - Maybe other factors are more important development constraints.
161
Capital Flight Capital flight occurs when investors lose confidence in an economy so domestic and/or foreign agents rapidly pull their money out of the economy. The economy suffers a rapid, dramatic and large outflow of capital. Maybe investors believe the economy will suffer lower growth (or negative growth) in the near future so the return on investment in the economy will be lower. Maybe investors believe the economy’s currency will depreciate in the near future so they cannot make a profit by waiting and selling the currency. Maybe investors believe their assets will be seized, this could occur if an authoritarian government came to power. Capital flight is bad for development because:
1) Less Funds for Investment. Money leaves the economy, there are less savings, the domestic savings gap widens and there are less funds for investment. A restriction of investment means the PPF and economic growth is constrained. 2) Less Tax Revenue. There are less assets and less investment in the domestic economy, profits are low or even negative, incomes are low and consequently tax revenues are low. So the government has less funds to use for development spending. 3) Limits Vital Imports. Additionally, capital flight means foreign currency leaves the economy so the foreign exchange gap widens. Also, investors pull their money out of the economy so the exchange rate falls and imports become more expensive. This reduces the amount of imports into the economy so domestic consumers cannot buy foreign food and domestic firms cannot buy foreign capital goods. 4) Default on Foreign Debt. Foreign currency reserves are depleting rapidly so the economy runs out of funds to repay its foreign debt.
However, capital flight may not be a major constraint on development because:
- The degree of capital flight is significant, if it is small then it may not be a problem. - Maybe the LDC could impose capital controls or freeze assets to stop money flowing out of
the country. - Maybe other factors are more important development constraints.
162
Primary Product Dependency
Primary commodities include wheat, sugar cane, cocoa and bananas. LDCs that are dependent on producing and exporting primary commodities encounter many problems:
1) Lower Revenue. As primary commodities have an inelastic price elasticity of supply, a demand shock causes a significant price change. Additionally, because primary commodities have an inelastic demand, a supply shock also causes a significant price change. Because of these inelasticities, demand and supply shocks may cause primary commodity prices and revenue to fluctuate wildly. A fall in demand or an increase in supply will cause primary commodity prices to fall significantly. This is bad for LDCs because lower primary commodity prices means lower export revenues (and foreign currency) and less revenue for farmers and producers so living standards fall. Between 1985-1994, declining commodity prices cost Sub-Saharan Africa roughly $80bn in lost export revenues. 2) Instability. Because primary commodity prices may fluctuate wildly, it is difficult to plan and invest, so the development of the primary commodity sector may be constrained. 3) Supply-Side Shocks. Primary commodities are particularly in danger of supply side shocks because of natural disasters and extreme weather conditions (hurricanes, tornadoes, droughts and tsunamis), these can have a detrimental effect on primary commodity production. 4) Depletable. Some primary commodities like oil are depletable, so LDCs cannot rely on them forever. 5) Alternatives. Maybe a cheap alternative fuel source for cars will be developed (hydrogen), demand for oil will fall because people will no longer require oil for petrol. Maybe better synthetic diamonds are developed, demand for real diamonds will fall. Maybe crops are genetically modified to grow in countries where they could not grow before.
However, producing and exporting primary commodities may not be a major constraint on development because:
- An LDC may export a large amount of commodities, it can then use the export revenues to develop its roads, ports, railways and utilities or invest in healthcare and education.
- Maybe the LDC could use export revenues to develop other sectors of the economy and diversify so the LDC becomes less reliant on exporting primary commodities. For example, Dubai re-invested oil export revenues to develop its tourist sector.
- An LDC could focus on exporting primary commodities in the short-run and invest in its manufacture sector to change its comparative advantage in the long-run. For example, in the 1960s, South Korea changed its comparative advantage from rice production to manufacture goods like Samsung.
163
- Maybe other factors are more important development constraints.
164
Declining Terms of Trade
LDCs mostly specialize in producing and exporting primary commodities (because this is their comparative advantage), but this may cause declining terms of trade (ToT). The ToT are the price of a county’s exports relative to the price of its imports:
Recent empirical studies suggest that real primary product commodity prices have declined at an average annual rate of 0.6% since 1900. As the Prebisch-Singer hypothesis posits, primary commodity exporters suffer declining ToT due to the differences in the income elasticity of demand (YεD) between primary commodities and manufacture goods. Primary commodities have a low inelastic YεD (due to Engel’s law), whilst manufacture goods have a high elastic YεD. Thus, as world incomes rise, the demand (and hence price) of manufacture goods rise faster than that for primary commodities. The declining ToT causes primary commodity exporting LDCs’ current account to deepen into a deficit (as the value of manufacture imports rise contrasted to the value of primary exports falling) and consequently world income distribution skews further towards developed economies. A way to overcome declining ToT is for LDCs to adopt an import substitution industrialization strategy to allow manufacture goods to be domestically produced and relieve the necessity and repercussions of exporting primary commodities. However, declining terms of trade may not be a major constraint on development because:
- LDCs could export primary commodities that have a high income elasticity of demand like diamonds.
- An LDC could still develop by specializing in primary exports, for example Canada (timber and wheat).
- Maybe commodity prices will rise if the world’s population grows fast enough and demand for food increases more rapidly than demand for manufacture goods.
165
Routes to Growth and Development
An LDC has many routes to help itself grow and develop including:
- Harrod-Domar model. - Lewis model. - Human capital investment. - Multinational companies. - Aid. - Debt relief. - International Monetary Fund and World Bank. - Microfinance. - Tourism. - Fair trade.
166
Harrod-Domar Growth Model
The Harrod-Domar model posits that:
Where
is economic growth, s is the savings ratio3 and k is the capital-output ratio4.
Assuming savings equals investment, economic growth will increase if the economy raises its rate of saving. If people save more, banks have more money to lend, firms can borrow more so investment increases. An LDC government could develop its financial and legal institutions so that people trust banks with their money and save more. Alternatively, the government could seek external finance either through foreignloans or aid. Also, economic growth will increase if the economy lowers its capital-output ratio. If technology improves, the capital-output ratio falls, less capital stock is needed to produce £1 of output so the economy can produce more. The government could decrease the capital-output ratio by giving firms subsidies or tax breaks if they invest in Research and Development (R&D). R&D makes machinery more efficient so capital can produce more output. Alternatively, the government could invest in the infrastructure to make the economy more productive so that capital can produce more output. Meiji Japan’s investment between 1880-1930 was roughly 12-25% of GDP, economic growth then increased from about 2-3% between 1870-1900 to roughly 6-7% between 1880-1930. Taiwan’s savings rates were among the highest ever recorded reaching between 30-40% in the 1950s and 1960s. Taiwan’s culture emphasized savings, plus the state kept real interest rates high and tax free. Between 1960-2000, Taiwan’s annual economic growth rate averaged 7%.
3 For example if S=0.3 and the economy’s GDP is £100bn then £30bn is saved.
4 K measures how much capital is used to produce £1 of output. For example if K=7 then £7 worth of capital
stock is needed to produce £1 worth of output.
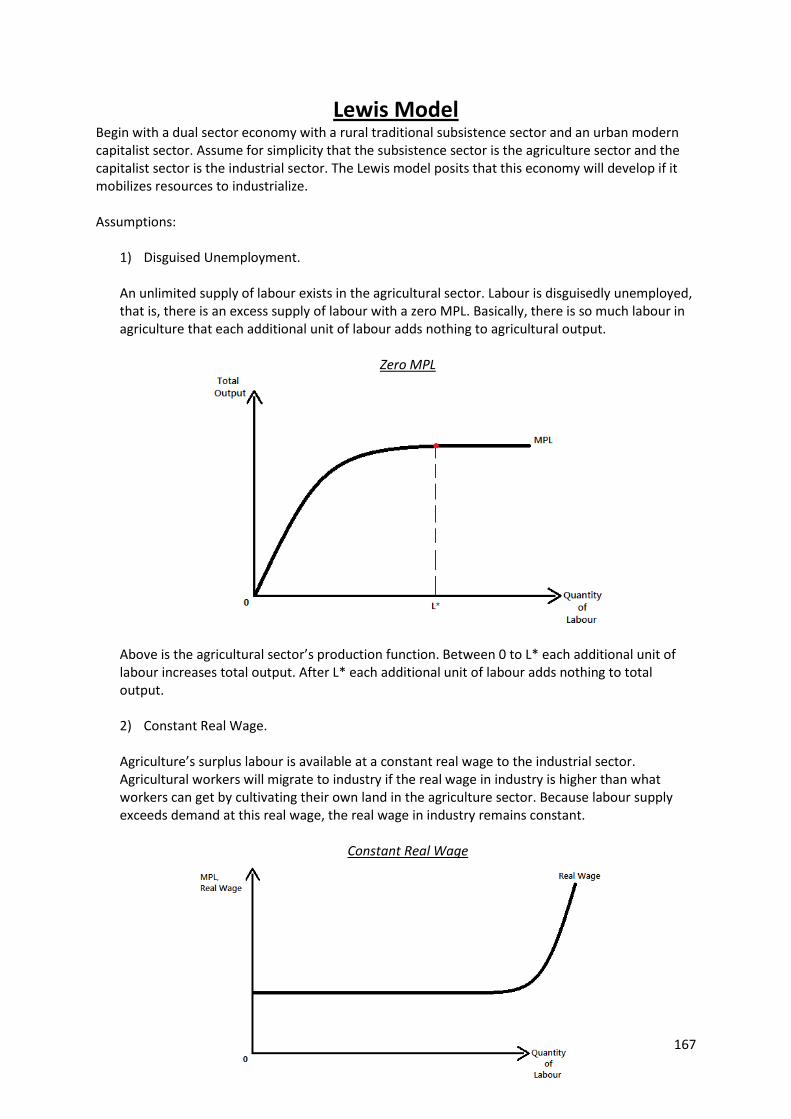
167
Lewis Model
Begin with a dual sector economy with a rural traditional subsistence sector and an urban modern capitalist sector. Assume for simplicity that the subsistence sector is the agriculture sector and the capitalist sector is the industrial sector. The Lewis model posits that this economy will develop if it mobilizes resources to industrialize. Assumptions:
1) Disguised Unemployment. An unlimited supply of labour exists in the agricultural sector. Labour is disguisedly unemployed, that is, there is an excess supply of labour with a zero MPL. Basically, there is so much labour in agriculture that each additional unit of labour adds nothing to agricultural output.
Zero MPL
Above is the agricultural sector’s production function. Between 0 to L* each additional unit of labour increases total output. After L* each additional unit of labour adds nothing to total output. 2) Constant Real Wage. Agriculture’s surplus labour is available at a constant real wage to the industrial sector. Agricultural workers will migrate to industry if the real wage in industry is higher than what workers can get by cultivating their own land in the agriculture sector. Because labour supply exceeds demand at this real wage, the real wage in industry remains constant.
Constant Real Wage
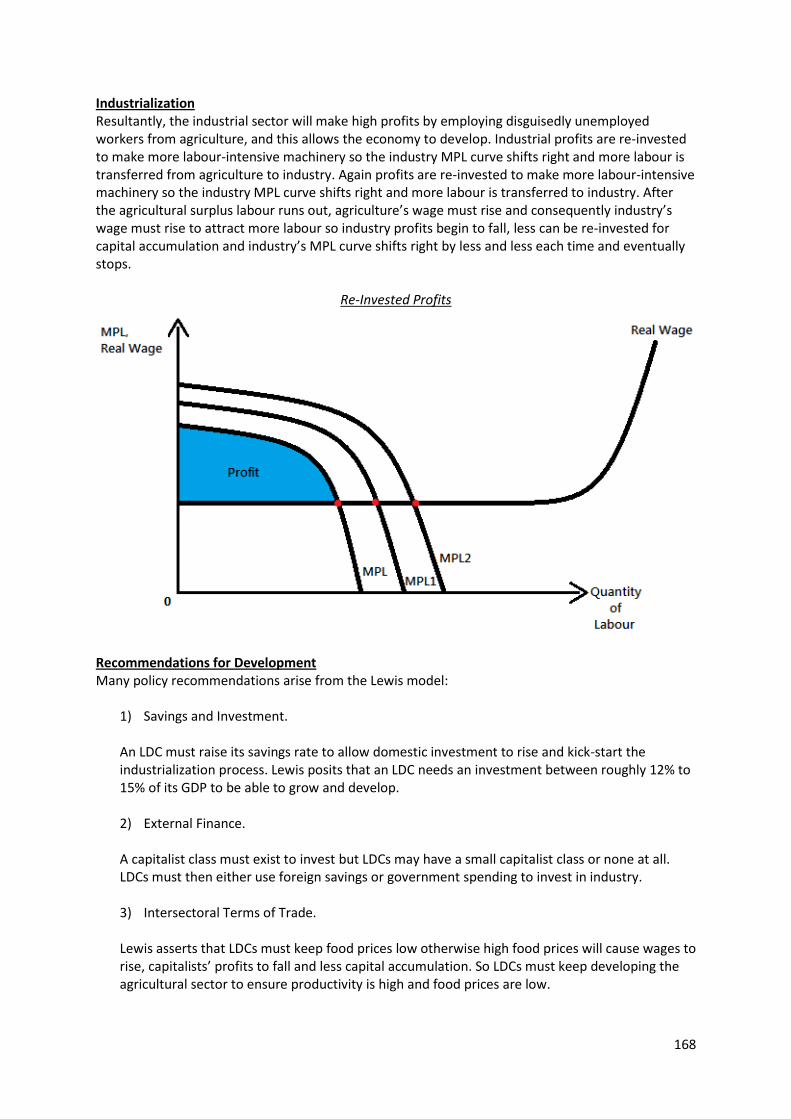
168
Industrialization Resultantly, the industrial sector will make high profits by employing disguisedly unemployed workers from agriculture, and this allows the economy to develop. Industrial profits are re-invested to make more labour-intensive machinery so the industry MPL curve shifts right and more labour is transferred from agriculture to industry. Again profits are re-invested to make more labour-intensive machinery so the industry MPL curve shifts right and more labour is transferred to industry. After the agricultural surplus labour runs out, agriculture’s wage must rise and consequently industry’s wage must rise to attract more labour so industry profits begin to fall, less can be re-invested for capital accumulation and industry’s MPL curve shifts right by less and less each time and eventually stops.
Re-Invested Profits
Recommendations for Development Many policy recommendations arise from the Lewis model:
1) Savings and Investment. An LDC must raise its savings rate to allow domestic investment to rise and kick-start the industrialization process. Lewis posits that an LDC needs an investment between roughly 12% to 15% of its GDP to be able to grow and develop. 2) External Finance. A capitalist class must exist to invest but LDCs may have a small capitalist class or none at all. LDCs must then either use foreign savings or government spending to invest in industry. 3) Intersectoral Terms of Trade. Lewis asserts that LDCs must keep food prices low otherwise high food prices will cause wages to rise, capitalists’ profits to fall and less capital accumulation. So LDCs must keep developing the agricultural sector to ensure productivity is high and food prices are low.
169
Criticisms There are many criticisms of the Lewis model:
1) Re-Invested Profits. Industrial profits might not be re-invested into domestic industry, MNCs may repatriate profits and invest abroad.
2) Capital-Intensive Machinery. Profits may be re-invested to make capital-intensive machinery for industry, so industry does not require much labour from agriculture. Rich industrial capitalists make more profit whilst disguised unemployment remains in agriculture, so income distribution worsens. 3) Seasonal Unemployment. Maybe the agricultural workers are just seasonally unemployed, they may still be crucial for agriculture during harvest times. If these workers leave agriculture, domestic food supply may fall and the population starves. For example, in India there are so many Zebu cows roaming the streets it seems like they are useless and being kept alive for religious reasons but they are in fact the axis of agriculture, they are crucial for the agricultural season and are simply seasonally unemployed the rest of the time. 4) Income Inequality. Profits flow into the hands of capitalists so income distribution worsens and skews further towards the rich. 5) Capitalist vs. Non-Capitalist Sector. Lewis is commonly misinterpreted in such a manner that industry has been prioritised over agriculture. It must be stressed that Lewis focused on a capitalist and non-capitalist dual sector model. A capitalist hires labour to work with machinery to make output for profit. Both industry and agriculture have capitalists, the capitalist sector is not synonymous with the industrial sector. Both agriculture and industry must be developed.
170
Human Capital Investment
Maybe the most important factor in the development of an LDC is investment in human capital. Human capital includes the education, skills and health of workers. An improvement in human capital directly impacts on development as it affects the income, health, living standards and social and political freedoms of an LDC’s population. Human capital is key for an LDC’s long-run growth and self-sufficiency. An investment in education means workers’ skills improve and they become more efficient so they can produce more, the economy’s PPF shifts outwards and real GDP rises. Also, workers are better educated so they can adapt and work with machinery and new technology, this helps an economy to develop its manufacture sector. Rapid growth of the East Asian Tigers South Korea, Taiwan, Singapore and Hong Kong was driven by investment in the manufacture sector but also human capital. Investment in education allowed a skilled labour force to develop and operate the machinery in the manufacture sector. In 1950, Taiwan made 6 years of education compulsory and extended this to 9 years in 1968, an emphasis was placed on female education. Between 1960-2000, Taiwan’s annual economic growth rate averaged 7%. Additionally, because workers’ skills improve, their marginal productivity of labour rises so they should be able to obtain better jobs and earn higher wages. A higher income means workers can buy more goods and services so living standards rise. Also, better literacy and numeracy means people can read and write so they can enjoy social and political freedoms. Moreover, an improvement in education means that people are smarter and may innovate, invent and develop new technology. This has positive spill-overs because society will benefit from new technology. An improvement in hospitals and healthcare means more people will be cured of diseases, there will be less illnesses and life expectancy rises. Better health means people can work longer and more efficiently aswell so labour productivity rises, the economy’s productive capacity increases and real GDP rises. Furthermore, if females are given at least a basic primary education in literacy, numeracy and health then future generations will have a better education and health. Female education is key for the development of future generations. Robin Jeffery posits that “literate men have literate sons, literate women have literate children.” However, there are some drawbacks to investment in human capital:
- A large investment may be required. LDCs may not have the funds to do this. People will need to save but this means a decrease in current consumption which is near impossible given that people will be living close to poverty.
- After people are educated they are ready to work so LDCs must also incentivize domestic firms to invest, attract MNCs and develop the infrastructure to create jobs.
- LDCs could suffer brain drain. Maybe LDCs educate their population and then the educated workers leave to earn higher wages in developed countries. The initial educational investment then goes to waste.
- Income inequality may rise. LDCs must focus on basic education (for example, literacy, numeracy and health) so that the most vulnerable members of society benefit. If instead LDCs invest in universities then this most likely only benefits the rich and allows them to earn higher incomes while the poor do not benefit, so income distribution worsens.
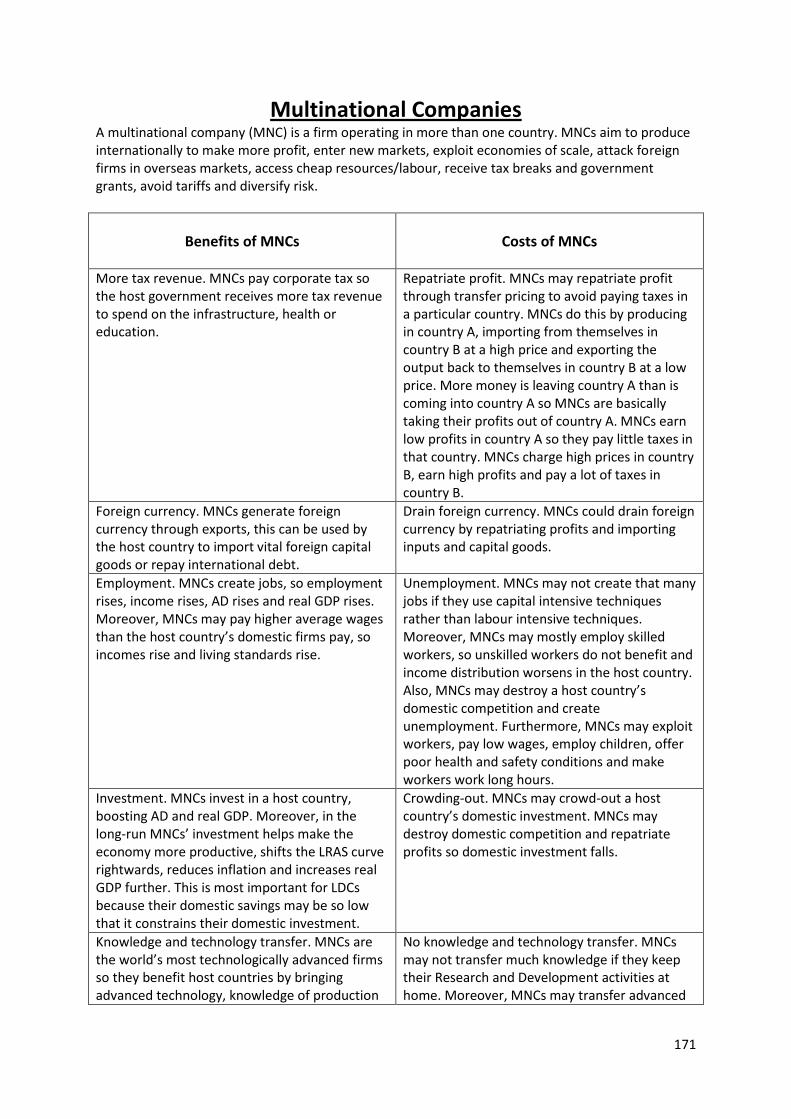
171
Multinational Companies A multinational company (MNC) is a firm operating in more than one country. MNCs aim to produce internationally to make more profit, enter new markets, exploit economies of scale, attack foreign firms in overseas markets, access cheap resources/labour, receive tax breaks and government grants, avoid tariffs and diversify risk.
Benefits of MNCs
Costs of MNCs
More tax revenue. MNCs pay corporate tax so the host government receives more tax revenue to spend on the infrastructure, health or education.
Repatriate profit. MNCs may repatriate profit through transfer pricing to avoid paying taxes in a particular country. MNCs do this by producing in country A, importing from themselves in country B at a high price and exporting the output back to themselves in country B at a low price. More money is leaving country A than is coming into country A so MNCs are basically taking their profits out of country A. MNCs earn low profits in country A so they pay little taxes in that country. MNCs charge high prices in country B, earn high profits and pay a lot of taxes in country B.
Foreign currency. MNCs generate foreign currency through exports, this can be used by the host country to import vital foreign capital goods or repay international debt.
Drain foreign currency. MNCs could drain foreign currency by repatriating profits and importing inputs and capital goods.
Employment. MNCs create jobs, so employment rises, income rises, AD rises and real GDP rises. Moreover, MNCs may pay higher average wages than the host country’s domestic firms pay, so incomes rise and living standards rise.
Unemployment. MNCs may not create that many jobs if they use capital intensive techniques rather than labour intensive techniques. Moreover, MNCs may mostly employ skilled workers, so unskilled workers do not benefit and income distribution worsens in the host country. Also, MNCs may destroy a host country’s domestic competition and create unemployment. Furthermore, MNCs may exploit workers, pay low wages, employ children, offer poor health and safety conditions and make workers work long hours.
Investment. MNCs invest in a host country, boosting AD and real GDP. Moreover, in the long-run MNCs’ investment helps make the economy more productive, shifts the LRAS curve rightwards, reduces inflation and increases real GDP further. This is most important for LDCs because their domestic savings may be so low that it constrains their domestic investment.
Crowding-out. MNCs may crowd-out a host country’s domestic investment. MNCs may destroy domestic competition and repatriate profits so domestic investment falls.
Knowledge and technology transfer. MNCs are the world’s most technologically advanced firms so they benefit host countries by bringing advanced technology, knowledge of production
No knowledge and technology transfer. MNCs may not transfer much knowledge if they keep their Research and Development activities at home. Moreover, MNCs may transfer advanced
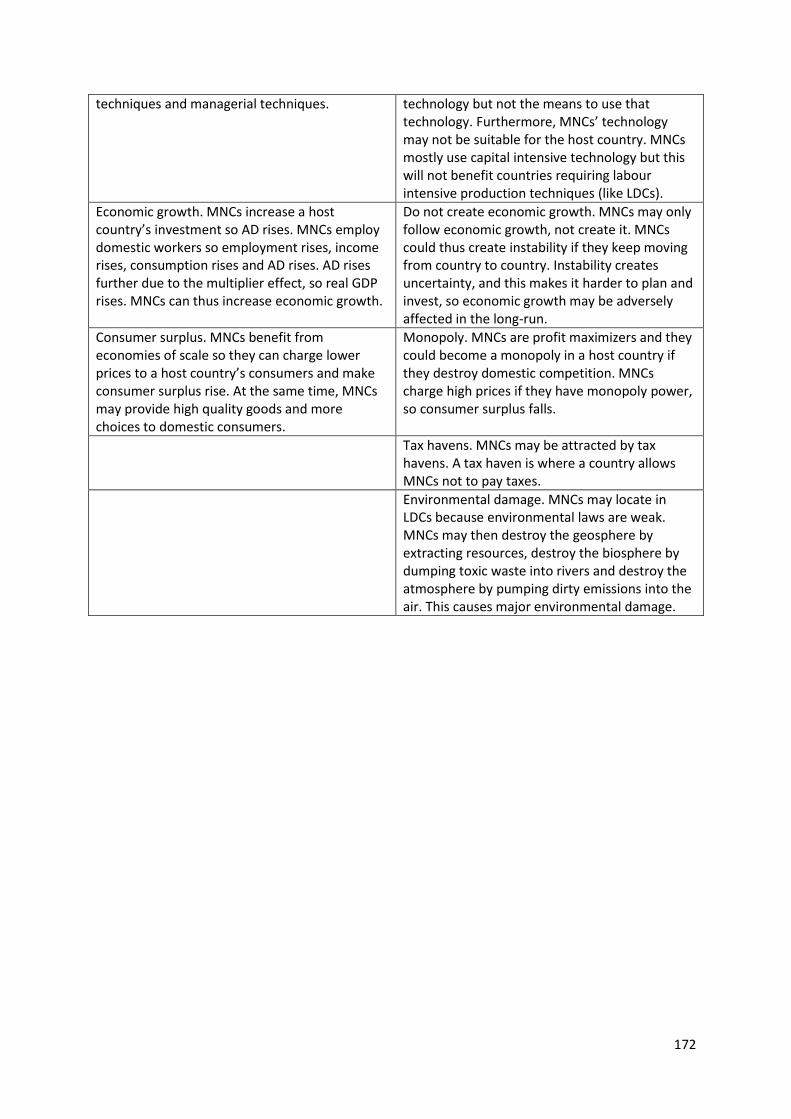
172
techniques and managerial techniques. technology but not the means to use that technology. Furthermore, MNCs’ technology may not be suitable for the host country. MNCs mostly use capital intensive technology but this will not benefit countries requiring labour intensive production techniques (like LDCs).
Economic growth. MNCs increase a host country’s investment so AD rises. MNCs employ domestic workers so employment rises, income rises, consumption rises and AD rises. AD rises further due to the multiplier effect, so real GDP rises. MNCs can thus increase economic growth.
Do not create economic growth. MNCs may only follow economic growth, not create it. MNCs could thus create instability if they keep moving from country to country. Instability creates uncertainty, and this makes it harder to plan and invest, so economic growth may be adversely affected in the long-run.
Consumer surplus. MNCs benefit from economies of scale so they can charge lower prices to a host country’s consumers and make consumer surplus rise. At the same time, MNCs may provide high quality goods and more choices to domestic consumers.
Monopoly. MNCs are profit maximizers and they could become a monopoly in a host country if they destroy domestic competition. MNCs charge high prices if they have monopoly power, so consumer surplus falls.
Tax havens. MNCs may be attracted by tax havens. A tax haven is where a country allows MNCs not to pay taxes.
Environmental damage. MNCs may locate in LDCs because environmental laws are weak. MNCs may then destroy the geosphere by extracting resources, destroy the biosphere by dumping toxic waste into rivers and destroy the atmosphere by pumping dirty emissions into the air. This causes major environmental damage.
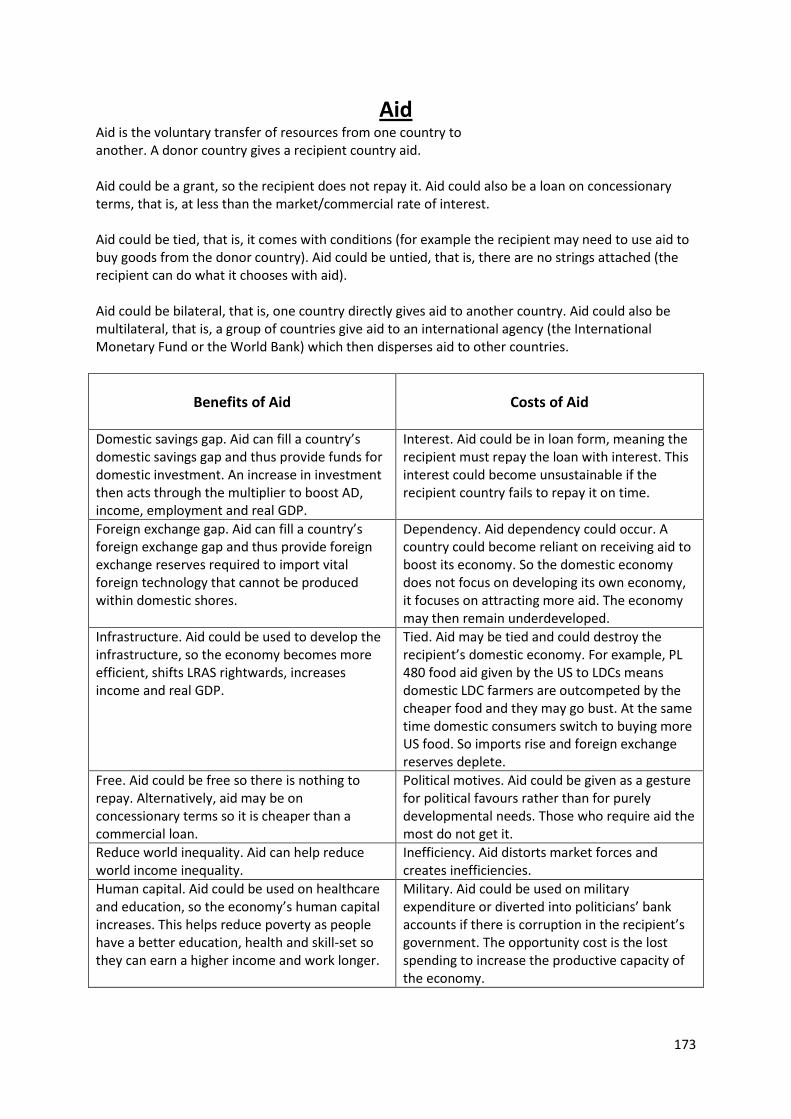
173
Aid
Aid is the voluntary transfer of resources from one country to another. A donor country gives a recipient country aid. Aid could be a grant, so the recipient does not repay it. Aid could also be a loan on concessionary terms, that is, at less than the market/commercial rate of interest. Aid could be tied, that is, it comes with conditions (for example the recipient may need to use aid to buy goods from the donor country). Aid could be untied, that is, there are no strings attached (the recipient can do what it chooses with aid). Aid could be bilateral, that is, one country directly gives aid to another country. Aid could also be multilateral, that is, a group of countries give aid to an international agency (the International Monetary Fund or the World Bank) which then disperses aid to other countries.
Benefits of Aid
Costs of Aid
Domestic savings gap. Aid can fill a country’s domestic savings gap and thus provide funds for domestic investment. An increase in investment then acts through the multiplier to boost AD, income, employment and real GDP.
Interest. Aid could be in loan form, meaning the recipient must repay the loan with interest. This interest could become unsustainable if the recipient country fails to repay it on time.
Foreign exchange gap. Aid can fill a country’s foreign exchange gap and thus provide foreign exchange reserves required to import vital foreign technology that cannot be produced within domestic shores.
Dependency. Aid dependency could occur. A country could become reliant on receiving aid to boost its economy. So the domestic economy does not focus on developing its own economy, it focuses on attracting more aid. The economy may then remain underdeveloped.
Infrastructure. Aid could be used to develop the infrastructure, so the economy becomes more efficient, shifts LRAS rightwards, increases income and real GDP.
Tied. Aid may be tied and could destroy the recipient’s domestic economy. For example, PL 480 food aid given by the US to LDCs means domestic LDC farmers are outcompeted by the cheaper food and they may go bust. At the same time domestic consumers switch to buying more US food. So imports rise and foreign exchange reserves deplete.
Free. Aid could be free so there is nothing to repay. Alternatively, aid may be on concessionary terms so it is cheaper than a commercial loan.
Political motives. Aid could be given as a gesture for political favours rather than for purely developmental needs. Those who require aid the most do not get it.
Reduce world inequality. Aid can help reduce world income inequality.
Inefficiency. Aid distorts market forces and creates inefficiencies.
Human capital. Aid could be used on healthcare and education, so the economy’s human capital increases. This helps reduce poverty as people have a better education, health and skill-set so they can earn a higher income and work longer.
Military. Aid could be used on military expenditure or diverted into politicians’ bank accounts if there is corruption in the recipient’s government. The opportunity cost is the lost spending to increase the productive capacity of the economy.
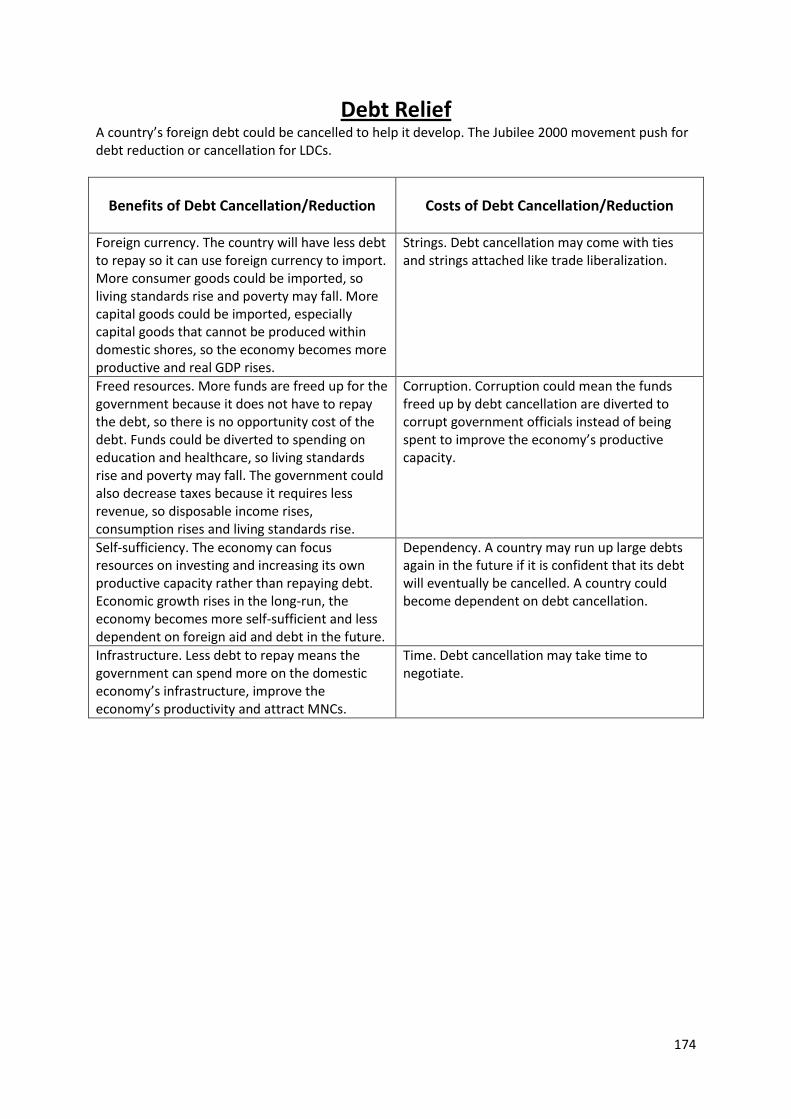
174
Debt Relief A country’s foreign debt could be cancelled to help it develop. The Jubilee 2000 movement push for debt reduction or cancellation for LDCs.
Benefits of Debt Cancellation/Reduction
Costs of Debt Cancellation/Reduction
Foreign currency. The country will have less debt to repay so it can use foreign currency to import. More consumer goods could be imported, so living standards rise and poverty may fall. More capital goods could be imported, especially capital goods that cannot be produced within domestic shores, so the economy becomes more productive and real GDP rises.
Strings. Debt cancellation may come with ties and strings attached like trade liberalization.
Freed resources. More funds are freed up for the government because it does not have to repay the debt, so there is no opportunity cost of the debt. Funds could be diverted to spending on education and healthcare, so living standards rise and poverty may fall. The government could also decrease taxes because it requires less revenue, so disposable income rises, consumption rises and living standards rise.
Corruption. Corruption could mean the funds freed up by debt cancellation are diverted to corrupt government officials instead of being spent to improve the economy’s productive capacity.
Self-sufficiency. The economy can focus resources on investing and increasing its own productive capacity rather than repaying debt. Economic growth rises in the long-run, the economy becomes more self-sufficient and less dependent on foreign aid and debt in the future.
Dependency. A country may run up large debts again in the future if it is confident that its debt will eventually be cancelled. A country could become dependent on debt cancellation.
Infrastructure. Less debt to repay means the government can spend more on the domestic economy’s infrastructure, improve the economy’s productivity and attract MNCs.
Time. Debt cancellation may take time to negotiate.
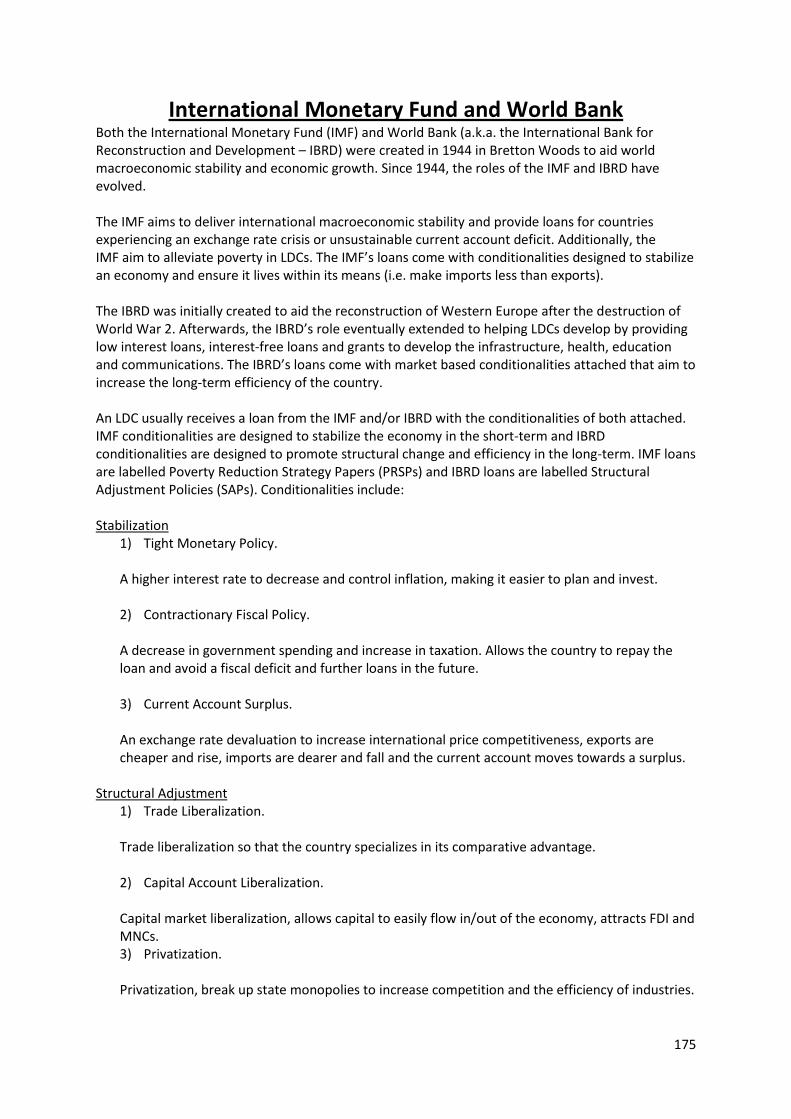
175
International Monetary Fund and World Bank
Both the International Monetary Fund (IMF) and World Bank (a.k.a. the International Bank for Reconstruction and Development – IBRD) were created in 1944 in Bretton Woods to aid world macroeconomic stability and economic growth. Since 1944, the roles of the IMF and IBRD have evolved. The IMF aims to deliver international macroeconomic stability and provide loans for countries experiencing an exchange rate crisis or unsustainable current account deficit. Additionally, the IMF aim to alleviate poverty in LDCs. The IMF’s loans come with conditionalities designed to stabilize an economy and ensure it lives within its means (i.e. make imports less than exports). The IBRD was initially created to aid the reconstruction of Western Europe after the destruction of World War 2. Afterwards, the IBRD’s role eventually extended to helping LDCs develop by providing low interest loans, interest-free loans and grants to develop the infrastructure, health, education and communications. The IBRD’s loans come with market based conditionalities attached that aim to increase the long-term efficiency of the country. An LDC usually receives a loan from the IMF and/or IBRD with the conditionalities of both attached. IMF conditionalities are designed to stabilize the economy in the short-term and IBRD conditionalities are designed to promote structural change and efficiency in the long-term. IMF loans are labelled Poverty Reduction Strategy Papers (PRSPs) and IBRD loans are labelled Structural Adjustment Policies (SAPs). Conditionalities include: Stabilization
1) Tight Monetary Policy. A higher interest rate to decrease and control inflation, making it easier to plan and invest. 2) Contractionary Fiscal Policy. A decrease in government spending and increase in taxation. Allows the country to repay the loan and avoid a fiscal deficit and further loans in the future. 3) Current Account Surplus. An exchange rate devaluation to increase international price competitiveness, exports are cheaper and rise, imports are dearer and fall and the current account moves towards a surplus.
Structural Adjustment
1) Trade Liberalization. Trade liberalization so that the country specializes in its comparative advantage. 2) Capital Account Liberalization. Capital market liberalization, allows capital to easily flow in/out of the economy, attracts FDI and MNCs. 3) Privatization. Privatization, break up state monopolies to increase competition and the efficiency of industries.
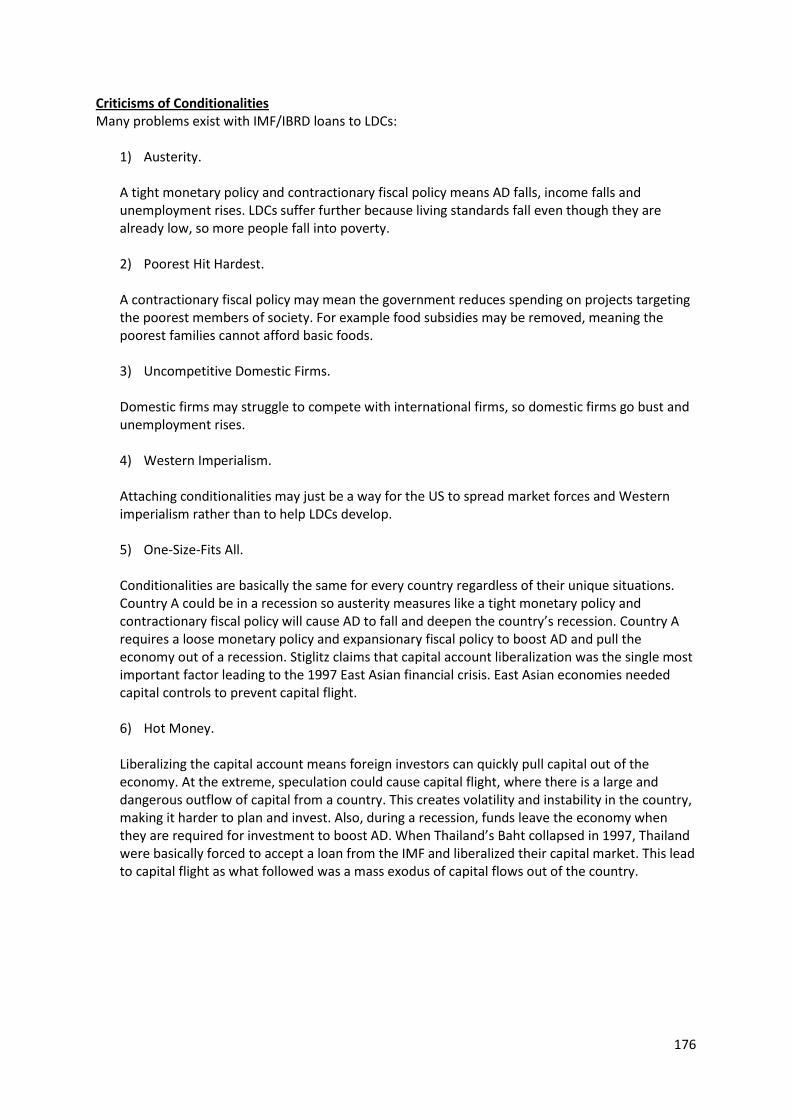
176
Criticisms of Conditionalities Many problems exist with IMF/IBRD loans to LDCs:
1) Austerity. A tight monetary policy and contractionary fiscal policy means AD falls, income falls and unemployment rises. LDCs suffer further because living standards fall even though they are already low, so more people fall into poverty. 2) Poorest Hit Hardest. A contractionary fiscal policy may mean the government reduces spending on projects targeting the poorest members of society. For example food subsidies may be removed, meaning the poorest families cannot afford basic foods. 3) Uncompetitive Domestic Firms. Domestic firms may struggle to compete with international firms, so domestic firms go bust and unemployment rises. 4) Western Imperialism. Attaching conditionalities may just be a way for the US to spread market forces and Western imperialism rather than to help LDCs develop. 5) One-Size-Fits All. Conditionalities are basically the same for every country regardless of their unique situations. Country A could be in a recession so austerity measures like a tight monetary policy and contractionary fiscal policy will cause AD to fall and deepen the country’s recession. Country A requires a loose monetary policy and expansionary fiscal policy to boost AD and pull the economy out of a recession. Stiglitz claims that capital account liberalization was the single most important factor leading to the 1997 East Asian financial crisis. East Asian economies needed capital controls to prevent capital flight. 6) Hot Money. Liberalizing the capital account means foreign investors can quickly pull capital out of the economy. At the extreme, speculation could cause capital flight, where there is a large and dangerous outflow of capital from a country. This creates volatility and instability in the country, making it harder to plan and invest. Also, during a recession, funds leave the economy when they are required for investment to boost AD. When Thailand’s Baht collapsed in 1997, Thailand were basically forced to accept a loan from the IMF and liberalized their capital market. This lead to capital flight as what followed was a mass exodus of capital flows out of the country.
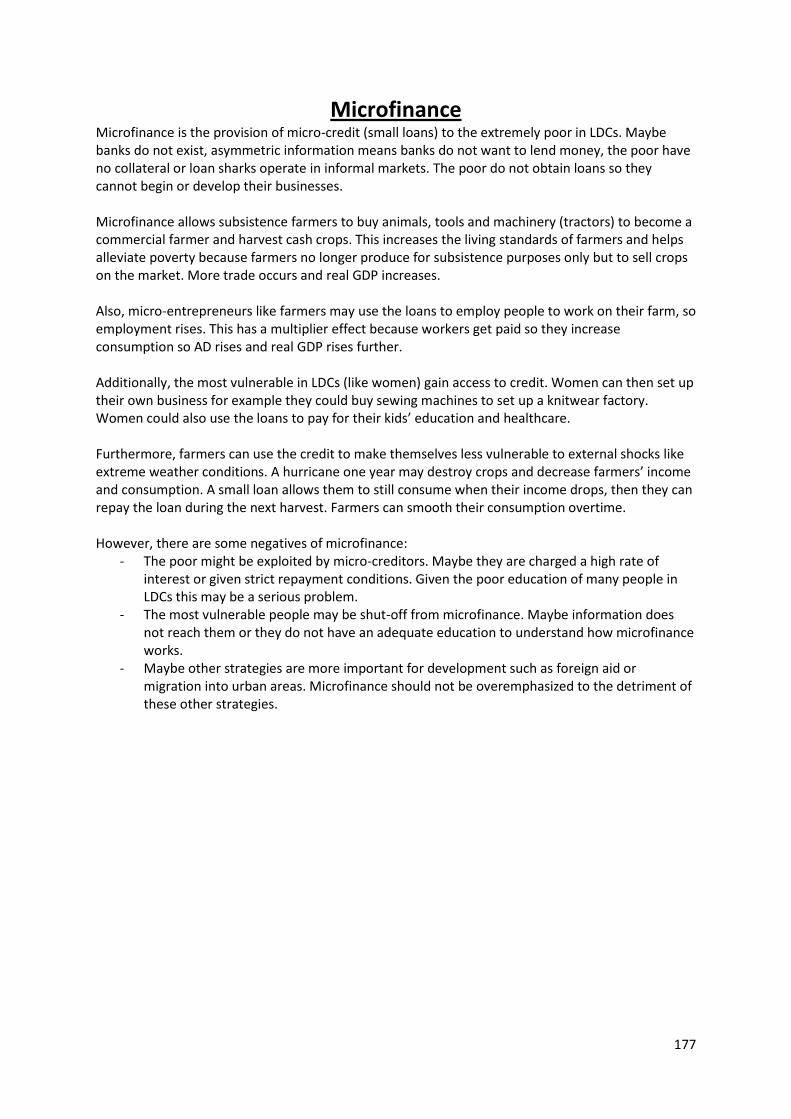
177
Microfinance
Microfinance is the provision of micro-credit (small loans) to the extremely poor in LDCs. Maybe banks do not exist, asymmetric information means banks do not want to lend money, the poor have no collateral or loan sharks operate in informal markets. The poor do not obtain loans so they cannot begin or develop their businesses. Microfinance allows subsistence farmers to buy animals, tools and machinery (tractors) to become a commercial farmer and harvest cash crops. This increases the living standards of farmers and helps alleviate poverty because farmers no longer produce for subsistence purposes only but to sell crops on the market. More trade occurs and real GDP increases. Also, micro-entrepreneurs like farmers may use the loans to employ people to work on their farm, so employment rises. This has a multiplier effect because workers get paid so they increase consumption so AD rises and real GDP rises further. Additionally, the most vulnerable in LDCs (like women) gain access to credit. Women can then set up their own business for example they could buy sewing machines to set up a knitwear factory. Women could also use the loans to pay for their kids’ education and healthcare. Furthermore, farmers can use the credit to make themselves less vulnerable to external shocks like extreme weather conditions. A hurricane one year may destroy crops and decrease farmers’ income and consumption. A small loan allows them to still consume when their income drops, then they can repay the loan during the next harvest. Farmers can smooth their consumption overtime. However, there are some negatives of microfinance:
- The poor might be exploited by micro-creditors. Maybe they are charged a high rate of interest or given strict repayment conditions. Given the poor education of many people in LDCs this may be a serious problem.
- The most vulnerable people may be shut-off from microfinance. Maybe information does not reach them or they do not have an adequate education to understand how microfinance works.
- Maybe other strategies are more important for development such as foreign aid or migration into urban areas. Microfinance should not be overemphasized to the detriment of these other strategies.
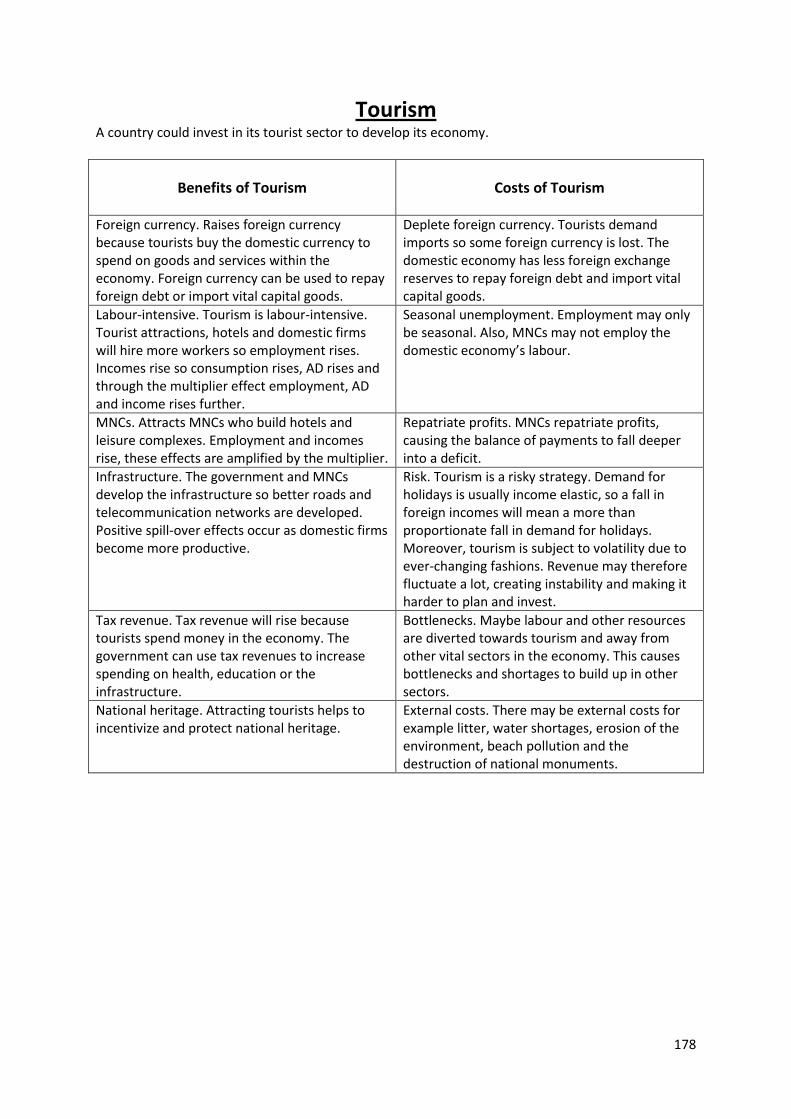
178
Tourism
A country could invest in its tourist sector to develop its economy.
Benefits of Tourism
Costs of Tourism
Foreign currency. Raises foreign currency because tourists buy the domestic currency to spend on goods and services within the economy. Foreign currency can be used to repay foreign debt or import vital capital goods.
Deplete foreign currency. Tourists demand imports so some foreign currency is lost. The domestic economy has less foreign exchange reserves to repay foreign debt and import vital capital goods.
Labour-intensive. Tourism is labour-intensive. Tourist attractions, hotels and domestic firms will hire more workers so employment rises. Incomes rise so consumption rises, AD rises and through the multiplier effect employment, AD and income rises further.
Seasonal unemployment. Employment may only be seasonal. Also, MNCs may not employ the domestic economy’s labour.
MNCs. Attracts MNCs who build hotels and leisure complexes. Employment and incomes rise, these effects are amplified by the multiplier.
Repatriate profits. MNCs repatriate profits, causing the balance of payments to fall deeper into a deficit.
Infrastructure. The government and MNCs develop the infrastructure so better roads and telecommunication networks are developed. Positive spill-over effects occur as domestic firms become more productive.
Risk. Tourism is a risky strategy. Demand for holidays is usually income elastic, so a fall in foreign incomes will mean a more than proportionate fall in demand for holidays. Moreover, tourism is subject to volatility due to ever-changing fashions. Revenue may therefore fluctuate a lot, creating instability and making it harder to plan and invest.
Tax revenue. Tax revenue will rise because tourists spend money in the economy. The government can use tax revenues to increase spending on health, education or the infrastructure.
Bottlenecks. Maybe labour and other resources are diverted towards tourism and away from other vital sectors in the economy. This causes bottlenecks and shortages to build up in other sectors.
National heritage. Attracting tourists helps to incentivize and protect national heritage.
External costs. There may be external costs for example litter, water shortages, erosion of the environment, beach pollution and the destruction of national monuments.
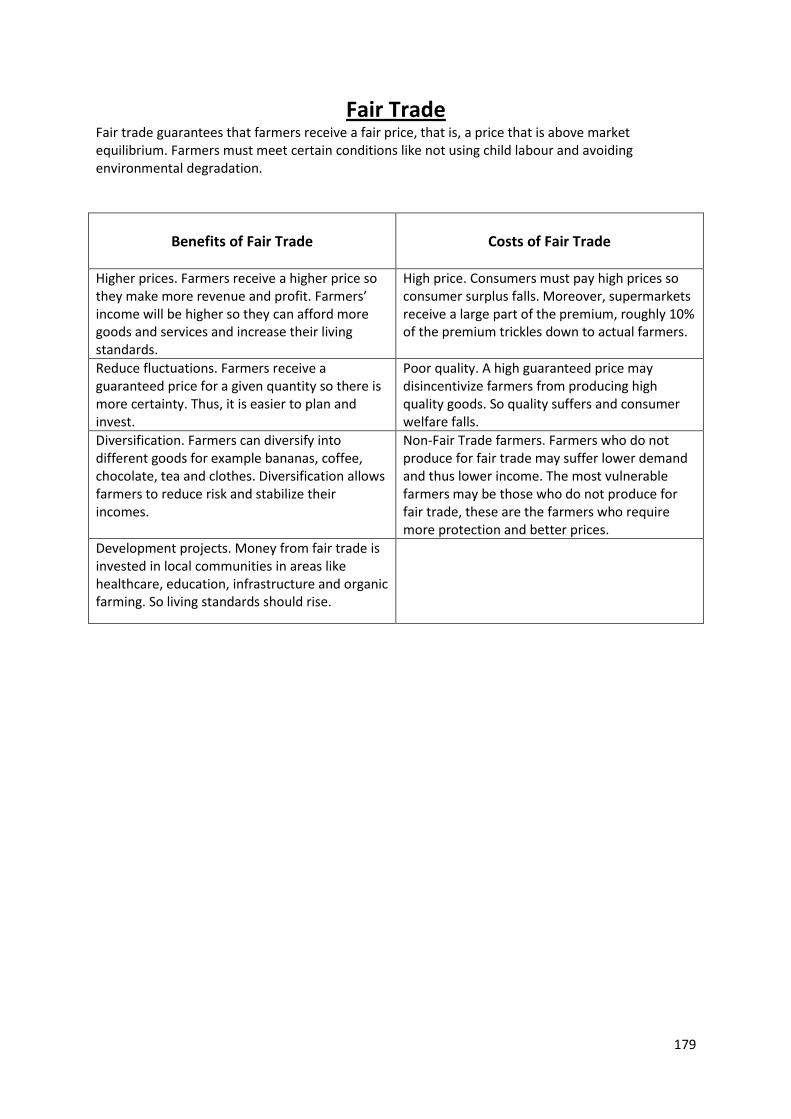
179
Fair Trade
Fair trade guarantees that farmers receive a fair price, that is, a price that is above market equilibrium. Farmers must meet certain conditions like not using child labour and avoiding environmental degradation.
Benefits of Fair Trade
Costs of Fair Trade
Higher prices. Farmers receive a higher price so they make more revenue and profit. Farmers’ income will be higher so they can afford more goods and services and increase their living standards.
High price. Consumers must pay high prices so consumer surplus falls. Moreover, supermarkets receive a large part of the premium, roughly 10% of the premium trickles down to actual farmers.
Reduce fluctuations. Farmers receive a guaranteed price for a given quantity so there is more certainty. Thus, it is easier to plan and invest.
Poor quality. A high guaranteed price may disincentivize farmers from producing high quality goods. So quality suffers and consumer welfare falls.
Diversification. Farmers can diversify into different goods for example bananas, coffee, chocolate, tea and clothes. Diversification allows farmers to reduce risk and stabilize their incomes.
Non-Fair Trade farmers. Farmers who do not produce for fair trade may suffer lower demand and thus lower income. The most vulnerable farmers may be those who do not produce for fair trade, these are the farmers who require more protection and better prices.
Development projects. Money from fair trade is invested in local communities in areas like healthcare, education, infrastructure and organic farming. So living standards should rise.
180
Development Economics Definitions
Aid. Aid is the voluntary transfer of resources from one country to another. A donor country gives a recipient country aid. Aid could be a grant or a loan on concessionary terms. Aid could be tied or untied. Aid could be bilateral or multilateral.
Capital Flight. Capital flight occurs when investors lose confidence in an economy so domestic and/or foreign agents rapidly pull their money out of the economy. The economy suffers a rapid, dramatic and large outflow of capital.
Capital-Intensive Production Techniques. Production that requires a lot of machinery and limited labour.
Debt Relief. A country receives debt relief if all or part of its foreign debt is cancelled.
Developed Countries. Developed countries or high income countries (HICs) are typically characterized by high GDP per capita, high living standards and social freedoms.
Disguised Unemployment. Labour is disguisedly unemployed if there is an excess supply of labour with a zero MPL. Basically, there is so much labour that each additional unit of labour adds nothing to output.
Domestic Savings Gap. An LDC suffers a domestic savings gap when it does not have enough domestic savings to use for investment to grow and develop.
Economic Development. Economic development is multidimensional and includes health, nutrition, education, happiness, social and political freedoms.
Fair Trade. Fair trade guarantees that farmers receive a fair price, that is, a price that is above market equilibrium. Farmers must meet certain conditions like not using child labour and avoiding environmental degradation.
Foreign Exchange Gap. An LDC suffers a foreign exchange gap when it does not have enough foreign exchange reserves to grow and develop.
Harrod-Domar Model. The Harrod-Domar model posits that economic growth will increase if the economy raises its rate of savings or lowers its capital-output ratio.
Human Capital. Human capital includes the education, skills and health of workers.
International Monetary Fund (IMF). The IMF aims to deliver international macroeconomic stability and provide loans for countries experiencing an exchange rate crisis or an unsustainable current account deficit. Additionally, the IMF aim to alleviate poverty in LDCs.
Labour-Intensive Production Techniques. Production that requires a lot of labour and limited machinery.
181
Less Developed Countries (LDCs). Developing countries or LDCs are typically characterized by low GDP per capita, low living standards and civil unrest.
Lewis Model. A dual sector model with a capitalist and non-capitalist sector. The Lewis model posits that this dual sector economy develops if it mobilizes resources to make the capitalist sector grow.
Microfinance. Microfinance is the provision of micro-credit (small loans) to the poor in LDCs.
Multinational Company (MNC). A multinational company (MNC) is a firm operating in more than one country.
Poverty Cycle. LDCs have low savings and remain underdeveloped because they are stuck in a vicious poverty cycle. Low incomes mean low savings, low investment, low capital accumulation, low productivity per worker and again low incomes.
Prebisch-Singer Hypothesis. As the Prebisch-Singer hypothesis posits, primary commodity exporters suffer declining ToT due to the differences in the income elasticity of demand (YεD) between primary commodities and manufacture goods. Primary commodities have a low inelastic YεD (due to Engel’s law), whilst manufacture goods have a high elastic YεD. Thus, as world incomes rise, the demand (and hence price) of manufacture goods rise faster than that for primary commodities.
Primary Product Dependency. Occurs when an LDC is dependent on producing and exporting primary commodities. The LDC suffers from fluctuating prices and supply side shocks because of natural disasters and extreme weather conditions (hurricanes, tornadoes, droughts and tsunamis).
World Bank. The World Bank helps LDCs develop by providing low interest loans, interest-free loans and grants to develop the infrastructure, health, education and communications.