revision on the uk economy as and a2 economics may 2009
TRANSCRIPT

Revision on the UK Economy
AS and A2 Economics
May 2009

Annual percentage change in GDP at constant pricesThe Economic Cycle - Growth in UK National Output
Source: UK Statistics Commission
80 82 84 86 88 90 92 94 96 98 00 02 04 06 08 10
-5
-4
-3
-2
-1
0
1
2
3
4
5
6
Pe
rce
nt
-5
-4
-3
-2
-1
0
1
2
3
4
5
6
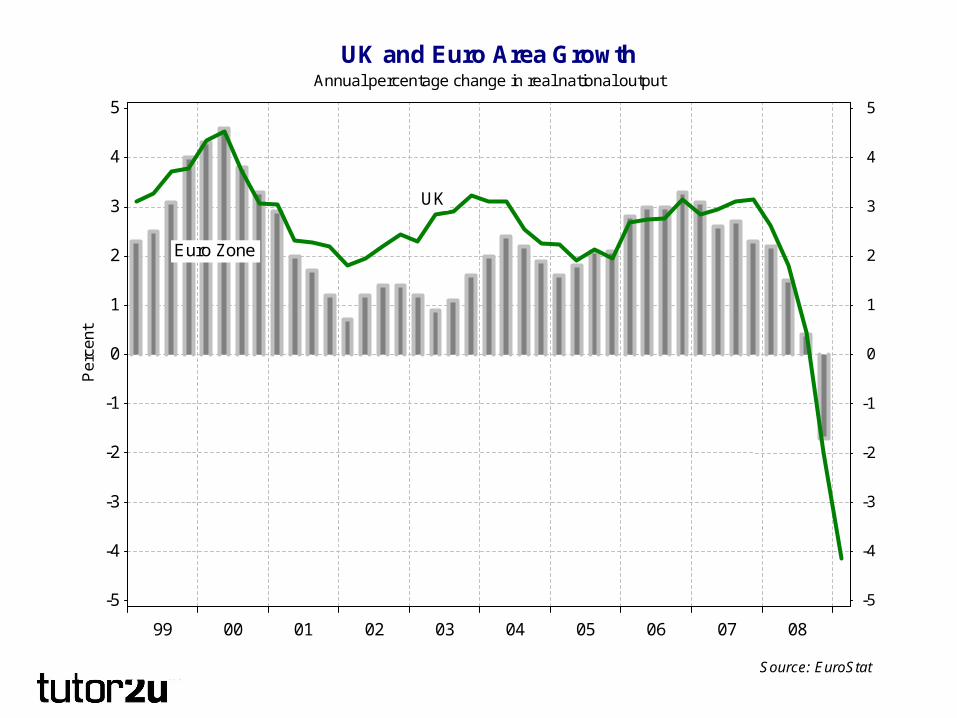
Annual percentage change in real national output
UK and Euro Area Growth
Source: EuroStat
99 00 01 02 03 04 05 06 07 08
-5
-4
-3
-2
-1
0
1
2
3
4
5P
erc
en
t
-5
-4
-3
-2
-1
0
1
2
3
4
5
Euro Zone
UK

Percentage rate of growth year on year at constant prices
United States - Growth and Unemployment
Source: Reuters EcoWin
90 91 92 93 94 95 96 97 98 99 00 01 02 03 04 05 06 07 08
3.5
4.0
4.5
5.0
5.5
6.0
6.5
7.0
7.5
8.0
8.5
Pe
rce
nt
3.54.04.55.05.56.06.57.07.58.08.5
Unemployment Rate (% of labour force)
-1
0
1
2
3
4
5P
erc
en
t
-1
0
1
2
3
4
5
Economic Growth
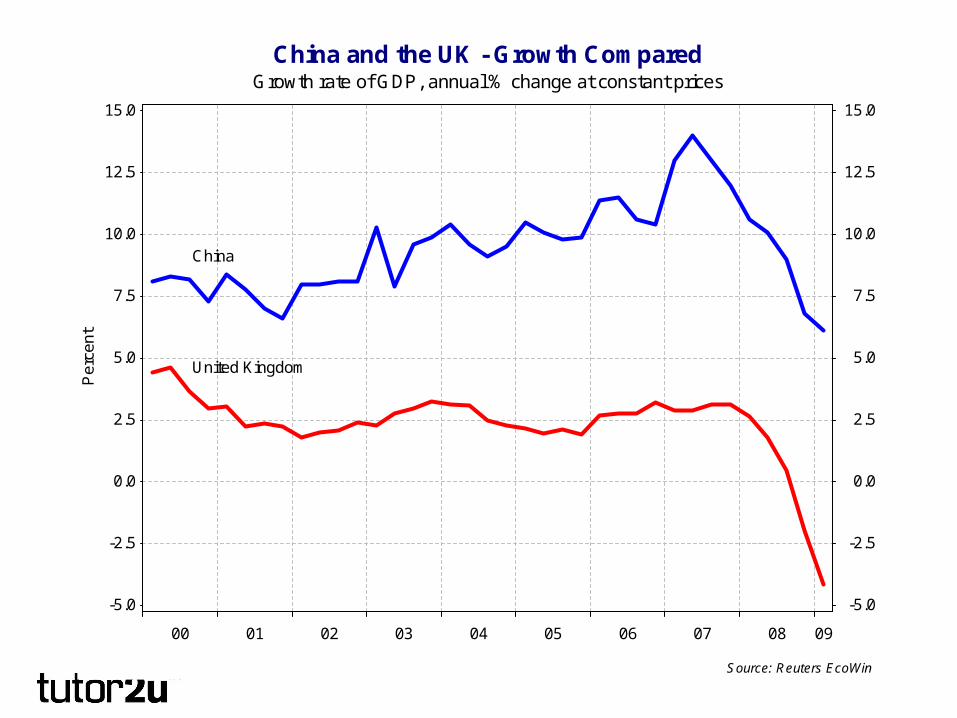
Growth rate of GDP, annual % change at constant pricesChina and the UK - Growth Compared
Source: Reuters EcoWin
00 01 02 03 04 05 06 07 08 09
-5.0
-2.5
0.0
2.5
5.0
7.5
10.0
12.5
15.0P
erc
en
t
-5.0
-2.5
0.0
2.5
5.0
7.5
10.0
12.5
15.0
China
United Kingdom

Evidence for the stock cycle in the UK
Changes in stocks and the UK economic cycle
Source: Reuters EcoWin
00 01 02 03 04 05 06 07 08 09
bill
ion
s
-5
-4
-3
-2
-1
0
1
2
3
4
£ (
bill
ion
s)
-5
-4
-3
-2
-1
0
1
2
3
4
Changes in stocks (a negative figure indicators that businesses were reducing their stock levels)Change in the value of stocks
-5-4-3-2-1012345
Pe
rce
nt
-5-4-3-2-1012345
GDP growth Real GDP Growth

Economics Blog
Recession - causation
• Global credit crisis• Asset price deflation• Rising food and oil prices• Cuts in real disposable income• Collapse of consumer and business sentiment• De-globalisation• Falling profits, investment• Labour shedding• Financial crisis has spread to the real economy

Index of Prices 2000=100
The Economist Commodity Price Index
Source: Economist Commodity Price Index
05 06 07 08 09
100
125
150
175
200
225
250
275
300
325In
de
x
100
125
150
175
200
225
250
275
300
325
All Commodities
Industrial Metals
Food
FTSE 100 index (bottom pane) Average UK house price (top pane)
FTSE 100 and Average UK House Prices
Source: Reuters EcoWin
00 01 02 03 04 05 06 07 08 09
3000
4000
5000
6000
7000
Ind
ex
3000
4000
5000
6000
7000
FTSE 100
80000
100000
120000
140000
160000
180000
200000
£s
80000
100000
120000
140000
160000
180000
200000House Prices

Expectations over next 12 months, % balance of optimists over pessimists
Confidence will need to improve before recovery arrives
Source: Reuters EcoWin
01 02 03 04 05 06 07 08 09
-60
-50
-40
-30
-20
-10
0
10
20N
et b
ala
nce
-60
-50
-40
-30
-20
-10
0
10
20
General state of the economy
Likely to make major purchases
People's Own Financial Situation

Net % balance of people expecting higher unemployment in the next yearUnemployment Expectations
Source: Reuters EcoWin
86 88 90 92 94 96 98 00 02 04 06 08
-20
-10
0
10
20
30
40
50
60
70
80
Ne
t ba
lan
ce
-20
-10
0
10
20
30
40
50
60
70
80

Percentage of disposable income that is saved, quarterly data
Household Savings Ratio
Source: UK Statistics Commission
90 91 92 93 94 95 96 97 98 99 00 01 02 03 04 05 06 07 08
-2.0
0.0
2.0
4.0
6.0
8.0
10.0
12.0
14.0P
erc
en
t
-2.0
0.0
2.0
4.0
6.0
8.0
10.0
12.0
14.0

£ billion per month, seasonally adjusted dataUnited Kingdom Exports to Euro Zone Countries
Source: Reuters EcoWin
03 04 05 06 07 08 09
bill
ion
s
7
8
9
10
11
12
13
14
GB
P (
bill
ion
s)
7
8
9
10
11
12
13
14Figures for 2006 affected by MTIC VAT fraud, also known as 'carousel fraud'
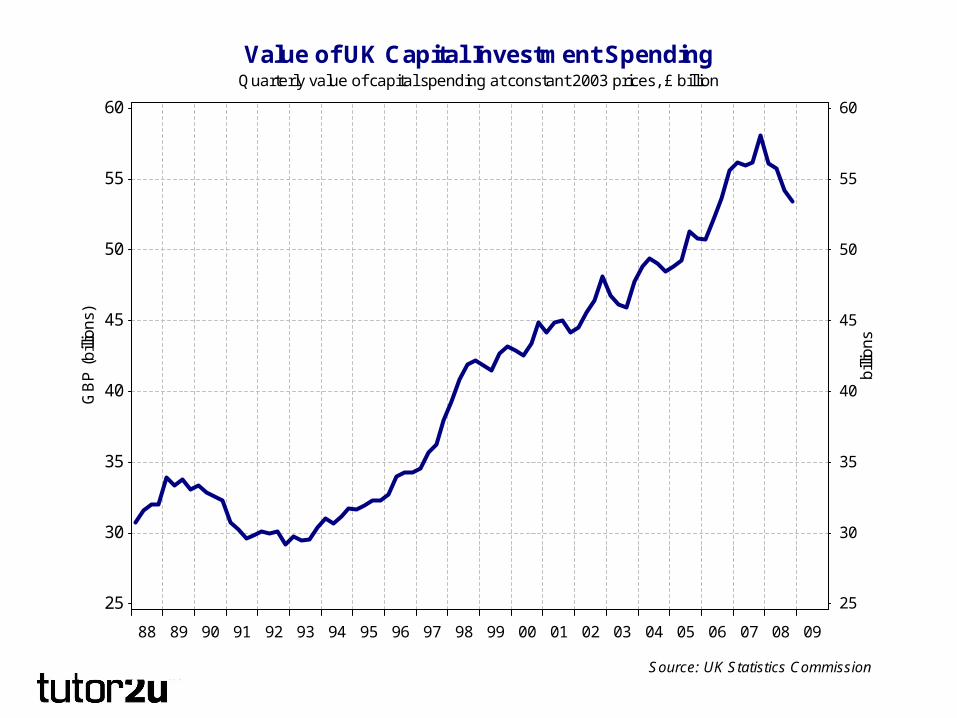
Quarterly value of capital spending at constant 2003 prices, £ billion
Value of UK Capital Investment Spending
Source: UK Statistics Commission
88 89 90 91 92 93 94 95 96 97 98 99 00 01 02 03 04 05 06 07 08 09
bill
ion
s
25
30
35
40
45
50
55
60G
BP
(b
illio
ns)
25
30
35
40
45
50
55
60
Recession Fallout

Actual GDP - Potential GDP, measured as a percentage of potential GDP source: OECD
United Kingdom, Output gap of the total economy
Source: OECD World Economic Outlook
80 82 84 86 88 90 92 94 96 98 00 02 04 06 08 10
-4
-3
-2
-1
0
1
2
3
4
5P
erc
en
tag
e o
f p
ote
ntia
l GD
P
-4
-3
-2
-1
0
1
2
3
4
5

Annual percentage change in GDP at constant prices and Short Term unemployment
Unemployment and the Economic Cycle
Source: Reuters EcoWin
93 94 95 96 97 98 99 00 01 02 03 04 05 06 07 08
-5
-4
-3
-2
-1
0
1
2
3
4
5
Pe
rce
nt
-5
-4
-3
-2
-1
0
1
2
3
4
5
Annual growth of real GDP
mill
ion
s
0.85
0.90
0.95
1.00
1.05
1.10
1.15
1.20
1.25P
ers
on
(m
illio
ns)
0.85
0.90
0.95
1.00
1.05
1.10
1.15
1.20
1.25
People out of work for up to six months (LFS measure)

UK Real GDP Growth and Consumer Price Inflation. annual percentage change
UK Growth, Inflation and Policy Interest Rates
Source: Reuters EcoWin
02 03 04 05 06 07 08 09
-5
-4
-3
-2
-1
0
1
2
3
4
5
6
Pe
rce
nt
-5-4-3-2-10123456
Base interest rates
Real GDP growth
Consumer price inflation
0
1
2
3
4
5
6P
erc
en
t
0
1
2
3
4
5
6
Base Interest Rates
Policy Interest Rates

Annual percentage change in the retail price index and CPI
Retail Price and Consumer Price Inflation in the UK
Source: UK Statistics Commission
97 98 99 00 01 02 03 04 05 06 07 08 09
-2.0
-1.0
0.0
1.0
2.0
3.0
4.0
5.0
6.0P
erc
en
t
-2.0
-1.0
0.0
1.0
2.0
3.0
4.0
5.0
6.0
Consumer price index
All items retail price index (RPI)

Bank of England/NOP, how do you expect prices to change over the next 12 months?
Inflation Expectations
How do you expect prices to change over the next 12 months? How has prices changed over the past 12 months?
Source: Bank of England
99 00 01 02 03 04 05 06 07 08 09
1.5
2.0
2.5
3.0
3.5
4.0
4.5
5.0
5.5P
erc
en
t
1.5
2.0
2.5
3.0
3.5
4.0
4.5
5.0
5.5

Annual percentage change in consumer prices, unemployment rate (%)
UK Unemployment and Consumer Price Inflation
Source: Reuters EcoWin
89 90 91 92 93 94 95 96 97 98 99 00 01 02 03 04 05 06 07 08 09 10
-2
-1
0
1
2
3
4
5
6
7
8
9
10P
erc
en
t
-2
-1
0
1
2
3
4
5
6
7
8
9
10
Unemployment
Inflation

Source: OECD World Economic Outlook
UK - Potential GDP and Trend Growth
Source: OECD World Economic Outlook
90 91 92 93 94 95 96 97 98 99 00 01 02 03 04 05 06 07 08 09
tho
usa
nd
bill
ion
s
0.750.800.850.900.951.001.051.101.151.201.251.30
Re
al G
DP
(th
ou
san
d b
illio
ns)
0.750.800.850.900.951.001.051.101.151.201.251.30
Potential GDP
Potential GDP for the UK
1.50
1.75
2.00
2.25
2.50
2.75
3.00P
erc
en
t
1.50
1.75
2.00
2.25
2.50
2.75
3.00Estimated UK Trend Growth Rate
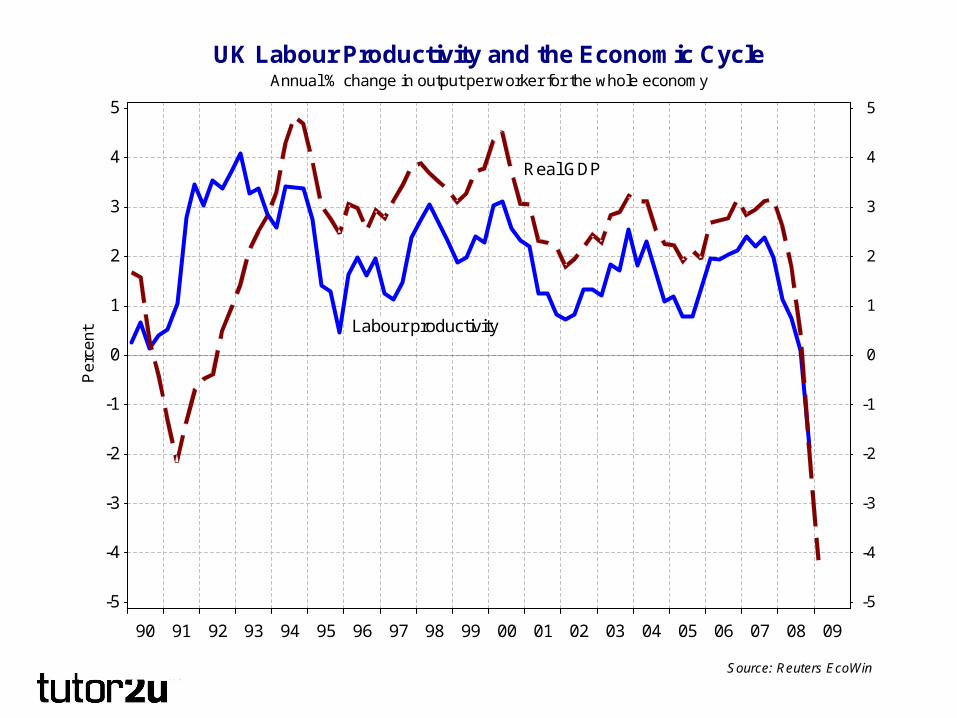
Annual % change in output per worker for the whole economy
UK Labour Productivity and the Economic Cycle
Source: Reuters EcoWin
90 91 92 93 94 95 96 97 98 99 00 01 02 03 04 05 06 07 08 09
-5
-4
-3
-2
-1
0
1
2
3
4
5P
erc
en
t
-5
-4
-3
-2
-1
0
1
2
3
4
5
Labour productivity
Real GDP
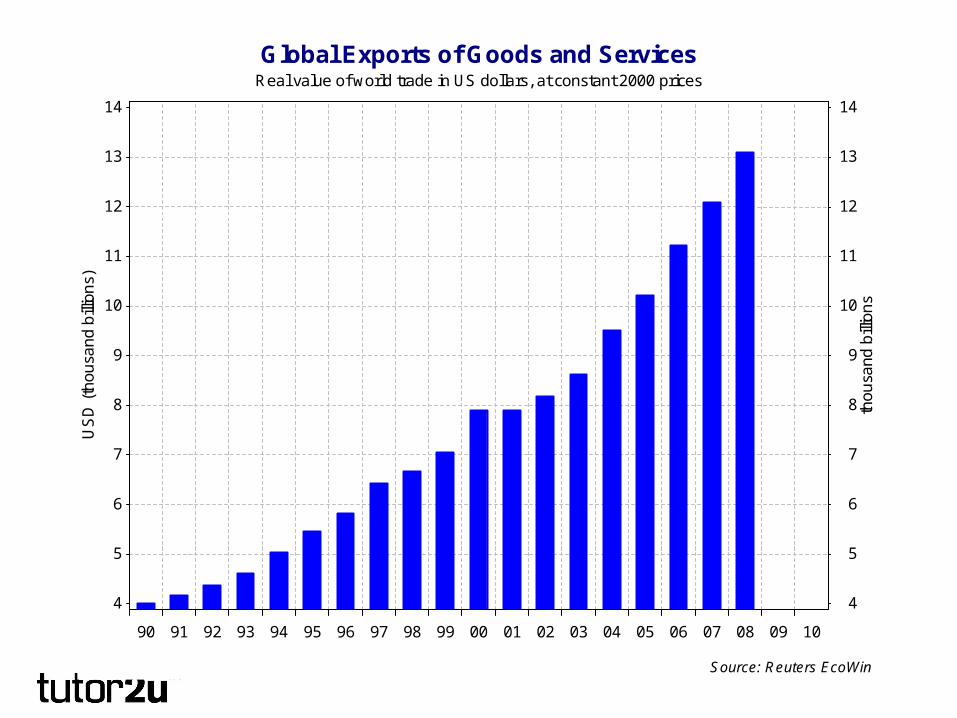
Real value of world trade in US dollars, at constant 2000 prices
Global Exports of Goods and Services
Source: Reuters EcoWin
90 91 92 93 94 95 96 97 98 99 00 01 02 03 04 05 06 07 08 09 10
tho
usa
nd
bill
ion
s
4
5
6
7
8
9
10
11
12
13
14U
SD
(th
ou
san
d b
illio
ns)
4
5
6
7
8
9
10
11
12
13
14

Economics Blog
Recession Fallout – Key Points
• Cyclical consequences– Unemployment– Rising budget deficit– Falling business investment– Inflationary pressures easing / wage cuts?
• Possible semi-permanent effects– Rising structural unemployment– Other hysteresis effects including business failures– Changes to financial system – tougher regulation of
banking and other financial services– Will the UK’s trend growth suffer? LRAS impact?

Policy Responses

Economics Blog
Pulling every lever
• Policy rates have moved to the floor (0.5%)• £75bn quantitative easing (March 2009)• 25% depreciation of sterling over last 12 months• Injection of capital into the banking system• Government borrowing of more than 12% of
GDP (annual fiscal deficit > £175bn)• National debt that > 80% of GDP within 2 years

Percentage - set by the Bank of England Monetary Policy Committee
Monetary Policy Interest Rates in the UK
Source: Bank of England
00 01 02 03 04 05 06 07 08 090
1
2
3
4
5
6P
erc
en
t
0
1
2
3
4
5
6

Per Cent
Interest Rates for the Euro Zone, the UK and the USA
Euro Zone Interest Rate United States Interest Rate United Kingdom Base RateSource: Reuters EcoWin
03 04 05 06 07 08 090.0
0.5
1.0
1.5
2.0
2.5
3.0
3.5
4.0
4.5
5.0
5.5
6.0P
erc
en
t
0.0
0.5
1.0
1.5
2.0
2.5
3.0
3.5
4.0
4.5
5.0
5.5
6.0
USA Interest Rates
Bank of England Rates
Euro Zone Interest Rates

Per cent, source: Bank of England
The Cost of Borrowing
Source: Bank of England
04 05 06 07 08 090.0
2.0
4.0
6.0
8.0
10.0
12.0
14.0
16.0
18.0
20.0P
erc
en
t
0.0
2.0
4.0
6.0
8.0
10.0
12.0
14.0
16.0
18.0
20.0
Mortgage rates
Base Interest Rates (set by BoE)
Overdrafts
Credit cards

Trade-weighted index value for sterling in the foreign exchange market, daily value
United Kingdom Effective Exchange Rate Index
Source: Reuters EcoWin
04 05 06 07 08 09
70
75
80
85
90
95
100
105
110In
de
x
70
75
80
85
90
95
100
105
110

Trade-weighted index value for sterling in the foreign exchange market, daily valueSterling and Base Interest Rates
Source: Reuters EcoWin
Jan07
Mar May Jul Sep Nov Jan08
Mar May Jul Sep Nov Jan09
Mar May
70
75
80
85
90
95
100
105
110
Ind
ex
70
75
80
85
90
95
100
105
110
Sterling Exchange Rate Index (trade-weighted)
0.0
1.0
2.0
3.0
4.0
5.0
6.0P
erc
en
t
0.0
1.0
2.0
3.0
4.0
5.0
6.0
Base Interest Rates

US dollars per £1, daily closing exchange rateDollar-Sterling Exchange Rate
Source: Reuters EcoWin
Jan06
Apr Jul Oct Jan07
Apr Jul Oct Jan08
Apr Jul Oct Jan09
Apr Jul Oct
1.3
1.4
1.5
1.6
1.7
1.8
1.9
2.0
2.1
2.2
GB
P/U
SD
1.3
1.4
1.5
1.6
1.7
1.8
1.9
2.0
2.1
2.2
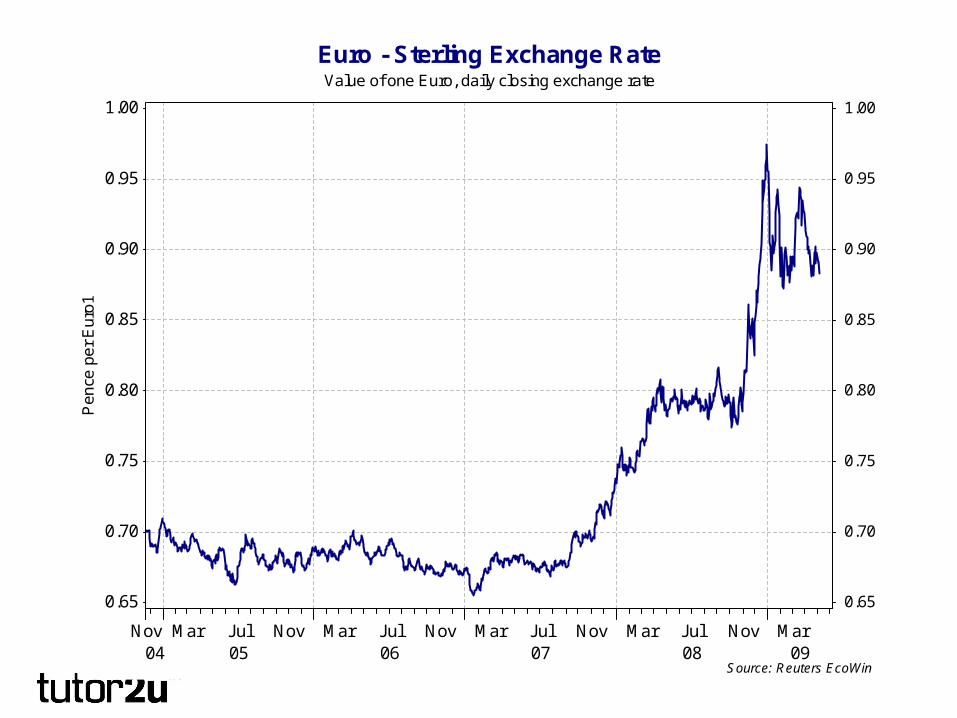
Value of one Euro, daily closing exchange rate
Euro - Sterling Exchange Rate
Source: Reuters EcoWin
Nov04 05
Mar Jul Nov06
Mar Jul Nov07
Mar Jul Nov08
Mar Jul Nov09
Mar
0.65
0.70
0.75
0.80
0.85
0.90
0.95
1.00P
en
ce p
er
Eu
ro1
0.65
0.70
0.75
0.80
0.85
0.90
0.95
1.00

Economics Blog
Bank of England – From Independence to Impotence?
1. Nowhere to go on policy interest rates – liquidity trap reached?
2. Inflation target is being ignored for now (will there be a change?)
3. The key rate now is on government bonds - not the base rate
4. Government committed to HUGE borrowing £175bn in 2010
5. Will the Bank buy as many bonds as the government needs? Or will the bank say enough is enough?
6. For most people the base rate of interest is an irrelevance 1. Look at the cost of unsecured credit
2. Even if borrowing costs are low, can you actually get a loan?

Budget Balance = Tax revenues - Total Government Spending, £ billionUK Government Budget Balance
Source: Reuters EcoWin
80 82 84 86 88 90 92 94 96 98 00 02 04 06 08 10 12
bill
ion
s
-170
-160
-150
-140
-130
-120
-110
-100
-90
-80
-70
-60
-50
-40
-30
-20
-10
0
10
20
£ (
bill
ion
s)
-170
-160
-150
-140
-130
-120
-110
-100
-90
-80
-70
-60
-50
-40
-30
-20
-10
0
10
20

Measured as a percentage of national income (09-10 is a forecast from the OECD)
UK Government Spending and Taxation
Source: OECD World Economic Outlook
90 91 92 93 94 95 96 97 98 99 00 01 02 03 04 05 06 07 08 09 10
36
37
38
39
40
41
42
43
44
45
46
47
48
49P
er
cen
t of G
DP
36
37
38
39
40
41
42
43
44
45
46
47
48
49
Total Tax Revenue
Government Spending Budget deficit where G>T
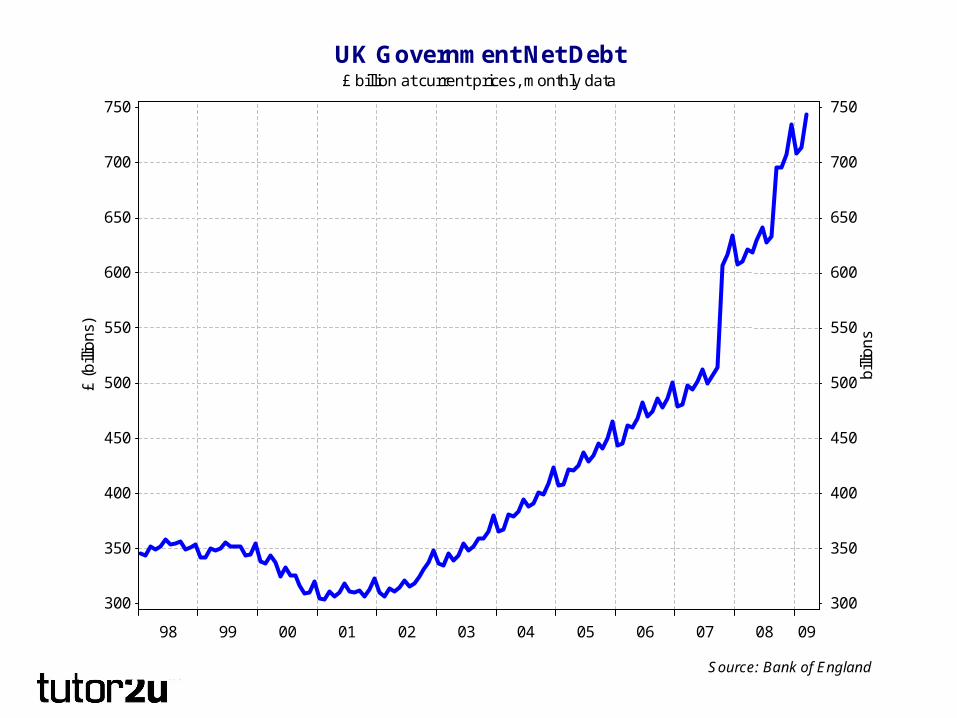
£ billion at current prices, monthly data
UK Government Net Debt
Source: Bank of England
98 99 00 01 02 03 04 05 06 07 08 09
bill
ion
s
300
350
400
450
500
550
600
650
700
750£
(b
illio
ns)
300
350
400
450
500
550
600
650
700
750

Economics Blog
Evaluation
• Monetary and fiscal policy are now joined at the hip• Short term – appetite (demand) for bonds eases the
problems of financing an eye-wateringly large fiscal deficit
• Good fiscal stimuli are timely, targeted, and temporary• But there is no such thing as a free lunch• Fiscal policy will need to be tightened • There will be some crowding out of the private sector• We cannot ignore the risk of resurgent inflation in a
recovery – whenever that comes• Weak sterling poses a major credit (solvency) risk for the
UK government – even if we are not (quite) an Iceland

For essential last minute revision on Economics, don’t forget to visit
the Economics Blog everyday