a2/a282 dartford improvement & m25 jn 1b - jn 3 widening ... › ... · post opening project...
TRANSCRIPT

1
Post Opening Project Evaluation A2/A282 Dartford Improvement & M25 Jn 1b - Jn 3 widening - Five Years After
November 2015

Post Opening Project Evaluation A2/A282 Dartford Improvement & M25 Jn 1b-Jn 3 Widening - Five Year After Study
2
Table of Contents
Chapter Pages
Executive Summary 4
1. Introduction 8 Scheme Background 8
Location of the Schemes 8
Geographic and Socio-economic Context 9
Scheme Descriptions 9
Problems Prior to the Schemes 13
Objectives of the schemes 14
History of the schemes 14
Praise for the schemes 17
Other Major Schemes Nearby 17
Post Opening Project Evaluation (POPE) 18
Key Findings from the OYA Study 18
This Report 19
2. Traffic Analysis 20 Introduction 20
Approach 20
Background Changes in Traffic 20
Traffic Volume Analysis 24
Turning Movements at A2/A282 M25 Jn 2 30
Journey Times 31
Journey times for turning movements at A2/A282 junction 41
Heavy Goods Vehicles 45
Forecast vs. Observed Traffic Flows 46
Forecast vs. Observed Journey Times 53
Journey Time Reliability / Route Stress 54
3. Safety Evaluation 65 Introduction 65
Data Collection 65
Collision Numbers 67
Wider Area 68
A2/A282 Dartford Improvement scheme area 69
M25 Jn 1b – Jn 3 widening scheme area 71
Statistical Significance of Outturn Collision Impacts 72
Collision Rates 73
Evaluation of Collision Severity Index 73
Casualty Numbers 74
Fatalities & Weighted Injuries 74
Stage 4 Road Safety Audit 82
Security 84
4. Economy 88 Introduction 88
Summary of the Scheme Appraisals 89
Transport Economic Efficiency (TEE) 91
PAR Evaluation of Travel Time Benefits 92

Post Opening Project Evaluation A2/A282 Dartford Improvement & M25 Jn 1b-Jn 3 Widening - Five Year After Study
3
Monetised Safety Benefits 93
Scheme Costs 95
Indirect tax 95
Benefit Cost Ratio (BCR) 96
Combined Benefit Cost Ratio (BCR) 98
Wider Economic Impacts 98
5. Environment 101 Introduction 101
Traffic Forecast Evaluation 106
Five Years After Environmental Assessment 108
Noise 109
Local Air Quality 112
Greenhouse Gases 115
Landscape 117
Townscape 122
Heritage 123
Biodiversity 125
Water Quality and Drainage 128
Physical Fitness 131
Journey Ambience 134
6. Accessibility and Integration 140 Accessibility 140
Integration 142
7. Appraisal Summary Table (AST) and Evaluation Summary Table (EST) 147 Appraisal Summary Table 147
Evaluation Summary Table 147
8. Conclusions 152 Scheme Specific Objectives 152
Appendices 154
Appendix A. Data Requested for Section 5: Environment 155 A.1. Sources 155
Appendix B. Update to Handover Environmental Management Plans 158 B.1. Photographic Record of Scheme 163
Appendix C. Casualty analysis 183
Appendix D. Glossary 186
Appendix E. Tables and Figures in this Report 189

Post Opening Project Evaluation A2/A282 Dartford Improvement & M25 Jn 1b-Jn 3 Widening - Five Year After Study
4
Executive Summary Scheme description
The A2/A282 Dartford Improvement scheme and M25 Junction 1b to 3 Widening scheme are Highways England major schemes located around M25 Junction 2 in Kent. The schemes opened in December 2007 and July 2008 respectively. The schemes overlap geographically and the majority of construction occurred during the same periods hence the reason for the combined Post Opening Project Evaluations. A description of each scheme is provided below.
A2/A282 Dartford Improvement
The improvement scheme included new free flow links for the principle movements at the junction: - Viaduct linking A2 westbound to M25/A282 northbound. - Viaduct linking M25/A282 southbound to A2 eastbound. - Free flow slip road for traffic travelling from the A2 westbound onto the M25 southbound.
Widening of the A2 from three to four lanes in each direction between the M25/A282 and the Bean junction, mainly within existing highway boundary with hardshoulders.
M25 Junction 1b to 3 Widening
Widening within existing highway boundary of: - M25 both carriageways from three to four lanes from Junction 3 to south facing slips of
Junction 2. - M25 southbound from two to three lanes between Junction 1b and 2 and through Junction 2.
Lighting on the previously unlit section (Junction 2 to 3).
Infrastructure for a Controlled Motorway on Junction 2 to 3 was installed at the same time, although it was not formally part of this scheme.
Scheme Objectives
A2/A282 Improvement Scheme M25 Junction 1b - 3 Widening Scheme
Objective Objective Achieved?
Objective Objective Achieved?
Reduce journey times and improve reliability
Partial Reduce journey times by 30 - 60 seconds per vehicle
Partial
Improve safety at the junction Improve reliability
Provide enhance access from the M25 to the major regeneration area of Kent Thames-side and other regeneration areas in north and east Kent
Create jobs in Kent Thames-side regeneration area through increase labour pool and impacts on companies relying on distribution of goods
Facilitate access to Ebbsfleet International Rail Station from the national motorway and trunk road network
Mitigate the environmental impacts of the scheme and upgrade water control measures
Limit the environmental impact of the scheme especially regarding noise
Mitigate the environmental impacts of the scheme and upgrade water control measures
Facilitate future demand management measures to provide some constraints on induced traffic and lock in benefits from the widening

Post Opening Project Evaluation A2/A282 Dartford Improvement & M25 Jn 1b-Jn 3 Widening - Five Year After Study
5
Key Findings
Traffic volumes using the circulatory at the A2/A282 junction have reduced by 35% due to the new free-flow movements provided by the A2/A282 scheme
Traffic forecasts for both schemes overestimated traffic levels both before and after scheme opening.
Journey times along the A2/A282 eastbound have improved during the PM peak and there have been journey time savings of up to 2 minutes in the peak periods for traffic using the new free flow links.
The A2/A282 scheme delivers a BCR of 1.6, close to the expected result, whereas the M25 Junction 1b to 3 delivers a BCR of 0.5, which is below the forecast 2.3. Therefore, when combined the results of the M25 scheme reduce the overall BCR to 1.2.
Average annual collision numbers have reduced for the A2/A282 scheme area (4.2 collision saving per annum) but increased for the M25 scheme (9.8 collision increase per annum). In combining the scheme collision results, there has been an increase of 5.6 collisions per annum.
The majority of the environmental impacts for both schemes are as expected and most mitigation measures have been successful.
Summary of Scheme Impacts
Traffic
Traffic volumes using the circulatory at the A2/A282 junction have reduced by 35% due to the new free-flow movements provided by the A2/A282 scheme.
Traffic volumes on the M25 between Junction 2 and 3 and between Junction 3 and 4 have reduced.
Traffic forecasts for both schemes overestimated traffic levels for before scheme opening and after scheme opening periods.
Journey times in the PM peak have decreased by 2 minutes in the northbound direction between Junction 2 and 3, and by 35 seconds on the A2 eastbound (west of A2/A282 junction).
There have been savings of up to 2 minutes in the peak periods for traffic using the new free flow links provided by the A2/282 scheme. Overall for movements still requiring use of the circulatory, there have been savings of up to 40 seconds in the peak periods, attributable to the reduced traffic using the roundabout. Such journey time reductions have not occurred on the A2 eastbound to M25 northbound movement.
Journey time forecasts stated that there would be saving between 30 and 60 seconds on the M25 Junction 1b to 3. Observed journey times indicate that only Junction 2 to Junction 3 has achieved such savings.
Journey time reliability has improved in the southbound direction on the M25 between Junctions 2 and 3 and on the A2 both east and west of the M25 Junction 2. The evidence indicates however, that there are still reliability issues for many parts of the day, with for instance the AM peak still showing unreliable journey times to the east of the junction in the westbound direction.
Safety
There has been an average annual collision saving of 4.2 collisions for the A2/A282 scheme area, which is slightly higher than the forecast saving. Statistical tests have shown that this reduction is a direct impact of the scheme.
The M25 Junction 1b to Junction 3 scheme area shows an annual average increase of 9.8 collisions. Statistical tests have demonstrated that this increase can be directly related to the scheme.
Combining the changes in collisions for both schemes, there has been an overall increase of 5.6 collisions a year.
The collision severity index has reduced in the wider area (which includes the schemes and adjoining links), A2/A282 scheme area and M25 Junction 1b to 3 scheme area.
The section of the A2 east of the M25 Junction 2 has seen a large reduction in the number of fatal and serious injuries and a noticeable reduction in the seriousness of collisions.

Post Opening Project Evaluation A2/A282 Dartford Improvement & M25 Jn 1b-Jn 3 Widening - Five Year After Study
6
The A2/A282 has delivered slightly higher safety savings than forecast, whilst for the M25 Junction 1b to 3, the small saving predicted has not occurred to date.
Environment
Based on traffic flows, impacts on noise are as expected for the A2/A282 scheme. The impacts on noise are better than expected for the M25 Junction 1 to 3b scheme due to lower than forecast increases in traffic volumes between Junction 2 and 3.
Local air quality is better than expected for both schemes based on changes in traffic flows.
There has been an increase in carbon emissions for the A2/A282 scheme, although this is based on A2 mainline flows only. This increase is slightly lower than forecast due to a lower than forecast traffic growth rate.
Due to limited journey time data for M25 Junction 1b to 2, it has not been possible to evaluate carbon emission impacts for the M25 Junction 1b to 3 scheme.
Landscape mitigation measures have been implemented as expected for both schemes. Planting throughout the schemes is progressing well and visual screening and landscape integration function are also developing well.
The full range of ecological mitigation measures have been implemented. Habitat establishment and maintenance is in line with ecological mitigation proposals for both schemes.
A new wetland constructed as an ecological enhancement measures for the M25 Junction 1b to 3 scheme may provide a suitable habitat for water voles.
Water and drainage mitigation measures have been implemented as expected, however, the widening scheme may have impeded drainage on the A2 near Wood Lane overbridge, with 8 collisions occurring during the five years after opening due to wet/damp road conditions and driving into standing water/aquaplaning.
Accessibility and Integration
Both schemes have had a beneficial impact on access to employment opportunities in regeneration areas, Ebbsfleet International Railway Station and retail facilities at Bluewater shopping centre.
The A2/A282 scheme has had a negative impact on Land Use and Other Government Policies due to negative impacts on good agricultural lane and Green Belt. Impacts for the M25 Junction 1b to 3 are as expected.
All other accessibility and integration impacts are as expected for both schemes.
Summary of Scheme Economic Performance
All monetary figures in 2002 prices and values
Pre Scheme Forecast Post Opening Outturn
Reforecast
A2/A282 M25 J1b – 3 (& controlled
m’way)
A2/A282 M25 J1b – 3 (& controlled
m’way)
Investment Cost in present value (PVC) £97.3m £72.1m £111.4m £59.7m
Journey Time Benefits £155.4m £221.0m £149.6m £56.7m
Vehicle Operating Costs £25.0m £2.8m £25.0m £2.8m
Safety Benefits £1.3m £16.5m £10.0m -£27.8m
Net Impact on Dartford Tolls and Business and Users £1.2m £0.9m £1.2m £0.9m
Present Value Benefit £182.7m £241.1m £185.8m £32.6m
Indirect Tax £5.0m £3.9m £3.9m £3.9m
Benefit Cost Ratio (BCR) Indirect Tax impact treated as a cost
1.8 2.1 1.6 0.5
2.4 1.2
Benefit Cost Ratio (BCR) Indirect Tax impact treated as a benefit
1.9 3.2 1.7 0.6
2.4 1.2
Post Opening Project Evaluation A2/A282 Dartford Improvement & M25 Jn 1b-Jn 3 Widening - Five Year After Study
7
When the economic results of each scheme are considered separately, the results demonstrate that the A2/A282 scheme has delivered benefits in line with those forecast, with the exception of safety benefits which were tenfold the forecast. In contrast, the M25 Junction 1b to 3 scheme has delivered a notable safety disbenefit and lower than forecast journey time benefit thus reducing the combined benefit cost ratio.
The overall present value benefit for the A2/A282 scheme is in line with forecast, however, the M25 present value benefit is 85% lower than forecast.
The observed journey time monetary benefits are below forecast for the A2/A282 and M25 Junction 1b to 3 scheme by 4% and 74% respectively.
For the A2/A282, safety benefits are £2.6 million, which is higher than forecast, however this is in contrast to a safety disbenefit of £27.8 million for the M25 Junction 1b to 3. When the benefits of the two schemes are combined, the M25 safety disbenefit significantly reduces the overall safety benefits.
The total investment cost for the two schemes is £164.9 million, which is 4% lower than forecast.
In following the current appraisal methodology by considering indirect tax as a benefit, the outturn benefit cost ratio is for the A2/A282 is almost as forecast, whereas the M25 benefit cost ratio is 0.5, significantly lower than the 2.3 forecast. The combined BCR was forecast as 2.3 and the outturn BCR is 1.2 and this is a result of the significantly lower than forecast safety and journey time benefits for the M25 scheme.

Post Opening Project Evaluation A2/A282 Dartford Improvement & M25 Jn 1b-Jn 3 Widening - Five Year After Study
8
1. Introduction
Scheme Background 1.1. This report presents an evaluation of two Highways England major schemes five years after
they were opened. The two schemes in question overlap geographically, involving the intersection of the M25, A2 and A282 in Kent, and their construction was largely undertaken in tandem.
1.2. The two schemes had significant impact on the road network and surrounding area and many of these impacts cannot be accurately attributed to one or the other scheme. Therefore, although the two schemes were appraised and funded separately, the Post Opening Project Evaluation (POPE) of them is presented in a combined report. This report provides a Five Years After (FYA) evaluation and follows an earlier report published in 2010 which presented an evaluation of the schemes at One Year After (OYA) opening.
1.3. The two schemes which are the subject of this report are:
A2/A282 Dartford Improvement, opened in December 2007 and primarily involved: - Construction of three free-flow links at M25 Junction (Jn) 2; and - Widening of 2km of the A2 east of the A282/M25 junction.
M25 Jn 1b – Jn 3 widening, opened in July 2008 and involved: - Widening from three to four lanes of both carriageways between Jn 2 and Jn 3; and - Widening of the southbound carriageway between Jn 1b and Jn 2.
Location of the Schemes 1.4. The A2 trunk road forms the main east-west route between London and Dover and is an
important route between London, the M25 and North Kent. The A282, which includes the Dartford Crossings and approach roads, forms part of the south east quadrant of the London Orbital with the M25. The location of the schemes is therefore of strategic importance, as shown in regional context in Figure 1-1.
Figure 1-1 Regional Context of the Schemes

Post Opening Project Evaluation A2/A282 Dartford Improvement & M25 Jn 1b-Jn 3 Widening - Five Year After Study
9
Geographic and Socio-economic Context 1.5. The M25 is an important orbital route around London and is the busiest orbital motorway in
Europe. In this southeast location, it has many strategic connections to radial routes such as the M20 (to Folkestone), the A2 (to Rochester), the A21 (to Croydon) and the M26 (to Maidstone via the M20). The M25 motorway is inter-urban in character in the vicinity of Jn 1b but becomes more rural in nature beyond Jn 2.
1.6. Just to the north-east of the schemes is the Bluewater shopping centre which opened in 1999 and serves over 27 million visitors per year, and employs around 7,000 people. The schemes fall within the Thames Gateway – Europe’s largest regeneration programme stretching 40 miles along the estuary from Canary Wharf in London to Southend in Essex, and Sittingbourne in Kent. Ebbsfleet International railway station lies just to the east of the schemes, north of the A2 at Greenhithe, serving both domestic and High Speed Eurostar train services.
Scheme Descriptions 1.7. The key elements of the respective schemes are described below.
A2/A282 Dartford Improvement
Provision of new free-flow links for the principal movements at M25 Jn 2/A282: - New flyover (E – N) for traffic travelling from A2 westbound to M25/A282; - New flyover (N – E) for traffic travelling from M25/A282 southbound to A2 eastbound;
and - New dedicated slip road (E – S) for traffic travelling from the A2 westbound onto the
M25 southbound.
Realignment of the link roads north of the circulating roundabout at Jn 2: - From Jn 2 to Jn 1b for access from A2 and M25 northbound into Dartford; and - From Jn 1b to Jn 2 for access onto the A2 (eastbound and westbound) and M25
southbound from Dartford.
Realignment of the entry and exit slip roads from Jn 2 roundabout and A282 north of the junction;
Widening of the A2 from 3 to 4 lanes in each direction with hardshoulders, between the eastern slips for the new flyovers at Jn 2 and Bean junction in the east, covering a total of 2km, primarily within the existing highway boundary; and
Environmental mitigation measures including noise fences, improved drainage and retaining walls (further details regarding the environmental mitigation measures are provided in Chapter 5 of this report).
1.8. It should also be noted that in the original proposals for the scheme there was to be a new free-flow link for traffic travelling between the A2 eastbound and A282 northbound – known as Link E. Following detailed design, it was decided to defer Link E, and the revised plans included a direct link between the roundabout of Jn 2 and the A282 northbound1.
1.9. Figure 1-2 shows the key elements of the A2/A282 Dartford Improvement scheme.
1 However, earthworks for Link E associated with the original plan would be carried out, as well as resurfacing of the existing A2 eastbound carriageway and the slip road to Jn 2 with low noise surfacing as originally planned. The new layout at the junction would also facilitate the construction of Link E at a later date.

Post Opening Project Evaluation A2/A282 Dartford Improvement & M25 Jn 1b-Jn 3 Widening - Five Year After Study
10
Figure 1-2 Key elements of A2/A282 Dartford Improvement scheme

Post Opening Project Evaluation A2/A282 Dartford Improvement & M25 Jn 1b-Jn 3 Widening - Five Year After Study
11
M25 Jn 1b – Jn 3 widening
1.10. The M25 Jn 1b – Jn 3 scheme was undertaken using rapid widening methods.
1.11. The key principle of rapid widening is that the widening is carried out within the existing highway boundary, therefore requiring no additional land take, avoiding the need for any compulsory purchase orders and likelihood of a public inquiry.
1.12. The scheme involved the following:
Widening of : - The southbound carriageway of the M25 from two to three lanes between Jn 1b and
Jn 2 southbound slip road; - Both carriageways of the M25 from three to four lanes in each direction between the
south facing slip roads of M25 Jn 2 and the north facing M20 link road merge/diverge at Jn 3;
- Building the new lanes over the current hard shoulders with new hard shoulders built alongside, except under or over bridges (all within the current highway boundary).
Low noise road surfacing/fencing to protect properties and reduce traffic noise;
Lighting on the previously unlit section Jn 2 to Jn 3; and
New water pollution control measures for surface water runoff within the existing motorway boundary.
M25 Jn 2 – Jn 3 Controlled Motorway
1.13. Additionally, during the construction of the scheme, the infrastructure for a Controlled Motorway (CM) was installed between Jn 2 and Jn 3. This was not part of the M25 Jn 1b – Jn 3 widening scheme appraisal, nor was it costed together. Measures included were:
New communications infrastructure including MIDAS, CCTV, emergency telephones, lane signalling and Enhanced Message Signs (EMS).
1.14. The CM was activated in May 2012.
1.15. It is important to note that CM was not directly part of the widening of Junction 1b to 3 scheme and it was not in operation at the time that the OYA study was completed, however it will have affected the results within this report (at the FYA stage).
1.16. The business case for the controlled motorway was set out in an Impact Assessment in July 2010. Where possible this report includes forecasts from the assessment of the CM interspersed with the forecasts for the widening scheme and noted as such.
1.17. Figure 1-3 shows the location of the key elements of both schemes.

Post Opening Project Evaluation A2/A282 Dartford Improvement & M25 Jn 1b-Jn 3 Widening - Five Year After Study
12
Figure 1-3 Key elements of M25 Jn 1b – Jn 3 widening scheme

Post Opening Project Evaluation A2/A282 Dartford Improvement & M25 Jn 1b-Jn 3 Widening - Five Year After Study
13
Problems Prior to the Schemes
A2/A282 Dartford Improvement
1.18. The junction between the A282/M25 and the A2 is the M25 Jn 2. The existing junction was a three-level interchange and all turning movement traffic at the junction had to pass through a signal controlled roundabout at the intermediate (second) level. The junction was very heavily trafficked with almost 90,000 vehicles passing through it each day. With the existing layout this led to the following problems:
Delays occurred regularly and queues at peak times often extended back onto the main carriageways;
Incidents occurring on the M25, A2 or Dartford Crossing lead to gridlock at the signalised roundabout; and
Operation of the junction was complicated by the fact that northbound M25 traffic wishing to exit at Jn 1b had to pass through the Jn 2 roundabout, as well as traffic from Jn 1b wanting to join the M25 southbound. This created conflicts between traffic bound for the Dartford Crossings and local traffic accessing Dartford via Jn 1b.
1.19. At the time the A2/A282 Dartford Improvement scheme was appraised, the A2 between the A282 junction and Bean junction carried over 100,000 vehicles per day and was close to capacity.
1.20. Existing problems were expected to be exacerbated by future growth, including:
Anticipated background growth in traffic flows and local regeneration in the Kent Thameside area of North Kent;
Much development had already taken place, and more planned to take place in future years including such major developments as Dartford Park, Eastern Quarry, Northfleet and Crossways; and
The construction of a new international and domestic rail station at Ebbsfleet between Swanscombe and Northfleet accessed from a new junction on the A2 was part of the proposals for the Channel Tunnel Rail Link (CTRL) – now known as High Speed (HS1) rail.
M25 Jn 1b – Jn 3 widening
1.21. The existing problems described in the Appraisal Summary Table (AST) for the scheme (which was produced shortly before the start of scheme construction) were:
Unreliability of journey times;
Lack of other orbital routes around London; and
The need for access to Thames Gateway regeneration area.
1.22. The Scheme Assessment Report (SAR) stated with regard to existing condition, ‘It operates at or close to capacity during peak traffic periods. Journey time surveys indicate that during peak periods there can be substantial variations in journey times as a result of traffic congestion’.
1.23. The Non-Technical Summary of the Environmental Statement states, ‘Every day nearly 135,000 vehicles use this section of the M25 – which is more than the road was built for. Traffic moves slowly, especially at busy times of the day. By widening the road, [the scheme] would make journey times more reliable and improve safety [and].. also help to provide a transport system that works both now and in the future’.

Post Opening Project Evaluation A2/A282 Dartford Improvement & M25 Jn 1b-Jn 3 Widening - Five Year After Study
14
Objectives of the schemes 1.24. The M25 Jn 1b – Jn 3 widening scheme was packaged with the A2/A282 Dartford
Improvement in order to avoid abortive construction work, limit the disruption to road users by completing the two schemes within the minimum possible time, and minimise the overall cost.
1.25. Objectives for each of the schemes individually were provided in a number of key documents. For brevity, these objectives have been summarised in this section of the report.
A2/A282 Dartford Improvement
1.26. Scheme objectives for the A2/A282 Dartford Improvement have been sourced from the following documents:
Stage 3 Scheme Assessment Report (SAR);
1998 Roads Review;
Statement of Case (2004); and
Environmental Statement (2003).
1.27. The key objectives were:
To reduce journey times and improve reliability;
To improve safety at the junction;
To provide enhanced access from the M25 to the major regeneration area of Kent Thames-side and other regeneration areas in north and east Kent;
To facilitate access to Ebbsfleet International Rail Station from the national motorway and trunk road network; and
To limit the environmental impact of the scheme, especially regarding noise.
M25 Jn 1b – Jn 3 widening
1.28. Scheme objectives for the M25 Jn 1b – Jn 3 widening have been sourced from the following documents:
Appraisal Summary Table (2006);
Scheme Assessment Report (SAR)
Environmental Statement.
1.29. The key objectives were:
To reduce journey times by 30-60 seconds per vehicle;
To improve reliability;
To create jobs in Kent Thames-Side Regeneration Area through increased labour pool and impacts on companies relying on distribution of goods;
To mitigate the environmental impacts of the scheme and upgrade water control measures; and
To facilitate future demand management measures to provide some constraint on induced traffic and lock in benefits from the widening. (Note: these would be carried out separately from the scheme and were not detailed at the time of this scheme’s appraisal – although it was planned that they would be coordinated with this scheme).
History of the schemes
Early Background to the Schemes
1.30. In 1998, A New Deal for Trunk Roads in England listed the A2/A282 Dartford Improvement along with two other schemes (A2 Bean – Cobham Widening Phase 1 and Phase 2) as ‘inter-linked schemes which would form part of an integrated transport strategy providing enhanced access to a major regional regeneration area – Kent Thames-side – and other

Post Opening Project Evaluation A2/A282 Dartford Improvement & M25 Jn 1b-Jn 3 Widening - Five Year After Study
15
regeneration areas in North and East Kent...... alleviating congestion and safety problems and helping to support jobs and prosperity’.
1.31. The M25 motorway between Jn 1b and Jn 3 was originally identified for improvement in the late 1980s. In April 2004 it was announced that several schemes arising from the M25 London Orbital Multimodal Study (ORBIT) had been included in the Targeted Programme of Improvements (TPI2) for Trunk Roads in England. The widening of M25 Jn 1b to Jn 3 was one of those identified.
1.32. Figure 1-4 shows the history of the two schemes from their entry into the TPI programme onwards.
2 Now known as major Schemes

Post Opening Project Evaluation A2/A282 Dartford Improvement & M25 Jn 1b-Jn 3 Widening - Five Year After Study
16
Figure 1-4 History of the two schemes
A2/A282 Dartford Improvement M25 Jn 1b - Jn 3 widening
1998
1999
2000
2001
2002
2003
2004
2005
2006
2007
2008
2009
2010
2000 - Oct 2001: Reassessment of
preferred scheme and alternatives
Jun - Aug 2002: Public
Consultation
Mar 2003: Draft Orders and ES
Published
Feb 2004: Public Inquiry
Aug 2004: Secretary of State's
Decision
Early 2006: Reassessment of
scheme with Link E deferred
Aug 2006: Start of construction
work
Dec 2007: Scheme open for traffic
Apr 2004: One of five M25 rapid
widening schemes added to TPI programme
Dec 2004: Public Exhibitions
May 2007: Secretary of State's
Decision
Jun 2007: Start of construction
work
Aug 2008: Lanes fully open to
traffic
Jul 1998: Scheme added to TPI
Programme

Post Opening Project Evaluation A2/A282 Dartford Improvement & M25 Jn 1b-Jn 3 Widening - Five Year After Study
17
1.33. It should be noted that following the completion of the M25 widening between Jn 1b and Jn 3, communications and signalling work continued into 2009. These works were in connection with the Controlled Motorway scheme which was implemented between Jn 2 and Jn 3 in May 2012.
Praise for the schemes 1.34. The schemes (packaged together) were completed five months ahead of schedule and
awarded the following:
2007 Constructing Excellence Award – South East England;
2009 Structural Steel Design Awards – commendation;
Royal Society for the Prevention of Accidents (RoSPA) – Gold Award for Occupational Safety; and
Achieved high CEEQUAL3 scores (Whole Team Award) 75.7%
Other Major Schemes Nearby 1.35. A number of other major highway schemes have been implemented during the timeframe
reviewed in this report. These are:
A2/M2 Cobham to Jn 4 widening - opened to traffic in June 2003;
A2 Bean to Cobham Phase 1 (Bean to Pepperhill) – opened to traffic in December 2004; and
A2 Bean to Cobham Phase 2 (Pepperhill to Cobham) – opened to traffic in February 2009.
1.36. The location of these schemes can be seen geographically in Figure 1-5.
Figure 1-5 Other nearby major schemes
3 Civil Engineering Environmental Quality Assessment and Award Scheme

Post Opening Project Evaluation A2/A282 Dartford Improvement & M25 Jn 1b-Jn 3 Widening - Five Year After Study
18
1.37. Other transport infrastructure developments of interest to the timeframe of this study are:
Channel Tunnel Rail Link (CTRL) section 1 now known as High Speed (HS1) from the Channel Tunnel to Fawkham Junction – opened September 2003;
Ebbsfleet International Station – opened November 20074;
HS1 section 2 connecting the new Ebbsfleet station with St. Pancras – full HS1 service opened December 2009.
Post Opening Project Evaluation (POPE)
Highways England’s Appraisal Process
1.38. The Highways England is responsible for improving the strategic highway network (motorways and trunk roads) through the Major Schemes programme. At each key decision stage through the planning process, schemes are subject to a rigorous appraisal process to provide a justification for the project’s continued development.
1.39. When submitting a proposal for a major transport scheme, the Department for Transport (DfT) specifies that an Appraisal Summary Table (AST) is produced which records the degree to which the five Government objectives for Transport (Environment, Safety, Economy, Accessibility and Integration) have been achieved. The contents of the AST allow judgements to be made about the overall value for money of the scheme. The ASTs for these schemes are presented in Appendix A of this report.
Post Opening Project Evaluation
1.40. POPE studies are carried out for all Major Schemes to evaluate the strengths and weaknesses in the techniques used for appraising schemes. This is vital so that improvements can be made in the future. For POPE, this is achieved by comparing information collected before and after the opening of the scheme, against predictions made during the planning process. The outturn impacts of a scheme are summarised in an Evaluation Summary Table (EST) which summarises the extent to which the objectives of a scheme have been achieved. The ESTs for these schemes can also be found in Appendix A of this report.
Key Findings from the OYA Study 1.41. This report follows an earlier report produced in 2010 which presented an evaluation of the
schemes at OYA opening. A summary of the key findings from the OYA evaluation are provided below:
Traffic
Annual Average Daily Traffic (AADT) on the widened section of the A2 had increased by 7 – 8% to 130,000. This growth had occurred particularly during the peak periods when journey time savings were also observed;
44,000 vehicles were observed to be using the new free-flow links daily, rather than needing to use the roundabout;
Traffic using the circulatory had reduced by one third;
Journey times for the traffic using the new free-flow links were up to 2 minutes shorter than for those movements (using the circulatory) prior to the scheme opening;
There was no clear evidence to indicate traffic had rerouted from local roads; and
Annual average traffic flows on the M25 had shown little change and were lower than forecast, however this could be linked to the economic downturn.
Safety
There had been a combined accident saving in the areas covered by the two schemes of 20%, which was statistically significant;
4 operates domestic Highspeed trains and International Eurostar trains.

Post Opening Project Evaluation A2/A282 Dartford Improvement & M25 Jn 1b-Jn 3 Widening - Five Year After Study
19
The observed accident saving in the first 18 months after scheme opening was higher than forecast; and
Traffic cameras were in force during the construction period, and it was considered at OYA that this may have influenced driver behaviour which had continued post-opening, as the signs were still in place in February 2010. This may have contributed towards a higher than expected accident saving.
Environment
Noise, local air quality, greenhouse gases, heritage, and biodiversity impacts were deemed to be as expected;
Landscape and townscape mitigation had been implemented as expected however it was considered too early to establish its success; and
There had been limited data available on translocation of species and on archaeology.
Accessibility
The schemes had improved access to employment and retail for car users; and
Access to Ebbsfleet International Station which opened in 2007 had also been improved by the schemes.
Integration
The schemes’ impacts on the Integration objective have been as expected, with the A2/A282 improvement having an adverse impact on land use policy because of loss of good agricultural land which is against local and national policy objectives;
The M25 Jn 1b – Jn 3 widening had had a neutral impact, as expected.
This Report 1.42. Following this Introduction, this report provides the following sections:
Section 2 – Traffic Analysis. Presents an analysis of the key traffic impacts of the scheme and compares them with the forecast impacts.
Section 3 – Safety. Discusses changes in accident patterns as a result of the scheme.
Section 4 – Economy. Examines what economic impacts of the scheme can be measured and compares these to the forecast benefits.
Section 5 – Environment. A review of the environmental impacts of the scheme is given and supported by an evaluation of the mitigation measures described within the scheme’s Environmental Statement;
Section 6 – Accessibility and Integration. A review of how the scheme has affected accessibility for pedestrians, cyclists and public transport users is presented. Furthermore a review of how the scheme links with wider policy objectives.
Section 7 – Appraisal and Evaluation Summary Tables (AST and EST)
Section 8 - Conclusions
Appendices – including glossary

Post Opening Project Evaluation A2/A282 Dartford Improvement & M25 Jn 1b-Jn 3 Widening - Five Year After Study
20
2. Traffic Analysis
Introduction 2.1. This section of the report uses data from a number of sources which provide a variety of
information. As part of the ‘before’ and ‘after’ monitoring for these schemes, information was obtained from the following sources:
Permanent count data from the TRADs5 database for count locations on Highways England network;
Permanent and temporary automatic traffic count sites monitored by Kent County Council (KCC);
Temporary automatic count sites commissioned specifically for this study;
Moving observer journey time surveys commissioned specifically for the One Year After (OYA) study;
Journey time information extracted from sat-nav6 data for this study;
12 hour turning counts undertaken in 2004 for the purpose of providing base data for the original consultant’s scheme modelling which were subsequently made available for POPE;
12 hour turning count on the M25 J2 circulating roundabout and selected links undertaken in 2009 for the purpose of the OYA study; and
Lane by lane MIDAS data from the A2/A282 junction to extrapolate turning flows at the circulatory for the purpose of this Five Years After (FYA) study.
Purpose of ‘Before’ and ‘After’ data collection
2.2. The purpose of the ‘before’ and ‘after’ traffic analysis is to monitor changes in traffic flows and journey times that may have occurred as a result of the schemes. This section of the report presents data from before scheme construction (2004), one year after (OYA) opening (2009) and five years after (FYA) opening (2013/14).
Approach 2.3. Historically in POPE scheme evaluation, the ‘before’ counts have often been factored to take
account of background traffic growth so that they are directly comparable with the ‘after’ counts. This usually involves the use of National Road Traffic Forecasts (NRTF) with local adjustments made using Trip End Model Presentation Program (TEMPRo).
2.4. However, due to the economic climate which saw widespread reduction in motor vehicle travel in the UK as a whole (since the latter part of 2008), it is no longer deemed appropriate to use this approach of factoring ‘before’ counts to reflect background changes in traffic. Rather, a more considered approach is required in order to assess changes in the vicinity of the scheme within the context of national, regional and locally observed background changes in traffic.
Background Changes in Traffic 2.5. In order to better understand background changes in traffic, it is useful to look at the long term
trends in traffic nationally, regionally and in the local area of the schemes.
5 TRADs is the Highways England website containing traffic flow data from automatic traffic counts on the HA’s strategic network. 6 Motorists who use satellite navigation devices have the option to voluntarily allow anonymous data about their journeys to be collected and used to provide a range of services, including the analysis of historic journey times along specific routes.

Post Opening Project Evaluation A2/A282 Dartford Improvement & M25 Jn 1b-Jn 3 Widening - Five Year After Study
21
National Trends
2.6. The Department for Transport (DfT) produces observed annual statistics for all motor vehicles in billion vehicle kilometres (bvkm) by road type7. At present, this data is available up to 2012. This data between 2004 and 2012 has been used to calculate the factor of change compared to a base year of 2004 on a yearly basis, and is shown in Figure 2-1 for motorways and trunk roads in Great Britain. The reason that 2004 has been chosen as the base year (despite construction of these scheme not starting until 2006, is that much of the ‘before’ data presented later in this section of the report is derived from pre-scheme surveys undertaken in 2004 for the schemes’ appraisals.
Figure 2-1 Nationally Observed Trends by Road Type
2.7. Figure 2-1 shows that:
In 2012, levels of traffic on A roads and minor roads on a national level were still below the pre-scheme levels of 2004; and
On the other hand, motorway traffic was affected less by the economic downturn, and in 2012 was 4% above levels experienced in 2004.
2.8. Therefore the schemes’ impacts should be considered within this wider context of national growth in motorway traffic.
Regional and Local Trends
2.9. Regionally and locally observed changes in traffic levels are also provided by Department for Transport (DfT) Statistics in the form of million vehicle kilometres (mvkm)8, and these have been used to calculate the factor of change by year compared to 2004, for all roads in the South East region, and for the counties of Kent and Medway. This is shown in Figure 2.2.
7 Road Traffic and Speeds Traffic (www.gov.uk/government/organisations/department-for-transport/series/road-traffic-statistics)Table TRA0202. Motor vehicle traffic (vehicle kilometres) by road class in Great Britain. 8 Road Traffic and Speeds Traffic (www.gov.uk/government/organisations/department-for-transport/series/road-traffic-statistics)Table TRA8904. Motor vehicle traffic (vehicle kilometres) by local authority, annual from 1993.
0.94
0.96
0.98
1
1.02
1.04
1.06
2004 2005 2006 2007 2008 2009 2010 2011 2012
Ch
ange
in
Bil
lio
n V
eh
icle
Kil
om
etr
es
(bvk
m)
Year
motorways A' roads Minor Roads

Post Opening Project Evaluation A2/A282 Dartford Improvement & M25 Jn 1b-Jn 3 Widening - Five Year After Study
22
Figure 2-2 Regionally and Locally Observed Trends
2.10. Figure 2-2 shows that:
Regionally as a whole, in 2012 the South East still had levels of traffic well below that experienced in 2004, however Kent was roughly equal to 2004 levels and Medway had seen a small amount of growth; and
This growth which seems to differ to the regional trend may be linked to the large amount of regeneration that has occurred over recent years in the Kent and Medway areas, which is discussed in further detail in Section 4 of this report. In addition to this, the area has seen major improvements to the A2 and M2, and the opening of Ebbsfleet International Station.
2.11. All of these factors must be considered when assessing the changes that have occurred during
the timeframe reported in this evaluation. All subsequent traffic volumes are un-factored and as traffic growth has been negligible in the region and on the balance or roads, traffic volume changes are likely to be due to this scheme or other mitigating factors rather than simply national or regional traffic growth.
0.96
0.97
0.98
0.99
1
1.01
1.02
1.03
1.04
2004 2005 2006 2007 2008 2009 2010 2011 2012
Ch
ange
in
Mil
lio
n V
eh
icle
Kil
om
etr
es
(mvk
m)
Year
South East Kent Medway

Post Opening Project Evaluation A2/A282 Dartford Improvement & M25 Jn 1b-Jn 3 Widening - Five Year After Study
23
A2/M25 Trends
2.12. Figure 2.3 shows the long term trend in 24hr Average Weekday Traffic (AWT) since 1999 on the A2 (sections directly west of and east of the A282 (M25 Jn 2). The opening of the other three nearby major schemes are also marked on the graph for information, as well as the construction periods for the A2/A282 Dartford Improvement and the M25 Jn 1b – Jn 3 widening.
Figure 2-3 Long term trends in AWT on A2
2.13. Figure 2-3 shows that:
There has been long term growth in traffic levels on the A2 either side of the A282 (M25 Jn 2) and this does not correspond to the national pattern for trunk roads in Great Britain (shown in Figure 2.1). This pattern of growth is more significant east of the junction; and
This steady growth can be linked to the improvements along the A2 and M2 occurring both before and after the opening of the two schemes which are the subject of this report.
2.14. Figure 2-4 shows long term trends in 24hr AWT along the M25 south of the A2/A282 (M25 Jn 2) junction.
40,000
45,000
50,000
55,000
60,000
65,000
70,000
75,000
80,000
24
hr
Ave
rage
We
ekd
ay T
raff
ic
Month
West of A282 E/B West of A282 W/B East of A282 E/B East of A282 W/B
A2/A282 scheme
construction
M25 J1b-3scheme
construction
A2 Bean Cobham Phase 1 (Been to Pepperhill) Opening
A2 Bean Cobham Phase 2 (Pepperhill to Cobham) Opening
A2/M2 Cobham - Jn 4 wideningOpening
Scheme open to traffic Dec 2007
Schemeopen to
traffic Aug 2008

Post Opening Project Evaluation A2/A282 Dartford Improvement & M25 Jn 1b-Jn 3 Widening - Five Year After Study
24
Figure 2-4 Long term trends in AWT on M25
2.15. Figure 2-4 indicates:
South of Jn 2, where the M25 has been widened in both directions, flows are at a similar level to those observed immediately prior to the start of construction of the widening scheme and they are still lower than that observed in 2004 when they were at their highest; and
This is perhaps a surprising result given the widening, which will have increased capacity of the link in both directions, however there are likely to be a number of factors at play including the economic downturn, and the fact that this pattern of ‘little change’ is also seen on the section of the M25 to the south of this link (Jn 3 – Jn 4). There have also been changes to the toll charge on the Dartford Crossing which may have influenced trends on the M25. Prior to November 2008, the tolls were; £1 - cars, £1.80 - 2 axles, £2.90 – multi axle good vehicles. In November 2008 they were; £1.50 – cars, £2.00 – 2 axles, £3.70 – multi axle goods vehicles and no charge for any vehicle between 10pm and 6am. From October 2012 the charges were; £2 – cars, £2.50 – 2 axles, £5 multi axle goods vehicles. These complexities are explored later in this report.
Traffic Volume Analysis 2.16. The ‘before’ data for this part of the evaluation has been derived from 12 hour (07:00 – 19:00)
turning counts undertaken in 2004 for the purpose of providing base data for the original consultant’s scheme modelling. Although more continuous count data from permanent count sites is now available on most of the links of interest, in order to compare like-for-like, one year after (OYA) and five years after (FYA) data is also presented here as 12hr flows on an average weekday. Figure 2-5 shows 12hr flows for various locations around the junction of the A2/A282 (M25 Jn 2). The sites are numbered in a clockwise manner starting to the north of the junction.
2.17. For the purposes of comparison, for the new free-flow link movements, a ‘before’ flow is provided in asterisks to denote the amount of traffic making the same movement prior to the scheme, however these movements would have involved using the circulatory.
20,000
30,000
40,000
50,000
60,000
70,000
80,000
90,000
24
hr
Ave
rage
We
ekd
ay T
raff
ic
Month
M25 Jn 2 - Jn 3 N/B M25 Jn 2 - Jn 3 S/B
A2/A282 scheme
construction
M25 J1b-3scheme
construction
A2 Bean Cobham Phase 1 (Been to Pepperhill) Opening
A2 Bean Cobham Phase 2 (Pepperhill to Cobham) Opening
A2/M2 Cobham - Jn 4 wideningOpening
Scheme open to traffic Dec 2007
Schemeopen to
traffic Aug 2008

Post Opening Project Evaluation A2/A282 Dartford Improvement & M25 Jn 1b-Jn 3 Widening - Five Year After Study
25
2.18. The following observations can be made from Figure 2-5:
The most significant changes in flow have occurred to the east and north of the circulatory. This is as would be expected given the new free-flow movements which have been created by the scheme;
The new flyover from the A2 westbound to M25 northbound (Site 4) has greatly reduced the amount of traffic on the westbound off slip of the A2 (Site 5). This traffic would previously have used the circulatory. The flows on the westbound off slip (Site 5) have reduced by more than 30%, from 19,600 to 13,000 over a 12hr period;
The new dedicated slip road from the A2 westbound to M25 southbound (Site 7) has further reduced the amount of traffic entering the circulatory (Site 6). With approximately 9,800 using the new dedicated slip road (Site 7), only 3,200 originating from the A2 westbound use the circulatory. This latter figure was 19,600 (Site 5) in the ‘before’ period, therefore showing an 84% reduction;
Traffic exiting the M25/A282 southbound via the circulatory (Site 1) has reduced from 17,400 to 12,900 over a 12hr period. This is a 26% reduction. The new flyover from M25/A282 southbound to A2 eastbound (Site 2) now carries 14,500 (12hr);
Previously, traffic wishing to access either the M25 north or the link road from the circulatory used to exit the roundabout via one slip road which bifurcated9 onto the M25 and link road. Post-scheme, these two movements now leave the circulatory at separate points (Sites 15 and 16). Combining the FYA flows at these two sites, 3,800 and 10,000, respectively, shows that there has been a notable increase in traffic making northbound movements from the circulatory.
Traffic using the Circulatory
2.19. From the flows provided in Figure 2-5, it is calculated at FYA10 (for a 12hr period) that there are 42,700 vehicles using the circulatory of the A2/A282 junction. This is compared to 65,300 in the ‘before’ situation and 42,200 at OYA. This therefore represents a 35% reduction at OYA and a 35% reduction at FYA, demonstrating that the circulatory has continued to be relieved of this traffic since OYA.
2.20. Figure 2-6 shows 12hr flows over a wider area extending beyond the scheme limits along the M25 and A2. It should be noted that the flows at Site 23 northbound and southbound relate to both M25 and link road traffic and include flows from Sites 1 and 16 from Figure 2-5. The sites are numbered sequentially from south to north.
9 to fork or divide into two branches 10 N/B off slip flows to circulatory at FYA have been estimated by using observed increase on slip road and a proxy of the split in the before flows.

Post Opening Project Evaluation A2/A282 Dartford Improvement & M25 Jn 1b-Jn 3 Widening - Five Year After Study
26
Figure 2-5 12hr flows at A2/A282 (M25 Jn 2)

Post Opening Project Evaluation A2/A282 Dartford Improvement & M25 Jn 1b-Jn 3 Widening - Five Year After Study
27
Figure 2-6 12hr flows around the scheme area

Post Opening Project Evaluation A2/A282 Dartford Improvement & M25 Jn 1b-Jn 3 Widening - Five Year After Study
28
2.21. Figure 2-6 shows the following:
In the scheme area, the growth in traffic that has occurred between the ‘before’ and FYA periods has been entirely around M25 Jn 2, and not on the M25 south of Jn 2;
Surprisingly, Jn 2 – Jn 3 of the M25 (Site 20) which has been widened in each direction, has not shown an increase, but a slight reduction in traffic flows. The FYA data for both directions has been verified by comparing the data from one or more standalone count sites with calculated data derived from the slips and ‘through’ sites at Jn 3. This exercise has confirmed that the FYA flows are robust. Due to a lack of count sites available in the ‘before’ period, similar checks could not be done for the ‘before’ period, however the reduction is consistent with the reduction seen in each direction between Jn 3 – Jn 4 (Site 17), and is therefore considered to be robust;
This lack of growth between Jn 2 – Jn 3 may be attributable to effects of the economic downturn, and/or due to some strategic reassignment between the M20 and the A2. The latter is hard to confirm due to the lack of count data on the M20 (Site 18), however traffic has increased noticeably on the A2 (Site 22) by a similar amount to the reduction seen between M25 Jn 2 – Jn 3. It must also be remembered that the A2 has been improved (with the A2/A282 Dartford improvement and 2 other schemes described in Section 1) and is likely to offer a more attractive route for some traffic rather than using the M20; and
It can also be concluded from Figure 2-6 (and Figure 2-5), that a good proportion of the growth experienced just north of the A2/A282/M25 Jn 2 (Site 23) is from an increase in A2 westbound – M25 north movements, and vice versa. Such growth may also be linked to the opening of Ebbsfleet International in 2007 and further developments at Bluewater shopping centre.
Local Roads
2.22. Average Weekday Traffic (AWT) flows are shown in Figure 2-7.

Post Opening Project Evaluation A2/A282 Dartford Improvement & M25 Jn 1b-Jn 3 Widening - Five Year After Study
29
Figure 2-7 24hr AWTs on Local Roads
2.23. It can be seen from Figure 2-7 that:
The most noticeable increase in traffic volumes (more than 12%) has occurred on the A296 east of M25 Jn 1b (Site D). This section of the A296 can be used as a route to Bluewater retail centre, and is a parallel route to the improved A2 east of M25 Jn 2. Closer inspection of the data at this site (Site D) shows that the largest increase between ‘before’ and FYA flows has occurred in the westbound direction. In comparison, the A2 east of Jn 2 shows a larger increase in the eastbound direction (Site 22). This may indicate that the scheme has affected the way in which some traffic particularly that originating from the south, accesses the Bluewater retail centre. As the M25 between Jn 3 and Jn 2 has been widened in the southbound direction only, more traffic may be using that route on their return journey.

Post Opening Project Evaluation A2/A282 Dartford Improvement & M25 Jn 1b-Jn 3 Widening - Five Year After Study
30
Elsewhere, at sites A and B, growth has been negligible, indicating that the scheme has had little impact on traffic using the A20 in the vicinity of M25 Jn 3 (Site A), or the parallel route to the M25 (A225 Site B). From this it can be concluded that the schemes have not attracted traffic away from these strategic routes.
No change in traffic can be seen at Site C, although it should be noted that this data is taken from DfT Core Census sites which are based on single day counts and therefore considered less robust. It is reasonable however to conclude that this may indeed be accurate, given that elsewhere, the majority of traffic growth recorded has been to the east of the M25 and not to the west.
Turning Movements at A2/A282 M25 Jn 2 2.24. An objective of both schemes was to improve journey times and reliability, and for the A2/A282
Dartford Improvement more particularly to improve safety at the junction. In the ‘before’ situation, the circulatory was heavily trafficked with delays occurring regularly and queues at peak hours often extending back onto the main carriageways. Conflicts occurred between traffic bound for the Dartford Crossings and local traffic accessing Dartford via Jn 1b.
2.25. A key feature of the A2/A282 Dartford Improvement was the provision of free-flow links which benefit users making certain turning movements that had previously used the circulatory. These are:
A2 westbound to M25 northbound;
M25 southbound to A2 eastbound; and
A2 westbound to M25 southbound.
2.26. The key movements which now need to use the circulatory are:
From A2 eastbound to: - M25 (A282) northbound; - Link road to Jn 1b; - M25 southbound.
From M25 (A282) southbound to: - A2 westbound.
From link road to: - A2 eastbound; - A2 westbound; - M25 southbound.
From M25 northbound to: - A2 eastbound; - Link road to Dartford
From A2 westbound to: - Link road to Jn 1b.
2.27. In order to get greater understanding of the turning movements at the junction, lane by lane
MIDAS data at FYA has been analysed to produce an indication of turning movement counts. However, the following caveats should be noted:
A number of assumptions had to be made regarding lane discipline at the junction;
It was assumed there were no U-turns;
Check counts at independent sites to the calculations did reveal some variation between MIDAS loops on the same links; and
A number of movements needed to be calculated from more than one set of MIDAS loops, or from other calculated flows, and this may have compounded the margin of error in the resulting flow.
2.28. As a basis for comparison, turning count data has been taken from a 12hr survey undertaken
for the appraisal survey work in 2004. It should be noted that this ‘before’ data is therefore
Post Opening Project Evaluation A2/A282 Dartford Improvement & M25 Jn 1b-Jn 3 Widening - Five Year After Study
31
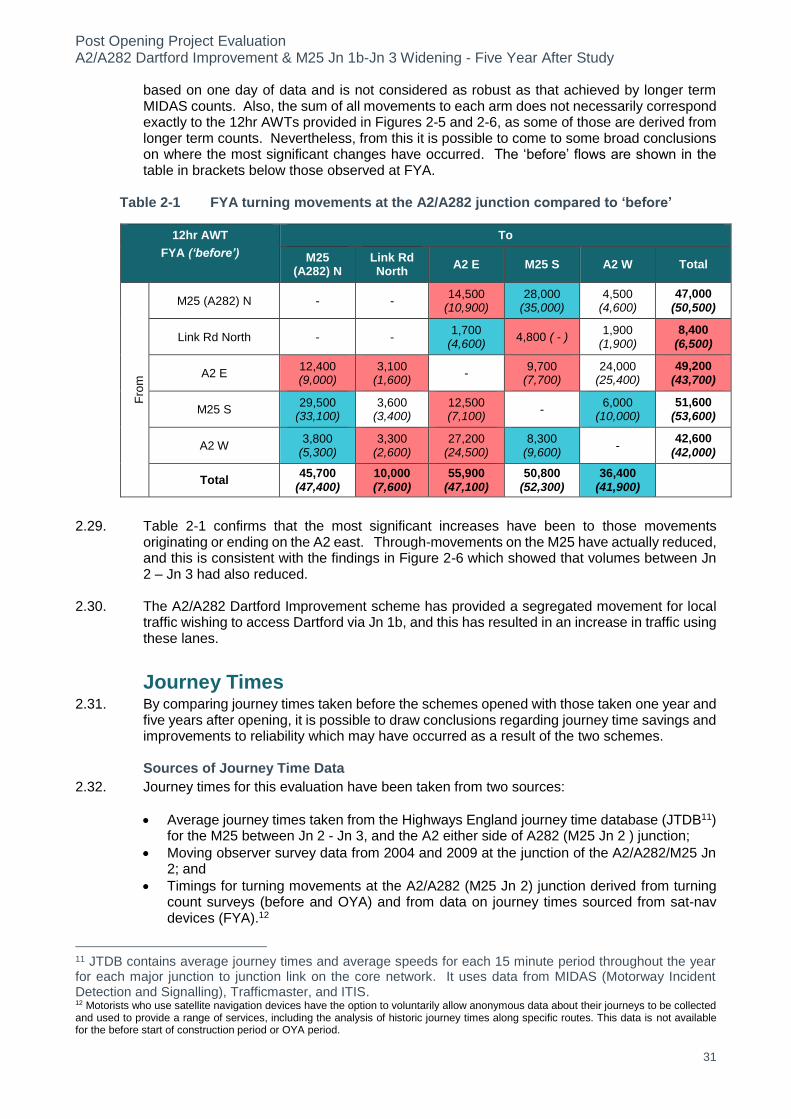
based on one day of data and is not considered as robust as that achieved by longer term MIDAS counts. Also, the sum of all movements to each arm does not necessarily correspond exactly to the 12hr AWTs provided in Figures 2-5 and 2-6, as some of those are derived from longer term counts. Nevertheless, from this it is possible to come to some broad conclusions on where the most significant changes have occurred. The ‘before’ flows are shown in the table in brackets below those observed at FYA.
Table 2-1 FYA turning movements at the A2/A282 junction compared to ‘before’
12hr AWT
FYA (‘before’)
To
M25 (A282) N
Link Rd North
A2 E M25 S A2 W Total
Fro
m
M25 (A282) N - - 14,500
(10,900) 28,000
(35,000) 4,500
(4,600) 47,000
(50,500)
Link Rd North - - 1,700
(4,600) 4,800 ( - )
1,900 (1,900)
8,400
(6,500)
A2 E 12,400 (9,000)
3,100 (1,600)
- 9,700
(7,700) 24,000
(25,400) 49,200
(43,700)
M25 S 29,500
(33,100) 3,600
(3,400) 12,500 (7,100)
- 6,000
(10,000) 51,600
(53,600)
A2 W 3,800
(5,300) 3,300
(2,600) 27,200
(24,500) 8,300
(9,600) -
42,600
(42,000)
Total 45,700
(47,400) 10,000 (7,600)
55,900 (47,100)
50,800 (52,300)
36,400 (41,900)
2.29. Table 2-1 confirms that the most significant increases have been to those movements originating or ending on the A2 east. Through-movements on the M25 have actually reduced, and this is consistent with the findings in Figure 2-6 which showed that volumes between Jn 2 – Jn 3 had also reduced.
2.30. The A2/A282 Dartford Improvement scheme has provided a segregated movement for local traffic wishing to access Dartford via Jn 1b, and this has resulted in an increase in traffic using these lanes.
Journey Times 2.31. By comparing journey times taken before the schemes opened with those taken one year and
five years after opening, it is possible to draw conclusions regarding journey time savings and improvements to reliability which may have occurred as a result of the two schemes.
Sources of Journey Time Data
2.32. Journey times for this evaluation have been taken from two sources:
Average journey times taken from the Highways England journey time database (JTDB11) for the M25 between Jn 2 - Jn 3, and the A2 either side of A282 (M25 Jn 2 ) junction;
Moving observer survey data from 2004 and 2009 at the junction of the A2/A282/M25 Jn 2; and
Timings for turning movements at the A2/A282 (M25 Jn 2) junction derived from turning count surveys (before and OYA) and from data on journey times sourced from sat-nav devices (FYA).12
11 JTDB contains average journey times and average speeds for each 15 minute period throughout the year for each major junction to junction link on the core network. It uses data from MIDAS (Motorway Incident Detection and Signalling), Trafficmaster, and ITIS. 12 Motorists who use satellite navigation devices have the option to voluntarily allow anonymous data about their journeys to be collected and used to provide a range of services, including the analysis of historic journey times along specific routes. This data is not available for the before start of construction period or OYA period.
Post Opening Project Evaluation A2/A282 Dartford Improvement & M25 Jn 1b-Jn 3 Widening - Five Year After Study
32
Change in Average Journey Times on mainline links (A2/M25)
2.33. It has not been possible to include JTDB data for M25 Jn 1b – Jn 2 for the following reasons:
Upon inspection of the data in the ‘before’ period, the JTDB link from which average times are given is based on a link length between coordinates that place it within Jn 2 only and not between Jn 1b and Jn 2;
The OYA data for the same link length is no longer available on JTDB;
FYA data is based on a link length that does cover the correct link between Jn 1b and Jn 2, however comparing this with the ‘before’ data is meaningless and produces an increase in journey times because the link length is clearly longer;
Creating proxy journey times was initially considered, however due to the fact that the data was based on such a short distance in the ‘before’ period, and the quality of the JTDB data was also of low quality, it was deemed that this approach would not produce robust results;
It has not been possible to supplement the OYA and FYA data with ‘before’ data from sat-nav journey time data because that data source is not available for that period.
2.34. Clearly it is disappointing not to be able to present a comparison of before and after journey times for M25 Jn 1b – Jn 2 in this evaluation, however it has not been possible with the data that is available.
2.35. Table 2.2 presents average journey times in the AM peak, inter-peak, and PM peak for the mainline links adjoining the M25 Jn 2. ‘Before’ data is taken from June 2006, OYA data is for June 2009, and FYA data relates to June 2013. Bank Holidays and weekends were excluded from the analysis.
2.36. The time periods for the analysis were as follows:
AM Peak 07:00 – 10:00
Inter-Peak 10:00 – 16:00
PM Peak 16:00 – 19:00

Post Opening Project Evaluation A2/A282 Dartford Improvement & M25 Jn 1b-Jn 3 Widening - Five Year After Study
33
Table 2-2 Average Journey Times on M25 Jn 2 – Jn 3 and A2 either side of A2/A282 junction
Section
Direction
Time period
Average Journey Time (mm:ss)
Jun '06
‘Before’
Jun '09
OYA
Time Saving at
OYA
Jun '13
FYA
Time Saving at
FYA
M25 Jn 2 – Jn 3
N/B
AM 03:44 02:40 01:04 03:13 00:31
IP 03:24 03:14 00:10 03:38 -00:14
PM 05:33 03:11 02:22 03:53 01:40
S/B
AM 03:18 03:18 00:00 03:12 00:06
IP 02:59 02:47 00:02 03:08 -00:07
PM 03:05 02:44 00:21 03:01 00:04
A2 between A282 (M25 Jn 2) and A296 (east of
scheme)
E/B
AM 01:54 01:48 00:06 01:48 00:06
IP 01:57 01:51 00:06 01:51 00:06
PM 02:28 01:59 00:29 02:01 00:27
W/B
AM 02:10 01:42 00:28 01:53 00:17
IP 01:42 01:41 00:01 01:41 00:01
PM 01:41 01:38 00:03 01:39 00:02
A2 between A282 (M25 Jn 2 and A2018 (west of
scheme)
E/B
AM 02:45 02:43 00:02 02:30 00:15
IP 02:48 02:45 00:03 02:30 00:18
PM 03:17 02:57 00:20 02:42 00:35
W/B
AM 03:30 03:22 00:08 02:20 01:10
IP 02:48 03:21 -00:33 02:20 00:28
PM 02:47 03:28 -00:41 02:18 00:29
2.37. Initial observations suggest that at FYA the most significant time savings have been northbound on the M25 Jn 2 – Jn 3 in the PM peak and on the A2 westbound, west of the A2/A282 junction in the AM peak (both showing savings of more than a minute). Consideration should also be given to the fact that the Controlled Motorway scheme between M25 Jn 2 – Jn 3 opened in May 2012 i.e. between the OYA and FYA data periods. Data suggests that time savings on this section are smaller at FYA than at OYA, however this is not necessarily an indication that the controlled motorway has not improved congestion on that link. An assessment of reliability impacts is provided in Chapter 4 of this report.
2.38. As Table 2-2 only presents an average hourly saving in each of the time periods, it is necessary to look at the hourly data in more detail in order to form more robust conclusions.
2.39. Journey times have also therefore been analysed on an hourly basis in order to look at variability across the day. This information is shown for the M25 graphically in Figures 2-8 to 2-9.

Post Opening Project Evaluation A2/A282 Dartford Improvement & M25 Jn 1b-Jn 3 Widening - Five Year After Study
34
Figure 2-8 Average journey times by hour: M25 Jn 2 - Jn 3 Northbound
01:00
02:00
03:00
04:00
05:00
06:01
07:01
06:0
0 -
06:1
5
06:3
0 -
06:4
5
07:0
0 -
07:1
5
07:3
0 -
07:4
5
08:0
0 -
08:1
5
08:3
0 -
08:4
5
09:0
0 -
09:1
5
09:3
0 -
09:4
5
10:0
0 -
10:1
5
10:3
0 -
10:4
5
11:0
0 -
11:1
5
11:3
0 -
11:4
5
12:0
0 -
12:1
5
12:3
0 -
12:4
5
13:0
0 -
13:1
5
13:3
0 -
13:4
5
14:0
0 -
14:1
5
14:3
0 -
14:4
5
15:0
0 -
15:1
5
15:3
0 -
15:4
5
16:0
0 -
16:1
5
16:3
0 -
16:4
5
17:0
0 -
17:1
5
17:3
0 -
17:4
5
18:0
0 -
18:1
5
18:3
0 -
18:4
5
19:0
0 -
19:1
5
19:3
0 -
19:4
5
20:0
0 -
20:1
5
20:3
0 -
20:4
5
21:0
0 -
21:1
5
21:3
0 -
21:4
5
Avera
ge J
ou
rney T
ime (m
m:s
s)
Time Interval Before OYA FYA
0
0

Post Opening Project Evaluation A2/A282 Dartford Improvement & M25 Jn 1b-Jn 3 Widening - Five Year After Study
35
Figure 2-9 Average journey times by hour: M25 Jn 2 - Jn 3 Southbound
01:00
01:30
02:00
02:30
03:00
03:30
04:00
04:30
06:0
0 -
06:1
5
06:3
0 -
06:4
5
07:0
0 -
07:1
5
07:3
0 -
07:4
5
08:0
0 -
08:1
5
08:3
0 -
08:4
5
09:0
0 -
09:1
5
09:3
0 -
09:4
5
10:0
0 -
10:1
5
10:3
0 -
10:4
5
11:0
0 -
11:1
5
11:3
0 -
11:4
5
12:0
0 -
12:1
5
12:3
0 -
12:4
5
13:0
0 -
13:1
5
13:3
0 -
13:4
5
14:0
0 -
14:1
5
14:3
0 -
14:4
5
15:0
0 -
15:1
5
15:3
0 -
15:4
5
16:0
0 -
16:1
5
16:3
0 -
16:4
5
17:0
0 -
17:1
5
17:3
0 -
17:4
5
18:0
0 -
18:1
5
18:3
0 -
18:4
5
19:0
0 -
19:1
5
19:3
0 -
19:4
5
20:0
0 -
20:1
5
20:3
0 -
20:4
5
21:0
0 -
21:1
5
21:3
0 -
21:4
5
Avera
ge J
ou
rney T
ime (m
m:s
s)
Time Interval Before OYA FYA
Post Opening Project Evaluation A2/A282 Dartford Improvement & M25 Jn 1b-Jn 3 Widening - Five Year After Study
36
2.40. Figures 2-8 – 2-9 show that:
South of the A2/A282 (M25 Jn 2), journey times are less variable than before the scheme opened. At FYA, in the southbound direction between Jn 2 – Jn 3, there is hardly any variation in journey times across the day, whereas ‘before’ and at OYA, there were longer journey times experienced in the AM peak. The widening along this section has therefore helped to improve the uniformity of journey times across the day; and
There have also been beneficial impacts on journey times northbound between Jn 2 – Jn 3. Most significantly these savings can be seen in the PM, with smaller savings in the AM peak. In the Inter-peak however, journey times at FYA are longer. So whilst journey times are slightly less variable at FYA, some dis-benefits in the Inter-peak are being experienced. Possible reasons for this are mentioned below.
Impacts of Controlled Motorway: M25 Jn 2 – Jn 3
2.41. It should be borne in mind that a Controlled Motorway scheme between Jn 2 – Jn 3 of the M25 opened in September 2012, after the OYA data, and therefore average journey times at FYA shown in Figures 2-8 and 2-9 will have been affected by that scheme.
2.42. It can be seen from Figures 2-8 and 2-9 that there is greater uniformity of journey times at FYA than at OYA, the latter of these can be considered as a ‘before’ or ‘baseline’ data-set for the Controlled Motorway scheme.
2.43. Controlled motorways use sensors in the road surface to detect the speed, volume and flow of traffic. The system calculates the best speed to keep traffic moving, reducing the level of ‘stop-start’ traffic which leads to congestion. It is likely therefore, that the improvements to journey times consistency seen between 2009 and 2013 are as a result of the Controlled Motorway as well as the continuing benefits of the two main schemes. However, some of the disbenefits experienced in the inter-peak for example may be due to the activation of the speed limits, as it is likely that the controlled motorway limits speeds more often in this time period, with higher flows, but controlled speed limits reducing the speeds.
Average journey times by hour on the A2
2.44. The equivalent information on average journey times by hour across the day has been analysed for the A2 for the sections directly to the east and west of the A282/M25 junction. These are shown graphically in Figures 2-10 to 2-14.

Post Opening Project Evaluation A2/A282 Dartford Improvement & M25 Jn 1b-Jn 3 Widening - Five Year After Study
37
Figure 2-10 Average journey times by hour: A2 east of A282 (M25 Jn 2) Eastbound
01:00
01:15
01:30
01:45
02:00
02:15
02:30
02:45
03:00
06:0
0 -
06:1
5
06:3
0 -
06:4
5
07:0
0 -
07:1
5
07:3
0 -
07:4
5
08:0
0 -
08:1
5
08:3
0 -
08:4
5
09:0
0 -
09:1
5
09:3
0 -
09:4
5
10:0
0 -
10:1
5
10:3
0 -
10:4
5
11:0
0 -
11:1
5
11:3
0 -
11:4
5
12:0
0 -
12:1
5
12:3
0 -
12:4
5
13:0
0 -
13:1
5
13:3
0 -
13:4
5
14:0
0 -
14:1
5
14:3
0 -
14:4
5
15:0
0 -
15:1
5
15:3
0 -
15:4
5
16:0
0 -
16:1
5
16:3
0 -
16:4
5
17:0
0 -
17:1
5
17:3
0 -
17:4
5
18:0
0 -
18:1
5
18:3
0 -
18:4
5
19:0
0 -
19:1
5
19:3
0 -
19:4
5
20:0
0 -
20:1
5
20:3
0 -
20:4
5
21:0
0 -
21:1
5
21:3
0 -
21:4
5
Avera
ge J
ou
rney T
ime (m
m:s
s)
Time Interval Before OYA FYA

Post Opening Project Evaluation A2/A282 Dartford Improvement & M25 Jn 1b-Jn 3 Widening - Five Year After Study
38
Figure 2-11 Average journey times by hour: A2 east of A282 (M25 Jn 2) Westbound
01:00
01:15
01:30
01:45
02:00
02:15
02:30
02:45
03:00
06:0
0 -
06:1
5
06:3
0 -
06:4
5
07:0
0 -
07:1
5
07:3
0 -
07:4
5
08:0
0 -
08:1
5
08:3
0 -
08:4
5
09:0
0 -
09:1
5
09:3
0 -
09:4
5
10:0
0 -
10:1
5
10:3
0 -
10:4
5
11:0
0 -
11:1
5
11:3
0 -
11:4
5
12:0
0 -
12:1
5
12:3
0 -
12:4
5
13:0
0 -
13:1
5
13:3
0 -
13:4
5
14:0
0 -
14:1
5
14:3
0 -
14:4
5
15:0
0 -
15:1
5
15:3
0 -
15:4
5
16:0
0 -
16:1
5
16:3
0 -
16:4
5
17:0
0 -
17:1
5
17:3
0 -
17:4
5
18:0
0 -
18:1
5
18:3
0 -
18:4
5
19:0
0 -
19:1
5
19:3
0 -
19:4
5
20:0
0 -
20:1
5
20:3
0 -
20:4
5
21:0
0 -
21:1
5
21:3
0 -
21:4
5
Avera
ge J
ou
rney T
ime (m
m:s
s)
Time Interval Before OYA FYA

Post Opening Project Evaluation A2/A282 Dartford Improvement & M25 Jn 1b-Jn 3 Widening - Five Year After Study
39
Figure 2-12 Average journey times by hour: A2 west of A282 (M25 Jn 2) Eastbound
01:00
01:30
02:00
02:30
03:00
03:30
04:00
06:0
0 -
06:1
5
06:3
0 -
06:4
5
07:0
0 -
07:1
5
07:3
0 -
07:4
5
08:0
0 -
08:1
5
08:3
0 -
08:4
5
09:0
0 -
09:1
5
09:3
0 -
09:4
5
10:0
0 -
10:1
5
10:3
0 -
10:4
5
11:0
0 -
11:1
5
11:3
0 -
11:4
5
12:0
0 -
12:1
5
12:3
0 -
12:4
5
13:0
0 -
13:1
5
13:3
0 -
13:4
5
14:0
0 -
14:1
5
14:3
0 -
14:4
5
15:0
0 -
15:1
5
15:3
0 -
15:4
5
16:0
0 -
16:1
5
16:3
0 -
16:4
5
17:0
0 -
17:1
5
17:3
0 -
17:4
5
18:0
0 -
18:1
5
18:3
0 -
18:4
5
19:0
0 -
19:1
5
19:3
0 -
19:4
5
20:0
0 -
20:1
5
20:3
0 -
20:4
5
21:0
0 -
21:1
5
21:3
0 -
21:4
5
Avera
ge J
ou
rney T
ime (m
m:s
s)
Time Interval Before OYA FYA

Post Opening Project Evaluation A2/A282 Dartford Improvement & M25 Jn 1b-Jn 3 Widening - Five Year After Study
40
Figure 2-13 Average journey times by hour: A2 west of A282 (M25 Jn 2) Westbound
01:00
01:30
02:00
02:30
03:00
03:30
04:00
06:0
0 -
06:1
5
06:3
0 -
06:4
5
07:0
0 -
07:1
5
07:3
0 -
07:4
5
08:0
0 -
08:1
5
08:3
0 -
08:4
5
09:0
0 -
09:1
5
09:3
0 -
09:4
5
10:0
0 -
10:1
5
10:3
0 -
10:4
5
11:0
0 -
11:1
5
11:3
0 -
11:4
5
12:0
0 -
12:1
5
12:3
0 -
12:4
5
13:0
0 -
13:1
5
13:3
0 -
13:4
5
14:0
0 -
14:1
5
14:3
0 -
14:4
5
15:0
0 -
15:1
5
15:3
0 -
15:4
5
16:0
0 -
16:1
5
16:3
0 -
16:4
5
17:0
0 -
17:1
5
17:3
0 -
17:4
5
18:0
0 -
18:1
5
18:3
0 -
18:4
5
19:0
0 -
19:1
5
19:3
0 -
19:4
5
20:0
0 -
20:1
5
20:3
0 -
20:4
5
21:0
0 -
21:1
5
21:3
0 -
21:4
5
Avera
ge J
ou
rney T
ime (m
m:s
s)
Time Interval Before OYA FYA

Post Opening Project Evaluation A2/A282 Dartford Improvement & M25 Jn 1b-Jn 3 Widening - Five Year After Study
41
2.45. The following can be observed regarding journey times on the A2:
To the east of the A282, improvements to journey times in the peaks can be observed (westbound AM peak, and eastbound PM peak). This section has been widened from 3 to 4 lanes in each direction as part of the A2/A282 Dartford Improvement scheme. It can therefore be seen that despite the considerable increase in traffic using this link (around 12% eastbound, and 8% westbound), journey times are less variable throughout the day than they were before the scheme opened;
Traffic heading in the westbound direction along this link will have also benefited from the free-flow link road to M25 northbound which has reduced the amount of traffic exiting the A2 at the circulatory, which was known to queue back onto the mainline carriageway at peak times in the ‘before’ situation;
At FYA, there are still increases in journey times during the peaks, and the graphs show some worsening of times between OYA and FYA indicating that benefits may be eroding over time;
West of the schemes, for traffic heading eastbound on the A2 towards the A282 junction, journey times have also improved, and at almost all times of the day. There is still an increase in journey times during the PM peak, but it is less pronounced than in the pre-scheme situation. This is a positive result given that the schemes have not provided any improvement to this section of the A2, and Link – E which would have provided a free-flow link to M25 northbound and was in the original scheme design, has been deferred.
For westbound traffic heading away from the A2/A282 junction, it is not possible to draw any robust conclusions on whether the scheme has had any impact. The OYA and FYA data from the JTDB for this section is of ‘low quality’ and has produced significantly inconsistent results (as shown in Figure 2-13).
Journey times for turning movements at A2/A282 junction 2.46. Journey times for the turning movements at the A2/A282 junction are based on the following:
Moving observer data collected from surveys undertaken at OYA and in 2004 for the appraisal (before data); and
Journey time information extracted from sat-nav data for this FYA study13.
2.47. Moving observer data is based on a more limited sample than sat-nav but it can be indicative of changes that have occurred. Improving journey times for traffic using the junction was a key objective of the A2/A282 Dartford Improvement scheme.
2.48. Figures 2-14 to 2-20 show the routes which have been analysed together with the journey times in the AM peak, inter-peak and PM peak. No ‘before’ data was available for the existing single free flow link between M25 northbound and A2 westbound, therefore this route is not included in the analysis. This part of the junction was not altered in any way by the A2/A282 scheme, so the exclusion of this route is not considered to be an issue. Where a new free-flow link is now available for a movement, this is provided for the ‘after’ journey times and compared to the journey time for making the same movement via the circulatory in the ‘before’ period. It should be noted that during the OYA moving observer surveys, a serious accident affected Routes 1, 5, and 7 in the PM peak, and therefore these figures have been omitted.
13 Motorists who use satellite navigation devices have the option to voluntarily allow anonymous data about their journeys to be collected and used to provide a range of services, including the analysis of historic journey times along specific routes.

Post Opening Project Evaluation A2/A282 Dartford Improvement & M25 Jn 1b-Jn 3 Widening - Five Year After Study
42
Figure 2-14 Route 1: A2 westbound to M25 N/B using new free flow link road - 2.3km
Figure 2-15 Route 2: A2 westbound to M25 S/B using segregated slip lane 2.4km

Post Opening Project Evaluation A2/A282 Dartford Improvement & M25 Jn 1b-Jn 3 Widening - Five Year After Study
43
Figure 2-16 Route 3: A2 eastbound to M25 N/B using circulatory – 1.4km
Figure 2-17 Route 4: A2 eastbound to M25 S/B using circulatory – 1.8km
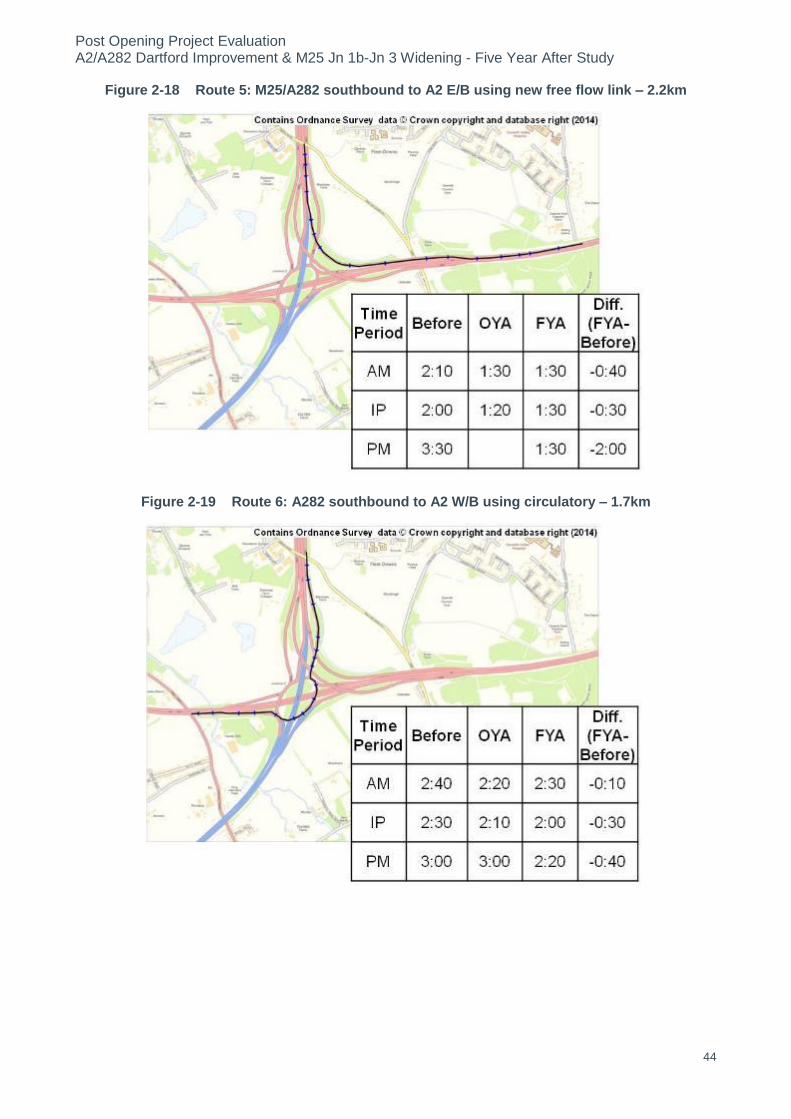
Post Opening Project Evaluation A2/A282 Dartford Improvement & M25 Jn 1b-Jn 3 Widening - Five Year After Study
44
Figure 2-18 Route 5: M25/A282 southbound to A2 E/B using new free flow link – 2.2km
Figure 2-19 Route 6: A282 southbound to A2 W/B using circulatory – 1.7km

Post Opening Project Evaluation A2/A282 Dartford Improvement & M25 Jn 1b-Jn 3 Widening - Five Year After Study
45
Figure 2-20 Route 7: M25 northbound to A2 E/B using circulatory – 2.6km
2.49. Figures 2-14 to 2-20 show that:
The largest time saving has been in the PM peak for traffic using the new free-flow link road between M25 southbound and A2 eastbound (Route 5). There is a 2 minute saving for traffic making this movement, compared to using the circulatory in the ‘before’ period;
There are also savings of up to 1 minute 20 seconds for traffic using the new segregated slip lane between A2 westbound and M25 southbound (Route 2). The new free-flow lane has provided a faster route for making that movement compared to using the circulatory;
Time savings have also been up to 1 minute 40 seconds for traffic making the A2 westbound to M25 northbound movement (Route 1), as this traffic would previously have used the circulatory, taking over 3 minutes in the ‘before’ period; and
For the movements still requiring use of the circulatory there are still savings of up to 40 seconds in the peak periods, and this will be as a result of the reduced amount of traffic now having to use the roundabout. The only exception to this is the A2 eastbound to M25 northbound (Route 3) which has not benefited from improvement, as Link E (which would have improved this movement) was deferred.
Heavy Goods Vehicles 2.50. At locations where classified ATC data is available, it is possible to assess the proportion and
number of Heavy Goods Vehicles (HGVs). By looking at this information for 2006 and 2013, it is possible to determine if there has been a change, and whether the change may be attributed to the schemes. Classified count data is available for the A2 east and west of M25 Jn 2 and this is provided in the table below14.
14 It should be noted that 6.6m is now considered to be the length distinction between light and heavy vehicles, and post 2009, HA TRADs count sites have used this measurement in addition to the 5.2m split. However, as data prior to this date used only the 5.2m distinction, it has been necessary to use this measurement to represent HGVs in the analysis above in order to compare like-for-like.

Post Opening Project Evaluation A2/A282 Dartford Improvement & M25 Jn 1b-Jn 3 Widening - Five Year After Study
46
Table 2-3 HGV% on AWT
Location Direction Before FYA
A2 East of M25 Jn 2 E/B 16.6% 16.2%
W/B 15.8% 14.7%
A2 West of M25 Jn 2 E/B No data 14.1%
W/B 13.7% 11.3%
2.51. East of the M25 Jn 2 the percentage of HGVs using the A2 has changed very little. On the A2 west of Jn 2, the data in the westbound direction indicates a slight reduction in the proportion of HGVs using the link. Given the overall traffic flows have increased slightly on the link, it would be reasonable to infer that the increase has largely constituted cars and light vehicles. These changes must also be assessed within the context of economic downturn, which coincided with reduced traffic volumes and numbers of Heavy Goods Vehicles between 2008 and 2012.
2.52. Changes in HGV usage on the M25 in the vicinity of the schemes have been much harder to determine due to the poor quality of this information for the count sites in the TRADs database. Issues include:
Southbound on the M25, TRADs count sites show the following:
Jn 2 to Jn 3 - 43% HGV at FYA
Within Jn 2 – 34% HGV at FYA
Jn 2 to Jn 3 – 18% HGV ‘before’
Jn 1b to Jn 2 – no classified data in the ‘before’ period
A current count site described as the S/B distributor lane has 56% HGV
Using four TRADs sites to calculate Jn 1b to Jn 2 gives a 36% HGV
Northbound on the M25, TRADs count sites show the following:
Jn 2 to Jn 3 – 22%HGV in ‘before’ period
Jn 2 to Jn 3 – 22% HGV in FYA period (same site as above)
Using two TRADs sites to calculate Jn 2 to Jn 3 gives a 29% HGV
Within Jn 2 – 35% HGV at FYA
Jn 1b to Jn 2 – no classified data in ‘before’ period
Using four TRADs sites to calculate Jn 1b to Jn 2 gives a 30% HGV 2.53. Given the variety and disparity of the results provided by the various count sites around the
scheme, it is extremely difficult to determine what change (if any) may have occurred in HGV usage since the scheme opened.
Forecast vs. Observed Traffic Flows 2.54. The A2/A282 Dartford Improvement and M25 Jn 1b – Jn 3 Widening schemes were justified
based on appraisals of impacts carried out a number of years before construction. POPE methodology re-assesses these forecasts along with observed traffic volumes to ascertain the accuracy of the predictions.
Forecast Assumptions and Process (both schemes)
2.55. The basis of the traffic modelling for both schemes was the existing Kent Thames-Side (KTS) 2000 SATURN traffic model. This model was developed on behalf of Kent County Council and other local authorities, including Dartford Borough Council, and was made available to Highways England for the purpose of its use in the A2/A282 Dartford Improvement and M25 Jn 1b – Jn 3 widening scheme appraisals.

Post Opening Project Evaluation A2/A282 Dartford Improvement & M25 Jn 1b-Jn 3 Widening - Five Year After Study
47
2.56. The forecast networks and demand included all committed and planned highway and development schemes at that time, as discussed and agreed with Highways England and local authorities. Local planning scenarios for developments and traffic restraint policies were also considered when developing forecasting models for local developments. The forecasting process included:
Forecasts for future years using the National Trip End Model (NTEM) to apply growth factors to travel movements within the study area;
Application of local growth factors from TEMPRO 4.3 to car-based trips;
Elastic assignment of trips to Do-Minimum and Do-Something networks to enable assessment of induced traffic; and
Sensitivity testing of variable demand using DIADEM.
2.57. As there were a number of major public transport initiatives within the KTS area which were being implemented during the appraisal and construction stages of these schemes, a high degree of elasticity was modelled for competing trips. This particularly applied to:
Kent Thameside Fastrack Phase 1, a Bus Rapid Transport project comprised of 5.5 km of dedicated and segregated busway between Dartford railway station to Bluewater Retail Centre, completed in March 2006; and
Channel Tunnel Rail Link (CTRL), presumably using Ebbsfleet station.
A2/A282 Dartford Improvement Scheme Forecasts
Original scheme
2.58. The original forecasts for the scheme at Order Publication Report (OPR) stage were provided in:
Traffic Forecasting Report 2002 OPR;
Micro Simulation report May 2003; and
Public Inquiry Traffic & Economics Proof of Evidence Summary (January 2002).
2.59. A key element of the basis of the modelling for the A2/A282 scheme was to take account of the modelling of the adjacent A2 Bean to Cobham Phase 1 & 2 widening schemes which opened in December 2004 and February 2009, respectively. Although these were undertaken by different consultants, a common approach was used for all which was based on an upgraded version of the 1993 Kent Thames Side (KTS) model. It was assumed in the A2/A282 modelling that both phases of A2 Bean to Cobham would be built.
2.60. SATURN software was used for modelling the area wide traffic assignments and the micro-simulation software GETRAM was used to assess the detailed vehicle interactions in the area of the scheme. Input traffic flows for GETRAM were provided by the SATURN traffic model.
2.61. The future traffic year forecasts were produced for the scheme taking account of the following elements:
local and strategic traffic growth;
proposed developments;
reassignment effects; and
induced / suppressed traffic.
2.62. SCOOT data from the signals at the roundabout and TrafficMaster data on the A2 east of the junction were reported in the Traffic and Economics Supplementary Proof of Evidence report (2004) to show congestion regularly occurring at the junction and on the A2.
2.63. The assessment of induced traffic due to the scheme showed that the effects of induced trips or trip suppression would be small for both low and high growth.

Post Opening Project Evaluation A2/A282 Dartford Improvement & M25 Jn 1b-Jn 3 Widening - Five Year After Study
48
Revised scheme – Link E deferred
2.64. A summary of the revised modelling undertaken for the Link E deferred scheme was described in the ‘A2/A282 Dartford Improvement Report on Deferment of Link E and Revised Landscape and Drainage Attenuation Proposals in North West Quadrant of Junction 2’.
2.65. Modelling work on the revised scheme included analysis using TRANSYT and micro-simulation (using AIMSUN) of the junction, and concluded that under the high growth scenario, the revised layout would perform satisfactorily at least until 2016. It was not considered to be practicable for high traffic growth to continue beyond this time due to the limitations which would be imposed by the surrounding network. Assessment of the capacity of the interim solution beyond 2016 was based on 60:40 low to high growth – a recognized basis for junction design, and on low growth. Under both scenarios, the analyses indicated that the proposed solution would perform satisfactorily up to the design year (2022).
2.66. The traffic programme ARCADY was used to test the option of operating the junction without signals. This indicated that the junction would not operate satisfactorily as an uncontrolled roundabout and that signals would be required.
2.67. The TRANSYT modelling for the original scheme indicated that under high growth forecasts, the junction would operate adequately with signals at both the opening year 2007, and at the design year 2022. With link E missing, the junction would still operate adequately in the design year with low growth, but with higher traffic growth rates, congestion would occur earlier than the design year. However this was not considered a possible outcome for the aforesaid reasons.
2.68. No new traffic forecasts were included in the deferment report, and therefore the Traffic Forecasts included here are taken from the Traffic Forecasting Report 2002 OPR.
Do-Minimum Forecasts
2.69. In addition to assessing the accuracy of the forecast flows with the scheme, this section also provides analysis of the forecast Do-Minimum traffic flows which would have occurred if the scheme had not been built – sometimes referred to as the ‘counterfactual’ scenario. This enables an assessment not only of the forecast traffic levels without the scheme, but of the forecast impacts of (change brought about by) the scheme. Clearly there is no observed ‘Do-Minimum’ for a version of events that did not occur, therefore in order to provide this analysis, it was necessary to take the observed ‘before’ AADT for 2006 and interpolate to 2013 to create a proxy. This was done using observed trends for Kent (presented earlier in Figure 2.215) up to 2013. The Do-Minimum forecasts for FYA have been created by interpolating between the Opening Year and Design Year Do-Minimum forecasts using straight line projection.
2.70. The results of this comparison are provided in Table 2-4.
15 Kent trends were chosen as a prudent estimate of the potential trend in change between 2006 and 2012 had the scheme not been built. The south east region as a whole showed a noticeable decline in mvkm, but Kent and Medway experienced only minor reduction, possibly due to the amount of regeneration and transport schemes in the area. It is likely therefore that this trend would have occurred without the scheme being built. A factor of 0.995 was applied to adjust the observed ‘before’ flows to estimated 2013 flows (assuming no growth between 2012 and 2013).

Post Opening Project Evaluation A2/A282 Dartford Improvement & M25 Jn 1b-Jn 3 Widening - Five Year After Study
49
Table 2-4 Comparison of Do-Minimum AADT forecasts with counterfactual
Location D
ire
cti
on
Observed Forecast Do-Min Counterfact
ual Forecast
% Diff
‘before’
(Opening Year 2007)16 Proxy Do-
Min 2013
Interpolated 2013
Do-Min
LG HG LG HG LG HG
A2 east of M25 Jn 2
E/B 62,300 55,000 61,000 62,000 60,200 67,400 3.0% -8.0%
W/B 61,900 54,000 59,000 61,600 57,600 63,800 6.9% -3.4%
M25 Jn 1b – Jn 2 & A282 link
roads
N/B 51,200 60,000 70,000 50,900 65,200 77,200 -21.9% -34.1%
S/B 63,500 63,000 72,000 63,200 68,200 77,200 -7.3% -18.1%
2.71. Table 2-4 shows that traffic levels on the A2 before scheme construction had already reached in excess of the forecast Do-Minimum forecasts (both Low Growth and High Growth). However, due to the effects of the economic downturn, traffic volumes would (in the counterfactual) likely have been between the Low Growth and High Growth Do-Minimum estimates.
2.72. Estimates of traffic on the M25 however were less accurate. Observed traffic levels on the M25 between Jn 1b – Jn 2 northbound (including the link road) were well below those forecast. The disparity between the northbound and southbound observed flows looks surprising, however this section may have been constrained in the ‘before’ situation due to the delays caused by traffic queuing back from the Dartford Crossings. As a check, a rough proxy of the flows on the same link was calculated from the observed data at Jn 2 - Jn 3 northbound and subtracting and adding the relevant slip road flows, and comes to a similar volume as the TRADs site, so it is deemed likely to be acceptable. It should also be noted that there is also another count site at that location on TRADs which is now ‘hidden’ from view. It may be possible that the hidden site is what was used in the forecasting on that link, and perhaps it has since been found to be inaccurate. Without access to this data it is not possible to draw further conclusions.
2.73. Traffic levels on the southbound between M25 Jn 1b – Jn 2 were also lower than forecast Do-Minimum flows, however to a lesser extent.
2.74. No Do-Minimum traffic forecasts for other sections are available in the Traffic Forecasting Report for comparison.
Do-Something Forecasts
2.75. The Do-Something forecasts have also been taken from the Traffic Forecasting Report and interpolated to 2013 using straight line projection between 2007 (Opening Year) and 2022 (Design Year). These have then been compared with FYA observed flows in Table 2-5.
16 Taken from Traffic Forecasting Report, June 2002 Table 5.10

Post Opening Project Evaluation A2/A282 Dartford Improvement & M25 Jn 1b-Jn 3 Widening - Five Year After Study
50
Table 2-5 Comparison of Do-Something forecasts with FYA AADTs
Location
Dir
ec
tio
n
Forecast Do-Something Observed
% Diff
2013 (FYA)17 FYA AADT
LG HG LG HG
A2 east of M25 Jn 2 E/B 63,500 72,000 68,700 8.19% -4.58%
W/B 63,000 70,500 66,200 5.08% -6.10%
A2 west of M25 Jn 2 E/B 49,500 55,500 53,100 7.27% -4.32%
W/B 49,500 54,000 51,800 4.65% -4.07%
M25 Jn 1B – Jn 2 & A282 link roads
N/B 72,500 85,500 69,600 -4.00% -18.60%
S/B 71,500 81,500 73,100 2.24% -10.31%
M25 Jn 2 - Jn 3
N/B 77,000 88,500 62,700 -18.57% -29.15%
S/B 74,000 83,500 65,300 -11.76% -21.80%
Free-flow link from A282 S/B to A2 E/B
17,500 20,000 18,100 3.43% -9.50%
Free-flow link from A2 W/B to A282 N/B
18,500 21,500 17,500 -5.41% -18.60%
Free-flow link from A2 W/B to M25 S/B
13,500 14,000 12,400 -8.15% -11.43%
2.76. The following can be observed from Table 2-5:
FYA traffic volumes on the A2, both east and west of the M25 Jn 2 are between the Low Growth and High Growth Do-Something forecasts which have been interpolated to 2013. This shows that the traffic forecasts are reasonably accurate.
Traffic volumes on the M25 between Jn 2 – Jn 3 have not reached the Low Growth forecasts. It is not possible, without the Do-Minimum forecasts, to establish whether there was also a similar over-estimate in the Do-Minimum. However, given that flows between Jn 1b – Jn 2 were overestimated in the Do-Minimum, it is not unreasonable to assume the same may have occurred on Jn 2 – Jn 3.
Traffic volumes on the new free-flow link roads from the A2 westbound have also been lower than the Low Growth forecasts. This seems to be a consistent pattern with the findings on the M25 south of Jn 2 and northbound, north of Jn 2.
Traffic forecasts have been more accurate on the free-flow link between A282 southbound and A2 eastbound, which is more in line with the findings southbound between Jn 1b – Jn 2.
2.77. Figure 2-21 shows the expected percentage change between the forecast opening year in the Do-Minimum forecasts and FYA Do-Something forecast, compared to the observed percentage change between the ‘before’ and FYA traffic volumes for both Low and High Growth scenarios. This information was only available for the sections included in Table 2-4.
17 Taken from Traffic Forecasting Report diagram TR959A-1

Post Opening Project Evaluation A2/A282 Dartford Improvement & M25 Jn 1b-Jn 3 Widening - Five Year After Study
51
Figure 2-21 Percentage Change Comparison (Forecast vs. Observed)
2.78. Figure 2-21 shows that in percentage terms, growth has been higher than forecast on the M25, but lower than forecast on A2. These results however are considered to reflect the fact that existing flows on the M25 were below, and on the A2 higher than, the Do-Minimum forecasts.
M25 Jn 1b – Jn 3 widening scheme forecasts
2.79. The M25 scheme appraisal used SATURN models based on those used for the A2/A282 Dartford Improvement, with the base year re-validated to 2004. The Do-Minimum was based on neither the M25 widening or the A2/A282 Dartford Improvement scheme being built. The Do-Something forecasts (reviewed in this report) were based on both schemes being built, and on the A2/A282 Dartford Improvement without Link E.
2.80. An assessment of induced traffic due to the proposed improvement showed that the effects of induced trips or trip suppression would be small. There would be a small increase in traffic flows through the M25 corridor in the Do-Something scenario compared to the Do-Minimum.
Do-Minimum Forecasts
2.81. Do-Minimum traffic forecasts for the scheme have been taken from the Stage 3 Scheme Assessment Report, November 2006. As with the A2/A282 scheme, in addition to providing the opening year forecast, and forecast interpolated to FYA (using straight line projection between opening year and Design Year), a counterfactual flow has also been produced based on the observed ‘before’ flows and making an assumption about likely growth should the scheme have not been built. These are provided in Table 2-6 below.
0%
5%
10%
15%
20%
25%
30%
35%
40%
LG HG Observed LG HG Observed LG HG Observed LG HG Observed
A2 east of M25 Jn 2 Eastbound A2 east of M25 Jn 2 Westbound M25 Jn 1b - Jn 2 Northbound M25 Jn 1b - Jn 2 Southbound
Pe
rce
nta
ge C
han
ge w
ith
sch
em
e
Section

Post Opening Project Evaluation A2/A282 Dartford Improvement & M25 Jn 1b-Jn 3 Widening - Five Year After Study
52
Table 2-6 Comparison of Do-Minimum AADT forecasts with counterfactual
Location D
ire
cti
on
Observed Forecast Do-Min Counterfactual18
Forecast
% Diff
‘before’ Opening Year 200819 Proxy Do-Min 2013
Interpolated 2013
Do-Min
LG HG LG HG LG HG
M25 Jn 1a – Jn 1b
N/B 68,600 83,000 93,000 68,300 88,300 99,700 -22.65% -31.49%
S/B 69,500 81,000 90,000 69,200 86,000 95,700 -19.53% -27.69%
M25 Jn 1b – Jn 2
N/B 51,200 70,000 78,000 50,900 74,700 84,000 -31.86% -39.40%
S/B 63,500 68,000 77,000 63,200 72,700 82,300 -13.07% -23.21%
M25 Jn 2 – Jn 3
N/B 67,300 78,000 84,000 67,000 81,000 87,700 -17.28% -23.60%
S/B 67,200 72,000 80,000 66,900 76,000 84,300 -11.97% -20.64%
2.82. It can be seen from Table 2-6 that even with the 2 year difference between the observed flows (taken from 2006) and the Do-Minimum opening year forecasts (for 2008), the actual flows on the three sections of interest on the M25 were consistently below both Low Growth and High Growth forecasts. This indicates that traffic growth on the M25 had been much less than anticipated in the pre-construction years, even the period preceding the economic downturn. It is also worth noting that the Do-Minimum forecasts for this scheme are higher than the Do-Minimum forecasts for the same links in the A2/A282 scheme forecasts.
Do-Something Forecasts
2.83. The Do-Something forecasts have also been taken from the Stage 3 Scheme Assessment Report Part 2: Engineering, Traffic & Economics Report Volume 2, November 2006 and interpolated to 2013 using straight line projection between 2008 (Opening Year) and 2022 (Design Year). These have then been compared with FYA observed flows in Table 2-7.
Table 2-7 Comparison of Do-Something forecasts with FYA AADTs
Location Dir
ec
tio
n
Forecast Do-Something Observed
% Diff Interpolated to 201320
FYA AADT
LG HG LG HG
M25 Jn 1b – Jn 2 N/B 75,000 85,700 69,600 -7.20% -18.79%
S/B 73,700 83,000 73,100 -0.81% -11.93%
M25 Jn 2 – Jn 3 N/B 84,000 95,000 62,700 -25.36% -34.00%
S/B 78,000 89,700 65,300 -16.28% -27.20%
2.84. It can be seen from Table 2-7 that observed flows in 2013, have been notably below the Low Growth forecasts. Only Jn 1b – Jn 2 southbound had observed flows close to the Low Growth forecasts.
18 Kent trends were chosen as a prudent estimate of the potential trend in change between 2006 and 2012 had the scheme not been built. The south east region as a whole showed a noticeable decline in mvkm, but Kent and Medway experienced only minor reduction, possibly due to the amount of regeneration and transport schemes in the area. It is likely therefore that this trend would have occurred without the scheme being built. A factor of 0.995 was applied to adjust the observed ‘before’ flows to estimated 2013 flows (assuming no growth between 2012 and 2013). 19 Stage 3 Scheme Assessment Report Part 2: Engineering, Traffic & Economics Volume 2 Figure TF1 20 Stage 3 Scheme Assessment Report Part 2: Engineering, Traffic & Economics Volume 2 Figure TF2 (Note diagram TF2 does not include flows for M25 Jn 1a – Jn 1b

Post Opening Project Evaluation A2/A282 Dartford Improvement & M25 Jn 1b-Jn 3 Widening - Five Year After Study
53
2.85. In order to assess the accuracy of the forecast impact of the scheme, the percentage change between observed ‘before’ and FYA flows has been compared to the change between the forecast opening year Do-Minimum flows and the interpolated 2013 Do-Something flows. These are shown graphically in Figure 2-22.
Figure 2-22 Percentage Change Comparison (Forecast vs. Observed)
2.86. Figure 2-22 shows that the observed proportionate growth rate has exceeded the rate of growth forecast between Jn 1b – Jn 2, but Jn 2 – Jn 3 exhibits a totally different pattern. The scheme forecast expected a small growth in traffic on this latter section with the scheme, but in fact traffic volumes have reduced slightly. We must also consider the fact that an economic downturn also occurred shortly after the scheme opened, which coincided with a nationwide reduction in traffic. Do-Minimum forecasts were also much higher than the existing observed traffic levels on these sections, indicating that the growth rate used in the model was an overestimate even before the start of the economic downturn.
Forecast vs. Observed Journey Times
A2/A282 Dartford Improvement Scheme
2.87. There were no forecasts of journey time savings in the appraisal. Only matrix based results for the whole network were specified. These cannot be compared to observed data.
M25 J1b – 3
2.88. As with the A2/A282 scheme, the appraisal was matrix based.
2.89. The Scheme Assessment Report (SAR) states that comparisons of modelled travel times in the peaks and inter-peak periods in the M25 corridor indicated that there would be travel time savings with the scheme. Average modelled vehicle speeds were similar for M25 traffic for both the Do-Minimum and the Do-Something models, despite the additional traffic. This is explained by the increase in capacity of the motorway to absorb increased traffic flows during peak periods and hence reduce congestion on the motorway section between Jn 1b and Jn 3.
-10%
-5%
0%
5%
10%
15%
20%
25%
30%
35%
40%
LG HG Observed LG HG Observed LG HG Observed LG HG Observed
M25 Jn 1b - Jn 2 Northbound M25 Jn 1b - Jn 2 Southbound M25 Jn 2 - Jn 3 Northbound M25 Jn 2 - Jn 3 Southbound
Pe
rce
nta
ge C
han
ge w
ith
sch
em
e
Section

Post Opening Project Evaluation A2/A282 Dartford Improvement & M25 Jn 1b-Jn 3 Widening - Five Year After Study
54
2.90. There are no further details on how the model derived travel time savings when the speed with the scheme is similar to that without and there was only forecast to be a small increase in traffic flows. However, the AST did include the following forecast under the wider economic benefits:
‘Average journey times between J1b and 3 would be reduced by 30-60 sec in 2008 …relative to the baseline’
2.91. The journey time savings detailed above in Table 2-2 indicate that only between Jn 2 – Jn 3 northbound have savings been in the region of that indicated in the AST. The southbound section at FYA opening is seeing smaller savings (20 seconds or less).
Journey Time Reliability / Route Stress
A2/A282 Dartford Improvement Scheme
2.92. The Inspectors report noted that the need for the scheme included the existing problem of high traffic levels leading to significant delays and unreliable journey times, especially at peak times and/or following a traffic incident in the area.
2.93. The AST stated that the scheme should improve reliability due to improved flow through M25 Jn 2. No quantitative measure was given.
2.94. The Economics Assessment Report (2004) gives no monetised value for the reliability benefits forecast to be provided by the scheme.
2.95. Journey time reliability can offer a significant source of economic benefit to transport schemes. In recognition of its growing importance as an indicator of network performance, WebTAG has now been updated to provide guidance on how reliability benefits can be monetised using the INCA (Incident Cost-benefit Assessment) program. Research is ongoing to develop new and better ways of evaluating reliability impacts, but the new WebTAG Reliability guidance establishes the latest thinking on the topic and represents a step forward from previous methods by putting an economic value to changes in travel time variability.
2.96. The appraisal of this scheme predates these developments, and as no quantitative measure was provided within the forecast, there is nothing that can be compared with observed impacts. It is possible however to draw some conclusions about outturn scheme impacts on reliability using observed data. This section of the report provides an evaluation of the Standard Deviation of journey times derived from the JTDB along the sections of the A2 directly west and east of M25 Jn 2, the latter of which was widened as part of the scheme.
Standard Deviation of Journey Times
2.97. Reliability is concerned with variability in journey times within the same time periods. Therefore, a proxy for reliability can be determined by examining the variation of journey times using the data in the Journey Time Database (JTDB), as used earlier in this report. The metric used in the analysis is the standard deviation of mean journey times for each time period in the ‘before’ and ‘after’ opening periods (i.e. ‘before’, OYA and FYA).
2.98. The standard deviation of journey times for the A2 east and west of M25 Jn 2 is shown for the period (06:00 – 22:00) in Figure 2-23 to Figure 2-28. The larger the deviation from the mean journey time, the less reliable to the road user it is deemed to be21. Only Mondays – Thursdays on normal working weeks have been selected.
21 Outliers have been removed
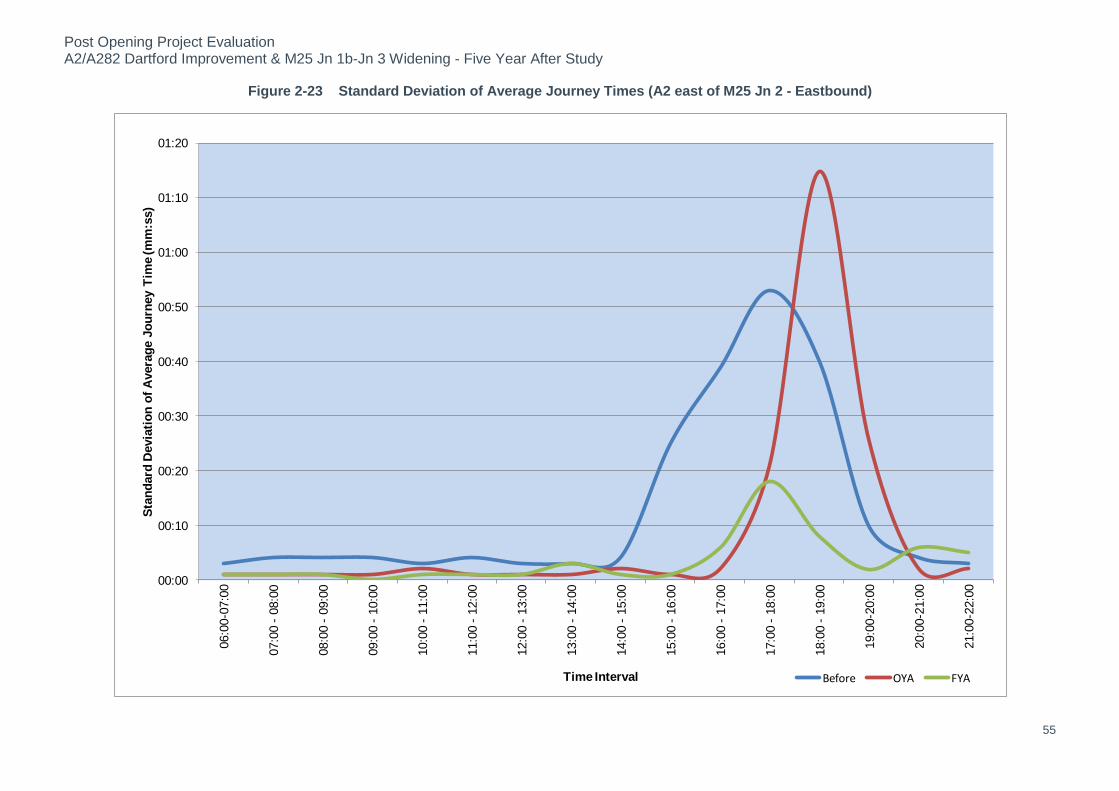
Post Opening Project Evaluation A2/A282 Dartford Improvement & M25 Jn 1b-Jn 3 Widening - Five Year After Study
55
Figure 2-23 Standard Deviation of Average Journey Times (A2 east of M25 Jn 2 - Eastbound)
00:00
00:10
00:20
00:30
00:40
00:50
01:00
01:10
01:20
06:0
0-0
7:0
0
07:0
0 -
08:0
0
08:0
0 -
09:0
0
09:0
0 -
10:0
0
10:0
0 -
11:0
0
11:0
0 -
12:0
0
12:0
0 -
13:0
0
13:0
0 -
14:0
0
14:0
0 -
15:0
0
15:0
0 -
16:0
0
16:0
0 -
17:0
0
17:0
0 -
18:0
0
18:0
0 -
19:0
0
19:0
0-2
0:0
0
20:0
0-2
1:0
0
21:0
0-2
2:0
0
Sta
nd
ard
Devia
tio
n o
f A
vera
ge J
ou
rney T
ime (m
m:s
s)
Time Interval Before OYA FYA

Post Opening Project Evaluation A2/A282 Dartford Improvement & M25 Jn 1b-Jn 3 Widening - Five Year After Study
56
Figure 2-24 Standard Deviation of Average Journey Times (A2 east of M25 Jn 2 - Westbound)
00:00
00:10
00:20
00:30
00:40
00:50
01:00
01:10
01:20
06:0
0-0
7:0
0
07:0
0 -
08:0
0
08:0
0 -
09:0
0
09:0
0 -
10:0
0
10:0
0 -
11:0
0
11:0
0 -
12:0
0
12:0
0 -
13:0
0
13:0
0 -
14:0
0
14:0
0 -
15:0
0
15:0
0 -
16:0
0
16:0
0 -
17:0
0
17:0
0 -
18:0
0
18:0
0 -
19:0
0
19:0
0-2
0:0
0
20:0
0-2
1:0
0
21:0
0-2
2:0
0
Sta
nd
ard
Devia
tio
n o
f A
vera
ge J
ou
rney T
ime (m
m:s
s)
Time Interval Before OYA FYA

Post Opening Project Evaluation A2/A282 Dartford Improvement & M25 Jn 1b-Jn 3 Widening - Five Year After Study
57
Figure 2-25 Standard Deviation of Average Journey Times (A2 west of M25 Jn 2 - Eastbound)
00:00
00:10
00:20
00:30
00:40
00:50
01:00
01:10
01:20
06:0
0-0
7:0
0
07:0
0 -
08:0
0
08:0
0 -
09:0
0
09:0
0 -
10:0
0
10:0
0 -
11:0
0
11:0
0 -
12:0
0
12:0
0 -
13:0
0
13:0
0 -
14:0
0
14:0
0 -
15:0
0
15:0
0 -
16:0
0
16:0
0 -
17:0
0
17:0
0 -
18:0
0
18:0
0 -
19:0
0
19:0
0-2
0:0
0
20:0
0-2
1:0
0
21:0
0-2
2:0
0
Sta
nd
ard
Devia
tio
n o
f A
vera
ge J
ou
rney T
ime (m
m:s
s)
Time Interval Before OYA FYA

Post Opening Project Evaluation A2/A282 Dartford Improvement & M25 Jn 1b-Jn 3 Widening - Five Year After Study
58
Figure 2-26 Standard Deviation of Average Journey Times (A2 west of M25 Jn 2 - Westbound)
00:00
00:10
00:20
00:30
00:40
00:50
01:00
06:0
0-0
7:0
0
07:0
0 -
08:0
0
08:0
0 -
09:0
0
09:0
0 -
10:0
0
10:0
0 -
11:0
0
11:0
0 -
12:0
0
12:0
0 -
13:0
0
13:0
0 -
14:0
0
14:0
0 -
15:0
0
15:0
0 -
16:0
0
16:0
0 -
17:0
0
17:0
0 -
18:0
0
18:0
0 -
19:0
0
19:0
0-2
0:0
0
20:0
0-2
1:0
0
21:0
0-2
2:0
0
Sta
nd
ard
Devia
tio
n o
f A
vera
ge J
ou
rney T
ime (m
m:s
s)
Time Interval Before OYA FYA

Post Opening Project Evaluation A2/A282 Dartford Improvement & M25 Jn 1b-Jn 3 Widening - Five Year After Study
59
2.99. The following observations can be made from Figures 4-1 to 4-4:
The data indicates that some benefits to reliability have occurred both east and west of the M25 Jn 2.
East of the junction, which has been widened from 2 – 3 lanes, in the eastbound direction, standard deviation has reduced from more than a minute in the PM peak to less than 20 seconds, indicating that reliability has improved along this section.
Westbound however, the AM peak is showing a similar amount of deviation at FYA as in the ‘before’ period. This suggests that in the AM peak, reliability has not improved for road users as they approach the M25 Jn 2. This section has seen a 7-8% increase in traffic flows which may have negated some of the benefits provided by the extra capacity. The journey time data has been scrutinised closely, and is deemed to be realistic.
West of M25 Jn 2, which has not been widened, also demonstrates improvements in reliability, with less deviation from the mean in each direction, however the westbound data should be treated with caution, as there are doubts about its quality (as stated in Chapter 2 journey time analysis).
M25 Jn 1b – Jn 3 widening
2.100. The SAR (Nov 2006) stated that at that time, there was no established software for estimating the reliability of journey times from reductions in incidents for a road scheme, so the accepted alternative was the assessment of route stress. The report goes on to state:
‘The scheme should improve reliability due to improved flows southbound between Jn 1b – Jn 2, reducing delays as a result of the widening. In addition, the provision of an extra lane in both directions between Jn 2 – Jn 3 should improve journey time reliability on this section of the M25’.
Changes in Route Stress
2.101. The forecast Route Stress for the Do-Minimum and Do-Something scenarios in the opening year are provided in the table below (both Low Growth and High Growth forecasts). Alongside these are the observed Route Stress percentages for the ‘before’ and FYA periods.
Table 2-8 Forecast vs. Observed Change in Route Stress
Forecast Observed
Do-Min Do-Som Before FYA
M25 Jn 1b – Jn 2 Southbound
Low Growth 72% 49% 72% (75%) 57% (75%)
High Growth 76% 55%
M25 Jn 2 – Jn 3 Northbound
Low Growth 57% 46% 46% (75%) 39% (75%)
High Growth 56% 50%
M25 Jn 2 – Jn 3 Southbound
Low Growth 46% 35% 52% (75%) 48% (75%)
High Growth 49% 38%
2.102. The following can be observed from Table 2-8:
The forecast Do-Minimum route stress from the appraisal seems to indicate that journey time reliability was not a significant concern given the consistent results below 75%. However this is known not to have been the case. This provides further support for the argument that Route Stress analysis does not provide a robust assessment of schemes’ impacts on journey time reliability;
Observed Route Stress percentages in the ‘before’ period are similar to those forecast for the Do-Minimum;

Post Opening Project Evaluation A2/A282 Dartford Improvement & M25 Jn 1b-Jn 3 Widening - Five Year After Study
60
The extra lane provided with the scheme on each of these sections has provided extra capacity, thereby reducing the route stress on each of the links;
These figures however should be treated with caution, as analysis of the HGV % figures (which forms an important element of the Route Stress calculation) on TRADS shows inconsistencies with the data, both from the same location over time, and in comparison with each other, as well as some completely unrealistic figures.
2.103. In order to draw more robust conclusions regarding changes in reliability since the scheme opened, analysis of the standard deviation of journey times has also been undertaken as described above.
2.104. This analysis22 has been undertaken for the M25 Jn 2 – Jn 3 in each direction, for the ‘before’, OYA and FYA periods and is shown in Figure 2-27 and Figure 2-28. Note that between the OYA and FYA periods the controlled motorway became active.
2.105. Data for Jn 1b – Jn 2 is not available for the reasons stated in Chapter 2 of this report.
22 Outliers have been removed

Post Opening Project Evaluation A2/A282 Dartford Improvement & M25 Jn 1b-Jn 3 Widening - Five Year After Study
61
Figure 2-27 Standard Deviation of Average Journey Times (M25 Jn 2 – Jn 3 Northbound)
00:00
00:20
00:40
01:00
01:20
01:40
02:00
02:20
02:40
03:00
03:20
03:40
04:00
04:20
04:40
05:00
06:0
0-0
7:0
0
07:0
0 -
08:0
0
08:0
0 -
09:0
0
09:0
0 -
10:0
0
10:0
0 -
11:0
0
11:0
0 -
12:0
0
12:0
0 -
13:0
0
13:0
0 -
14:0
0
14:0
0 -
15:0
0
15:0
0 -
16:0
0
16:0
0 -
17:0
0
17:0
0 -
18:0
0
18:0
0 -
19:0
0
19:0
0-2
0:0
0
20:0
0-2
1:0
0
21:0
0-2
2:0
0
Sta
nd
ard
Devia
tio
n o
f A
vera
ge J
ou
rney T
ime (m
m:s
s)
Time Interval Before OYA FYA

Post Opening Project Evaluation A2/A282 Dartford Improvement & M25 Jn 1b-Jn 3 Widening - Five Year After Study
62
Figure 2-28 Standard Deviation of Average Journey Times (M25 Jn 2 – Jn 3 Southbound)
00:00
00:10
00:20
00:30
00:40
00:50
01:00
01:10
01:20
06:0
0-0
7:0
0
07:0
0 -
08:0
0
08:0
0 -
09:0
0
09:0
0 -
10:0
0
10:0
0 -
11:0
0
11:0
0 -
12:0
0
12:0
0 -
13:0
0
13:0
0 -
14:0
0
14:0
0 -
15:0
0
15:0
0 -
16:0
0
16:0
0 -
17:0
0
17:0
0 -
18:0
0
18:0
0 -
19:0
0
19:0
0-2
0:0
0
20:0
0-2
1:0
0
21:0
0-2
2:0
0
Sta
nd
ard
Devia
tio
n o
f A
vera
ge J
ou
rney T
ime (m
m:s
s)
Time Interval Before OYA FYA
Post Opening Project Evaluation A2/A282 Dartford Improvement & M25 Jn 1b-Jn 3 Widening - Five Year After Study
63
2.106. Figure 2-27 and Figure 2-28 show that:
The standard deviation of journey times between Jn 2 and 3 has reduced at FYA in the northbound direction, however there is still a standard deviation of more than 2 minutes for the majority of the day. Southbound data however suggests that journeys along this link are much more reliable FYA the scheme opened. The improvement in reliability between OYA and FYA can be linked to the activation of the CM during this time period; and
The graphs indicate that reliability may still be an issue northbound on the M25 between Jn 2 and Jn 3 through most times of the day (however with some signs of improvement in the PM), however it should be noted that queues stemming back from the Dartford Crossing are known to be a problem in the northbound direction of the M25 in this area, and therefore it is difficult to determine with any certainty what impact the schemes and the controlled motorway have had.
2.107. To conclude on the subject of reliability, there are clear improvements in reliability southbound on the M25 between Jn 2 – Jn 3, and some evidence of improvement northbound along the same section, however the latter is less conclusive, due to the known issues of queues stemming back from the Dartford Crossing. On balance, however, it should be concluded that overall there is improvement, and therefore the economic benefits of the schemes, assessed in this chapter, are almost certainly on the conservative side because the reliability benefits are not quantified here.
Post Opening Project Evaluation A2/A282 Dartford Improvement & M25 Jn 1b-Jn 3 Widening - Five Year After Study
64
Key Points – Traffic Impacts
Traffic Flow impacts Traffic using the circulatory at the A2/A282 junction has reduced by 35% to around 42,700
in a 12hr period. This is consistent with the findings at OYA and due to the new free-flow movements provided by the A2/A282 Dartford Improvement scheme.
The most significant changes in traffic flow have been to the north and east of the A2/A282 junction.
Traffic volumes on the M25 between Jn 2 – Jn 3 have reduced, a surprising result given the widening along this section. However the same trend is seen along the next section on the M25 (Jn 3 – Jn 4).
Traffic Forecasting Traffic forecasts for both schemes overestimated traffic levels on the M25 in both the Do-
Minimum and Do-Something scenarios.
A2/A282 scheme traffic forecasts underestimated existing traffic flows on the A2, however observed traffic volumes on the A2 sections have been between Low Growth and High Growth forecasts. Therefore, this means that although the forecasts were reasonably accurate, the forecast growth was overestimated.
Journey Times
The most noticeable time savings have been northbound between Jn 2 – Jn 3 in the PM peak (2 minutes saving) and on the A2 west of A2/A282 junction eastbound PM peak (35 seconds saving).
It should be borne in mind that the Controlled Motorway between Jn 2 – Jn 3 which opened between the OYA and FYA periods will have contributed to the journey time savings along that section of the M25.
On the A2 westbound approaching the A282 junction, although times are shorter at FYA than in the ‘before’ period, there has been an increase in times since OYA, suggesting that some of the time savings may be eroding over time.
There have been time savings of up to 2 minutes in the peak periods for traffic using the new free-flow links provided by the A2/A282 scheme. For the movements still requiring use of the circulatory there are also savings of up to 40 seconds in the peak periods, and this will be as a result of the reduced amount of traffic now using the roundabout. The only exception to this is the A2 eastbound to M25 northbound which has not benefited from improvement, as Link E (which would have improved this movement) was deferred.
Journey Time Forecasting The M25 Jn 1b – Jn 3 AST stated that there would be savings of between 30 – 60 seconds
relative to the baseline. Observed journey times indicate that only M25 Jn 2 – Jn 3 northbound has achieved savings within this region.
No applicable forecast journey time data was available for comparison for the A2/A282 scheme.
Heavy Goods vehicles There has been little change in the proportion of HGVs using the A2.
HGV data for the M25 contained in the HA TRADs database is deemed too inconsistent to draw meaningful conclusions.
Reliability Analysis of the standard deviation of average journey times shows some benefits to
reliability on the A2 both east and west of the M25 Jn 2. East of the junction in the westbound direction however, the AM peak still shows unreliable journey times.
On the M25 Jn 2 – Jn 3 southbound there have been clear improvements in reliability. Northbound, although there is less deviation from the mean at FYA than in the pre- opening period, hence showing some improvement, the evidence indicates that reliability is still an issue along this section for many parts of the day.

Post Opening Project Evaluation A2/A282 Dartford Improvement & M25 Jn 1b-Jn 3 Widening - Five Year After Study
65
3. Safety Evaluation
Introduction 3.1. This section considers the impact of the schemes in terms of the level of success in addressing
the objective of reducing collisions.
3.2. For the M25 Jn 1b – Jn 3 widening scheme, the Stage 3 Scheme Assessment Report (SAR) stated that the safety objectives were to:
Reduce the number of accidents on the local road network; and
Minimise the number of reportable accidents and safety incidents during construction. 3.3. For the A2/A282 Dartford Improvement scheme, a key objective of the scheme was to improve
safety at the junction. One of the problems prior to the scheme was that collisions in the vicinity of the junction produced grid-lock conditions and caused considerable delay.
3.4. In order to assess the impact of the scheme on collisions, this section of the report analyses change in personal injury collisions (PICs) occurring in the five year pre construction period, and the five years following opening. Evaluation of the schemes’ impact on personal security has been undertaken through the use of observations made during a site visit and consultation with the Regional Technology Maintenance Contractor (RTMC).
Data Collection
Forecast Data
3.5. For the purposes of assessing the collision impacts of the schemes, forecasts were produced for the number of collisions the schemes were expected to save, together with the associated numbers of casualties and the monetary benefit of the savings. The safety forecasts used in this evaluation are based on those stated in the Stage 3 Scheme Assessment Report (M25 scheme), Economic Assessment Report (A2/A282 scheme), and the schemes’ ASTs. It should be noted that these were based on a spreadsheet analyses rather than a full COBA model.
3.6. This section of the study concerns collision numbers; the economic impact of the change in collisions is evaluated later in the Economy section of this report.
Observed Data
3.7. Collisions by their nature include a random element and are somewhat unpredictable events. To ensure that the scheme is the only known change, pre scheme collision data has been obtained for the most recent 5 years prior to construction. Collision data has been obtained from the Managing Agent Contractors (MACs) for the Highways England Area 4 (which includes the A2 in Kent) and Area 5 (which includes the M25 Jn 2, the A282 and the section of the A2 west of the M25) for the periods:
Pre scheme – August 2001 to July 2006 (5 years)
Construction – August 2006 to July 2008
Post scheme – August 2008 to July 2013 (5 years)
3.8. The collision data is based on the records of PICs (i.e. collisions that may involve injuries to one or more persons) recorded in the STATS19 data collected by the police when attending collisions. Collisions that do not result in injury (damage only collisions) are not included in this dataset and are therefore not considered in this evaluation.
3.9. It should also be noted that at this stage some of the more recent collision data may not yet have been validated by the DfT. The requirement for up-to-date and site specific information

Post Opening Project Evaluation A2/A282 Dartford Improvement & M25 Jn 1b-Jn 3 Widening - Five Year After Study
66
necessitated the use of unvalidated data. Thus the data is judged to be sufficiently robust for use in this study, but it may be subject to change. However, it is not anticipated that this would be significant in terms of the analysis of collision numbers presented in this report.
Area of Analysis
3.10. Where possible in POPE evaluation, the area of analysis of the observed collisions is usually reproduced from the COBA model area, so that comparisons between the observed changes and forecast impact are like-for-like. This means that more robust conclusions can be formed regarding the accuracy of the forecasts.
3.11. In the case of these two schemes however, a spreadsheet approach was taken instead, and the results summarised in the appraisal reports. The details of the spreadsheet appraisals are not available, and the geographical area over which collisions were forecast is not known.
3.12. In the absence of this information, a measured approach has been taken and one which is consistent with the analysis undertaken in the OYA evaluation, with observed collision data being analysed over the following areas:
Wider area: The areas of the A2/M25 and A282 directly improved by the schemes and the sections of these roads beyond in each direction to the next junction;
A2/A282 Dartford Improvement: the scheme area only
M25 Jn 1b – Jn 3 widening: the scheme area only
3.13. Collision data for the local roads surrounding the strategic road network has not been included. Although it was forecast that local roads in the Kent Thameside area would experience safety benefits from some traffic rerouting onto the strategic roads, this impact would be small and spread over a wide area over the long term. It would not be feasible to identify these impacts derived from these schemes as distinct from many other more significant factors impacting safety on local roads over a wide area in the 11 – 12 years studied for this evaluation.
3.14. The collision study areas for this evaluation are shown in Figure 3-1.

Post Opening Project Evaluation A2/A282 Dartford Improvement & M25 Jn 1b-Jn 3 Widening - Five Year After Study
67
Figure 3-1 Collision Study Areas
Collision Numbers 3.15. This section presents an analysis of the observed changes in PICs following the
implementation of the schemes, and includes an investigation into the changes in the number of collisions and associated casualties as well as whether there has been any change in the relative severity. This section first considers the impact on the wider area, and then further detail is provided regarding the impacts just on the respective scheme areas.
Background Collision Reduction
3.16. It is widely recognised that, for over a decade, there has been a year-on-year reduction in the number of personal injury collisions on the roads, even against a trend of increasing traffic volumes during much of that period. The reasons for the reduction are considered to be wide ranging and include improved safety measures in vehicles and reduced numbers of younger drivers. Consideration of this background trend is needed when considering the changes in collision numbers in the before and after periods. If the scheme had not been built, collision numbers in the area are still likely to have been influenced by wider trends and reduced.
3.17. The numbers of collisions in this area in the years before and after the scheme was built are compared. Although the net change is primarily associated with the scheme, this background reduction is taken into account. The best way to do this is to assume that, if the scheme had not been built, the number of collisions on the roads in the study area here would have dropped at the same rate as they did nationally during the same time period. This gives what is known as a counterfactual scenario. A comparison can then be made between this data for the counterfactual ‘without scheme’ scenario on a like-for-like basis with the observed post opening data which is the ‘with scheme’ scenario.

Post Opening Project Evaluation A2/A282 Dartford Improvement & M25 Jn 1b-Jn 3 Widening - Five Year After Study
68
3.18. The difference between the numbers of collisions in these two scenarios can then be attributed to the schemes rather than the wider national trends. This result will inform the calculation of monetised safety benefits achieved by the scheme as discussed in the Economy section of this report.
Wider Area
Evaluation of Collision Numbers and Severity
3.19. An evaluation of the before and after collision numbers by year for the whole of the wider area is shown in Table 3–1 and Figure 3 2. The severity of a collision is defined by the most serious injury incurred. The table also includes the counterfactual without scheme which is comparable to the after data.
Table 3-1 Number of Collisions by Severity in the Wider Area
Time Period Number of Collisions by
Severity Total Ave. per
year From To Fatal Serious Slight
Before
Aug/2001 Jul/2002 4 18 139 161
176.6
Aug/2002 Jul/2003 1 21 164 186
Aug/2003 Jul/2004 2 10 174 186
Aug/2004 Jul/2005 1 14 168 183
Aug/2005 Jul/2006 3 17 147 167
Construction
Aug/2006 Jul/2007 3 16 152 171
177.5
Aug/2007 Jul/2008 2 16 166 184
Without Scheme Counterfactual (adjusted for background reduction)23 128.9
After
Aug/2008 Jul/2009 3 7 139 149
151.0
Aug/2009 Jul/2010 1 12 144 157
Aug/2010 Jul/2011 3 13 152 168
Aug/2011 Jul/2012 2 4 125 131
Aug/2012 Jul/2013 0 11 139 150
23 Background factor in collision numbers for all roads 2004-2011 was 0.730

Post Opening Project Evaluation A2/A282 Dartford Improvement & M25 Jn 1b-Jn 3 Widening - Five Year After Study
69
Figure 3-2 Number of Collisions on Year by Year Basis for Wider Area
3.20. Table 3-1 and Figure 3-2 show:
The average number of collisions recorded post opening was 151 per year, which is a 14.4% reduction when compared to the before period in which an average of 176.6 collisions were recorded per year;
The ‘without scheme’ counterfactual collision rate (accounting for the background reduction in collisions over time) is calculated as 128.9 collisions per year. Compared to the post opening period collision rate this represents an annual increase of 22;
The annual average number of fatal collisions in the study area reduced by 18% post scheme; and
The annual average number of fatal and serious collisions has reduced by 38% post opening.
A2/A282 Dartford Improvement scheme area
Evaluation of Collision Numbers and Severity
3.21. An evaluation of the before and after collision numbers by year for the A2/A282 scheme area is shown in Table 3–2 and Figure 3-3. The severity of a collision is defined by the most serious injury incurred. The table also includes the counterfactual without scheme which is comparable to the after data.
0
20
40
60
80
100
120
140
160
180
200
Au
g-2
001 t
o J
ul-
2002
Au
g-2
002 t
o J
ul-
2003
Au
g-2
003 t
o J
ul-
2004
Au
g-2
004 t
o J
ul-
2005
Au
g-2
005 t
o J
ul-
2006
Au
g-2
006 t
o J
ul-
2007
Au
g-2
007 t
o J
ul-
2008
Au
g-2
008 t
o J
ul-
2009
Au
g-2
009 t
o J
ul-
2010
Au
g-2
010 t
o J
ul-
2011
Au
g-2
011 t
o J
ul-
2012
Au
g-2
012 t
o J
ul-
2013
Nu
mb
er
ofC
oll
isio
ns p
er
Year
Fatal Serious Slight
Before Post-OpeningConstruction
Period

Post Opening Project Evaluation A2/A282 Dartford Improvement & M25 Jn 1b-Jn 3 Widening - Five Year After Study
70
Table 3-2 Number of Collisions by Severity in the A2/A282 scheme area
Time Period Number of Collisions by
Severity Total
From To Fatal Serious Slight
Before
Aug/2001 Jul/2002 1 5 43 49
47.8
Aug/2002 Jul/2003 0 6 37 43
Aug/2003 Jul/2004 0 2 42 44
Aug/2004 Jul/2005 0 2 57 59
Aug/2005 Jul/2006 2 2 40 44
Construction The construction period has not been included here as it overlapped with the
construction period for the M25 Jn 1b – Jn 3 widening scheme
Without Scheme Counterfactual (adjusted for background reduction)24 36.6
After
Aug/2008 Jul/2009 0 0 35 35
32.4
Aug/2009 Jul/2010 0 3 36 39
Aug/2010 Jul/2011 0 0 36 36
Aug/2011 Jul/2012 1 1 22 24
Aug/2012 Jul/2013 0 4 24 28
Figure 3-3 Number of Collisions on Year by Year Basis for A2/A282 Scheme Area
24 Background factor in collision numbers for urban A roads 2004-2011 was 0.766
0
10
20
30
40
50
60
70
Au
g-2
001 t
o J
ul-
2002
Au
g-2
002 t
o J
ul-
2003
Au
g-2
003 t
o J
ul-
2004
Au
g-2
004 t
o J
ul-
2005
Au
g-2
005 t
o J
ul-
2006
Au
g-2
008 t
o J
ul-
2009
Au
g-2
009 t
o J
ul-
2010
Au
g-2
010 t
o J
ul-
2011
Au
g-2
011 t
o J
ul-
2012
Au
g-2
012 t
o J
ul-
2013
Nu
mb
er
ofC
oll
isio
ns p
er
Year
Fatal Serious Slight
Before Post-Opening
Co
nstr
ucti
on
Peri
od

Post Opening Project Evaluation A2/A282 Dartford Improvement & M25 Jn 1b-Jn 3 Widening - Five Year After Study
71
3.22. Table 3-2 and Figure 3-3 show:
The average number of collisions recorded post opening was 32.4 per year, which is a 15.4% reduction when compared to the before period in which an average of 47.8 collisions were recorded per year;
The ‘without scheme’ counterfactual collision rate (accounting for the background reduction in collisions over time) is calculated to be 36.6 collisions per year. Compared to the post opening period collision rate this represents a saving of 4.2 collisions a year;
The annual average number of fatal collisions in the study area reduced by 66.7% post opening; and
The annual average number of fatal and serious collisions has reduced by 55% post opening.
M25 Jn 1b – Jn 3 widening scheme area
Evaluation of Collision Numbers and Severity
3.23. An evaluation of the before and after collision numbers by year for the M25 Jn 1b – Jn 3 scheme area is shown in Table 3–3 and Figure 3-4. The severity of a collision is defined by the most serious injury incurred. The table also includes the counterfactual without scheme which is comparable to the after data.
Table 3-3 Number of Collisions by Severity in the M25 Jn 1b – Jn 3 widening scheme area
Time Period Number of Collisions by
Severity Total
From To Fatal Serious Slight
Before
Aug/2001 Jul/2002 1 4 23 28
39.0
Aug/2002 Jul/2003 1 8 41 50
Aug/2003 Jul/2004 0 3 45 48
Aug/2004 Jul/2005 0 2 30 32
Aug/2005 Jul/2006 1 4 32 37
Construction The construction period has not been included here as it overlapped with the
construction period for the A2/A282 Dartford Improvement scheme
Without Scheme Counterfactual (adjusted for background reduction)25 25.0
After
Aug/2008 Jul/2009 1 3 25 29
34.8
Aug/2009 Jul/2010 1 5 36 42
Aug/2010 Jul/2011 0 1 32 33
Aug/2011 Jul/2012 0 1 35 36
Aug/2012 Jul/2013 0 1 33 34
25 Background factor in collision numbers for motorways 2004-2011 was 0.641

Post Opening Project Evaluation A2/A282 Dartford Improvement & M25 Jn 1b-Jn 3 Widening - Five Year After Study
72
Figure 3-4 Number of Collisions on Year by Year Basis for M25 Jn 1b – Jn 3 scheme area
3.24. Table 3-3 and Figure 3-4 show:
The average number of collisions recorded post opening was 34.8 per year, which is a 10.8% reduction when compared to the before period in which an average of 39 collisions were recorded per year;
The ‘without scheme’ counterfactual collision rate (accounting for the background reduction in collisions over time) is calculated to be 25 collisions per year. Compared to the post opening period collision rate this represents an increase of 9.8 collisions a year;
The annual average number of fatal collisions in the study area reduced by 33.3% post scheme; and
The annual average number of fatal and serious collisions has reduced by 45.8% post opening.
Statistical Significance of Outturn Collision Impacts 3.25. In order to determine whether the changes in collision numbers observed before and after the
schemes opened are statistically significant, Chi-Square tests have been undertaken. This test uses the before (counterfactual) and after numbers of collisions and traffic flows to establish whether the changes are significant or likely to have occurred by chance.
3.26. The following table shows the results of these tests for the wider area, M25 Jn 1b – Jn 3 and A2/A282 scheme areas.
0
10
20
30
40
50
60
Au
g-2
001 t
o J
ul-
2002
Au
g-2
002 t
o J
ul-
2003
Au
g-2
003 t
o J
ul-
2004
Au
g-2
004 t
o J
ul-
2005
Au
g-2
005 t
o J
ul-
2006
Au
g-2
008 t
o J
ul-
2009
Au
g-2
009 t
o J
ul-
2010
Au
g-2
010 t
o J
ul-
2011
Au
g-2
011 t
o J
ul-
2012
Au
g-2
012 t
o J
ul-
2013
Nu
mb
er
ofC
oll
isio
ns p
er
Year
Fatal Serious Slight
Before Post-Opening

Post Opening Project Evaluation A2/A282 Dartford Improvement & M25 Jn 1b-Jn 3 Widening - Five Year After Study
73
Table 3-4 Statistical significance of changes in collisions
Study Area Chi-square Results
Wider Area26 Statistically significant increase
A2/A282 scheme area Statistically significant reduction (99% confidence)
M25 Jn 1b – Jn 3 scheme area Statistically significant increase (99% confidence)
3.27. All Chi-square results were statistically significant, and therefore indicate that the changes we have seen in collision numbers are not a result of chance. The results of these tests will be used to determine the approach taken in the evaluation of monetised safety benefits presented in the Economics section of this report.
Collision Rates 3.28. The number of collisions along a length of road used together with the AADT for the same
section can be used to calculate a collision rate, known as PIC/mvkm. This allows comparisons to be made which take into account traffic growth.
3.29. Table 3-5 shows observed collision rates during the pre and post scheme periods for the key links improved by the schemes (the A2 east of M25 Jn 2 and M25 between Jn 1b – Jn 3).
Table 3-5 Observed Collision Rates (PIC/mvkm) for Key Links
M25 Jn 2 – Jn 3 M25 Jn 1b – Jn 3 A2 east of M25 Jn 2
Before 0.182 0.178 0.650
Without scheme (Counterfactual for same period as After opening
data)27
0.113 0.111 0.519
After 0.162 0.157 0.372
Saving -0.049 (-43%) -0.046 (-41.4%) 0.147 (28%)
3.30. The results in Table 3-5 show that the A2 east of M25 Jn 2 has seen a reduction in the accident rate of 28%, but both sections of the widened M25 have seen an increase in the accident rate, when compared to the counterfactual without scheme scenario.
Evaluation of Collision Severity Index 3.31. The collision severity index is the proportion of collisions classed as serious or fatal compared
to the total number of collisions. A summary of the before and after opening collision severity percentage by year for the whole of the wider area, and the respective scheme areas is shown in Table 3-6.
26 Not taking account of traffic volumes 27 Counterfactual without scheme is the observed rate in the before period multiplied by the national reduction in collisions rate per mvkm during the comparable period, for the middle year of the data collection periods, in this case 2004 for before the period and 2011 for the after period. The reduction factor in the collision rate for motorways was 0.623 and for urban A roads was 0.798.

Post Opening Project Evaluation A2/A282 Dartford Improvement & M25 Jn 1b-Jn 3 Widening - Five Year After Study
74
Table 3-6 Collision Severity Index by study area
Wider Area A2/A282 scheme area M25 Jn 1b – Jn 3 scheme area
Before 10.3% 8.4% 12.3%
After 7.4% 5.6% 7.5%
3.32. Table 3-6 shows a reduction in the severity index and a similar level of change in all three study areas considered here.
Casualty Numbers 3.33. Analysis has also been undertaken on casualty numbers, and is provided in Appendix C, with
a summary of the findings presented in the table below, compared to collision findings.
Table 3-7 Summary of change in casualty numbers alongside change in collision numbers
Wider Area A2/A282 scheme area M25 Jn 1b – Jn 3 scheme area
Collisions Casualties Collisions Casualties Collisions Casualties
Annual average (Before)
176.6 254.6 47.8 73 39.0 60.8
Annual average (After)
151.0 232.2 32.4 50.4 34.8 57.8
Diff. 25.6 22.4 15.4 22.6 4.2 3.0
3.34. The results in Table 3-7 are interesting because they show a larger collision saving than
casualty saving for both the wider area and for the M25 scheme area. Therefore the collision/casualty data has been analysed more closely to determine the reasons for this. This has shown:
For the wider area and M25 J1b – Jn 3, in the post-opening period, there are a higher number of collisions in which there are 3 or more casualties;
There was also one collision involving 15 casualties on the M25 between J2 and J3 in May 2012 and the collision severity was serious, which would have affected the post-opening results; and
The number of casualties per collision is higher post-opening than pre-scheme for the study areas considered.
Fatalities & Weighted Injuries 3.35. The collision rate discussed previously does not take into account the severity of collisions.
To analyse this we now present the Fatalities and Weighted Injuries metric which is a combined measure of casualties based on the numbers of fatal, serious and slight casualties. The FWI for the five years before and the available after period are shown in Table 3-8. To take into account the change in traffic, and for comparison with other schemes, we also present the FWI rate per billion vehicle kilometres (bvkm). It should be noted that these figures do not account for changes in the background reduction in casualties.

Post Opening Project Evaluation A2/A282 Dartford Improvement & M25 Jn 1b-Jn 3 Widening - Five Year After Study
75
Table 3-8 FWI on the key links
Section Period FWI/collision FWI/year FWI/bvkm
M25 Jn 2 – Jn 3
Before 0.046 1.46 8.4
After 0.041 1.09 6.6
M25 Jn 1b – Jn 2
Before 0.023 0.18 4.1
After 0.019 0.16 3.0
A2 east of M25 Jn 2
Before 0.034 1.65 22.4
After 0.027 0.86 9.9
3.36. Table 3-8 shows that there has been a reduction in the seriousness of collisions (FWI/collision)
of between 10 – 20%, with the largest reduction being seen on the section of the A2 east of
M25 Jn 2. This section has been widened, and also movements to and from this section will
have benefited from the new configuration and lane discipline as a result of the new flyovers.
This section also shows the largest reduction in the number of fatal and serious injuries per
bvkm (of 56%).
Location of Collisions
3.37. The locations of the collisions occurring within the study area over the five years before
construction and the five years since opening have been plotted geographically. Due to the
density of the collisions over the area, it is useful to present this information at a close-up level
to enable meaningful analysis. This information is shown by severity for the A2/A282 (M25 Jn
2) junction in Figures 3-5 and 3-6. It should be noted that an older version of the mapping
showing the previous layout was not available, and therefore the mapping used reflects the
current layout of the junction, meaning that some collisions appear to fall outside the
carriageway, north of the circulatory, where the slip roads have been realigned.

Post Opening Project Evaluation A2/A282 Dartford Improvement & M25 Jn 1b-Jn 3 Widening - Five Year After Study
76
Figure 3-5 Collisions at A2/A282 junction (Five years before construction)

Post Opening Project Evaluation A2/A282 Dartford Improvement & M25 Jn 1b-Jn 3 Widening - Five Year After Study
77
Figure 3-6 Collisions at A2/A282 junction (Five years after opening)

Post Opening Project Evaluation A2/A282 Dartford Improvement & M25 Jn 1b-Jn 3 Widening - Five Year After Study
78
3.38. The following observations can be made from Figures 3-5 and 3-6:
At FYA opening, the density of collision clusters has reduced at almost all parts of the junction;
There are noticeably fewer accidents on the circulatory in the five years since opening than there were in the five years before construction. Undoubtedly, this will be as a result of the 35% reduction in traffic using the circulatory, which is now using the new free-flow links provided by the A2/A282 scheme. Not only has the amount of traffic reduced, but the number of different movements being made at the circulatory has therefore also reduced, and this will have helped to improve safety on the circulatory;
It can also be seen that the occurrence of serious and fatal collisions in the vicinity of the junction has reduced, with no fatal collisions occurring in the five years since opening;
The A2/A282 scheme provided a dedicated free flow slip road for movements from A2 westbound to M25 southbound, and it can be seen that the cluster of collisions around this location has reduced, and no collisions have occurred post opening on the new dedicated slip road28. This shows that separating the traffic making this movement from the circulatory has improved safety;
North of the circulatory, prior to scheme construction, collisions occurred along the full length of the on and off slip roads. This is shown by the collision markers in Figure 3-5 along the alignment of where the slip roads used to be. Post opening, the collision data shows no collisions on the realigned slip roads29, with the exception of one collision for which it is difficult to determine from the data provided whether it occurred on the free-flow link or the slip road from the circulatory. From the data provided, it can be concluded that the realignment of the slip roads and provision of free-flow movements has improved safety north of the circulatory, as well as on the A2 east of the circulatory;
The only location to not show any change in the number of collisions is the A2 eastbound approach to the circulatory which shows a cluster of approximately the same number of collisions in the post opening period as before. This may be linked to the fact that this part of the junction was not improved, as Link E was deferred, therefore the same amount of traffic is still entering the circulatory from this point.
3.39. It was not possible to determine any meaningful trends regarding the location of collisions along the M25 as they are clustered along the entire length in both the before and after periods.
Collisions involving NMUs
3.40. The roads affected by the two schemes are not conducive to use by non-motorised users (NMUs). A Pedestrian and Cyclist Report was prepared in 2004 which stated that the A2/A282 junction was unsuitable for use by cyclists and pedestrians in both its existing and proposed new layout. Use of the A2 by pedestrians was described as minimal or non-existent due to the lack of infrastructure and was only likely to occur as a result of breakdown or collision. The collision data used in this evaluation indicates three collisions involving pedestrians occurred in the vicinity of the A2/A282 junction in the five years prior to construction, and none occurred post opening. It is not considered that the scheme has had any bearing on this. The only other collisions involving pedestrians occurred in the wider study area, the majority of which were located near the Dartford toll plaza.
Collision Causation
3.41. Using the STATS19 data provided, it has been possible to undertake analysis of the contributory factors given for the collisions occurring in both the ‘before’ and ‘after’ periods. It should be noted however that the contributory factor data was only available for one year in the before data, but for the full five years in the ‘after’ period. A rate per annum has been calculated for each of the categories. The table below summarises the results for the wider
28 This was verified with Area 4 team, and also validated against data stored on the DfT website. 29 This was verified with Area 5 team, and also validated against data stored on the DfT website.

Post Opening Project Evaluation A2/A282 Dartford Improvement & M25 Jn 1b-Jn 3 Widening - Five Year After Study
79
area, A2/A282 and M25 scheme areas, respectively. Note, a number of contributory factors may be assigned to each collision.
Table 3-9 Comparison of ‘before’ and ‘after’ Contributory Factors
Are
a
Contributory Factors
Rate per Annum Rate per Annum
Before Constructi
on FYA Before Constructi
on FYA
Wid
er
are
a
Driver/Rider Error 303 195 193 54% 57% 64%
Injudicious Action 87 45 30 16% 13% 10%
Behaviour or Inexperience
44 24 25 8% 7% 8%
Impairment or Distraction
39 13 15 7% 4% 5%
Road Environment Contributed
35 28 14 6% 8% 5%
Vision Affected 21 13 11 4% 4% 4%
Pedestrian Involved
12 10 3 2% 3% 1%
Vehicle Defects 7 3 4 1% 1% 1%
Special Codes 8 11 6 1% 3% 2%
Total 556 341 301 100% 100% 100%
A2/A
28
2 s
chem
e a
rea
Driver/Rider Error 83 54 41 53% 59% 64%
Injudicious Action 28 11 7 18% 12% 11%
Behaviour or Inexperience
16 3 5 10% 3% 8%
Impairment or Distraction
13 2 2 8% 2% 3%
Road Environment Contributed
8 12 5 5% 13% 8%
Vision Affected 6 4 3 4% 4% 5%
Vehicle Defects 1 1 0 1% 1% 0%
Pedestrian Involved
2 2 0 1% 2% 0%
Special Codes 0 5 0 0% 5% 0%
Total 157 91 63 100% 100% 100%
M25 J
n1b –
Jn 3
sche
me a
rea
Driver/Rider Error 51 33 45 52% 55% 65%
Injudicious Action 26 9 8 27% 14% 12%
Road Environment Contributed
9 4 2 9% 7% 3%
Impairment or Distraction
4 3 4 4% 4% 5%
Behaviour or Inexperience
3 3 5 3% 5% 7%
Vision Affected 3 4 3 3% 7% 5%
Vehicle Defects 1 1 1 1% 1% 1%
Special Codes 1 2 1 1% 3% 1%
Pedestrian Involved
0 3 1 0% 4% 1%
Total 98 60 70 100% 100% 100%
3.42. The most common contributory factor given in all three study areas was driver/rider error, and this is the case for both ‘before’ and ‘after’ periods. It is worth noting that the rate per annum of this contributory factor has reduced by 36% over the wider area, and reduced by 12% in

Post Opening Project Evaluation A2/A282 Dartford Improvement & M25 Jn 1b-Jn 3 Widening - Five Year After Study
80
the M25 scheme area. However, it has seen a 50% reduction in the A2/A282 scheme area. This may be linked to the new junction layout, and that the new free flow movements have simplified the movements being made at the junction, and therefore have helped to reduce driver error.
Combined Safety Impact
3.43. This section so far has presented collisions over a wider area, and in the areas directly affected by the two schemes. However, it is clear that safety impacts of the two schemes are interlinked. Severe congestion at Jn 2 for example can result in traffic queues stretching back to the M25 main carriageway, influencing safety on that link. In this case, the junction improvements provided by the A2/A282 scheme are likely to have influenced safety on the M25.
3.44. If we combine the collision impacts of the two scheme areas only, this indicates an increase of just 5.6 collisions per year. This indicates that the larger increase of 22 collisions per year in the wider area shown in Table 3-1 is predominantly from sections outside the scheme extents, on adjoining links. It may also indicate that background trends in collision numbers in this area may not be similar to the national trends upon which the counterfactual is based.
Forecast vs. Outturn Collision Numbers
3.45. Normally, collision impacts for major highway schemes are appraised using the COBA modelling software which forecasts the saving in terms of both collision numbers and economic benefit thereof. However, in the case of both of these schemes, a spreadsheet approach was taken instead, and the results summarised in the appraisal reports. The spreadsheet appraisals or details of them have not been available for this study.
3.46. The following sub-sections provide details of the forecast collision savings taken from the available documents for each scheme.
A2/A282 Dartford Improvement Scheme
3.47. The Economic Assessment Report (June 2002) describes the safety appraisal for this scheme. This was based on a spreadsheet using traffic flows in the opening year and design year combined with collision rates from COBA which were applied as combined link and junction collision rates. The EAR shows that the forecast collision saving in the opening year was three collisions. The EAR was based on an appraisal period of 30 years.
3.48. When the revised scheme was proposed, no re-appraisal of the safety impact occurred as it was considered that the change in benefits would be small, therefore the appraisal period was still 30 years. The latest AST for the scheme (dated January 2004 – with Link E deferral) states:
‘Improved junction layout to deal with peak-time queuing problem on A2 and M25 should improve safety. (Figures include accidents saved in Kent Thameside area and exclude accidents during maintenance and construction of scheme). A saving of 77 accidents was forecast.’
M25 Jn 1b – Jn 3 widening scheme
3.49. The appraisal included the assessment of the number and severity of collisions that would occur with and without the scheme. These were assessed by analysing the network flows and applying default collision rates from the Department for Transport’s COBA manual. The SAR did not include details of the scope of roads included.
3.50. The safety forecast in the AST was:
‘forecast increase in accident rate on M25 Jn 1b – Jn 3 as a result of increase in traffic from widening is more than compensated for by reduction in traffic on local roads from

Post Opening Project Evaluation A2/A282 Dartford Improvement & M25 Jn 1b-Jn 3 Widening - Five Year After Study
81
traffic reassignment to M25, resulting in monetary benefits and overall reductions in accidents’.
3.51. The AST did not detail the number of collisions forecast to be saved overall, nor did it detail the expected increase in collisions on the scheme sections. It did however give a range of monetised safety benefits ranging from £0.9m to £4.2m. Using the default collision rates and the collision values specified in the COBA manual, it is estimated that the forecast collision saving was equivalent to less than one per year over 30 years.
3.52. Which of the local roads was forecast to show a safety benefit from reassignment to the widened M25 was not specified. However, it is presumed that it was the A225, the only north-south parallel ‘A’ road in the area. The traffic forecasts taken from the appraisal documents and shown earlier in Section 2 of this report did not include non-strategic roads, so there was no forecast impact on this road that observed changes could be compared to. However, the traffic data presented in Section two of this report showed no reduction in traffic volumes on the A225, and therefore no evidence that the scheme has resulted in reassignment away from that route onto the M25. On that basis, it is not reasonable to infer a reduction in collisions as a result of reduced traffic levels.
3.53. Table 3-10 shows the forecast opening year collision savings as understood from the schemes’ appraisal documents compared to the observed collision changes at FYA. The outturn change has been calculated using the without scheme counterfactual presented earlier.
Table 3-10 Comparison of Forecast and Outturn Net Collision number changes
Scheme Forecast Opening
Year Change Observed Change at
FYA30
A2/A282 -3 -4.2
M25 Jn 1b – Jn 3 <- 1 9.8
Combined -3 to -4 5.6
3.54. It should be noted that the forecasts were based on a wider area including Kent Thameside, the exact geographical extents of which are unknown, where safety benefits were forecast based on the beneficial impact of some traffic reassignment to the motorway network from local roads. Collision data for local roads was not covered by this analysis because it is clear that in the time period covered in this report (2001 to 2013) that it would be unrealistic to reliably distinguish the impacts of the two schemes from many other changes that have occurred over time.
3.55. It can be seen that the observed change in the A2/A282 scheme area has been a slightly higher saving than forecast. On the other hand, the sections directly affected by the M25 Jn 1b – Jn 3 have seen an increase in collisions compared to a small forecast saving. As previously mentioned, the forecast covered a wider area and included collision savings on local roads from reduced traffic using them. The traffic analysis in this report shows little evidence of this reduction on local roads, and it is difficult to examine this in any further detail due to the sparsity of recent traffic data on local roads in Kent. However, from the information that has been available for this evaluation, it is considered that the forecast collision saving from reduction in traffic on local roads has not transpired.
30 Based on change between without scheme Counterfactual and Post Opening five years after

Post Opening Project Evaluation A2/A282 Dartford Improvement & M25 Jn 1b-Jn 3 Widening - Five Year After Study
82
Stage 4 Road Safety Audit 3.56. A Road Safety Audit Stage 4 (RSA4): 12 month monitoring report was produced in November
2011. Problems raised at this audit which may have a bearing on the findings of this evaluation were:
Poorly positioned directional sign at M25 southbound between the exit towards Jn 2 roundabout and the A2 eastbound exit which may result in late lane changes (Problem D1.2). This issue was raised at the Stage 3 audit, but the sign had not been removed;
Faded road markings on the Jn 2 roundabout. Due to the frequency of lane changes and turning movements that are carried out, the markings on the roundabout will fade more quickly than on adjoining links. If the markings become too faded, lane discipline is likely to suffer and could result in side-swipe collisions, and late/erratic lane changes (Problem D1.3).
3.57. A site visit for this FYA evaluation has confirmed that the directional sign (Problem D1.2) is
still in place. Two collisions occurred at this location whilst the site visit was being undertaken. Whilst there is potential for this sign to be misleading, it is more likely that the gantry signage prior to this junction is the main reason for late lane changes. There are two gantries in quick succession on the southbound approach to junction 1b of the A282, the signage at the first gantry signifies that the two nearside lanes are for A2 traffic. The second signifies that lane 1 is for A2 westbound traffic and lane 2 is for A2 eastbound traffic. If the second gantry is missed by a driver who is in the wrong lane it is only when they approach the third gantry, which is positioned after the diverge, that they would realise they were in the wrong lane, potentially leading to a last minute lane change.
3.58. The site visit also confirmed that the road markings on the circulatory carriageway (Problem D1.3) of junction 2 are faded and have the potential to lead to poor lane discipline. The legibility of the markings would decrease in wet weather. The situation isn’t helped as drivers’ views of gantry signage further around the roundabout is often blocked by vegetation growth.
3.59. A collision cluster on the A2 near Wood Lane was also investigated. Collision reports signified that the majority of collisions occurred in the wet, with some reporting that aquaplaning had taken place. A visual inspection of the gullies and hardstrips in the verges and central reserve of the A2 from Wood Lane overbridge revealed a number of blocked gullies and a large amount of silt-type debris that could potentially lead to poor drainage and standing water on the carriageway in wet periods of weather.
Figure 3-7 Faded Markings at A2/A282 Junction

Post Opening Project Evaluation A2/A282 Dartford Improvement & M25 Jn 1b-Jn 3 Widening - Five Year After Study
83
Figure 3-8 Poor Visibility to Sign Gantry at A2/A282 Junction
Figure 3-9 Blocked Gully at Wood Lane Overbridge on the A2 Eastbound
3.60. The Stage 4 Road Safety Audit also included analysis of collisions, however the pre-construction data used was based on 36 months of data, and the post opening data was for just 12 months (from December 2009 to November 2010). It is considered more robust to use five years’ worth of collision data when analysing trends, however a summary of the RSA4 findings with comments is provided below.
3.61. The following three areas were identified as cluster locations in the RSA4:
Northbound between M25 Jn 3 and Jn 2 – in the pre-construction period used for the RSA4, there were 13.7 collisions per annum, and over half of these collisions were rear end shunts. In the post opening 12 month period there were 19 collisions. 13 of those 19

Post Opening Project Evaluation A2/A282 Dartford Improvement & M25 Jn 1b-Jn 3 Widening - Five Year After Study
84
collisions were rear-end shunts. The remaining 6 collisions came about due to lane change manoeuvres. POPE FYA comments: It is not possible from the data made available to POPE to determine the direction of collisions occurring on this link because the OSGRs are not accurate enough. However, analysis of the POPE collision data on both carriageways has shown that overall collisions have reduced from 31.4 per annum to 26.6. During the last year included in the FYA data (which would take account of the Controlled Motorway being in operation) 28 collisions occurred. When analysing the contributory factors and their rates per annum, there was a reduction following the opening of the controlled motorway in the following contributory factors: following too close, failed to judge other person’s path or speed; and sudden braking. This indicates that the controlled motorway has helped to reduce collisions with this type of cause.
M25 Jn 2 dedicated slip road to A2 westbound – the road follows a sweeping left-hand bend in this slip lane and particularly at a junction between two roads at national speed limit, it gives drivers confidence to travel at inappropriate speeds. All 5 collisions over the 4 year RSA4 period occurred in wet or icy conditions, and so the drainage or skid resistance of the road at this location may be an issue. POPE FYA comments: Analysis of the POPE collision data in this area has shown that there have been four collisions in the FYA period, two were in wet or icy conditions and three describe a contributory factor to be ‘loss of control’. Neither of the schemes being evaluated affected the alignment of this slip;
A2 westbound, Wood Lane overbridge (east of M25 Jn 2) – In the 12 month period post opening, there was a cluster of collisions within the vicinity of the Wood Lane overbridge, 4 of these collisions occurred when it was wet, and 3 involved the driver losing control. One of the collisions specifically referred to the vehicle ‘aquaplaning’. The RSA4 states ‘this set of data is small but may be indicative of a potential drainage problem on this carriageway that has been brought about by the changes implemented as part of the scheme....the carriageway has been widened from 3 to 4 lanes in each direction at this point and the carriageway is bordered by a solid concrete barrier on both sides which may be impeding drainage’. POPE FYA comments: Evaluation at this FYA stage regarding drainage is included in Section 5 of this report, and analysis of collisions at this location shows that 8 collisions have occurred at this location (six of which were in wet conditions) in the five years post opening. Most of these were due to the road surface being wet/damp and the vehicle driving into standing water/aquaplaning, which seems to support the comments made in the RSA4.
Security 3.62. The aim of this sub-objective is to consider both the changes in security and the likely number
of users affected by the changes. For highway schemes, security includes the perception of risk from damage to or theft from vehicles, personal injury or theft of property from individuals or from vehicles. Security issues may arise from the following:
On the road itself (e.g. being attacked whilst broken down).
In service areas/car parks/lay-bys (e.g. vehicle damage while parked at a service station, attacked whilst walking to a parked car).
At junctions (e.g. smash and grab incidents while queuing at traffic lights.
3.63. The primary indicators for roads include surveillance, landscaping, lighting and visibility, emergency call facilities and pedestrian and cycling facilities.
Forecast
3.64. Forecasts of the security sub-objective impact were included in the AST for each scheme, these were:
A2/A282 Dartford Improvement: the impact of the proposed CCTV coverage at Jn 2 would be slightly beneficial in terms of security;

Post Opening Project Evaluation A2/A282 Dartford Improvement & M25 Jn 1b-Jn 3 Widening - Five Year After Study
85
M25 Jn 1b – Jn 3 widening: there would be slight benefits to security as CCTV was incorporated throughout M25 Jn 1b – Jn 3. Emergency call facilities would be improved compared to the existing situation – slight positive.
3.65. The SAR for the M25 Jn 1b – Jn 3 widening scheme also stated that the provision of four CCTV cameras would ensure that the police could monitor the road between Jn 1b and 2 where the layout means that emergency phones could not be installed.
Evaluation
3.66. CCTV cameras were installed at locations on the main carriageway of the M25 and A2, and at the junction, as planned. Since the OYA evaluation was completed, the Controlled Motorway scheme between Jn 2 – Jn 3 on the M25 has also opened (in May 2012) which means a number of cameras were installed as part of the communications infrastructure.
3.67. All of these cameras are plotted geographically on the trafficengland.com website which is publicly accessible, and users can view current images from each of the cameras, as the example shown in Figure 3-10.
Figure 3-10 CCTV image from trafficengland.com website
3.68. During the site visit for this FYA evaluation, CCTV was observed on the A2 between the M25 and Bean junction and on the A2 circulatory carriageway, see Figure 3-11. CCTV was also observed on the M25 between junction 2 and 3, although this could have been introduced as part of the controlled motorway scheme which was implemented after the widening.
3.69. Emergency Roadside Telephones (ERTs) at regular intervals were observed on the A2 and M25. Figure 3-12 shows ERTs on the M25 just south of Hawley Road underbridge between junctions 2 and 3.

Post Opening Project Evaluation A2/A282 Dartford Improvement & M25 Jn 1b-Jn 3 Widening - Five Year After Study
86
Figure 3-11 CCTV at Junction 2 Circulatory
Figure 3-12 ERTs on M25 Junctions 2-3
3.70. The RTMC31 (Regional Technology Maintenance Contractor) were consulted regarding the status of the CCTV cameras in the vicinity of the schemes and they have provided the following information:
‘There are 16 x second generation CCTV cameras manufactured by CHUBB in the area of the scheme. These are known as version B cameras. At the time of handover from the scheme to TechMAC, there were some concerns that the cameras would not be supported by the Highways England, as the latest version of the cameras at the time was Version C. The Highways England mitigated this risk, and liaised with the manufacturer to ensure that the cameras were supported going forward. There are 3 other CCTV first generation cameras (TYCO) in the area, which are understood to have
31 The RTMC was formerly known as TechMAC

Post Opening Project Evaluation A2/A282 Dartford Improvement & M25 Jn 1b-Jn 3 Widening - Five Year After Study
87
been in place prior to the scheme. At the time of writing, all of the cameras except for one are understood to be in operation’.
3.71. The CCTV cameras have undoubtedly improved security in the vicinity of the schemes,
particularly the monitoring of the bridge sections of the widened M25 where there is now no hardshoulder following the widening, and where emergency phones cannot be installed. Combined with CCTV cameras installed at Jn 2, and improved emergency call facilities, it is therefore concluded that there has been a slight beneficial impact from each scheme on the security sub-objective. Although there have been a large number of road users affected by the scheme, the impact on Security is considered to be only slight because there were some emergency call facilities already in place, and also being a motorway, road users are less likely to be subject to crime whilst stationary or queuing than other types of road. Therefore the slight beneficial impact is as expected.
Key Points – Safety
Collisions Analysis of the observed collision data for the A2/A282 scheme area shows a saving (when
compared to the counterfactual) of 4.2 collisions a year. This is slightly higher than the forecast saving (better than expected), and is statistically significant, suggesting that the scheme has had a direct beneficial impact for safety at the junction.
Analysis of the observed collision data for the M25 Jn 1b – Jn 3 scheme area shows an increase (when compared to the counterfactual) of 9.8 collisions a year. This change in collision numbers is also statistically significant but the results are worse than expected.
Combining the changes from both scheme areas gives an overall increase (compared to the counterfactual) of 5.6 collisions a year.
Collision/ Casualty Severity The collision severity index has reduced in all three study areas evaluated, namely; wider
area (which includes adjoining links to both schemes), A2/A282 scheme area and M25 Jn 1b – Jn 3 scheme area.
The section of the A2 east of the M25 Jn 2 has seen a large reduction in the number of fatal and serious injuries per bvkm (of 56%) and a noticeable reduction in the seriousness of collisions (FWI/collision).
Forecasts Limited information is known about the assumptions used and numbers of collisions
forecast in the Do-Minimum and Do-Something scenarios from the schemes’ appraisals.
Comparison of the forecast number of collision savings and those observed shows that the A2/A282 has produced a slightly higher saving than forecast, whilst for the M25 Jn 1b – Jn 3 scheme, the small saving predicted has not transpired. These findings however are presented with the caveat that the exact geographical bases of the forecasts are unknown and no collision data on local roads has been used in the assessment of the observed changes.
Security The CCTV cameras have improved security in the vicinity of the schemes, particularly the
monitoring of the bridge sections of the widened M25 where there is now no hardshoulder following the widening, and where emergency phones cannot be installed. Combined with CCTV cameras installed at Jn 2, and improved emergency call facilities, it is therefore concluded that there has been a slight beneficial impact from each scheme on the security sub-objective.

Post Opening Project Evaluation A2/A282 Dartford Improvement & M25 Jn 1b-Jn 3 Widening - Five Year After Study
88
4. Economy
Introduction 4.1. This section of the report presents an evaluation of how the scheme is performing against the
economy objective, which consists of the following sub-objectives to:
Achieve good value for money in relation to impacts on public accounts;
Improve Transport Economic Efficiency (TEE) for business users, transport providers and consumer users;
Improve journey reliability; and
Provide beneficial wider economic impacts.
4.2. The A2/A282 Dartford Improvement and M25 Jn 1b – Jn 3 schemes were developed separately. The A2/A282 scheme was a standalone scheme prior to any consideration of the M25 scheme, and the M25 scheme originated from the M25 Rapid Widening programme.
4.3. In 2006, additional economic appraisals were undertaken for each scheme which included the assumption that the other scheme would be built. There were also Low and High Growth scenarios appraised taking account of the following variations to the A2/A282 scheme:
Link E built as part of the scheme and open in 2007;
Link E deferred to 2014;
Link E deferred to 2022, the design year; and
Link E deferred for whole evaluation period. 4.4. The forecast costs and benefits of the last of these scenarios is detailed in this report. A
comparison is made between the outturn costs and benefits and the forecast economic impacts. Consideration is also given to the schemes’ wider economic impacts.
4.5. Five years after scheme opening, outturn costs are usually close to the final cost, subject to any remaining Part 1 compensation claims. For these schemes, as-spent costs were provided by the Highways England Regional Finance Manager in January 2014. All costs presented in this report are in 2002 prices.
Sources
A2/A282 Dartford Improvement Scheme
4.6. The original economic appraisal (A2/A282 Dartford Improvement Economic Assessment Report Part 1 and Part 2 Economic Assessment) was issued in 2003 for the OPR. Following a cost challenge review and proposal to modify the scheme by deferring construction of the free-flow Link E, a revised assessment was undertaken and was summarised in the report A2/A282 Dartford Improvement Economic Assessment Report Addendum II (June 2006). This review also updated the economic parameters in line with revised Government guidelines which meant the appraisal period was adjusted to 60 years (rather than 30), the price base was adjusted to 2002 prices, and discounting changed to 3.5% for the first 30 years and 3% thereafter. This addendum presents the final appraisal prior to construction, and has therefore been used as the basis of this POPE FYA evaluation.
M25 Jn 1b – Jn 3 widening scheme
4.7. The scheme was originally modelled as part of the wider study into the rapid widening of sections of the M25 for an opening year of 2011. The approved Economic Assessment Report (EAR) of 2006 reported the benefits of the scheme assuming full implementation of the original version of the A2/A282 scheme. However the Stage 3 EAR Addendum was issued in September 2006 and included an economic assessment of the scheme with Link E of the A2/A282 scheme deferred for the full appraisal period.

Post Opening Project Evaluation A2/A282 Dartford Improvement & M25 Jn 1b-Jn 3 Widening - Five Year After Study
89
4.8. Modelling was based on TUBA (Transport User Benefit Appraisal) which provided details of user benefits, vehicle operating costs and revenue charges. The opening year was assumed to be 2008, and the appraisal was over a 60 year assessment period.
4.9. This latter appraisal detailed in the EAR Addendum reflects the as-built situation, and has therefore been used as the basis for this POPE FYA evaluation.
M25 Jn 2 – Jn 3 Controlled Motorway scheme (Opened May 2012)
4.10. The controlled motorway was appraised separately from the widening scheme and at a later date although the two schemes were built at the same time. The forecast economic impacts presented in this chapter are from the M25 Junctions 2 to 3 Variable Speed Limits and Enforcement Impact Assessment Annex C, July 2010. That report used 2008 present value and a 30 year appraisal period as it is a technology scheme, rather than 60 years. The figures presented in this chapter have been converted into 2002 present value for consistency with the other values.
4.11. The forecast benefits were derived primarily from collision savings.
4.12. As the impacts of the widening and of the CM cannot be easily split, this report considers the forecast benefits of the CM alongside the Widening.
Summary of the Scheme Appraisals
A2/A282 Dartford Improvement Scheme
4.13. The following table shows the various scenario appraisals for the scheme, taken from the EAR Addendum II, for Low Growth (LG) and High Growth (HG) forecasts. The scheme scenarios were modelled for the four options when Link E could be built as listed in Paragraph 4.3. The inclusion of Link E was forecast to increase the costs and benefits slightly. Here we show the conservative forecasts with no Link E (Table 4-1). At the time of writing, there are no current proposals to construct Link E. Therefore, for the remainder of this evaluation of economic impacts, the full deferral (of 60 years) of Link E has been used, as this provides the most conservative estimate of benefits and allows a comparison of the forecast and outturn cost of the scheme without considering the future cost of Link E.

Post Opening Project Evaluation A2/A282 Dartford Improvement & M25 Jn 1b-Jn 3 Widening - Five Year After Study
90
Table 4-1 Forecast Costs and Benefits for A2/A282 scheme (Link E deferred indefinitely)
Source: EAR Addendum II
A2/A282 Dartford Improvement
LG HG Central Growth
Travel Time Benefits £114.7m £196m £155.4m
VOC Benefits £20.5m £29.4m £25.0m
Net change in user charges and business revenue £1.6m £0.7m £1.2m
Safety Benefits £1.8m £0.7m £1.2m
Present Value Benefits (PVB) £138.6m £226.1m £181.5m
Investment Costs £97.3m £97.3m £97.3m
Indirect Tax £4.1m £5.8m £5.0m
Present Value Costs (PVC) £101.4m £103.1m £102.3m
Benefit Cost Ratio (BCR) with indirect tax as a cost 1.4 2.2 1.8
Benefit Cost Ratio (BCR) with indirect tax as a benefit 1.4 2.3 1.8
4.14. Table 4.1 shows that a BCR of 1.8 was forecast for when indirect tax is considered as part of the cost (this is the approach used in the original appraisal). In this case, the scheme was forecast to loss of indirect tax revenue of £5.0m and this means that the government would receive £5.0m less tax from the scheme due to lower fuel consumption, which increases the overall cost of the scheme to the government. The BCR, with indirect tax as a cost, is therefore a calculation of the overall benefits (£181.5m) divided by the investment cost (£97.3m) and indirect tax (£5.0m) summed. As the scheme does not change the road length, the reduced indirect tax as a result of lower fuel consumption can be attributed to greater fuel efficiency due to reduced congestion.
4.15. The net change in user charges and business revenues is a combination of increased user charges relating to the tolls for vehicles using the Dartford Crossing and increased revenue gained by the operator of the Dartford Crossing.
M25 Jn 1b – Jn 3 Widening Scheme
4.16. The following table shows the forecast costs and benefits for the M25 widening, again, showing LG and HG forecasts, for the scenarios where Link E was deferred indefinitely. The appraisal was based on a Do-Something scenario where both M25 widening scheme and A2/A282 scheme were built compared to a Do-Minimum, where neither scheme was built.
4.17. The evaluation of the benefits of the widening based on the observed data will clearly pick up the impacts of the controlled motorway, so we must consider what the forecast benefits were for that scheme too. These, and the combined total forecast for the two schemes is shown in the rightmost columns of Table 4-2.
4.18. Note that the CM scheme appraisal did not include the indirect tax impact, but did additionally monetise enforcement costs and reliability and carbon benefits which have not been shown here for consistency reasons.

Post Opening Project Evaluation A2/A282 Dartford Improvement & M25 Jn 1b-Jn 3 Widening - Five Year After Study
91
Table 4-2 Forecast Costs and benefits for M25 scheme (Link E deferred scenario)
Sources: EAR Addendum CM Impact Assessment
M25 Jn 1b – Jn 3 widening (60 years appraisal period)
Controlled motorway (30 year
appraisal)
Combined M25
schemes
LG HG Central Growth
Central growth
Travel Time Benefits £140.5m £304.0m £222.3m -£1.4m £220.8m
VOC Benefits £0.3m £5.3m £2.8m - £2.8m
Net change in user charges and business revenue
£0.5m £1.2m £0.9m - £0.9m
Safety Benefits £0.9 £4.2m £2.6m £15.5m £18.1m
Present Value Benefits (PVB) £142.2m £314.7m £228.6m £14.0m £244.6m
Investment Costs £65.3m £65.3m £97.3m £6.8m £111.4m
Indirect Tax £1.5m £6.3m £3.9m - £3.9m
Present Value Costs (PVC) £66.8m £71.6m £101.2m £6.8m £107.9m
Benefit Cost Ratio (BCR) with indirect tax as a cost
2.1 4.4 2.2 2.1
Benefit Cost Ratio (BCR) with indirect tax as a benefit
2.2 4.7 2.3 2.3
4.19. Table 4-2 shows that a BCR of 2.2 was forecast when indirect tax is considered as part of the cost (original appraisal approach). As with the A2/A282, the M25 scheme was forecast to produce a loss of indirect tax revenue equal to £3.9m over the appraisal period and the interpretation of this is the same as that detailed in Paragraph 4.15 for the A2/A282. The net change in user charges and business revenues is a combination of increased user charges relating to the tolls for vehicles using the Dartford Crossing and increased revenue gained by the operator of the Dartford Crossing.
4.20. Inclusion of the CM scheme makes negligible impact on the BCR.
Transport Economic Efficiency (TEE) 4.21. Benefits to business and consumer users in the Transport Economic Efficiency (TEE)
component of TUBA are assessed from the following:
Vehicle Hour Savings i.e. Travel time benefits;
Vehicle Operating Costs (VOCs);
User Charges; and
Private Sector revenue.
Background to POPE economic evaluation methodology
4.22. Based on the POPE evaluation of numerous other schemes across the national network we have found that a majority of scheme benefits are derived from Link Transit Time (vehicle hour) benefits which provide economy benefits.
4.23. The basis of POPE methodology (in terms of vehicle hour savings) is a comparison of changes in total link transit times before and after scheme opening using observed journey times and traffic flows and applying this ratio to the predicted savings over the full appraisal period. As such, this method is most commonly applied to schemes that have been appraised using COBA software. Vehicle hour savings for both the A2/A282 and M25 schemes were appraised using TUBA software, and collision savings were forecast using a spreadsheet model rather COBA. TUBA modelling is based on Origin-Destination matrices, and is clearly a more appropriate modelling tool for schemes of the complexity of these, where growth and elasticity

Post Opening Project Evaluation A2/A282 Dartford Improvement & M25 Jn 1b-Jn 3 Widening - Five Year After Study
92
are important. However, a TUBA model cannot be used as the basis of a post opening evaluation without replicating the whole modelled area, which is logistically and financially not feasible. As TUBA output does not report impacts on a link basis it is not possible to extract a subset of traffic impacts to compare against observed data. Hence the POPE methodology is not suitable for this FYA evaluation of these schemes.
4.24. As an alternative approach, the travel time benefits for these schemes have been evaluated using a PAR approach, typically adopted for the appraisal of smaller schemes. This evaluation is therefore subject to a number of caveats and assumptions:
The evaluation only includes journey time savings on the A2 and M25 (Jn 2 – Jn 3), and the A2/A282 junction, and not the wider area. The appraisal however was based on these roads as well as M25 Jn 1b – Jn 2 and local roads in the Kent Thameside area. Therefore this evaluation is likely to be a conservative one, missing the potential benefits in the wider area;
The evaluation only considers the impact of the schemes with Link E of the A2/A282 deferred indefinitely (for 60 years);
The PAR method provides capitalisation factors which depend only on the road type and forecast growth rate, whereas the modelling tools used for the forecasts would have considered the complexity of how traffic growth would affect future traffic behaviour in detail. For these schemes in particular, the forecasts would have been influenced by the timing and severity of forecast congestion with or without the schemes;
The forecast impacts of the controlled motorway which opened in May 2012 between M25 Jn 2 and Jn 3 were not included in the scheme appraisals.
4.25. In the M25 widening appraisal, the Do-Minimum scenario included the A2/A282 Dartford
Improvement scheme being built, and in the Do-Something scenario, both schemes being built. This means that there is no duplication of benefits across the two schemes. Therefore it is valid to sum the benefits of each to get a total benefit for the two improvements.
PAR Evaluation of Travel Time Benefits 4.26. Although Jn 1b – Jn 2 of the M25 is not included in the evaluation due to a lack of useable
journey time comparison data, it is not considered that this will have significantly affected the outturn results. This section is less than 1km, and therefore only a small part of the overall journey time changes. It is considered more appropriate to exclude this section from the TEE results and assume the outturn is a conservative estimate, than to try to include estimated data based on too many assumptions and with heavy caveats.
4.27. The monetised benefits are accrued by all the existing traffic using these routes, and according to the economic concept known as rule-of-half, POPE evaluation assigns 50% the level of benefit to additional traffic on the routes.
4.28. The outturn travel time savings using FYA data for each scheme using the PAR method as outlined above, assuming NRTF rate of traffic growth, are summarised in Table 4-3.
Table 4-3 Summary of the outturn TEE Benefits from PAR method
Scheme 60 year benefits
A2/A282 £149.6m
M25 Jn 1b – Jn 3 £56.7m
Combined £206.3m

Post Opening Project Evaluation A2/A282 Dartford Improvement & M25 Jn 1b-Jn 3 Widening - Five Year After Study
93
4.29. The following conclusions can be drawn:
The 60 year benefits for the A2/A282 scheme (£149.6m) are 16% lower than the forecast of £179m, and smaller than at OYA. This is because of the smaller vehicle hours savings, derived from the smaller journey time savings at FYA than at OYA. There is no detailed forecast journey time information for the scheme, however analysis of the forecast traffic volumes on the A2 in Chapter 2 of this report showed that the growth in traffic volumes with the scheme had not occurred to the anticipated extent, and this was because the observed ‘before’ flows were higher than the forecast Do-Minimum flows on the A2. Consequently the observed change in vehicle hours has not been as high as forecast. However, given the scale of the scheme and the volume of traffic using this junction, the forecast is still considered to have been reasonably accurate;
The outturn 60 year benefits for the M25 scheme (£56.7m) is some 73% smaller than the forecast of £207.8m. This is largely because:
It is a conservative estimate that does not include journey time benefits between Jn 1b – Jn 2, and other roads in wider Kent;
Traffic volumes have reduced over recent years on the M25, and FYA volumes are significantly lower than in the Do-Something forecasts for the scheme, and therefore fewer vehicles are receiving the journey time benefits.
In addition to this, journey time savings along Jn 2 – Jn 3 are less than the forecast estimate given in the AST and this will have also reduced the vehicle hours saving.
4.30. For most highway schemes including these, the VOC and indirect tax impacts are both very closely linked to changes in fuel consumption (e.g. changes in speeds) which has similar magnitude of impacts, but from opposite sides of the benefits balance. That is, if there is reduced fuel consumption from more fuel efficient speeds, VOC will reduce due to users paying less for fuel (i.e. a benefit) and thus less indirect tax will be collected by the Treasury. For this scheme, due to the complexities within these schemes, the VOC benefits have been assumed as forecast.
Monetised Safety Benefits 4.31. The monetary benefits emerging from changes in safety are calculated by assigning monetary
values to the reduction in the number and severity of personal injury collisions (PICs) over the appraisal period.
A2/A282 Dartford Improvement Scheme Forecast
4.32. The Traffic & Economics Proof of Evidence (2004) presented safety forecasts based spreadsheets, rather than COBA (Cost Benefit Analysis). These used default values for collision rates and costs from COBA, for both the Do-Minimum and Do-Something scenarios. As there is no difference between COBA collision rates for dual 3 lane carriageways and dual 4 lane carriageways, the increase in traffic in the Do-Something forecasts resulted in an increase in the number of collisions on the A2. However these additional collisions were offset by an expected reduction in collisions elsewhere on the road network including parts of the junction, caused by a reduction in traffic levels. Forecast economic benefit was £0.85m for 30 years at 1998 prices. This was considered to be a conservative estimate of the benefits.
4.33. When the appraisal was revisited in 2006, the conservative estimate was still considered appropriate, and therefore the 2006 appraisal was simply a rebasing of the earlier figure, and remained as being based on the assumption that safety benefits would only occur in the first 30 years. Note that unlike the TEE benefits, this appraisal period was not changed to 60 years and it was stated that it was not expected that safety benefits would extend beyond the 30 years.
M25 Jn 1b – Jn 3 Widening Scheme Forecast
4.34. Collision savings were evaluated using a spreadsheet based on COBA figures. This was used to predict the number of collisions, and collisions by severity in the future.

Post Opening Project Evaluation A2/A282 Dartford Improvement & M25 Jn 1b-Jn 3 Widening - Five Year After Study
94
4.35. The AST states that the ‘increase in accident rate on M25 J1b – 3 as a result of the forecast increase in traffic from the widening is more than compensated for by reductions in traffic on local roads from traffic reassignment to M25, resulting in monetary benefits and overall reductions in collisions’.
4.36. The economic value ranged from £0.9m at low growth and £4.8m high growth, as shown in Table 4-4. The area covered by this spreadsheet appraisal was neither detailed in the appraisal documentation nor the distribution of the benefits over the appraisal period. What can be deduced from the monetary values however, is that the opening year impact would be less than two collisions which is a figure too low to be able to distinguish from random variation with any statistical confidence.
4.37. A summary of the two forecasts is provided in the table below for Low Growth and High Growth scenarios with the addition of impact of the Controlled Motorway.
Table 4-4 Summary of the Forecast Safety Benefits
Scheme LG HG Central Growth
A2/A282 £1.8m £0m £0.9m
M25 Jn 1b – Jn 3 widening £0.9m £4.2m £2.6m
M25 Jn 2 – Jn 3 Controlled Motorway £15.5m
Combined £2.8m £4.2m £18.1m
Evaluation of Safety Benefits at FYA
4.38. The spreadsheet or its details for the appraisal of safety benefits was not available for use in this evaluation. The chosen method for the evaluation in POPE where details of the forecast are not available is to use aspects of the PAR method, which is based on the standard Highways England method defined for simpler schemes. The PAR method is based on an estimate of the opening year collision saving (in this case it would be the annual average saving observed at FYA) being monetised to a long term benefit.
4.39. POPE methodology denotes that the change in collisions is based on the difference between the ‘counterfactual’ (without scheme estimate) and the post opening annual average PIC. Furthermore, only changes that are found to be statistically significant are included in the economic safety impacts of the scheme. In this case, changes for both schemes were found to be statistically significant, as shown in Section 3 of this report.
Table 4-5 Outturn Monetised Safety Benefits
Scheme Outturn Safety
Benefit
A2/A282 £10.0m
M25 Jn 1b – Jn 3 -£27.8m
Combined -£18.8m
4.40. As can be seen from the table above, the A2/A282 scheme has produced an outturn safety benefit of £10m, however the increase in collisions observed along M25 Jn 1b – Jn 3 has produced an overall safety disbenefit for the schemes combined. Given that some of the safety benefit predicted for both schemes was associated with a forecast reduction in traffic on local roads, thus leading to a reduction in collisions on those roads, and this evaluation has shown no evidence that this has occurred, then it is considered that an overall disbenefit is a realistic estimate at this FYA stage and without further information on local traffic levels available.

Post Opening Project Evaluation A2/A282 Dartford Improvement & M25 Jn 1b-Jn 3 Widening - Five Year After Study
95
4.41. It is concluded from this evaluation that the controlled motorway has made negligible difference in terms of collisions, as shown in the collision numbers by year in the post opening period (shown in Section 3 of this report), and has therefore also not produced the monetary safety benefit which was forecast.
Scheme Costs 4.42. This section provides a comparison of the forecast costs of the two schemes with the outturn.
The outturn cost does not include the costs of the Controlled Motorway works undertaken at the same time as the M25 widening scheme.
4.43. Five years after scheme opening, outturn costs are usually close to the final cost, subject to any remaining Part 1 compensation claims. For these schemes, as-spent costs were provided by the Highways England Regional Finance Manager in January 2014. All costs presented in this report are in 2002 prices.
4.44. The EAR Addendum for each scheme from 2006 gave the following details for each scenario for each scheme:
Investment cost;
Indirect Tax impact; and
Overall Present Value Costs.
4.45. All were given in 2002 prices, discounted to 2002. No breakdown of the spend profile was available but as the schemes were constructed within the planned time period, no adjustment was necessary.
4.46. To compare the forecast investment cost with the as-spent cost, the market price factor was removed from the investment costs and also discounting removed. The forecast for the A2/A282 scheme relates to the scheme without Link E.
Table 4-6 Investment Costs in 2002 prices
Scheme Forecast Outturn % Difference
A2/A282 £94.2m £106.2m 13%
M25 Jn 1b – Jn 3 £65.5m £52.9m -19%
Combined £159.6m £159.1m -0.3%
4.47. It can be seen from the table above that the combined investment costs of the two schemes has been almost exactly in line with forecast. This however masks the outturn costs of the A2/A282 scheme being higher than forecast and the outturn costs on the M25 scheme being lower than forecast, the variances cancelling one another out to produce an extremely accurate forecast for both schemes combined. Without further breakdown of the forecast investment costs, it is not possible to determine where the respective additional costs and savings are derived.
4.48. Additionally, the controlled motorway scheme constructed on the M25 J2-3 concurrently with the widening scheme for forecast as £5.5m and its outturn cost was £6.3m.
Indirect tax 4.49. Indirect tax revenue is the expected change in indirect tax revenue to the Government due to
changes in the transport sector as a result of the scheme over the appraisal period. For the highways schemes in this study, the tax impact is derived primarily from the forecast of the changes in fuel consumption over the 60 years period. A scheme may result in changed fuel consumption due to:

Post Opening Project Evaluation A2/A282 Dartford Improvement & M25 Jn 1b-Jn 3 Widening - Five Year After Study
96
Changes in speeds resulting in greater or lesser fuel efficiency for the same trips
Changes in distance travelled
Changes in road use through induced traffic or the reduction of trip suppression
4.50. Note that at the time these schemes were appraised, the impact on indirect tax was considered within the costs (PVC). The current guidance (AMCB, Analysis of Monetised Costs and Benefits) considers the costs in terms of the ‘broad transport budget’ i.e. costs and revenues which directly affect the public budget available for transport and therefore the indirect tax impact is covered within the benefits (PVB).
4.51. The Central Government Funding forecast for these schemes shows an increase in the indirect taxation the Government would receive from users of the schemes.
4.52. These figures were calculated by TUBA based on traffic behaviour over the whole appraisal period, but no details of the basis are available. As the route lengths are similar, it is assumed that this increased taxation represents a general improvement in vehicles travelling at more fuel efficient speeds.
4.53. In the outturn situation at FYA, we have the extra complexity of the controlled motorway being in operation, which has a natural function to smooth out the flow and speed of vehicles and therefore influencing fuel consumption, and this scheme was not included in the forecast appraisals for either A2/A282 or M25 schemes. It has not been possible therefore to provide an evaluation of Indirect Tax impacts of the schemes based on observed data due to the limited data on the same basis of the forecast and the profile of how future congestion with or without the scheme would affect speeds, and for the aforesaid reason. Therefore it can be assumed as forecast.
4.54. Hence it has been necessary to assume that the forecasts are accurate in terms of the proportion of the PVC, and this is deemed reasonable on the basis that it is only a small part of the overall impact here. Consequently, the 5% and 6% proportion of the PVC for each scheme, respectively has been re-calculated from the outturn PVC.
Benefit Cost Ratio (BCR) 4.55. The Benefit Cost Ratio (BCR) is used as an indicator of the overall value for money of the
scheme. It is the comparison of the benefits (PVB) and costs (PVC) expressed in terms of present value.
4.56. Projects with a BCR greater than 1 have greater benefits than costs; hence they have positive net benefits. The higher the ratio, the greater the benefits relative to the costs. It is to be noted that the BCR is insensitive to the magnitude of net benefits and therefore may favour projects with small costs and benefits over those with higher net benefits.
4.57. Tables 4-3 and 4-4 compare the predicted and outturn costs and benefits. In Table 4-1 and Table 4-2, a column has been included to indicate whether the outturn re-forecasts are likely to be a conservative estimate (due to the limited evaluation area).

Post Opening Project Evaluation A2/A282 Dartford Improvement & M25 Jn 1b-Jn 3 Widening - Five Year After Study
97
Table 4-7 Forecast and Outturn BCR (A2/A282 scheme)
Forecast
(Central Growth)
Outturn Reforecast
Conservative Estimate?
Costs PVC £97.3m £111.4m
Ben
efi
ts
Journey time benefits £155.4m £149.6m
Safety Benefits £1.3m £10.0m
Vehicle Operating Costs £25.0m £25.0m
Net Impact on Dartford Tolls and Business and Users
£1.2m £1.2m
PVB subtotal £182.7m £185.7m
Indirect Tax
(reduction in revenue)
£5.0m £5.0m
BCR (with indirect tax in PVC) 1.8 1.6
BCR (with indirect tax in PVB) 1.9 1.7
Table 4-8 Forecast and Outturn BCR (M25 scheme)
Forecast
(Central Growth)
Forecast including controlled
motorway for 30 years
Outturn Reforecast
Conservative Estimate?
Costs PVC including controlled motorway
£65.3m £72.1m £59.7m
Ben
efi
ts
Journey time benefits £222.3m £221.0m £56.7m
Safety Benefits £2.6m £16.5m -£27.8m
Vehicle Operating Costs £2.8m £2.8m
Net Impact on Dartford Tolls and Business and Users
£0.9m £0.9m
PVB subtotal £28.5m £241.1m £32.6m
Indirect Tax
(reduction in revenue)
£3.9m £3.9m
BCR (with indirect tax in PVC) 3.3 3.2 0.5
BCR (with indirect tax in PVB) 3.6 3.4 0.6

Post Opening Project Evaluation A2/A282 Dartford Improvement & M25 Jn 1b-Jn 3 Widening - Five Year After Study
98
4.58. It can be seen from these two tables that the A2/A282 scheme has produced a BCR slightly lower than forecast, and this is largely due to the lower vehicle hour savings (TEE benefits) however, the M25 scheme has resulted in a BCR of less than 1 because the PVC has exceeded the estimated PVB. This has been largely due to the safety monetary disbenefit produced, which was calculated by comparing the Personal Injury Collisions (PICs) per annum in the five years post-opening to the counterfactual (without scheme estimate based on the national background reduction in collisions) which is in contrast to the positive benefits expected to arise from the controlled motorway. However, even without the safety dis-benefit, it can be seen that the BCR would not have been near to that which was forecast. The vehicle hour savings have been only a fraction of what was forecast, therefore producing such a low overall level of benefits and hence low BCR.
Combined Benefit Cost Ratio (BCR) 4.59. As stated in the introduction to this report, the two schemes in question overlap geographically,
involving the intersection of the M25, A2 and A282, and their construction was largely undertaken in tandem. Many of the impacts of these schemes cannot be accurately attributed to one or the other scheme. Therefore, although the two schemes were appraised and funded separately, the Post Opening Project Evaluation (POPE) of them is presented in a combined report and therefore it is also considered appropriate here to present a combined BCR for both schemes, and the controlled motorway on the M25 J2-3.
Table 4-9 Combined Schemes’ BCR
Scheme Forecast Outturn
PVC £168.9m £171.1m
PVB £423.8m £218.3m
BCR (with Indirect Tax in PVC) 2.4 1.2
BCR (with Indirect Tax in PVB) 2.4 1.2
4.60. It can be seen that the combined schemes have produced a BCR of just over 1 which is lower than forecast. This is due to lower than expected benefits, especially those of journey times and a safety disbenefit. However, it should be stressed that this outturn BCR is likely to be a conservative estimate, and one which reflects our conservative estimate of the journey time benefits for the aforesaid reasons.
Wider Economic Impacts
Scheme Forecasts
A2/A282 Dartford Improvement Scheme
4.61. The EAR (2003) for this scheme does not cover the wider economic impacts sub-objective.
4.62. The AST states that the scheme would:
‘Improve access from M25 and A2 to regeneration areas in Kent. Vital for the future development of Kent Thameside’.
M25 Jn 1b – Jn 3 widening scheme
4.63. The Economic Impact Report (EIR) stated that the study area for the scheme included wards featuring deprivation greater than the national average.
4.64. Improved road access was not considered to improve access to jobs for residents of the wards in northern Dartford most in need of regeneration, since the people resident in these wards

Post Opening Project Evaluation A2/A282 Dartford Improvement & M25 Jn 1b-Jn 3 Widening - Five Year After Study
99
were resistant to travelling long distances or did not have the means to acquire a car. Improved public transport and additional job opportunities close to their homes were more important.
4.65. The scheme would increase the catchment area for employers in the study area located within these wards. More reliable journey times on the M25 would increase the attractiveness of committed development sites within or close to these wards. The details of the local developments upon which the specific forecasts were based were not available for this study.
4.66. The EIR estimated that up to 64 jobs could be realistically attributed to the scheme in 2008 rising to a maximum of 303 jobs by 2018 (with 99 of these jobs being taken by local people from wards in northern Dartford most in need of regeneration), once the benefits of the scheme and all of the committed development was complete.
4.67. The SAR states that the M25 in this location is also critical to national competitiveness as it fulfils the Regional Development Agency’s multi-criteria of being a piece of surface infrastructure of national economic performance (SINEI) by providing access between the regions of London, Southeast England and Eastern England, and access to various key ports and airports.
Evaluation of the Combined Schemes
4.68. Kent Thameside is the regeneration area which covers the urban area north of the A2 in Dartford. The story of Kent Thameside can be traced back to the publication of Government regional planning guidance in 1995 (Thames Gateway Planning Framework Regional Planning Guidance RPG9a). The Thames Gateway became a national focal point for regeneration and growth, and Kent Thameside in particular was identified as ‘a growth area of regional significance’ with its strategy setting out a long-term vision for the regeneration of the area.
4.69. The Kent Thameside Regeneration Partnership brought together public and private sector interests to drive forward regeneration projects. Although the Kent Thameside Regeneration partnership ceased operation on the 31 March 2011, the regeneration of Kent Thameside and the wider Thames Gateway remain high on the local and national agenda.
4.70. Through the improvements to infrastructure and observed beneficial impacts on journey times and reliability, both schemes will have benefited the regeneration area and improved this part of the strategic road network to assist with national competitiveness. Therefore, although the outward benefits are difficult at this time to isolate from the wider economic climate, it is considered likely that both schemes have had a beneficial impact. However, considering the impact of the economic downturn which started in the third quarter of 2008 it is considered inappropriate to try to identify job creation in the area.

Post Opening Project Evaluation A2/A282 Dartford Improvement & M25 Jn 1b-Jn 3 Widening - Five Year After Study
100
Key Points – Economy
Impact on Transport Economic Efficiency The journey time benefit for the A2/A282 scheme is calculated to be £149.6m (16% lower
than forecast) as a result of a smaller increase in traffic volumes between pre and post opening than in the scheme forecasts;
The journey time benefit for the M25 scheme is calculated to be £56.7m (73% less than forecast). This is largely because overall traffic volumes on the M25 have been much lower than forecast and declined since the economic downturn. In addition to this, journey time savings between Jn 2 – Jn 3 have been smaller than forecast. It should also be noted that the evaluation excluded M25 Jn 1b – Jn 2 and roads in the wider Kent area, and therefore it is likely to be a conservative estimate.
Monetary Safety Benefits The monetary safety benefits have been calculated using the PAR methodology. For the
A2/A282 scheme, these were £10m, and higher than forecast;
Due to the increase in collisions per annum compared to the counter factual estimate which takes account of the national background reduction in collisions, the M25 Jn 1b – Jn 3 widening scheme has produced a monetary safety dis-benefit of £27.8m, whereas a monetary safety benefit was forecast.
Scheme Costs and BCR The scheme costs for the combined schemes have been £159.1m and within 1% of the
forecast costs. This accuracy however is not reflected per scheme, with the A2/A282 costs being approximately £12m higher than forecast, and the M25 scheme costs being approximately £12m lower than forecast;
Due to the lower than forecast vehicle hour savings, lower traffic volumes on the M25 and monetary safety dis-benefits of the M25 scheme, the combined BCR for both schemes and the controlled motorway has been 1.2, and lower than forecast. It should be noted however that the TEE benefits which have contributed the vast majority of the PVB are likely to be a conservative estimate in this evaluation.
Wider Economic impacts Through the improvements to infrastructure and observed beneficial impacts on journey
times and reliability, both schemes will have benefited the Kent Thameside regeneration area and improved this part of the strategic road network to assist with national competitiveness. Therefore, although the outward benefits are difficult at this time to isolate from the wider economic climate, it is considered likely that both schemes have had a beneficial impact, as expected.
Post Opening Project Evaluation A2/A282 Dartford Improvement & M25 Jn 1b-Jn 3 Widening - Five Year After Study
101
5. Environment
Introduction 5.1. This section documents the evaluation of the environmental sub-objectives, focussing on
those aspects not fully evaluated at the One Year After (OYA) stage or where suggestions were made for further study.
A2/ A282 Scheme Objectives To limit the environmental impact of the scheme and to reduce noise impact on adjacent residential properties. In particular, to limit the impact on the Darenth Wood Site of Special Scientific Interest (SSSI) and the Darenth Wood Scheduled Ancient Monument (SAM).
M25 J1b-3 Scheme Objectives
To seek to minimise any increase in noise to adjacent property and achieve a reduction in noise where reasonably practicable;
To minimise any deterioration in local air quality, particularly at local Air Quality Management Areas (AQMAs) and achieve improvements in local air quality levels where reasonably practicable;
To minimise adverse impact on landscape character and visual amenity, particularly on locally designated landscapes and the Kent Downs Area of Outstanding Natural Beauty (AONB), particularly in sensitive views; reinforce existing retained vegetation with on and (subject to agreement) off-site planting;
To minimise adverse impact on the setting of listed buildings and conservation areas; to avoid direct impact on archaeological remains, particularly in areas for site compounds and storage;
To minimise direct loss of locally valuable habitats within the highway boundary, some of which may also provide habitat for protected species;
To minimise adverse impacts on water environment through use of enhanced pollution control measures and adequate balancing storage.

Post Opening Project Evaluation A2/A282 Dartford Improvement & M25 Jn 1b-Jn 3 Widening - Five Year After Study
102
A2 / A282 Improvements
5.2. The A2 / A282 Environmental Statement (ES) assessed the potential impacts of disruption during construction and the operation of a scheme designed to increase traffic capacity of Junction 2 of the M25/ A282 and the A2, by widening the A2 between Bean and Junction 2 to four lanes and by providing free-flow links for the principal traffic movements at Junction 2.
5.3. The assessment demonstrated that there would be moderate and adverse impacts on both the nature and conservation interest of the study area and in terms of landscape and visual impact, although the impacts regarding the latter were predicted to reduce over time. Noise and vibration impacts were stated as ranging from neutral to significantly beneficial, and a reduction in traveller stress levels was also predicted.
5.4. Other than as noted above, no significant impacts relating to the natural and cultural environment (air quality, archaeology and cultural heritage, land use and community, water quality and drainage) were identified by the ES.
M25 J 1b-3 Widening
5.5. The M25 J1b-3 ES assessed the potential impacts of disruption during construction and the operation of proposals to widen the M25 between Junctions 1b and 3 from three to four lanes in each direction between the south facing slip roads of Junction 2 and the north facing M20 link road merge and diverge at Junction 3. Proposals to widen the southbound carriageway of the M25 from two to three lanes between Junction 1b and Junction 2 southbound slip road were also assessed.
Summary of OYA Evaluation Recommendations
The OYA evaluation identified a number of areas where further analysis was required at the Five Year After (FYA) stage to confirm the longer term impacts of the scheme on the surrounding environment. These are summarised as follows:
Landscape – It is too soon to evaluate the establishment of the new planting and seeding, which should be reviewed as part of the FYA report.
A2/ A282: Land lost to the scheme at Darenth Country Park is to be exchanged for land behind Gore Farm Cottages as compensation; this transfer should be confirmed as part of the FYA evaluation; and
M25 J1b-3: Kent Downs Area of Outstanding Natural Beauty (AONB) should be consulted again at the FYA stage.
Heritage – No archaeological information was provided to POPE; this should be considered as part of the FYA study.
Biodiversity – Sufficient information regarding ongoing monitoring was not made available, and this should be provided for the FYA evaluation e.g. for Dormice.
A2/ A282: Calcareous grassland was translocated to Darenth Country Park, and Dittander (a nationally scarce plant) was translocated to a new watercourse; further information of the success of these translocations should be made available for the FYA report; and
Verges and embankments lost to reptiles at construction phase were replaced with new areas of embankment, replacing lost habitat. Details of post-construction reptile surveys were expected to be available at FYA.
Water Quality and Drainage – The Handover Water Quality Monitoring Report (March 2010) was not available to inform the Environment Agency (EA) at OYA Consultation, and so the EA should be consulted as part of the FYA evaluation. The results of any ongoing water quality monitoring should be considered at the FYA stage, as should the efficacy of the mitigation measures in relation to spill events.

Post Opening Project Evaluation A2/A282 Dartford Improvement & M25 Jn 1b-Jn 3 Widening - Five Year After Study
103
5.6. The assessment demonstrated that there would be Substantial Adverse effects for selected residential properties, and Adverse visual effects would be experienced by users of the Public Rights of Way (PRoW) network and areas of open space; these impacts were all expected to reduce to Slight Adverse over time. However, permanent and Moderate Adverse effects were predicted for properties along Hawley Road.
5.7. The ES also noted that the existing highway drainage system had minimal pollution control measures and that the scheme would redress this situation. The impact of the scheme on geology and soils was stated as ranging from Neutral to largely Beneficial, and Traveller Stress levels were predicted to reduce in the long term.
5.8. However, no significant impacts relating to other aspects of the natural and cultural environment (noise and vibration, air quality, landscape, ecology and nature conservation, cultural heritage, Non-Motorised Users (NMUs) and community) were identified by the ES.
Evaluation of Environmental Sub-Objectives
5.9. For each scheme, the following environmental sub-objectives were appraised in the ES and in the Appraisal Summary Tables (AST) according to NATA guidance at that time; 2003 (A2/ A282) and 2006 (M25 J1b-3):
Noise;
Local Air Quality;
Greenhouse Gases;
Heritage;
Landscape;
Townscape;
Biodiversity;
Water Environment;
Physical fitness; and
Journey Ambience.
5.10. For each of these environmental sub-objectives, the evaluation in this section assesses the
environmental impacts predicted in each scheme’s AST and ES against those observed five years after opening.
5.11. In the context of the findings from the OYA evaluations and using new evidence collected five years after opening, this section presents:
An evaluation of the ongoing effectiveness of the mitigation measures implemented as
part of the scheme;
An updated summary of key impacts against all of the nine environment WebTAG sub-
objectives, with particular focus on the assessment of sub-objectives where it was too
early for conclusions to be drawn at the OYA evaluation stage; and
Additional analysis relevant to close out issues/ areas for further study identified at the
OYA stage for consideration at the FYA stage.
Methodology 5.12. This section focuses on those aspects not fully evaluated at OYA (or where at OYA,
suggestions were made for further study), and also on any issues that have arisen since the OYA evaluation. Although the detail of the OYA evaluation is not repeated here, reference is made to the OYA evaluation where required and key points are incorporated into this FYA report to provide contextual understanding where appropriate.
5.13. No new modelling or survey work has been undertaken for this FYA environmental evaluation.

Post Opening Project Evaluation A2/A282 Dartford Improvement & M25 Jn 1b-Jn 3 Widening - Five Year After Study
104
Data Collection 5.14. The following documents/ data have been used for the FYA evaluation.
A2/ A282 Improvements
ES, Volumes 1 and 2, March 2003;
Appraisal Summary Table (AST) with Link E Deferral, Revision 2, January 2004;
Report on Deferment of Link E and Revised Landscape and Drainage Attenuation Proposals in North West Quadrant of Junction 2, Revision B, April 2006;
AST Comparison, January 2008;
A2/A282 Dartford Improvement Acoustics Report (Post-Construction Noise Level Measurements and Comparison with Baseline Measurements), February 2009;
Handover Environmental Management Plan (HEMP), January 2011; and
Scheme Newsletters.
M25 J 1b-3 Widening
ES, Volume 1 (A & B) and Volume 2, November 2006;
ES Non-technical Summary (NTS), November 2006;
AST, December 2006;
HEMP, January 2011;
Environmental Barriers Maintenance Manual, July 2011; and
Scheme Newsletters.
A2/ A282 Improvements and M25 J 1b-3 Widening
A2/ A282/ M25 Improvement Scheme, Dartford District Kent Post-Excavation Summary (Oxford Archaeology, February 2008); and
A2/ A282 Dartford Improvement Scheme and M25 J1b-3 Widening Scheme Road Safety Audit (Stage 4) 12 Month Monitoring Report (November 2011).
5.15. A full list of the background information requested and received to help with the compilation of
this report is included in Appendix A.
Site Visit 5.16. As part of the FYA evaluation, a site visit was undertaken in July 2014; this included a review
of the physical aspects of the scheme and inspection from publicly accessible locations (e.g. footpaths, over bridges, subways), along with the taking of photographs to provide comparison with material produced for the ES and at OYA (B.1 in Appendix B).
Consultation 5.17. Statutory environmental organisations (Natural England, English Heritage, the Environment
Agency, and Kent Downs AONB), Kent County Council, Sevenoaks District Council, Dartford Borough Council, Parish Councils, and the Kent Wildlife Trust were contacted as part of the FYA evaluation regarding their views on the impacts they perceive the scheme has had on the environment as shown in Table 5-1, below.

Post Opening Project Evaluation A2/A282 Dartford Improvement & M25 Jn 1b-Jn 3 Widening - Five Year After Study
105
Table 5-1 Summary of Environmental Consultation Responses
Organisation Field of Interest
Comments at OYA Comments at FYA
Natural England
Biodiversity & Landscape
Declined to comment on impacts of scheme but said that it expected a detailed post-construction study to be undertaken to monitor the effectiveness of landscape and ecological mitigation.
Stated that Natural England does not hold data on the impacts of the schemes; detailed comments not provided as Highways England is responsible for ensuring any monitoring of impacts undertaken is robust.
English Heritage
Heritage Declined to comment on either scheme. Did not respond to the invitation to provide feedback.
Environment Agency
Water No data available on water impacts of the scheme. However, it stated that if all drainage and mitigation was implemented as expected, the water environment should have improved.
Responded that balancing ponds and landscaping work were built to a good standard, as expected, noting that no ecological data was available regarding the effectiveness of these particular works.
Kent Downs AONB Unit
Biodiversity & Landscape
No specific comments on the impact of either scheme provided. However, generic comment and advice on the impacts of highways schemes and on Kent Downs AONB was received.
Did not respond to the invitation to provide feedback.
Kent County Council
General Did not respond to the invitation to provide feedback.
Did not respond to the invitation to provide feedback.
Sevenoaks District Council
General No emissions data available. Recommended contact with Kent County Council on rights of way and ecology.
Comments provided on visual impacts on Swanley Conservation Area and surrounding environs.
Advised that consultation be undertaken with Dartford Borough Council.
Dartford Borough Council
General Noise: No evidence of changes in noise level. Local residents, close to the M25 and A2 have informally mentioned that the background traffic noise seems to be lower.
No information on noise complaints available
Did not respond to the invitation to provide feedback.
Sutton-at-Hone and Hawley Parish Council
General POPE was raised at Parish Council meeting but no further feedback received.
Did not respond to the invitation to provide feedback.
Kent Wildlife Trust
Biodiversity The Trust had been unable to undertake any monitoring in relation to the scheme and so cannot provide comment.
Did not respond to the invitation to provide feedback.
5.18. The Area 5 (M25 DFBO) and Area 4 (A2) Asset Services Contractors (ASC’s) have also been consulted with regard to animal mortality figures, but no information was provided.

Post Opening Project Evaluation A2/A282 Dartford Improvement & M25 Jn 1b-Jn 3 Widening - Five Year After Study
106
Traffic Forecast Evaluation 5.19. Three of the environmental sub-objectives (noise, local air quality and greenhouse gases) are
directly related to traffic flows. No new noise or air quality surveys are undertaken for Post-Opening Project Evaluation (POPE) and an assumption is made that the level of traffic and the level of traffic noise and local air quality are related.
5.20. The baseline, forecast opening, and design years for each scheme are shown in Table 5-2, below.
Table 5-2 Existing, Opening and Design Years for the A2/ A282 and M25 J1b-3 Schemes.
A2/A282 M25 J1b-3
Existing (Baseline) 2004 2002
Opening Year 2008 2007
Design Year 2023 2022
A2/A282 Dartford Improvements
5.21. The traffic forecasts used in the Noise and Local Air Quality appraisals, along with the observed FYA AADT, flows are summarised in Table 5-3, below.
5.22. In line with the Traffic Analysis chapter of this report, the Do-Something forecasts for the A2/ A282 scheme have been taken from the Traffic Forecasting Report June 2002, and have been interpolated to 2013 using a straight line projection between 2008 (Opening Year) and 2023 (Design Year).
Table 5-3 A2/ A282: Comparison of Do-Something forecasts with FYA AADTs
Location
Forecast Do-Something
Observed
% Diff. Observed –
Forecast Interpolated to 201332 (FYA)
FYA AADT
Low Growth
High Growth
Low Growth
High Growth
High Growth
A2 east of M25 J2
E/B 63,500 72,000 68,700 8.19 -4.58 -3,300
W/B 63,000 70,500 66,200 5.08 -6.10 -4,300
A2 west of M25 J2
E/B 49,500 55,500 53,100 7.27 -4.32 -2,400
W/B 49,500 54,000 51,800 4.65 -4.07 -2,200
M25 J1b – J2 & A282 link roads
N/B 72,500 85,500 69,600 -4.00 -18.60 -15,900
S/B 71,500 81,500 73,100 2.24 -10.31 -8,400
Free-flow link from A282 S/ B to A2 E/ B
17,500 20,000 18,100 3.43 -9.50 -1,900
Free-flow link from A2 W/ B to A282 N/ B
18,500 21,500 17,500 -5.41 -18.60 -4,000
Free-flow link from A2 W/ B to M25 S/ B
13,500 14,000 12,400 -8.15% -11.43% -1,600
5.23. It can be seen from Table 5-3, , that observed flows in 2013 were below the High Growth forecasts at all locations but were below the Low Growth forecasts at just three locations:
M25 J1b-J2 & A282 northbound link road
Free flow link from A2 westbound to the A282 (northbound)
32 Source: Traffic Forecasting Report, June 2002, diagram TR959A-1

Post Opening Project Evaluation A2/A282 Dartford Improvement & M25 Jn 1b-Jn 3 Widening - Five Year After Study
107
Free flow link from A2 westbound to the M25 (southbound)
5.24. Classified HGV count data is available for the A2 east and west of the M25 J2 and this is provided in Table 5-4, below[1].
Table 5-4 A2/ A282: HGV% of AWT
Location Direction Before FYA
A2 East of M25 J2 E/B 16.6% 16.2%
W/B 15.8% 14.7%
A2 West of M25 J2 E/B No data 14.1%
W/B 13.7% 11.3%
5.25. It can be seen that east of the M25 J2, the percentage of HGVs using the A2 has changed very little. On the A2 west of J2, the data in the westbound direction indicates a slight reduction in the proportion of HGVs using the link.
5.26. Average speed data has also been made available for the A2/ A282 scheme, and this is presented in Table 5-5, below.
Table 5-5 A2/ A282: Average A2 speeds (kph)
Section and time period Before
(average kph) FYA
(average kph) % Increase
A296 to M25 J2 morning peak 82 99 21%
A296 to M25 J2 inter-peak 101 111 10%
A296 to M25 J2 afternoon peak 104 113 9%
M25 J2 to A296 morning peak 98 104 6%
M25 J2 to A296 inter-peak 95 101 6%
M25 J2 to A296 afternoon peak 76 92 20%
5.27. It can be seen that although the morning peak speeds on the A296 to M25 J2 have shown an increase of 21% and afternoon peak speeds on the M25 J2 to A296 have increased by 20%, all other monitored sections show an increase of less than 10%.
M25 J1b-3 Widening
5.28. The ES used two sets of traffic data for the Noise and Local Air Quality assessments. Noise was based on 18-hour weekday figures (AAWT), whilst Local Air Quality used 24-hour figures based on the whole week (AADT), as is standard practice.
5.29. However, in the interests of consistency and in line with the Traffic Analysis chapter of this report, the Do-Something forecasts used in the Noise and Local Air Quality appraisals have been taken from the Stage 3 Scheme Assessment Report Part 2: Engineering, Traffic & Economics Report Volume 2, November 2006, and have been interpolated to 2013 using a straight line projection between 2007 (Opening Year) and 2022 (Design Year); the traffic forecasts and the observed FYA AADT flows are summarised in Table 5-6, below.
Table 5-6 M25 J1b-3: Comparison of Do-Something forecasts with FYA AADTs
[1] It should be noted that 6.6m is now considered to be the length distinction between light and heavy vehicles, and post 2009, HA TRADs count sites have used this measurement in addition to the 5.2m split. However, as data prior to this date used only the 5.2m distinction, it has been necessary to use this measurement to represent HGVs in the analysis above in order to compare like-for-like.

Post Opening Project Evaluation A2/A282 Dartford Improvement & M25 Jn 1b-Jn 3 Widening - Five Year After Study
108
Location
Forecast Do-Something
Observed
% Diff. Observed –
Forecast Interpolated to 201333 (FYA)
FYA AADT
Low Growth
High Growth
Low Growth
High Growth
High Growth
M25 J1b - J2 N/B 75,000 85,700 69,600 -7% -19% -16,100
S/B 73,700 83,000 73,100 -0.8% -12% -9,900
M25 J2 - J3 N/B 84,000 95,000 62,700 -25% -34% -32,300
S/B 78,000 89,700 65,300 -16% -27% -24,400
5.30. It can be seen from Table 5-6, above, that observed flows in 2013 were below both the high
and Low Growth forecasts. Only between J1b - J2 southbound have observed flows been close to the Low Growth forecasts.
5.31. Changes in HGV usage on the M25 in the vicinity of the schemes have been hard to determine due to the poor quality of information for the count sites in the TRADs database. As such, the TRADS data for the scheme is deemed too inconsistent to draw meaningful conclusions regarding what changes (if any) may have occurred in HGV usage since the scheme opened.
5.32. Average speed data has been made available for the M25 J1b-3 scheme, and this is presented in Table 5-7, below.
Table 5-7 M25 J1b-3: Average M25 Speeds (kph)
Section and time period Before
(average kph) FYA
(average kph) % Increase
M25 J3 to M25 J2 morning peak 79 93 17%
M25 J3 to M25 J2 inter-peak 87 95 9%
M25 J3 to M25 J2 afternoon peak 53 98 83%
M25 J2 to M25 J3 morning peak 88 91 3%
M25 J2 to M25 J3 inter-peak 98 80 -18%
M25 J2 to M25 J3 afternoon peak 94 75 -21%
5.33. It can be seen that the morning peak speeds on the M25 J3 to M25 J2 have increased by 17%, and afternoon peak speeds have increased by 83%.
5.34. It can also been seen that inter-peak/ afternoon peak speeds on the M25 J2 to M25 J3 have reduced by 18% / 21% respectively.
5.35. All other monitored sections show an increase of less than 10%.
Five Years After Environmental Assessment
5.36. Included in this section is a brief summary of statements from the AST (with Link E Deferral) and the ES’s for both schemes, along with the OYA evaluations (including close out/ key issues identified for further reporting at the FYA stage). These have been included to provide the context for the FYA evaluation.
33 Source: Stage 3 Scheme Assessment Report Part 2: Engineering, Traffic & Economics Report Volume 2, Figure TF2 (Note diagram
TF2 does not include flows for M25 J1a-1b).

Post Opening Project Evaluation A2/A282 Dartford Improvement & M25 Jn 1b-Jn 3 Widening - Five Year After Study
109
Noise
A2/ A282 Dartford Improvements
AST Forecast
5.37. The AST stated that with the scheme, no properties would experience an increase in noise levels by Design Year (2022), due to the proposed use of low noise surfacing, environmental mounds and fencing. It also stated that 51 properties would experience a reduction in noise levels of between 0.7 and 7.5 dB(A)34, 20 of which would experience a reduction greater than 3 dB(A). Without the Scheme, it was stated that the use of low noise surfacing in the Design Year would mean that 45 properties would experience a reduction of between 1 and 3dB (A). Overall, the AST concluded that with the scheme, 30 less people would be highly annoyed in 2022.
Environmental Statement
5.38. The ES stated that the installation of earth mounds and a noise barrier between Junctions 1b of the A282 and Junction 2 of the M25 would significantly improve the noise climate along the worst affected stretch of the current road, between the A2 eastbound carriageway and the A282 northbound carriageway. The combination of these measures and the low noise surfacing were stated as reducing traffic noise in the Design Year (2022) by between 0.7 and 7.5 dB(A) for properties in this area.
5.39. Overall, the ES concluded that the scheme would have a Neutral to Significantly Beneficial effect on the noise environment of the road corridor, and that there would also be a beneficial effect on the levels of traffic-induced vibration as congestion was reduced.
OYA Evaluation
5.40. The OYA noise evaluation summary confirmed that mitigation had been implemented as expected, noting that although traffic growth on the A2 was slightly above what was predicted, traffic growth on the A282 and on the links around the junction had generally not materialised. Overall however, traffic flows were considered to be generally as predicted and the OYA evaluation concluded that the noise climate was therefore also likely to be as expected.
M25 J1b-3 Widening
AST Forecast
5.41. The AST stated that traffic flows on the scheme would increase slightly, resulting in annoyance for nearby properties, although the introduction of environmental barriers at Hawley Road would result in an overall reduction in population annoyed by noise. In the Do Minimum scenario, 146 people would be subject to noise levels in excess of 69dBLA10,18hr35, whereas with the Do Something scenario, 108 would be exposed to this level of noise and would lead to 38 less people being annoyed.
5.42. The AST also stated that by Design Year, 113 people were likely to be annoyed by the Do Minimum scenario when compared to the 105 people that were likely to be annoyed by the Do Something scenario – a net reduction of 8 people.
Environmental Statement
5.43. The ES noted that traffic noise from the M25 would make up the majority of the soundscape in the immediate vicinity of the scheme, and stated that the proposed road widening would reduce noise levels in the vicinity of the scheme due to the introduction of lower noise surfacing and new environmental barriers at Hawley. In the long term, although slight increases in noise
34 dB(A) is a single number used to describe a sound pressure level that includes a frequency weighting to reflect a subjective loudness
level, as human hearing is less sensitive at low and very high frequencies; the A-weighting is used to account for this effect, and is written as dB(A). 35 An A-weighted sound level of 69 decibels or higher, for 10% of the 18 hour measurement period.

Post Opening Project Evaluation A2/A282 Dartford Improvement & M25 Jn 1b-Jn 3 Widening - Five Year After Study
110
were predicted to occur at other locations along the route, the impacts overall were not considered to be significant.
OYA Evaluation
5.44. The OYA evaluation summary stated that the proposed mitigation measures had been implemented as expected, and that further mitigation comprising additional and higher fencing along the M25 corridor had also been installed. The report also noted that although the traffic growth rate predicted on the M25 for the opening year had not materialised, the implementation of additional mitigation measures may have resulted in a larger reduction in noise than predicted, and concluded that the noise climate was probably better than expected at the OYA stage.
FYA Consultation
5.45. No responses to consultation requests were received.
FYA Evaluation
5.46. When the original noise assessment was carried out, the Design Manual for Roads and Bridges (DMRB) advised using ‘High Growth’ traffic flows to predict noise levels. Although the current DMRB uses ‘Most Likely’ traffic growth, this assessment has continued to use the High Growth figures in order to compare the forecasted flows with the observed flows.
A2/ A282 Dartford Improvements
5.47. The ES stated that low-noise surfacing (LNS) would be provided for all new, widened and altered carriageways, and it was confirmed at OYA that this had been installed; however, no high speed Road Surface Index (RSI) values were made available for the FYA study and as such, the noise reduction properties of the installed LNS remain unconfirmed. In February 2014, repairs were made to the Littledale viaduct to reduce the noise impact.
5.48. The ES stated that in addition to environmental barriers in the form of earth mounds, a noise barrier would be provided on top of the retaining wall on the north side of the A2 at Hawley Manor. Although it was confirmed at OYA that this had been installed, the noise insulation properties of the barrier were not made available for the FYA study and as such, the noise reduction properties of the barrier remains unconfirmed.
5.49. The Acoustics Report compared pre and post-construction measured noise data from 2006 and 2008 respectively. The data comparison indicated that all properties assessed showed a noise level reduction as a result of the implementation of the junction improvements, with the exception of Igtham Cottages. Given this irregularity, further noise monitoring was undertaken in order to verify the measured data, and the report concluded that the pre-construction noise monitoring data contained an anomaly at this location, and considered this to be a valid conclusion given the decrease in noise levels measured at both 10 and 3 Hope Cottages, both of which are located nearby to Igtham Cottages
5.50. An assumption is made by POPE methodology that noise levels will be as expected if observed traffic flows are within 25% more or 20% less than predicted; as can be seen by the comparison of both the predicted and observed AADT flows in Table 5-3, above, the data indicates that the observed flows through the A2/ A282 scheme are up to 18.60% lower than forecast at all locations.
5.51. The percentage difference between the mean forecasts and the observed flows at all locations are within the tolerances assumed by POPE and as such, it is considered that the local noise climate is likely to be as expected throughout the scheme.
5.52. As can be seen by the comparison of both the before-scheme and observed HGV percentages in Table 5-4, above, the data indicates that the percentages of HGVs using the A2 has changed very little and as such, these changes are considered unlikely to have had any significant effect on noise levels outside expectations.

Post Opening Project Evaluation A2/A282 Dartford Improvement & M25 Jn 1b-Jn 3 Widening - Five Year After Study
111
5.53. No meaningful conclusions in terms of Noise can be drawn from the changes in speeds since the scheme opened, as only rush hour speed data has been provided for this evaluation.
M25 J1b-3 Widening
5.54. The ES proposed that LNS would be used throughout the scheme and it was confirmed at OYA that this had been installed as expected; however, no high speed RSI values were made available for the FYA study and as such, the noise reduction properties of the installed LNS remain unconfirmed.
5.55. The ES stated that noise barriers would be provided at Hawley on both the north and southbound carriageways, and that these barriers would serve to attenuate the impact of noise arising from road traffic on the M25. It was confirmed at OYA that this had been installed, but although the Environmental Barriers Maintenance Manual contains schedules of Design & Check Certificates and Construction Compliance Certificates, these certificates were not available for inspection; as such, the noise insulation performance properties of these barriers cannot be confirmed.
5.56. As can be seen by the comparison of both the predicted and observed AADT flows in earlier in this section, the data indicates that the observed flows along the M25 are;
Up to 19% less than forecast between J1b and J2 (north and southbound); and
Greater than 27% less than forecast between J2 and J3 (north and southbound).
5.57. The percentage difference between the mean forecasts and the observed flows along both
the north and southbound carriageways between J1b and J2 are within the tolerances assumed by POPE and as such, it is considered that the local noise climate is likely to be as expected at these locations.
5.58. The observed traffic flows between J2 and J3 (both north and southbound) are also less than predicted. However, the percentage difference between the mean forecasts and the observed flows at these locations exceed the -20% tolerance assumed by POPE, and with the overall number of vehicles falling short of the predicted figures by over 1,000 AADT, it is considered that the local noise climate is likely to be better than expected at these locations.
5.59. The TRADS data for the scheme is deemed too inconsistent to draw meaningful conclusions regarding what changes (if any) may have occurred in HGV usage since the scheme opened.
5.60. No meaningful conclusions in terms of Noise can be drawn from the changes in speeds since the scheme opened, as only rush hour speed data has been provided for this evaluation.
5.61. Based on the traffic flow data and the installation of additional mitigation not outlined in the ES (comprising the installation of additional and higher fencing along the M25 corridor as reported at OYA), the effects of the scheme are considered likely to be better than expected.
Summary
A2/ A282 Dartford Improvements
5.62. Throughout the scheme, the percentage difference between the mean forecasts and the observed traffic flows at FYA are within the tolerances assumed by POPE.
M25 J1b-3 Widening
5.63. Between J1b - J2, observed traffic flows are close to those forecast. Between J2 and J3, observed traffic flows are up to 34% less than forecasted, the shortfall in the absolute number of vehicles predicted at each location exceeding 1,000 AADT.

Post Opening Project Evaluation A2/A282 Dartford Improvement & M25 Jn 1b-Jn 3 Widening - Five Year After Study
112
Table 5-8 A2/ A282 Evaluation Summary: Noise
Sub Objective AST
(Forecast)
EST
(FYA Evaluation)
Noise
(A2/ A282)
No. of properties experiencing:
Noise increase: 0
Noise: 51
30 less people highly annoyed in 2022.
As expected.
Table 5-9 M25 J1b-3 Evaluation Summary: Noise
Sub Objective AST
(Forecast)
EST
(FYA Evaluation)
Noise
(M25 J1b-3)
Net reduction in estimated population annoyed: 8
Better than expected.
Local Air Quality
A2/ A282 Dartford Improvements
AST Forecast
5.64. The AST stated that local air quality (particularly in close proximity to the A2 and A282) was poor. Although ‘cleaner’ vehicles were considered likely to contribute to a general improvement in air quality over time, the anticipated improvement overall was nevertheless concluded to be less with the Scheme than with the Do-Minimum Scenario. Quantitatively, the number of properties expected to experience an improvement in Air Quality was 27, and the number of properties expected to experience a decrease in Air Quality was 64.
Environmental Statement
5.65. The ES stated that the scheme would result in a Slight Adverse effect on local air quality, noting however that the effect would be small when compared to the overall improvements in local air quality expected to result from progressively cleaner vehicles.
OYA Evaluation
5.66. The OYA evaluation summary stated observed traffic flows were within 10% of either the high or low forecast levels, and therefore considered it likely that the impact of the scheme in terms of Air Quality was as expected.
M25 J1b-3 Widening
AST Forecast
5.67. The AST stated that traffic flows through the scheme would increase slightly, and that properties adjacent to the M25 between Junctions 1b and 2, within Dartford Borough Council’s Air Quality Management Area (AQMA), would experience a slight improvement in air quality. Properties adjacent to the M25 before the Junction 2 slip roads and Junction 3, some of which were within Sevenoaks District Council’s AQMA, were not expected to experience any discernible change in air quality.

Post Opening Project Evaluation A2/A282 Dartford Improvement & M25 Jn 1b-Jn 3 Widening - Five Year After Study
113
Environmental Statement
5.68. The ES stated that whilst the scheme did not fall within any declared AQMA, the proposals had the potential to impact on two declared AQMAs immediately outside the scheme. The two AQMAs had been declared due to the high traffic flows using the M25 and (particularly for the Dartford AQMA) the close proximity of residential dwellings to the route.
5.69. The ES concluded that the differences between the Do Something and the Do Minimum air quality assessments were insignificant and as such, the impact of the scheme would be Neutral overall.
OYA Evaluation
5.70. The OYA evaluation summary stated that the level of traffic growth predicted on the M25 had not materialised, and that observed traffic flows across the M25 were also less than expected. The OYA evaluation therefore concluded that air quality was likely to be better than expected overall, and that there had also likely been no deterioration of air quality within any local AQMA.
FYA Consultation
5.71. No responses to consultation requests were received.
FYA Evaluation
A2/ A282 Dartford Improvements
5.72. Monitoring of NO2 concentrations by Dartford Borough Council has taken place at locations near to three of the receptors used in the M25 J1b-3 ES, specifically at Bow Arrow Lane, Queens Gardens and Hawley Road; this data is reproduced in Table 5-10, below, and can be used to compare with the modelled data from the ES. It should be noted that the monitoring sites are not in the exact locations as the receptors, but are close enough to allow a reasonable comparison.
Table 5-10 M25 J1b-3: Comparison of Modelled and Monitored NO2 Results in 2010 µg/m3
Receptor
Grid Reference
(Modelled
Receptor)
Grid Reference
(Monitoring Site) Modelled
2010
(from ES)
Monitored
Difference
(Monitored –
Modelled) /
Monitored
Bow
Arrow
Lane
555486, 174443 555484,174441 54.6 62 12%
Queens
Gardens 555801, 173240 555801, 173194 37.2 39 5%
Hawley
Road 555310, 171302 555297, 171327 39.3 41 4%
5.73. It can be seen that NO2 concentrations at all three sites were higher in 2010 than the ES modelled 2010 concentrations with the Scheme, indicating that the ES modelling results had underestimated actual concentrations.
5.74. However, concentrations were within 5% of the ES modelled values at two of the three sites; this indicates only a slight underestimate of the initial ES modelling, and gives reasonable confidence in the ES modelling results.

Post Opening Project Evaluation A2/A282 Dartford Improvement & M25 Jn 1b-Jn 3 Widening - Five Year After Study
114
5.75. The monitored NO2 concentrations at these sites and other sites operated by Dartford Borough Council near the schemes are given for the years 2004 to 2010 in Table 5-11, below.
Table 5-11 A2/ A282: Annual mean NO2 concentrations measured at sites in Dartford, µg/m3
Site name 2004 2005 2006 2007 2008 2009 2010
DA14 Bow Arrow Lane, Dartford
79 73 68 68 75 67 62
DA21 Brentfield Road, Dartford
49 44 42 46 39 41 45
DA22 Brent Way, Dartford 71 65 60 64 61 65 52
DA24 Wayville Rd, Dartford 48 43 45 43 41 40 40
DA25 Queens Gardens, Dartford
53 51 46 46 44 40 39
DA48 Hawley Road 42 46 42 42 41
5.76. No apparent trend is visible at any of these sites since the schemes opened, and it can be seen that NO2 concentrations still exceed the air quality criterion of 40 µg/m3.
5.77. No meaningful conclusions in terms of Air Quality can be drawn from the percentage changes in HGV usage/ speed since the scheme opened.
5.78. An assumption is made by POPE methodology that Local Air Quality will be as expected if observed traffic flows are within +/-1,000 AADT of those predicted; as can be seen by the comparison of both the predicted and observed AADT flows in Table 5-3, above, the data indicates that the observed flows through the A2/ A282 scheme are considerably lower than 1,000 AADT at all the high growth forecast locations (high growth being commonly used in air quality assessment). It is therefore considered that Local Air Quality is likely to be better than expected at these locations as a result of the lower traffic flows.
M25 J1b – 3 Widening
5.79. The TRADS data for the scheme is deemed too inconsistent to draw meaningful conclusions regarding what changes (if any) may have occurred in HGV usage since the scheme opened.
5.80. No meaningful conclusions in terms of Air Quality can be drawn from the percentage changes in speed since the scheme opened.
5.81. As can be seen by the comparison of both the predicted and observed AADT flows in Table 5-6, above, the data indicates that the observed flows along the M25 are considerably lower than those forecast by 8,000 or more AADT. It is therefore considered that Local Air Quality is likely to be better than expected at these locations.
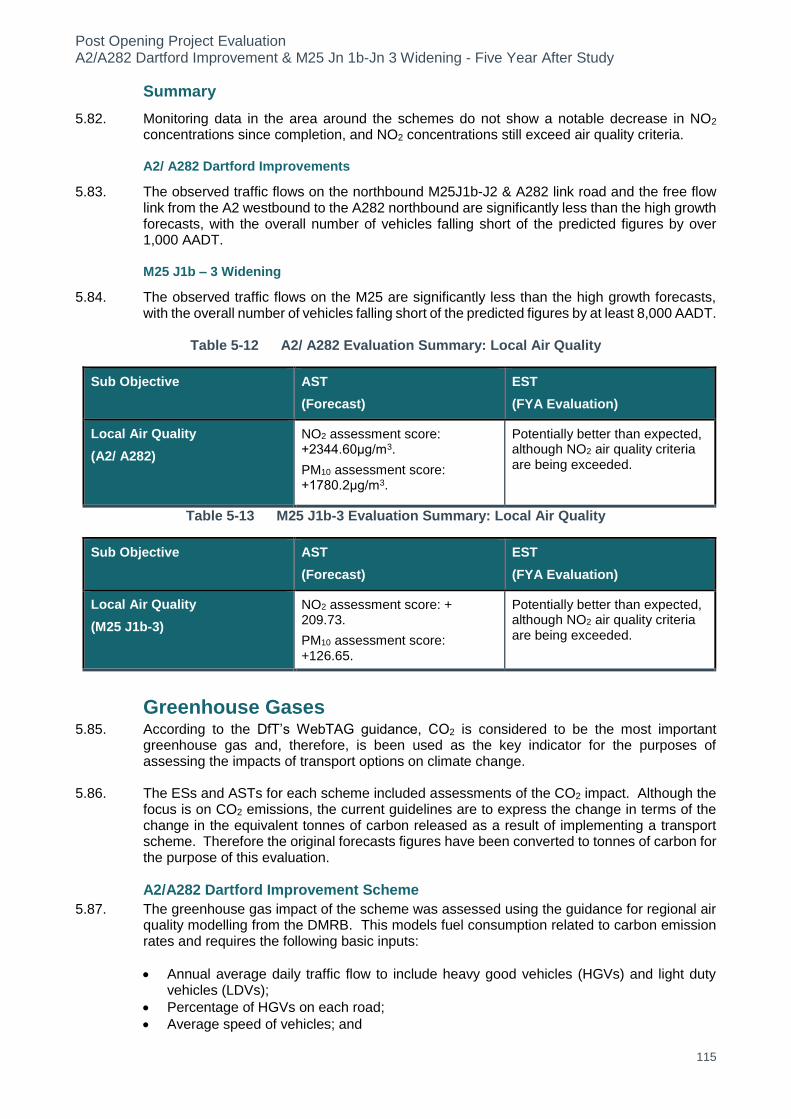
Post Opening Project Evaluation A2/A282 Dartford Improvement & M25 Jn 1b-Jn 3 Widening - Five Year After Study
115
Summary
5.82. Monitoring data in the area around the schemes do not show a notable decrease in NO2 concentrations since completion, and NO2 concentrations still exceed air quality criteria.
A2/ A282 Dartford Improvements
5.83. The observed traffic flows on the northbound M25J1b-J2 & A282 link road and the free flow link from the A2 westbound to the A282 northbound are significantly less than the high growth forecasts, with the overall number of vehicles falling short of the predicted figures by over 1,000 AADT.
M25 J1b – 3 Widening
5.84. The observed traffic flows on the M25 are significantly less than the high growth forecasts, with the overall number of vehicles falling short of the predicted figures by at least 8,000 AADT.
Table 5-12 A2/ A282 Evaluation Summary: Local Air Quality
Sub Objective AST
(Forecast)
EST
(FYA Evaluation)
Local Air Quality
(A2/ A282)
NO2 assessment score: +2344.60μg/m3.
PM10 assessment score: +1780.2μg/m3.
Potentially better than expected, although NO2 air quality criteria are being exceeded.
Table 5-13 M25 J1b-3 Evaluation Summary: Local Air Quality
Sub Objective AST
(Forecast)
EST
(FYA Evaluation)
Local Air Quality
(M25 J1b-3)
NO2 assessment score: + 209.73.
PM10 assessment score: +126.65.
Potentially better than expected, although NO2 air quality criteria are being exceeded.
Greenhouse Gases 5.85. According to the DfT’s WebTAG guidance, CO2 is considered to be the most important
greenhouse gas and, therefore, is been used as the key indicator for the purposes of assessing the impacts of transport options on climate change.
5.86. The ESs and ASTs for each scheme included assessments of the CO2 impact. Although the focus is on CO2 emissions, the current guidelines are to express the change in terms of the change in the equivalent tonnes of carbon released as a result of implementing a transport scheme. Therefore the original forecasts figures have been converted to tonnes of carbon for the purpose of this evaluation.
A2/A282 Dartford Improvement Scheme
5.87. The greenhouse gas impact of the scheme was assessed using the guidance for regional air quality modelling from the DMRB. This models fuel consumption related to carbon emission rates and requires the following basic inputs:
Annual average daily traffic flow to include heavy good vehicles (HGVs) and light duty vehicles (LDVs);
Percentage of HGVs on each road;
Average speed of vehicles; and

Post Opening Project Evaluation A2/A282 Dartford Improvement & M25 Jn 1b-Jn 3 Widening - Five Year After Study
116
Assessment year.
5.88. Paragraph 3.2.6.1 of the ES stated:
‘The detailed modelling of complex major junctions is not included within the prediction methodology as it relies on average speeds, traffic composition and road lengths. However, improvements at the A2/A282 junction are likely to result in reduced congestion which results in reduced CO2 emissions at higher speeds. Therefore the increase in greenhouse gases is likely to be overstated. Detailed modelling of major junctions is not part of this assessment’.
5.89. The published forecast was 5,187 additional CO2 impact at 2022. No data was given for the opening year. This is equivalent to 1,415 tonnes carbon.
5.90. The assessment in the Link E deferral report stated that the revised layout would not affect the greenhouse gases assessment. This was because traffic which was previously forecast to have used Link E will now flow onto a temporary Link located on the existing roundabout, which does not result in traffic flow changes to any other road links.
M25 Jn 1b – Jn 3 widening scheme
5.91. The greenhouse gas impact of the scheme was also assessed using the DMRB air quality spreadsheet. The forecast was a net impact of 3,390 CO2 impact in the opening year of 2008, equivalent to 925 tonnes carbon. This was a net increase of 4% between the Do-Minimum and Do-Something scenarios.
FYA Evaluation
A2/A282 Dartford Improvement Scheme
5.92. As described above, the appraisal did not consider the junction; hence the evaluation here has also been based only on the mainline traffic on the widened section of the A2.
M25 Jn 1b – Jn 3 widening
5.93. The area covered by the appraisal was not known. The evaluation has been based on flows and speeds in the AM, IP and peak periods for Jn 2 – Jn 3 for the situation before and after the scheme was implemented. The improved section of Jn 1b – Jn 2 cannot be included in the evaluation as it was not possible to make a like-for-like comparison of average journey times before and after, and therefore accurate information about the change in average speeds is not available. In addition to this MIDAS data on TRADs gave variable results regarding the number and proportion of HGVs on that section.
Table 5-14 Summary of Greenhouse Gases Evaluation – A2/A282 scheme
Origin of Assessment
Summary of Greenhouse Gases Impacts Assessment
AST (forecast)
Increase due to increased traffic flows, but likely to be overstated due to impact on junction congestion
1,415 tonnes carbon, a 9.5%
increase (in design year 2022)
EST (FYA evaluation)
There is an increase in emissions due to an increase in traffic volumes and improved speeds, however the increase in carbon in absolute terms is not as much as expected. This is because traffic volumes before the scheme was built were already exceeded Do-Minimum forecasts. Consequently, traffic has not increased as much as expected with the scheme. There has also been a slight reduction in the proportion of HGVs in the W/B direction which is likely to have compounded this result.
787 tonnes of carbon, 10%
increase
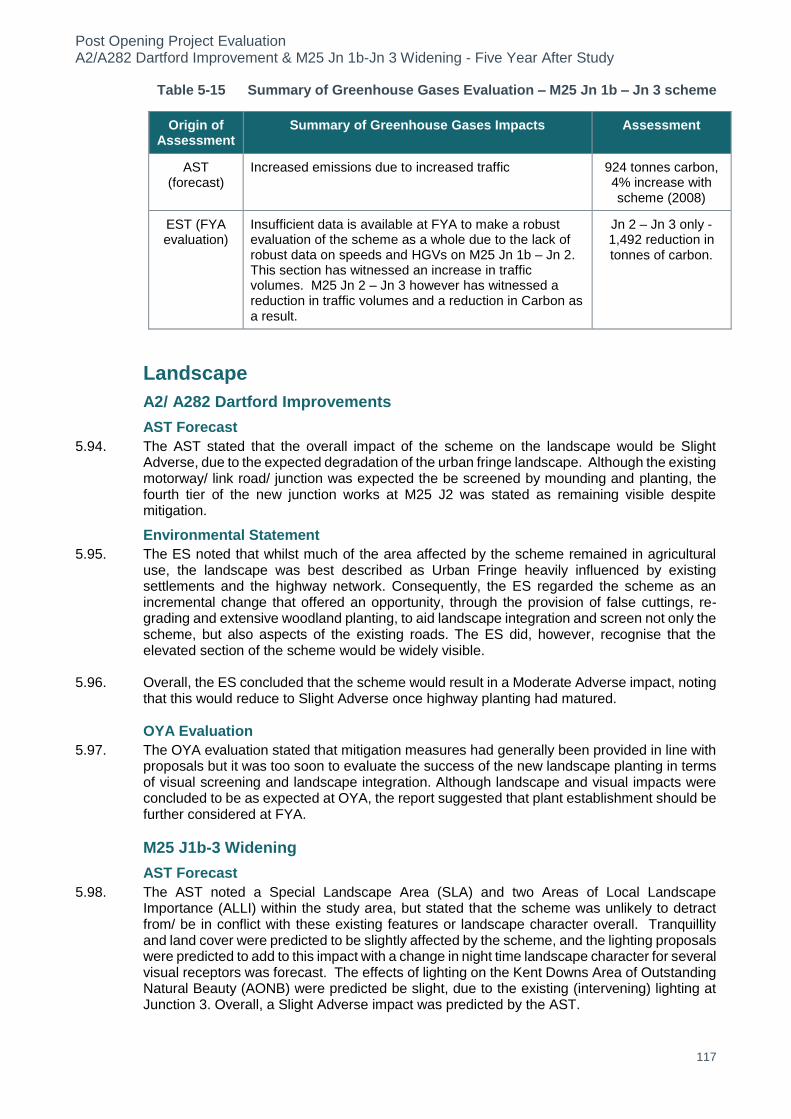
Post Opening Project Evaluation A2/A282 Dartford Improvement & M25 Jn 1b-Jn 3 Widening - Five Year After Study
117
Table 5-15 Summary of Greenhouse Gases Evaluation – M25 Jn 1b – Jn 3 scheme
Origin of Assessment
Summary of Greenhouse Gases Impacts Assessment
AST (forecast)
Increased emissions due to increased traffic 924 tonnes carbon, 4% increase with scheme (2008)
EST (FYA evaluation)
Insufficient data is available at FYA to make a robust evaluation of the scheme as a whole due to the lack of robust data on speeds and HGVs on M25 Jn 1b – Jn 2. This section has witnessed an increase in traffic volumes. M25 Jn 2 – Jn 3 however has witnessed a reduction in traffic volumes and a reduction in Carbon as a result.
Jn 2 – Jn 3 only -1,492 reduction in tonnes of carbon.
Landscape
A2/ A282 Dartford Improvements
AST Forecast
5.94. The AST stated that the overall impact of the scheme on the landscape would be Slight Adverse, due to the expected degradation of the urban fringe landscape. Although the existing motorway/ link road/ junction was expected the be screened by mounding and planting, the fourth tier of the new junction works at M25 J2 was stated as remaining visible despite mitigation.
Environmental Statement
5.95. The ES noted that whilst much of the area affected by the scheme remained in agricultural use, the landscape was best described as Urban Fringe heavily influenced by existing settlements and the highway network. Consequently, the ES regarded the scheme as an incremental change that offered an opportunity, through the provision of false cuttings, re-grading and extensive woodland planting, to aid landscape integration and screen not only the scheme, but also aspects of the existing roads. The ES did, however, recognise that the elevated section of the scheme would be widely visible.
5.96. Overall, the ES concluded that the scheme would result in a Moderate Adverse impact, noting that this would reduce to Slight Adverse once highway planting had matured.
OYA Evaluation
5.97. The OYA evaluation stated that mitigation measures had generally been provided in line with proposals but it was too soon to evaluate the success of the new landscape planting in terms of visual screening and landscape integration. Although landscape and visual impacts were concluded to be as expected at OYA, the report suggested that plant establishment should be further considered at FYA.
M25 J1b-3 Widening
AST Forecast
5.98. The AST noted a Special Landscape Area (SLA) and two Areas of Local Landscape Importance (ALLI) within the study area, but stated that the scheme was unlikely to detract from/ be in conflict with these existing features or landscape character overall. Tranquillity and land cover were predicted to be slightly affected by the scheme, and the lighting proposals were predicted to add to this impact with a change in night time landscape character for several visual receptors was forecast. The effects of lighting on the Kent Downs Area of Outstanding Natural Beauty (AONB) were predicted be slight, due to the existing (intervening) lighting at Junction 3. Overall, a Slight Adverse impact was predicted by the AST.

Post Opening Project Evaluation A2/A282 Dartford Improvement & M25 Jn 1b-Jn 3 Widening - Five Year After Study
118
Environmental Statement
5.99. The ES stated that the landscape and visual impacts resulting from the scheme would be Slight Adverse overall, and would mainly be as a consequence of the proposed lighting altering the character of the landscape. In terms of visual effects, the ES stated that the impact of the road would be reduced by the implementation of native species planting, and that environmental barriers would be installed.
Landscape mitigation proposals
5.100. The A2/ A282 scheme landscape mitigation proposals were stated by the ES as comprising two metre high mounding (false cuttings on the top of embankments), the re-grading and shaping of earthworks and existing landforms which, in part, were to be returned to agriculture. Extensive areas of planting were proposed to reinforce existing vegetation and through the use of predominantly native plants, integrate with existing woodland and hedgerows, whilst the use of fast growing species within the mix of trees and shrubs would help ensure that effective screening would be quickly established. Replacement lighting would be “full cut off” to minimise light spread and pollution.
5.101. The M25 J1b-3 scheme landscape mitigation proposals were stated by the ES as comprising the retention of existing vegetation along the verges of the M25 where practicable in order to minimise the loss of mature planting. New planting was proposed where appropriate in order to help mitigate the loss of existing vegetation and assist with visual screening. Proposed planting was to consist of native tree and shrub species appropriate to the area. Environmental barriers were proposed alongside the M25 as it runs past Hawley, which would assist in visually screening the M25 from properties located close to the motorway either side of Hawley Road.
5.102. As confirmed at OYA, landscape mitigation proposals for both schemes have generally been implemented as expected by the respective ES’s. FYA comparison views with ES photomontages and OYA photographs are shown in Appendix Y.
OYA Evaluation
5.103. The OYA evaluation stated that mitigation measures had generally been implemented as expected, but that that plant establishment should be further considered at FYA as it was too soon to evaluate the functional success of the new landscape planting in terms of visual screening and landscape integration.
5.104. The OYA evaluation summary also noted that mitigation had generally been provided in line with proposals and that it was too soon to evaluate the success of the new landscape planting in terms of visual screening and landscape integration. The OYA evaluation summary further noted that the additional height and length of the environmental barriers provided along the M25 may have reduced the impact of night time glare from headlights and that although the impact on landscape designations was as expected, the Kent Downs Area of Outstanding Natural Beauty should be re-consulted as part of the FYA evaluation. Overall however, the landscape and visual impacts of the scheme were considered to be as expected at OYA.
FYA Consultation
5.105. Natural England (NE) stated that no was data held regarding the impacts of the schemes, and noted that as the Highways England is responsible for ensuring that any impact monitoring is robust, NE would not be providing any detailed comments.
5.106. As confirmed at OYA, landscape mitigation proposals for both schemes have generally been implemented as expected by the respective ES’s. FYA comparison views with ES photomontages and OYA photographs are shown in Appendix Y.
Update to Handover Environmental Management Plans
5.107. In 2011, the HEMPs for the A2/ A282 scheme and the M25 J1b-3 scheme were updated to incorporate their respective Landscape Management Plans and as such, supersede the (2008) HEMPs that were available at the time of the OYA evaluation. The full range of
Post Opening Project Evaluation A2/A282 Dartford Improvement & M25 Jn 1b-Jn 3 Widening - Five Year After Study
119
landscape mitigation measures confirmed as being implemented by the 2011 HEMPs for both schemes are therefore summarised in Appendix B.
5.108. No target plant coverage within any specific time period was stated by either HEMP, and in terms of any issues arising during the establishment phase of the planting, none were recorded.
FYA Evaluation
5.109. The FYA site visit found the A2/ A282 and M25 road corridors generally free of noxious weeds, although small, localised infestations of ragwort were observed within both schemes. The small scale of the infestations indicate that this weed is being controlled reasonably well and as such, the infestations are not considered to be significant. However, localised occurrences similar to those observed during the FYA site visit are likely to remain evident in locations where noxious weeds are found on adjacent land outside the highway boundaries.
5.110. Although the results of the Japanese Knotweed surveys (mentioned in the 2011 HEMPs) were not made available for the FYA evaluation, no Japanese Knotweed was observed during the FYA site visit. However, it should be noted that although the 2011 HEMPs for both schemes give the Japanese Knotweed burial locations as being within the north-east and the north-west quadrant grasslands (of J2), the co-ordinates of the burial locations differ between the HEMPs;
North-east quadrant grassland: TQ 559 722 GB (A2/ A282) and TQ 559 725 (M25 J1b-3); and
North-west quadrant grassland: TQ 555 723 GB (A2/ A282) and TQ 556 723 (M25 J1b-3.
5.111. In terms of the establishment of the new planting, the FYA site visit found planting within both schemes to be progressing well and as would be expected at the FYA stage. Grassland areas were generally free of significant scrub cover and in the main, plant stock appeared to be healthy, established, and in good condition.
5.112. Although not considered to be particularly significant at this stage, it should be noted that plant vigour was observed to vary within some of A2/ A282 planting plots around the M25 J2, notable examples being the plots flanking the A282 southbound exit slip road to the M25 J2 roundabout; see Figure 5-1, below. The reasons for this reduced vigour are unclear, although it could be due to a number of possible unknown factors (such as poor soil, bad handling of plant stock, exposure etc.), any of which, alone or in combination, could have/ be disrupting the natural growth patterns of the plant stock.
5.113. However, the HEMP noted that 5-yearly inspections should be undertaken with a view to ascertain whether re-planting/ re-stocking is required, and it is possible that replacement planting is due to be undertaken at these locations next planting season.

Post Opening Project Evaluation A2/A282 Dartford Improvement & M25 Jn 1b-Jn 3 Widening - Five Year After Study
120
Figure 5-1 Instances of varying plant vigour within the planting plots flanking the A282 southbound exit slip road to the M25 J2.
5.114. If replacement planting is not due to be undertaken next planting season, it is considered that if selected, less vigorous plants within these planting plots were coppiced next season as part of the 6 to 9 year rotation prescribed by the A2/ A282 HEMP, it is likely that along with varying and maintaining age diversity throughout the planting plots, vigorous and bushy growth may be promoted in the affected plants.
5.115. Consistent with the FYA site visit observations that there was approximately one seasons growth of the wildflower sward under-planting the majority of the tree and shrub plots, the HEMPs for both schemes indicate that these areas should be annually cut between late September and early October (summer flowering species), noting that the aim of soft estate management is that of minimal intervention; given the timing of the FYA site visit (July), there is no reason to suppose that these maintenance operations are not being undertaken as prescribed.
5.116. Regarding other maintenance operations, nothing was observed during the FYA site visit to suggest that maintenance operations are anything other than as specified by the HEMPs; no tree stakes or ties were noted (although photodegradable plant guard tubes/ spirals remain), plots appeared generally tidy and litter free, and strimming operations were observed along the M25 verges to the south of J2.
5.117. Figure 5-2 plots are representative of the condition of the planting plots throughout both schemes.

Post Opening Project Evaluation A2/A282 Dartford Improvement & M25 Jn 1b-Jn 3 Widening - Five Year After Study
121
Figure 5-2 Typical planting plots adjacent to the A2 eastbound entry slip road southwest of Gore Farm Cottages (left), and on the false cutting of the A282 northbound entry slip road,
directly east of Blackdale Farm Cottages (right).
5.118. The OYA evaluation noted that land lost to the scheme at Darenth Country Park was to be exchanged for land behind Gore Farm Cottages as compensation, and that this transfer should be confirmed as part of the FYA evaluation; the A2/ A282 HEMP (2011) confirmed that Exchange Land has been provided to replace the 2,905m2 of land taken from the Park.
Summary
5.119. The HEMPs for both schemes have been updated since the OYA evaluation, and have confirmed the full range of landscape mitigation measures implemented as part of the schemes.
5.120. Although no target plant coverage within any specific time period was outlined in the HEMPs, planting throughout the schemes is progressing well, with plant stock generally establishing, healthy, and in good condition.
5.121. Visual screening and landscape integration functions of the planting proposals are also generally developing well, with no reason to suggest that the intended functions of the planting plots will not be realised by the Design Year subject to on-going maintenance and management.
A2/ A282 Dartford Improvements
5.122. Exchange Land has been provided to replace the 2,905m2 of land taken from Darenth Country Park.
Table 5-16 A2/ A282 Evaluation Summary: Landscape
Sub Objective AST
(Forecast)
EST
(FYA Evaluation)
Landscape
(A2/ A282)
Slight adverse. As expected.
Table 5-17 M25 J1b-3 Evaluation Summary: Landscape
Sub Objective AST
(Forecast)
EST
(FYA Evaluation)
Landscape
(M25 J1b-3)
Slight adverse. As expected.

Post Opening Project Evaluation A2/A282 Dartford Improvement & M25 Jn 1b-Jn 3 Widening - Five Year After Study
122
Townscape
A2/ A282 Dartford Improvements
AST Forecast
5.123. The AST stated that the Townscape sub-objective was not applicable and as such, was not appraised.
Environmental Statement
5.124. The ES did not specifically mention Townscape, but did note that the land uses most affected by the Scheme would include agricultural land, community land and mineral working sites. The effect on urban land uses was stated as being restricted to a commercial complex at Hawley Manor.
OYA Evaluation
5.125. The OYA evaluation stated that the Townscape sub-objective had not been appraised, due to the lack of townscape features within the vicinity of the scheme.
M25 J1b-3 Widening
AST Forecast
5.126. The AST predicted an Adverse impact on the housing at Hawley, but stated that in terms of views and the increasing dominance of major roads within the area, this impact would be offset by the provision of environmental barriers and the overall effect would be neutral.
Environmental Statement
5.127. The ES did not mention Townscape specifically, but did note in the Landscape and Visual Effects chapter that the impact of the road would be reduced by the implementation of native species planting and environmental barriers.
OYA Evaluation
5.128. The OYA evaluation summary noted that there was limited townscape character within scheme area, and that mitigation measures had generally been installed as proposed. Although new gantries were noted as being visible from Hawley, the implementation of the environmental barriers was stated as having offset the impacts of the M25; the OYA evaluation summary concluded that the impact of the scheme on Townscape was as expected.
FYA Consultation
5.129. No responses to Consultation requests were received.
FYA Evaluation
5.130. The A2/ A282 HEMP (2011) confirmed that the surface under the Littledale viaduct has been surfaced using informal hard landscaping to provide a tidy visual appearance on approach to the village; this is shown in Figure 5-3, below.

Post Opening Project Evaluation A2/A282 Dartford Improvement & M25 Jn 1b-Jn 3 Widening - Five Year After Study
123
Figure 5-3 New hard landscaping under the Littledale viaduct, with the new A2 eastbound entry slip road clearly visible to the upper left of the picture.
5.131. As noted in the Landscape sub-objective, above, the overall current coverage, establishment, and condition of the plant stock indicates that the visual screening and landscape integration functions of the planting proposals are generally developing well, with no reason to suggest that the intended functions of the planting plots will not be realised by the Design Year subject to on-going maintenance and management.
5.132. No further evaluation has been undertaken, as no further changes regarding Townscape were identified during the FYA site visit and there were no unresolved issues from the OYA evaluations.
Summary
5.133. No significant changes regarding the effects of either scheme on townscape were identified during the FYA site visit, and there were no unresolved issues from the OYA report.
Table 5-18 A2/ A282 Evaluation Summary: Townscape
Sub Objective AST
(Forecast)
EST
(FYA Evaluation)
Townscape
(A2/ A282)
Assumed Neutral. As expected
Table 5-19 M25 J1b-3 Evaluation Summary: Townscape
Sub Objective AST
(Forecast)
EST
(FYA Evaluation)
Townscape
(M25 J1b-3)
Neutral. As expected.
Heritage
A2/ A282 Dartford Improvements
AST Forecast
5.134. The AST stated that there would be a deterioration of the settings of listed buildings and the Scheduled Ancient Monument at Hawley Manor, and that there would be a reduction in the

Post Opening Project Evaluation A2/A282 Dartford Improvement & M25 Jn 1b-Jn 3 Widening - Five Year After Study
124
completeness of later prehistoric and Roman remains. Overall, the impact of the scheme was assessed by the AST as slight adverse.
Environmental Statement
5.135. The ES stated that the scheme would result in direct effects on the landscape setting of Grade II and Grade II* listed buildings, and that a Scheduled Ancient Monument (SAM) at Hawley Manor would be affected. A reduction in the extent or completeness of the archaeological record was also predicted but overall, the ES concluded that the impact of the scheme would be Slight Adverse.
OYA Evaluation
5.136. The OYA evaluation summary reported that based on the effects of the scheme on the landscape settings of Scheduled Monuments and Listed Buildings, the impact of this aspect of the scheme was better than expected in the AST due to improved screening and noise climate provided by the new environmental barrier at Hawley Manor, and noted that the ES reported only slight adverse impacts to buried archaeology and the setting of Hawley Manor (an impact not realised due to the deferral of Link E). Overall however, the OYA evaluation was that the impact of the scheme was as expected.
M25 J1b-3 Widening
AST Forecast
5.137. The AST stated that the scheme would have a negative impact on regionally important archaeological sites, but the actual extent of the impact would be limited due to restricted width of the land-take; the AST assessed that the overall impact would be slight adverse.
Environmental Statement
5.138. The ES stated that the study area contained a limited amount of cultural heritage of varied significance within the scheme footprint, noting that Palaeolithic and Mesolithic archaeology was of regional significance and, if well preserved, had the potential to be of national importance. The ES also stated that although there was a known Iron Age item of regional significance that contributed towards the understanding of the development of settlements and their subsequent effect on the landscape, there were no nationally designated archaeological resources within the study area.
5.139. The ES also noted that although there were a small number of Listed Buildings within the study area, none of them fell within the footprint of the scheme.
5.140. Overall, the ES concluded that there would be a Minimal Adverse effect on cultural heritage, and that the proposed mitigation measures would reduce this impact to neutral.
OYA Evaluation
5.141. The OYA evaluation summary stated that impacts of the scheme on the landscape settings of cultural heritage assets such as listed buildings and Swanley Conservation Area were considered to be minimal and as such, as expected.
FYA Consultation
5.142. No responses to Consultation requests were received.
FYA Evaluation
5.143. As noted in the landscape sub-objective, above, the HEMPs for the A2/ A282 scheme and the M25 J1b-3 scheme were updated in 2011 and as such, supersede the HEMPs available at the time of the OYA evaluation. The full range of Heritage mitigation measures confirmed as being implemented by the 2011 HEMPs for both schemes are therefore summarised in Appendix B.
5.144. Both scheme HEMPs confirmed that a single report had been produced that combined and detailed the results and finds of both schemes. The Post-Excavation Summary (PES)

Post Opening Project Evaluation A2/A282 Dartford Improvement & M25 Jn 1b-Jn 3 Widening - Five Year After Study
125
document made available for this FYA evaluation noted that a Post-Excavation Archaeological Assessment (PEAA), including an updated project design and proposals for further analysis and publication of the results of the fieldwork, was currently in preparation (February 2008).
5.145. This FYA evaluation can confirm that the PEAA was published in 2011; in summary, the PEAA stated that Palaeolithic investigations produced finds dating from between 400,000 and 200,000 years ago, as well as two fresh flints from a surface dated to c.115,000 - 90,000 years ago, when Britain was hitherto thought to be deserted. Intermittent activity during the prehistoric period, from the early Neolithic onwards, was succeeded by a late-Iron Age/ early-Roman agricultural landscape and a late-Roman enclosure, an early-middle Saxon settlement, and a medieval farmstead. The latest features reported relate to a Second World War anti-aircraft gun position.
5.146. It can also be confirmed at FYA that a single archive of records and finds for the schemes has been prepared for deposition, although the archive is currently awaiting confirmation of a suitable museum to receive said archive.
5.147. No further evaluation has been undertaken, as no changes regarding Cultural Heritage were identified during the FYA evaluation and there were no unresolved issues from the OYA evaluation.
Summary
A2/ A282 Dartford Improvements and M25 J1b-3 Widening
5.148. Publication of the Post-Excavation Archaeological Assessment report containing the results of both schemes can be confirmed.
5.149. Although the deposition of finds is outstanding; all other aspects of the proposed mitigation phases have been addressed for both schemes as reported at OYA.
Table 5-20 A2/ A282 Evaluation Summary: Heritage
Sub Objective AST
(Forecast)
EST
(FYA Evaluation)
Heritage
(A2/ A282)
Slight Adverse. As expected, although the
deposition of the project archive
is outstanding.
Table 5-21 M25 J1b-3 Evaluation Summary: Heritage
Sub Objective AST
(Forecast)
EST
(FYA Evaluation)
Heritage
(M25 J1b-3)
Slight Adverse. As expected, although the
deposition of the project archive
is outstanding.
Biodiversity
A2/ A282 Dartford Improvements
AST Forecast
5.150. The AST stated that there would be no direct impacts on designated sites, but that there would be indirect effects on Darenth Wood Site of Special Scientific Interest (SSSI), calcareous

Post Opening Project Evaluation A2/A282 Dartford Improvement & M25 Jn 1b-Jn 3 Widening - Five Year After Study
126
grassland, and hedgerows of county significance. Potential disturbance to Dormouse habitat was also noted, and the overall impact of the scheme was stated as moderate adverse.
Environmental Statement
5.151. The ES noted that the study area contained a range of habitats that included calcareous grassland juxtaposed with ancient woodland, old hedgerows and waterbodies, further noting that protected species included reptiles, bats, badgers, dormice and water vole.
5.152. Whilst the ES stated that the scheme would not directly affect Darenth Wood SSSI, it was noted that the proposals would require the translocation of valuable habitats and aquatic plant species if they were not to be lost to the scheme. Similarly, the ES stated that although habitat containing protected species (notably reptiles and dormice) would be lost, enhancement of remaining habitat was proposed.
5.153. Overall, the ES concluded that the scheme would have a Moderate Adverse impact on the nature conservation interest of the study area.
OYA Evaluation
5.154. The OYA evaluation summary stated that the proposed ecological mitigation measures had been implemented as expected, and that the impact of the scheme on Darenth Wood SSSI was also considered to be as expected. Calcareous grassland was noted as having been translocated to Darenth Country Park and Dittander (a nationally scarce plant) as having been translocated to a new watercourse; the OYA evaluation considered that further information should be made available to evaluate the success of these translocations at the FYA stage.
5.155. The OYA evaluation summary also stated that impacts to protected species appeared to have been adequately mitigated; new embankments provided replacement reptile habitat and (Darenth Wood) SSSI had been managed to encourage dormice. The translocation of Wood Ant nests was regarded as successful and local populations, threatened by the scheme, were deemed to have been safeguarded.
5.156. Overall, the impact of the scheme on biodiversity was considered by the OYA evaluation to be as expected.
M25 J1b-3 Widening
AST Forecast
5.157. The AST stated that the scheme would not have an impact on any designated sites, and although the reduction in width of the soft estate would contribute to a loss of habitat for reptiles and breeding birds, the biodiversity value of the retained habitats would be enhanced through appropriate management. The overall impacts of the scheme on Biodiversity were assessed by the AST as slight adverse.
Environmental Statement
5.158. The ES stated that the scheme had the potential to impact on a number of ecologically important features and receptors, mainly as a consequence of habitat loss in the form of verges and/ or disturbance during construction. However, it was stated that these potential impacts would be mitigated and that no significant impacts were predicted.
OYA Evaluation
5.159. The OYA evaluation summary stated that as predicted, the scheme had not had any impacts on any designated site, and that although mitigation measures had been largely implemented as proposed, the planting had not yet matured. The evaluation summary further noted that areas of reptile habitat lost to the scheme had generally been replaced as a consequence of the new verges created along the Junction 2 improvements (part of the A2/ A282 scheme). Overall, the impact of the scheme on Biodiversity was considered to be as expected.

Post Opening Project Evaluation A2/A282 Dartford Improvement & M25 Jn 1b-Jn 3 Widening - Five Year After Study
127
FYA Consultation
5.160. Natural England (NE) stated that no data was held regarding the impacts of the schemes, and noted that as the Highways England is responsible for ensuring that any impact monitoring is robust, NE would not be providing any detailed comments.
Update to Handover Environmental Management Plans
5.161. As noted in the landscape sub-objective, above, the HEMPs for the A2/ A282 scheme and the M25 J1b-3 scheme were updated in 2011 and as such, supersede the HEMPs available at the time of the OYA evaluation. The full range of ecological mitigation measures confirmed as being implemented by the 2011 HEMPs for both schemes are therefore summarised in Appendix B.
FYA Habitat Evaluation
5.162. Regarding the success of the translocated calcareous grassland from Darenth Wood SSSI to the north-east quadrant near Junction 2, the results of the monitoring and management stated by the HEMP were not available to POPE for evaluation. Although the exact location and extents of the receptor site have not been confirmed, observations made by the FYA site visit in the vicinity of the receptor site did not identify anything to suggest that the translocation had been anything less than successful.
5.163. Information regarding the monitoring and management of the hedgerow at the disused Mabledon Hospital Grounds was also unavailable to POPE for evaluation. Consequently, no trends, adverse or otherwise, have been able to be identified regarding the condition of this hedgerow.
5.164. In terms of other habitat mitigation measures not specifically noted in the HEMPs, the planting plots observed during the FYA site visit throughout both schemes are generally progressing well and as discussed in the Landscape sub-objective, above, plant stock in the main is establishing, healthy, and in good condition.
FYA Species Evaluation
5.165. No monitoring results have been provided to POPE at FYA regarding the dormouse boxes within the retained woodland areas of the A2 verge, the wood ant nests along the edge of the Darenth Wood SSSI, or the translocated Dittander. Although the lack of monitoring information precludes confirmation, the OYA evaluation in 2010 considered that the impacts on these species had been adequately mitigated and based on the information provided by the 2011 HEMPs, there is no reason to suggest that the impact of the schemes on any species, protected or otherwise, is anything other than as expected.
5.166. The HEMP for the M25 J1b-3 scheme noted that the new wetland constructed as an ecological enhancement measure near Hawley may provide suitable habitat for water voles when established; although the FYA site visit was unable to directly access this area, observations suggested that the vegetation surrounding this pond was establishing well.
5.167. No animal mortality data has been made available to POPE for this FYA study; as such, no firm conclusions can be drawn regarding the effects of either scheme on this aspect of the biodiversity sub-objective.
Summary
5.168. The HEMPs for both schemes have been updated since the OYA evaluation, and have confirmed the full range of ecological mitigation measures implemented.
5.169. Although no target plant coverage within any specific time period was outlined in the HEMPs, planting throughout the schemes is generally progressing well, with plant stock in the main establishing, healthy, and in good condition.

Post Opening Project Evaluation A2/A282 Dartford Improvement & M25 Jn 1b-Jn 3 Widening - Five Year After Study
128
5.170. There is no reason to suggest that the impacts of the schemes on species, protected or otherwise, are anything other than as expected, and it is considered that habitat establishment and maintenance is in line with the ecological mitigation proposals for both schemes.
A2/ A282 Dartford Improvements
5.171. Despite a lack of monitoring information precluding any firm conclusions to be drawn regarding the success or otherwise of the calcareous grassland/ Dittander translocations, there is no reason to suggest that the translocations have not been successful.
5.172. No trends, adverse or otherwise, have been able to be identified regarding the condition of the important hedgerow at the disused Mabledon Hospital Grounds.
M25 J1b-3 Widening
5.173. The new wetland constructed as an ecological enhancement measure near Hawley may provide suitable habitat for water voles.
Table 5-22 A2/ A282 Evaluation Summary: Biodiversity
Sub Objective AST
(Forecast)
EST
(FYA Evaluation)
Biodiversity
(A2/ A282)
Moderate Adverse. As expected.
Table 5-23 M25 J1b-3 Evaluation Summary: Biodiversity
Sub Objective AST
(Forecast)
EST (FYA Evaluation)
Biodiversity
(M25 J1b-3)
Slight Adverse. As expected.
Water Quality and Drainage
A2/ A282 Dartford Improvements
AST Forecast
5.174. The AST stated that soakaways were to be relocated and/ or replaced with balancing ponds, and that enhanced pollution control measures were to be provided before water was discharged into watercourses. Overall, the AST assessed the impact of the scheme as slight beneficial.
Environmental Statement
5.175. The ES stated that the proposals involved a number of measures that in combination, were expected to reduce the potential pollution threat to the River Darent and a Source Protection Zone36;
The provision of balancing ponds;
Removal of existing soakaways;
Provision of new soakaways in areas considered less vulnerable to ground water contamination; and
The installation of pollution control measures.
36 A protected groundwater source such as wells, boreholes and/ or springs used for public drinking water supply.

Post Opening Project Evaluation A2/A282 Dartford Improvement & M25 Jn 1b-Jn 3 Widening - Five Year After Study
129
5.176. As a result of these measures, the ES predicted that the scheme would have a beneficial effect
on water quality, and that the proposals would improve the quality of water discharged after treatment.
5.177. The ES also stated that given the proposed replacement flood capacity within the flood plain, the scheme would have a Neutral effect on land drainage and flood risk.
OYA Evaluation
5.178. The OYA evaluation reported that soakaways had been replaced with balancing ponds, oil separators had been installed at all discharge points and spillage containment tanks, and that baffled spillways and penstocks had also been installed.
5.179. The OYA evaluation summary stated that soakaways have been replaced with balancing ponds, and that oil separators had been installed at all discharge points, and spillage containment tanks, baffled spillways, and penstocks had been installed to mitigate water pollution impacts. Mitigation was stated as having been implemented as expected, and it was noted that monitoring data suggested that there had been no significant change in water quality as a result of the scheme. Overall, the effects of the scheme were considered likely to be as expected.
M25 J1b-3 Widening
AST Forecast
5.180. The AST stated that the provision of pollution control facilities, including spillage containment and oil interception at outfall locations, would result in improved pollution control which would benefit groundwater quality in terms of protection. Overall, the AST assessed the effects of the scheme as slight beneficial.
Environmental Statement
5.181. The ES noted that the groundwater resource within the study area was of very high importance owing to the public water supply borehole near Junction 2, and that the surface water environment, the main feature of which is the River Darent, was of high importance.
5.182. The ES also stated that the existing highway drainage systems along this section of the M25 had minimal pollution control measures, and that the proposals would redress this situation by reducing the number of highway outfalls, and by providing suitable pollution control measures that included oil interception, spillage containment and vegetative treatment measures.
OYA Evaluation
5.183. The OYA evaluation summary stated that soakaways have been replaced with balancing ponds, and that oil separators had been installed at all discharge points, and spillage containment tanks, baffled spillways, and penstocks had been installed to mitigate water pollution impacts. Mitigation was stated as having been implemented as expected, and it was noted that monitoring data suggested that there had been no significant change in water quality as a result of the scheme. Overall, the effects of the scheme were considered likely to be as expected.
FYA Consultation
5.184. The Environment Agency responded that balancing ponds and landscaping work were built to the expected good standards, noting that no ecological data was available regarding the effectiveness of these particular works.
Update to Handover Environmental Management Plans
5.185. As noted in the landscape sub-objective, above, the HEMPs for the A2/ A282 scheme and the M25 J1b-3 scheme were updated in 2011 and as such, supersede the HEMPs available at the time of the OYA evaluation. The full range of water quality and drainage mitigation

Post Opening Project Evaluation A2/A282 Dartford Improvement & M25 Jn 1b-Jn 3 Widening - Five Year After Study
130
measures confirmed as being implemented by the 2011 HEMPs for both schemes are therefore summarised in Appendix B.
FYA Evaluation
5.186. Although the FYA site visit was unable to directly access the majority of balancing ponds, observations made from publicly accessible locations suggest that the planting plots surrounding the ponds appear to be establishing well, and that the surrounds of the ponds are likely being maintained and capable of performing as expected.
5.187. Although accident and collision data are discussed further in the Safety Chapter of this report, the Stage 4 Road Safety Audit (RSA-4) for both schemes stated that in the 12-month period post-construction, there was a cluster of collisions within the vicinity of the Wood Lane overbridge on the A2. Of these collisions, four occurred when the road surface was wet, with three involving the driver responsible losing control. One of the loss of control collisions stated that the vehicle aquaplaned, and another stated that the vehicle drove “through a pool of standing water”.
5.188. The RSA-4 also stated that there were 5 (westbound) collisions at this location pre-construction, but only one of these occurred when the surface was wet, further noting that this collision did not involve a loss of control, and that no mention of aquaplaning associated with this collision was made.
5.189. The A2/ A282 ES shows pre-construction highway runoff draining into the Bean Soakaway North Pond, and post-construction runoff draining into the new pond located to the north west of Bean junction; the RSA-4 also noted that the carriageway has been widened from three to four lanes in each direction at this point and being bordered by a solid concrete barrier on both sides, considered it possible that the concrete barriers were impeding drainage.
The FYA site visit observed a build-up of silt and vegetation around the drains on the A2 carriageway verges and adjacent to the central concrete barrier around the Wood Lane overbridge; this is illustrated by Figure 5-4.
5.190. Although the RSA-4 data set is small, in the absence of any further information regarding the drainage system it is considered likely that the build-up of silt and vegetation within the drainage system at this location may, as stated in the RSA-4, “be indicative of a potential drainage problem on this carriageway that has been brought about by the changes implemented as part of the scheme or brought to light by different rainfall patterns”.
5.191. The RSA-4 went on to recommend that the adequacy of drainage at this location be investigated.
Figure 5-4 The A2 as seen from the Wood Lane overbridge, illustrating a partially blocked highway drain on the eastbound carriageway (left), and silt build-up adjacent to the central
concrete barrier on the westbound carriageway (right)

Post Opening Project Evaluation A2/A282 Dartford Improvement & M25 Jn 1b-Jn 3 Widening - Five Year After Study
131
5.192. All other drainage facilities throughout the schemes observed during the FYA site visit were relatively clear of vegetation and/ or appeared to be maintained and capable of functioning as would be expected.
5.193. No further information was received at FYA to indicate whether any incidents had occurred that may have affected the drainage system, and no further information regarding water quality monitoring has been made available for this report; as such, there is no reason to suggest that the impact of either scheme on water quality is anything other than as expected.
Summary
5.194. The HEMPs for both schemes have been updated since the OYA evaluation, and have confirmed the full range of water quality and drainage mitigation measures implemented as part of the schemes.
5.195. In the absence of water quality monitoring data, there is no reason to suggest that the impact of the schemes on water quality is anything other than as expected.
Table 5-24 A2/ A282 Evaluation Summary: Water Quality and Drainage
Sub Objective AST
(Forecast)
EST
(FYA Evaluation)
Water Quality and Drainage
(A2/ A282)
Slight Beneficial. Broadly as expected, although
there may be an issue with the
highway drainage system on the
A2 in the vicinity of Wood Lane.
Table 5-25 M25 J1b-3 Evaluation Summary: Water Quality and Drainage
Sub Objective AST
(Forecast)
EST
(FYA Evaluation)
Water Quality and Drainage
(M25 J1b-3)
Slight Beneficial. As expected.
Physical Fitness
A2/ A282 Dartford Improvements
AST Forecast
5.196. The AST stated that there were no proposed changes in terms of distances that could be cycled or walked and as such, the impact was considered neutral.
Environmental Statement
5.197. The Landuse and Community Effects chapter of the ES stated that the scheme would not result in the severance of any Public Right of Way (PRoW), although it did note that one path would be diverted. The overall impact however, was assessed as neutral.
OYA Evaluation
5.198. The OYA evaluation summary stated that the overall impact of the scheme on Physical Fitness was as expected, as the PRoW network had not been affected by the scheme, and no new severance had been introduced.

Post Opening Project Evaluation A2/A282 Dartford Improvement & M25 Jn 1b-Jn 3 Widening - Five Year After Study
132
M25 J1b-3 Widening
AST Forecast
5.199. The AST stated that the health benefits would remain unchanged as a result of the scheme, as no changes to the PRoW network were proposed. Overall, the AST assessed the effects of the scheme as neutral.
Environmental Statement
5.200. The ES stated that the scheme would provide no alleviation nor increase the degree of severance caused by the road, and concluded that as the scheme would provide little or no hindrance to journeys, it would have a Neutral effect regarding changes in community severance.
OYA Evaluation
5.201. The OYA stated that apart from minor changes to footpath DR36, the PRoW network had remained unaffected by the scheme and no new severance had been introduced.
FYA Consultation
5.202. No responses to Consultation requests were received.
FYA Evaluation
5.203. It was confirmed at OYA that no post-opening Non-Motorised User (NMU) surveys were completed for either scheme due to the lack of impacts on NMUs and as such, no NMU surveys have been undertaken specifically for this study.
5.204. As noted at OYA, Footpath DR36 has been moved slightly to skirt the edge of the new embankment accommodating the realigned A282 northbound entry-slip road (from J2) and the A2 eastbound/ A282 northbound link. Although this study agrees with the OYA evaluation in that that this diversion has had a negligible change to the footpath, both the AST and ES summaries (above) indicate that this change was as a result of the A2/ A282 scheme, and not the M25 J1b-3 scheme as suggested at OYA; Footpath DR36 is illustrated by Figure 5-5, below.
Figure 5-5 Footpath DR26 as seen from Blackdale Farm Cottages, west of the realigned A282 northbound entry-slip road (from J2) and the A2 eastbound/ A282 northbound link
5.205. The Illustrative Environmental Design Plans for the M25 J1b-3 scheme show Footpath DR49 crossing the M25 at Yew Tree overbridge, and joining Footpath DR39 just west of the M25 anticlockwise carriageway. From this point, Footpath DR39 is shown to head east towards the M25 before running parallel to the anticlockwise carriage way, north to Hawley Road underpass. The FYA site visit observed that a section of Footpath DR39 (approximately 160 metres from the point where Footpath DR49 meets Footpath D39 to the point where Footpath DR39 runs parallel to the M25) appears to have been removed, and that Footpath DR39 now runs from Hawley Road underpass directly to the Yew Tree overbridge where it joins Footpath DR49; this is illustrated in Figure 5-6, below.

Post Opening Project Evaluation A2/A282 Dartford Improvement & M25 Jn 1b-Jn 3 Widening - Five Year After Study
133
Figure 5-6 The photograph on the left is looking south towards the Yew Tree overbridge along Footpath DR39 at the point where the Illustrative Environmental Design Plans indicate
that the footpath should turn right (through the fence) to meet Footpath DR49. The photograph on the right is looking north towards the Hawley Road underpass from the new
section of Footpath DR39.
5.206. Although this study has been unable to ascertain whether the diversion to Footpath DR39 is a direct result of the changes implemented by the M25 J1b-3 scheme, it is considered that the diversion (approximately 105 metres longer) does not represent any significant change to any distance that may be walked or cycled. Given this and that there has been no change in the degree of community severance as a result of the diversion, it is considered that if this change to the PRoW network is an unexpected result of the scheme, the effects are likely to be negligible.
5.207. Regarding access and maintenance, all sections of the PRoW network viewed during the FYA site visit appeared to be capable of performing generally as expected, although no direct evidence of PRoW use was observed.
5.208. No further evaluation was undertaken, as no further changes regarding Physical Fitness were identified during the FYA site visit, and there were no unresolved issues from the OYA evaluation.
Summary
A282 Dartford Improvements
5.209. The AST and ES summaries indicate that a minor diversion was made to Footpath DR36. As noted at OYA, the diversion has not resulted in any negligible change to the distance of this footpath nor resulted in any increased degree of community severance.
M25 J1b-3 Widening
5.210. The AST and ES summaries indicate that the change to Footpath DR36 was as a result of the A2/ A282 scheme.
5.211. Footpath DR39 has been diverted, but it cannot be ascertained whether this is a direct result of the changes implemented by the scheme. However the distance of the diversion is negligible.

Post Opening Project Evaluation A2/A282 Dartford Improvement & M25 Jn 1b-Jn 3 Widening - Five Year After Study
134
Table 5-26 A2/ A282 Evaluation Summary: Physical Fitness
Sub Objective AST
(Forecast)
EST
(FYA Evaluation)
Physical Fitness
(A2/ A282)
Neutral. As expected.
Table 5-27 M25 J1b-3 Evaluation Summary: Physical Fitness
Sub Objective AST
(Forecast)
EST
(FYA Evaluation)
Physical Fitness
(M25 J1b-3)
Neutral. As expected.
Journey Ambience 5.212. The Journey Ambience sub-objective considers Traveller Care (facilities and information),
Traveller Views, and Traveller Stress (frustration, fear of potential accidents, and route uncertainty).
A2/ A282 Dartford Improvements
AST Forecast
5.213. The AST stated that the improved junction layout designed to deal with peak-time queuing problems on the A2 and M25 should improve safety; the overall impact was assessed as Slight Beneficial.
Environmental Statement
5.214. The ES expected that the scheme would result in improved driving conditions with an associated decline in driver stress levels.
OYA Evaluation
5.215. The OYA evaluation summary stated that new gantries and signage had improved driver information, and that the additional lanes and new junction layout had generally improved journey times. Additional lighting was stated to have improved night time driving conditions, and the overall impact of the scheme regarding the Journey Ambiance sub-objective was concluded to be as expected.
M25 J1b-3 Widening
AST Forecast
5.216. In terms of the anticipated reduction in traffic congestion, improved road layout, signage and lighting, the AST stated the impact of the scheme would be Beneficial. However, it was further stated that this would be offset by a reduction in road width, possibly leading to an increase in the fear of accidents and as such, a Neutral impact was predicted overall.
Environmental Statement
5.217. The ES stated that in the long term, the scheme would not result in significant changes to the extent, quality or type of views when compared to the current situation, and that Traveller Stress levels would be reduced as a result of reduced congestion, additional road lighting, better informed travellers, and freer flowing traffic resulting in more reliable journey times.

Post Opening Project Evaluation A2/A282 Dartford Improvement & M25 Jn 1b-Jn 3 Widening - Five Year After Study
135
OYA Evaluation
5.218. The OYA evaluation summary stated that new gantries and signage had improved driver information, and that the additional lanes and new junction layout had generally improved journey times. Additional lighting was stated to have improved night time driving conditions, although driver views were considered to be more restricted than expected due to the implementation of higher and longer lengths of environmental barrier than were originally proposed. Overall however, the OYA evaluation concluded that the impact of the scheme was to be as expected.
FYA Consultation
5.219. No responses to Consultation requests were received.
FYA Evaluation
Traveller Care/ Traveller Views
5.220. The OYA report confirmed that both the A2/ A282 and the M25 J1b-3 proposals had generally been implemented as expected, and concluded that in terms of both the Traveller Care and Traveller View aspects of the Journey Ambience sub-objective, the impacts of both schemes were also generally as expected.
5.221. No further evaluation regarding Traveller Care or Traveller Views was undertaken, as no changes to these aspects of the Journey Ambience sub-objective were identified during the FYA site visit, and there were no unresolved issues from the OYA evaluation.
Traveller Stress
5.222. The RSA-4 considered that an Advance Directional Sign (ADS) on the M25 southbound had been poorly positioned between the A282 exit-slip road (to the J2 roundabout) and the A2 eastbound exit-slip road (to Canterbury), as the location of the ADS could potentially lead drivers into believing that the A282 exit-slip road was the A2 eastbound exit-slip road. The RSA-4 further noted that despite the audit response from the RSA-3 stating that the sign would be removed, this had not been rectified. The RSA-4 recommendation was that the ADS should be removed from this location.
5.223. The FYA site visit observed that the ADS has not been removed, and remains positioned as described by the RSA-4 and as illustrated by Figure 5-7, below.
Figure 5-7 The (M2) Canterbury A2 ADS recommended for removal by the RSA-4, seen looking north from the B260 overbridge (left), and when travelling adjacent to the A282 exit-
slip road leading to the J2 roundabout (right).
5.224. As this sign has yet to removed, it is considered possible that drivers may continue to
misinterpret the ADS and as stated by the RSA-4, this could “potentially lead to drivers that are travelling on the M25 clockwise seeing the sign before they pass the exit for the A2 eastbound, believing that the exit is for the A2 eastbound and leading to them panicking and

Post Opening Project Evaluation A2/A282 Dartford Improvement & M25 Jn 1b-Jn 3 Widening - Five Year After Study
136
making a late manoeuvre onto the Link B diverge lane”, and that “such manoeuvres could lead to a loss of control and collisions with the terminal or safety barrier, which would likely result in serious injury”. As such, it is considered that Route Uncertainty and Fear of Accidents (i.e. Traveller Stress) may not have improved to the degree that was expected at this location.
5.225. While the Safety chapter of this report should be referred to for a full discussion of accident data, it should be noted that the FYA site visit observed the direct aftermath of a minor side-swipe collision between a car and a pantechnicon on the A282 southbound diverge (at the location shown in Figure 5-7, above).
5.226. The RSA-4 also noted that some of the road markings on the roundabout at Junction 2 have faded, particularly the yellow box markings on the roundabout at each of the approaches of the M25, and the A2 and the directional/ lane markings between the northbound M25 merge and the eastbound M25 merge. The RSA-4 recommendation was that the road markings should be refreshed at this location.
5.227. The FYA site visit observed that the road markings remain faded as described by the RSA-4; typical views of the road markings on the roundabout from a motorist’s perspective are illustrated by Figure 5-8, below.
Figure 5-8 Typical examples of the faded road markings at the M25 Junction 2 roundabout; yellow box markings (left), and directional/ lane markings (right).
5.228. It is considered likely that these faded road markings may have resulted in an increased degree driver frustration borne out of route uncertainty, both of which could potentially lead to poor lane discipline and late/ erratic lane changes that in turn, may result in an increase in fear regarding accidents. This is because;
As a result of the faded lane markings, lane discipline is likely to suffer and it is possible that drivers may form artificial lanes;
In the absence of clear directional markings, users may be unsure as to which lane they should be in to reach a particular exit, or of which exit they need to take off the roundabout; and
Worn yellow box markings may be ignored and become legally unenforceable, and the roundabout may become gridlocked.
5.229. It is therefore considered that the faded road markings at this location are unlikely to have a positive impact on Traveller Stress and as such, the effect of the A2/ A282 scheme on this aspect of Journey Ambience is likely to be worse than expected.

Post Opening Project Evaluation A2/A282 Dartford Improvement & M25 Jn 1b-Jn 3 Widening - Five Year After Study
137
5.230. Any changes in journey times and reliability for either scheme may also have had an impact of traveller frustration; these issues are examined in detail within the Traffic Analysis and Journey Times chapters of this report.
5.231. No further evaluation was undertaken, as no changes regarding Traveller Stress were identified during the FYA site visit for the M25 J1b-3 scheme, and there were no unresolved issues from the OYA evaluation.
Summary
5.232. For both schemes, no changes regarding Traveller Care or Traveller Views were identified during the FYA site visit, and there were no unresolved issues from the OYA evaluation.
A2/ A282 Dartford Improvements
5.233. It is likely that the faded road markings at J2 have resulted in an increased degree driver frustration borne out of route uncertainty, both of which potentially lead to poor lane discipline and late/ erratic lane changes that in turn, may result in an increase in fear regarding accidents.
5.234. The RSA-4 considered that the ADS on the M25 southbound between the A282 exit-slip road (to the J2 roundabout) and the A2 eastbound exit-slip road (to Canterbury) has the potential to cause drivers to make late manoeuvres onto the A282 exit-slip road.
M25 J1b-3 Widening
5.235. No changes regarding Traveller Stress were identified during the FYA site visit, and there were no unresolved issues from the OYA evaluation.
Table 5-28 A2/ A282 Evaluation Summary: Journey Ambience
Sub Objective AST
(Forecast)
EST
(FYA Evaluation)
Journey Ambience
(A2/ A282)
Slight Beneficial. As expected in terms of Traveller Care and Traveller Views.
Worse than expected in terms of Traveller Stress.
Table 5-29 M25 J1b-3 Evaluation Summary: Journey Ambience
Sub Objective AST
(Forecast)
EST
(FYA Evaluation)
Journey Ambience
(M25 J1b-3)
Neutral. As expected.

Post Opening Project Evaluation A2/A282 Dartford Improvement & M25 Jn 1b-Jn 3 Widening - Five Year After Study
138
Key Points – Environment
Noise A2/ A282 Dartford Improvements
Throughout the scheme, the percentage difference between the mean forecasts and the observed traffic flows at FYA are within the tolerances assumed by POPE and therefore, noise impacts are as expected.
M25 J1b-3 Widening
Between J1b - J2, observed traffic flows are close to those forecast. Between J2 and J3, observed traffic flows are between 22% and 30% less than forecasted, the shortfall in the absolute number of vehicles predicted at each location exceeding 1,000 AADT. As a result, noise impacts are better than expected.
Local Air Quality Monitoring data in the area around the schemes do not show a notable decrease in NO2
concentrations since completion, and NO2 concentrations still exceed air quality criteria. A2/ A282 Dartford Improvements
The observed traffic flows on the northbound M25J1b-J2 & A282 link road and the free flow link from the A2 westbound to the A282 northbound are significantly less than the high growth forecasts, with the overall number of vehicles falling short of the predicted figures by over 1,000 AADT.
M25 J1b – 3 Widening
The observed traffic flows on the M25 are significantly less than the high growth forecasts, with the overall number of vehicles falling short of the predicted figures by at least 8,000 AADT.
Greenhouse Gases There has been an increase of 787 tonnes of carbon per annum at FYA due to the A2/A282 scheme.
This is based on the A2 mainline flows only. The increase has been slightly less than forecast because the growth in traffic since the scheme opened has been less than forecast.
It has not been possible to calculate the change in carbon for the whole scheme, as there is insufficient robust information on speeds and HGVs for M25 Jn 1b – Jn 2 to undertake an analysis. Jn 2 – Jn 3 has shown a reduction in carbon, as this section has seen a reduction in traffic. This is not in line with what was forecast, however it should not been seen as representative of the scheme as a whole, as traffic between Jn 1b – Jn 2 shows a significant increase and is likely to have increased carbon emissions.
Landscape The HEMPs for both schemes have been updated since the OYA evaluation, and have confirmed
the full range of landscape mitigation measures implemented as part of the schemes.
Although no target plant coverage within any specific time period was outlined in the HEMPs, planting throughout the schemes is progressing well, with plant stock generally establishing, healthy, and in good condition.
Visual screening and landscape integration functions of the planting proposals are also generally developing well, with no reason to suggest that the intended functions of the planting plots will not be realised by the Design Year subject to on-going maintenance and management.
Exchange Land has been provided to replace the 2,905m2 of land taken from Darenth Country Park.
Overall landscape impacts are as expected for both schemes.
Townscape No significant changes regarding the effects of either scheme on Townscape were identified during
the FYA site visit, and there were no unresolved issues from the OYA report. A2/ A282 Dartford Improvements
The surface under the Littledale viaduct has been surfaced using informal hard landscaping to provide a tidy visual appearance on approach to the village.
Heritage Publication of the Post-Excavation Archaeological Assessment report containing the results of both
schemes can be confirmed.
Although the deposition of finds is outstanding; all other aspects of the proposed mitigation phases have been addressed for both schemes as reported at OYA.
Biodiversity

Post Opening Project Evaluation A2/A282 Dartford Improvement & M25 Jn 1b-Jn 3 Widening - Five Year After Study
139
The HEMPs for both schemes have been updated since the OYA evaluation, and have confirmed the full range of ecological mitigation measures implemented.
Although no target plant coverage within any specific time period was outlined in the HEMPs, planting throughout the schemes is generally progressing well, with plant stock in the main establishing, healthy, and in good condition.
There is no reason to suggest that the impacts of the schemes on species, protected or otherwise, are anything other than as expected, and it is considered that habitat establishment and maintenance is in line with the ecological mitigation proposals for both schemes.
A2/ A282 Dartford Improvements
Despite a lack of monitoring information precluding any firm conclusions to be drawn regarding the success or otherwise of the calcareous grassland/ Dittander translocations, there is no reason to suggest that the translocations have not been successful, and therefore impacts are as expected.
No trends, adverse or otherwise, have been able to be identified regarding the condition of the important hedgerow at the disused Mabledon Hospital Grounds.
M25 J1b-3 Widening
The new wetland constructed as an ecological enhancement measure near Hawley may provide suitable habitat for water voles. Overall biodiversity impacts are as expected.
Water The HEMPs for both schemes have been updated since the OYA evaluation, and have confirmed
the full range of water quality and drainage mitigation measures implemented as part of the schemes.
In the absence of water quality monitoring data, there is no reason to suggest that the impact of the schemes on water quality is anything other than as expected.
A2/ A282 Dartford Improvements
It is considered likely that the build-up of silt and vegetation within the drainage system on the A2 in the vicinity of the Wood Lane overbridge supports the RSA-4 interpretation of collision data, and that there may be “a potential drainage problem on this carriageway that has been brought about by the changes implemented as part of the scheme or brought to light by different rainfall patterns”.
Physical Fitness For both schemes, impacts on physical fitness are as expected.
A2/ A282 Dartford Improvements
The AST and ES summaries indicate that a minor diversion was made to Footpath DR36. As noted at OYA, the diversion has not resulted in any negligible change to the distance of this footpath nor resulted in any increased degree of community severance.
M25 J1b-3 Widening
The AST and ES summaries indicate that the change to Footpath DR36 was as a result of the A2/ A282 scheme.
Footpath DR39 has been diverted, but it cannot be ascertained whether this is a direct result of the changes implemented by the scheme.
Journey Ambience For both schemes, no changes regarding Traveller Care or Traveller Views were identified during the
FYA site visit, and there were no unresolved issues from the OYA evaluation. A2/ A282 Dartford Improvements
It is likely that the faded road markings at J2 have resulted in an increased degree driver frustration borne out of route uncertainty, both of which potentially lead to poor lane discipline and late/ erratic lane changes that in turn, may result in an increase in fear regarding accidents.
The RSA-4 considered that the ADS on the M25 southbound between the A282 exit-slip road (to the J2 roundabout) and the A2 eastbound exit-slip road (to Canterbury) has the potential to cause drivers to make late manoeuvres onto the A282 exit-slip road.
Impacts to journey ambience are worse than expected. M25 J1b-3 Widening
Impacts to journey ambience for the M25 scheme are as expected.

Post Opening Project Evaluation A2/A282 Dartford Improvement & M25 Jn 1b-Jn 3 Widening - Five Year After Study
140
6. Accessibility and Integration
6.1. This chapter evaluates the impact of the schemes in terms of the accessibility and integration objectives; comparing qualitative forecast assessments from the schemes’ ASTs with post-opening findings and analysis of policy objectives.
Accessibility 6.2. The accessibility objective is concerned with how the scheme has affected the ability of people
in different locations to reach different types of facility, using any mode of transport. The accessibility objective consists of three sub-objectives. These are:
Option Values;
Access to the Transport System; and
Severance
6.3. As part of each scheme’s appraisal, forecasts for the impacts on these sub-objectives were covered in the ASTs and formed part of the schemes’ pre-opening assessments. For the M25 Jn 1b – Jn 3 widening scheme, the Stage 3: Scheme Assessment Report Part 2 Engineering, Traffic and Economics section also included accessibility impacts. The evaluation presented here is based on a site visit and on literature searches.
Option Values
6.4. Option Values relate to measures which will change the availability of transport services or modes within the study area.
6.5. The forecast impact for both schemes on this sub-objective was neutral (no effect). It is considered that this forecast was correct for both schemes. There has been no impact on option values, as the schemes are improvements to the existing highway network and do not provide the user with any additional transport choices. No further evaluation of this sub-objective is required, and the impact has been scored as ‘neutral’, as expected.
Access to the Transport System
6.6. Access to the Transport System is strongly influenced by two key variables; access to a private car and proximity to a public transport service.
A2/A282 scheme
6.7. The latest AST for the scheme stated that the scheme would facilitate access to Ebbsfleet International station and to regeneration areas. However the assessment was still determined to be ‘neutral’.
M25 scheme
6.8. The Scheme Assessment Report (SAR) for the scheme stated that the scheme’s accessibility objectives included:
Facilitating access to Ebbsfleet International Rail Station; and
Improving access to regeneration areas of north and east Kent.
6.9. The AST stated that although access to public transport (e.g. Ebbsfleet International station) would be improved with the scheme, the scheme itself does not form part of a public transport route, and therefore the assessed forecast impact was ‘neutral’.
Evaluation of both schemes
6.10. POPE is concerned with the evaluation of schemes compared with predictions that were made in the appraisal, and as such, follows the objectives and framework used at that time.
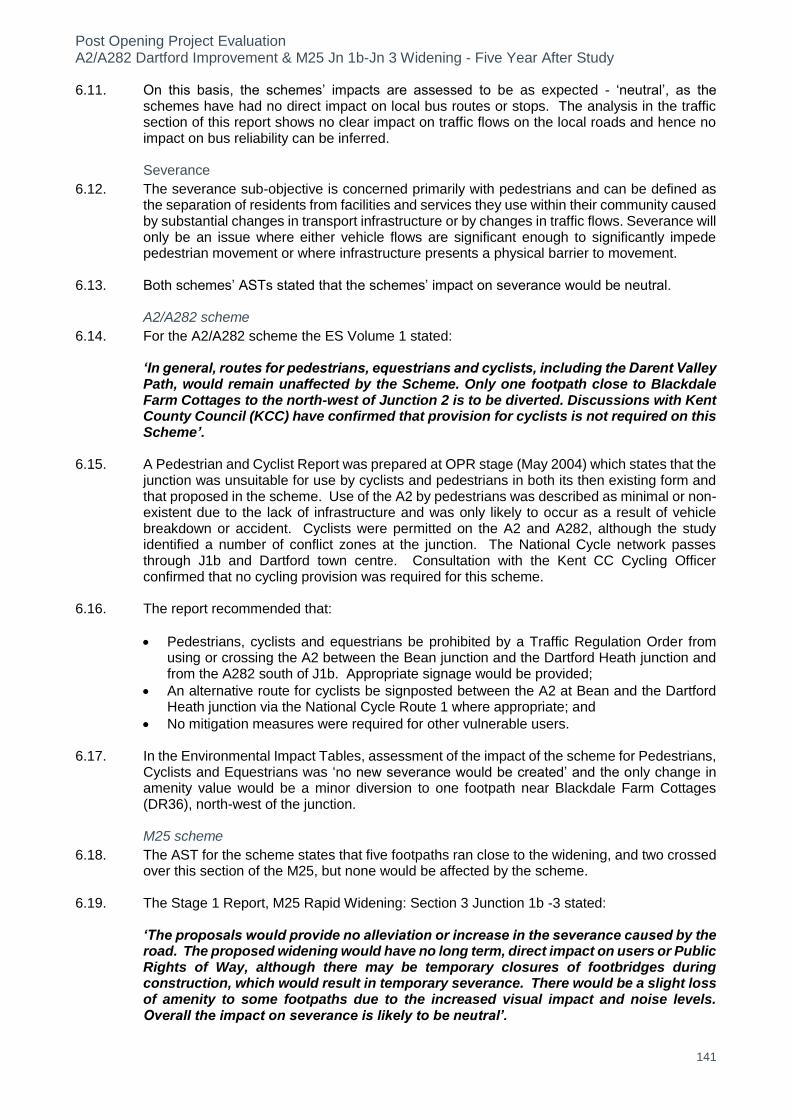
Post Opening Project Evaluation A2/A282 Dartford Improvement & M25 Jn 1b-Jn 3 Widening - Five Year After Study
141
6.11. On this basis, the schemes’ impacts are assessed to be as expected - ‘neutral’, as the schemes have had no direct impact on local bus routes or stops. The analysis in the traffic section of this report shows no clear impact on traffic flows on the local roads and hence no impact on bus reliability can be inferred.
Severance
6.12. The severance sub-objective is concerned primarily with pedestrians and can be defined as the separation of residents from facilities and services they use within their community caused by substantial changes in transport infrastructure or by changes in traffic flows. Severance will only be an issue where either vehicle flows are significant enough to significantly impede pedestrian movement or where infrastructure presents a physical barrier to movement.
6.13. Both schemes’ ASTs stated that the schemes’ impact on severance would be neutral.
A2/A282 scheme
6.14. For the A2/A282 scheme the ES Volume 1 stated:
‘In general, routes for pedestrians, equestrians and cyclists, including the Darent Valley Path, would remain unaffected by the Scheme. Only one footpath close to Blackdale Farm Cottages to the north-west of Junction 2 is to be diverted. Discussions with Kent County Council (KCC) have confirmed that provision for cyclists is not required on this Scheme’.
6.15. A Pedestrian and Cyclist Report was prepared at OPR stage (May 2004) which states that the junction was unsuitable for use by cyclists and pedestrians in both its then existing form and that proposed in the scheme. Use of the A2 by pedestrians was described as minimal or non-existent due to the lack of infrastructure and was only likely to occur as a result of vehicle breakdown or accident. Cyclists were permitted on the A2 and A282, although the study identified a number of conflict zones at the junction. The National Cycle network passes through J1b and Dartford town centre. Consultation with the Kent CC Cycling Officer confirmed that no cycling provision was required for this scheme.
6.16. The report recommended that:
Pedestrians, cyclists and equestrians be prohibited by a Traffic Regulation Order from using or crossing the A2 between the Bean junction and the Dartford Heath junction and from the A282 south of J1b. Appropriate signage would be provided;
An alternative route for cyclists be signposted between the A2 at Bean and the Dartford Heath junction via the National Cycle Route 1 where appropriate; and
No mitigation measures were required for other vulnerable users.
6.17. In the Environmental Impact Tables, assessment of the impact of the scheme for Pedestrians, Cyclists and Equestrians was ‘no new severance would be created’ and the only change in amenity value would be a minor diversion to one footpath near Blackdale Farm Cottages (DR36), north-west of the junction.
M25 scheme
6.18. The AST for the scheme states that five footpaths ran close to the widening, and two crossed over this section of the M25, but none would be affected by the scheme.
6.19. The Stage 1 Report, M25 Rapid Widening: Section 3 Junction 1b -3 stated:
‘The proposals would provide no alleviation or increase in the severance caused by the road. The proposed widening would have no long term, direct impact on users or Public Rights of Way, although there may be temporary closures of footbridges during construction, which would result in temporary severance. There would be a slight loss of amenity to some footpaths due to the increased visual impact and noise levels. Overall the impact on severance is likely to be neutral’.

Post Opening Project Evaluation A2/A282 Dartford Improvement & M25 Jn 1b-Jn 3 Widening - Five Year After Study
142
Evaluation of both schemes
6.20. The as-built drawings confirm that the impacts on right of way are as predicted. The only footpath diversion is minor (caused by the A2/A282 scheme), makes negligible change to its route length or amenity value. This was confirmed by the site visit. The impact on severance for both schemes is assessed as ‘neutral’, as expected.
Figure 6-1 Relocated stile on footpath DR36
Integration 6.21. The Integration Objective consists of the following sub-objectives:
Interchange with other transport modes; and
Land Use; and
Other Government Policies
Transport Interchange
A282 scheme
6.22. The scheme’s AST gave a ‘moderate beneficial’ impact and qualitatively stated that the scheme ‘forms integral part of public transport based strategy for Kent and Thameside development’.
M25 scheme
6.23. The scheme’s AST gave a ‘neutral’ impact and qualitatively stated that the objective is ‘not applicable as no interchange facilities are available between Junction 1b to 3 of the M25’.
Evaluation of both schemes
6.24. The Transport Interchange sub-objective is concerned with how transport schemes affect or interact with other modes. Improvements to the M25 and A2 will have improved and further facilitated access to the Ebbsfleet International Railway Station, which is accessed from the A2 east of the A2/A282. Extra capacity along the A2 and the small journey time savings as well as improved reliability (shown in Table 2-2 and Figure 4-1, respectively) will have catered for this traffic and therefore had an important part to play in easing access to this important transport interchange. It is considered however, that the ‘moderate beneficial’ impact forecast in the A2/A282 scheme appraisal was an over-estimate of the benefit, given the small journey time savings observed. However the ‘neutral’ assessment forecast for the M25 scheme seems to ignore the positive affect relief along the M25 and at Junction 2 will play, in facilitating improved journeys to and from the Ebbsfleet International Station.

Post Opening Project Evaluation A2/A282 Dartford Improvement & M25 Jn 1b-Jn 3 Widening - Five Year After Study
143
6.25. On balance, at this FYA stage, it is considered that both schemes have had a ‘slight beneficial’ impact on Transport Interchange.
Land Use Policy & Other Government Policies
6.26. This section looks at the schemes in relation to national, regional and local level land use and development policies and other Government Policies.
A282 scheme
6.27. The scheme’s impact on policy objectives (Land Use and other Government Policies) was forecast to be ‘adverse’ in the scheme’s AST which stated:
‘Some loss of good agricultural land which is against local and national policy objectives’...and ‘Direct and indirect effect on Green Belt, nature and heritage conservation designations which is contrary to local and national policy objectives’.
M25 scheme
6.28. The scheme’s impact on policy objectives (land use and other Government Policies) was forecast to be ‘neutral’ in the scheme’s AST which stated:
‘Proposals consistent with most plans/policies at national and regional level, supporting reduction in traffic congestion. Local policy objectives for protection of existing vegetation, habitat and heritage, and encouragement of limited lighting proposals not met by the scheme, causing some adverse impacts’....and .. ‘some unavoidable impacts on environment set out in documents by ODPM (now DfCLG). However some policies supported, such as maintenance of existing transport network capacity enhancement and improvements to key access routes to Kent Thameside’.
6.29. A summary of some of the national, regional and local policies alongside impacts of the schemes is provided in the following table, to show whether these align or not. Unless otherwise stated, the ‘alignment’ column relates to both schemes.

Post Opening Project Evaluation A2/A282 Dartford Improvement & M25 Jn 1b-Jn 3 Widening - Five Year After Study
144
Table 6-1 Assessment of Schemes’ Alignment with National, Regional and Local Policy
Policy/Document Relevant Policy Objective/Reference Relevant Scheme Impacts Alignment
Lo
ca
l a
nd
Su
b-R
eg
ion
al
Po
lic
ies
Kent Local Transport Plan 2001-2006 (LTP1)
The Local Transport Plan (LTP) for Kent 2001/02 to 2005/06 provided a strategy and programme of co-ordinated action for improving transport and accessibility in Kent. It was approved by the County Council in July 2000.
LTP5 - To provide a safe and secure transport system.
LTP3 - To provide a balanced system of transport which widens choice and provides a means of transport for everyone.
LTP4 - To stimulate economic activity and employment.
LTP - 4/6/7 To provide accessibility and choice, recognising the car as the prime means of transport in Kent, providing a balanced system of transport, widening choice and integrating transport provision and managing demand.
LTP8 - To improve the health and well-being of the people of Kent by promoting a transport system which enhances environmental conditions and encourages healthier living.
The LTP specifically lists the A2/A282 as a Highways England scheme that Kent supports, and states essential to the regeneration of Thames Gateway.
The A2/A282 has contributed to national targets to reduce collision and casualty numbers by delivering a significant saving in collisions per annum. The M25 scheme has not shown the same results.
Although the scheme does not directly offer other modes of transport, it will have facilitated access to Ebbsfleet, and potential employment in regeneration areas.
Improving the efficiency of the A2/A282 junction and the M25 along this busy section will have aided economic growth and catered for future growth, although the wider economic benefits cannot be quantified
Neither of the schemes promote healthier forms of transport
Partial
Kent and Medway Structure Plan (2006)
The Structure Plan is the strategic ‘arm’ of the statutory development plan for Kent and Medway setting out the broad strategy for the development and use of land for new homes, jobs, transport, shopping, recreation and services. Its purpose is to balance these requirements with the need to protect Kent’s environment:
facilitate national, regional and local inter-urban movements while minimising harm to the environment
maintain and make efficient use of the existing transport network
provide travel choice and alternatives to the private car, including public transport, walking and cycling
introduce and support measures to influence and manage demand for travel
reduce the rate at which congestion is worsening and improve journey reliability
improve air quality, safety and personal security and reduce social exclusion related to transport issues
secure improvements to the transport network
concentrate longer-distance traffic movements on the most suitable routes indicated in the road hierarchies attached to the Structure Plan.
Both schemes have relieved congestion and improved journey times and reliability at this junction, therefore aiding movements in to, out of and through the region. Environmental impacts have been mitigated
The schemes have improved the efficiency of the A2/A282 junction and provided additional capacity on the M25, therefore catering for future growth
The schemes have not created any additional transport choice for users and do not encourage the use of more sustainable modes such as walking and cycling.
The schemes have reduced the rate at which congestion is worsening and improved journey reliability
No new severance has been created
There is no evidence to suggest the schemes have deterred strategic movements from local routes
A282 scheme has shown a saving in collisions per annum, but the M25 scheme has not.
Partial
Regional Policy
Regional Economic Strategy (2006 – 2016)
The South East England Development Agency (SEEDA), as the Regional Development Agency for the South East, is responsible for the sustainable economic development and regeneration of the South East of England. The third Regional Economic Strategy for the South East from SEEDA, sits within the overall context of the Integrated Regional Framework for sustainable development in the South East, and alongside the draft South East Plan as the region’s spatial strategy. Transport falls under the Strategy’s ‘Smart Growth’ targets and aims, two of which are to:
Reduce road congestion and pollution levels by improving travel choice, promoting public transport, managing demand and facilitating modal shifts; and
Invest in key transport corridors.
Both schemes tackle congestion on both the M25 and A2 routes.
Whilst the schemes do not encourage more sustainable modes of transport they do facilitate improved access to Ebbsfleet Rail Station
Both schemes will have catered for traffic growth in the area and will therefore facilitate economic growth in the wider area including regeneration areas through improved access to jobs and retail.
Regional Planning Guidance for the South East (2001)
Covers the period up to 2016 setting the framework for the longer term future. This guidance supersedes the Regional Planning Guidance for the South East issued in March 1994, which covered the period up to 2011.
Policy RE1 - The regional economy should be supported and further developed to ensure that it contributes fully to national growth and follows the principles of sustainable development.
Policy RE2 - Human resource development should be recognised as a central component in harnessing and promoting future economic success in the Region and access to job opportunities should be improved for those currently disadvantaged in the labour market.
Policy T1 - Policies should be developed which minimise the distance which people need to travel whilst enhancing choice and ease of access to activities, taking into account the needs of all users including disabled people and others with reduced mobility.
Policy T4 - Walking and cycling should be vigorously promoted especially for shorter distances, as the healthiest and most environmentally-friendly ways to travel.
Policy T9 - Priorities for investment in transport infrastructure will be expected to serve the Region’s role as the transport gateway to the continent; improve the regional transport links between the Thames Gateway, Priority Areas for Economic Regeneration, other major urban areas, ports, airports and the Channel Tunnel Rail Link; and facilitate access to the potential growth areas.
A2/A282 scheme listed as a priority improvement for the Strategic Road network.
No elements of either scheme encourage or promote sustainable modes of transport such as walking or cycling, although no new severance has been created.
Both schemes will have facilitated improved access to employment in Kent Thameside Regeneration area, access to Bluewater Retail and Ebbsfleet International.
Both schemes reduce congestion and cater for additional traffic growth associated with the region.

Post Opening Project Evaluation A2/A282 Dartford Improvement & M25 Jn 1b-Jn 3 Widening - Five Year After Study
145
Policy/Document Relevant Policy Objective/Reference Relevant Scheme Impacts Alignment
National Policy
A New Deal for Trunk Roads in England (1998)
The Government’s overarching objectives for transport at the time of the appraisals were set out in this document:
To protect and enhance the built and natural environment.
To improve safety for all travellers
To contribute to an efficient economy, and to support sustainable economic growth in appropriate locations.
To promote accessibility to everyday facilities for all, especially those without a car.
To promote the integration of all forms of transport and land use planning, leading to a better, more efficient transport system
The A2/A282 scheme has journey time benefits at this strategic interchange, improving the efficiency and reliability of the trunk road network, with potential for wider economic benefits. The M25 scheme has also further enhanced this.
Both schemes will have facilitated improved access to Ebbsfleet International, and have not caused any new severance.
There is evidence that the A2/A282 scheme has improved safety and reduced the number of collisions per annum.
No evidence that the M25 scheme has reduced collisions.
A2/A282 scheme
M25 scheme
partial
Transport 2010: The Ten Year Plan (2000)
The strategy for transport aims to tackle congestion and pollution by improving all types of transport -rail and road, public and private - in ways that increase choice. It is a strategy for investment in the future to create prosperity and a better environment.
The scheme has delivered journey time benefits, and reliability improvements which have enhanced the efficiency of the trunk road and motorway network.
The impact on the environment has been minimised through mitigation, but the A2/A282 scheme builds on Green belt which is against national policy and
The deferral of Link E on the A2/A282 scheme has reduced the impact on nature and heritage designations.
Unavoidable impacts on environment from M25 widening including noise and air quality.
Partial
The Future of Transport: A Network for 2030 (2004)
The Strategy builds on the progress that had already been made since the implementation of the 10 year plan for transport. This plan extended out to 2014-2015 but strategy also looks even further ahead, at the challenges faced over the next 20-30years. The Strategy is built around three themes.
Sustained investment
Improvements in transport management
Planning ahead
The scheme has delivered journey time benefits and improved capacity of the route for future traffic growth, particularly that associated with Ebbsfleet International station and Bluewater Retail centre.
Improvement of key access routes to Kent Thameside therefore having wider economic impacts.
Catered for background traffic growth on the M25 and A2.

Post Opening Project Evaluation A2/A282 Dartford Improvement & M25 Jn 1b-Jn 3 Widening - Five Year After Study
146
6.30. The A2/A282 scheme’s AST forecast an ‘adverse’ impact on both Land Use and Other Government Polices due to loss of good agricultural land and impacts on Green Belt. However, it is considered at this FYA stage, that this forecast did not take account of all policies, some of which are aligned with the scheme impacts, such as reducing congestion and catering for growth as well as facilitating access to other transport links. We therefore consider that the scheme’s impact is ‘slight adverse’ and not the ‘adverse’ stated in the AST.
6.31. The M25 scheme was forecast to have a ‘neutral’ impact, a balanced forecast due to the consistency with policies to reduce congestion, but adverse for local environmental policies. The scheme has catered for growth on this busy section of the M25, and has made small improvements to journey times and reliability on some sections. The negative environmental impacts are also deemed to be less significant than for the A2/A282 scheme, and overall the scheme is assessed as ‘neutral’ for both Land Use and Other Government Policies.
Key Points – Accessibility and Integration
Accessibility Neither scheme has created or reduced the level of severance – ‘neutral impact’
Neither scheme has had any impact on Option values – ‘neutral impact’
Following appraisal guidance current at the time of the forecast, both schemes are assessed as having a ‘neutral’ impact on Access to the Transport System, however more recent guidance takes into account the distributional impacts of transport on all users. It is therefore considered that using this new guidance the schemes have had a slight beneficial impact on access to employment opportunities in regeneration areas, Ebbsfleet International Railway Station which opened in 2007; and retail facilities at Bluewater shopping centre.
Integration Both schemes have had a ‘slight beneficial’ impact on Transport Interchange due to
improving the M25 and A2 routes, facilitating access to Ebbsfleet International Station.
The A2/A282 scheme has had a ‘slight adverse’ (better than expected) impact on Land Use and Other Government Policies due to the negative impacts on good agricultural land and Green belt. The M25 scheme impact is deemed to be ‘neutral’ (as expected).
The reduction of traffic on the former A46 has indirectly facilitated public transport interchange improvements in terms of noise, air quality and safety.
The scheme is aligned with local, regional and national polices related to land use and development.

Post Opening Project Evaluation A2/A282 Dartford Improvement & M25 Jn 1b-Jn 3 Widening - Five Year After Study
147
7. Appraisal Summary Table (AST) and Evaluation Summary Table (EST)
Appraisal Summary Table 7.1. The AST is a brief summary of the main economic, safety, environmental and social impacts
of a highway scheme. Table 7-1 presents the AST for A2/A282 Dartford Improvement scheme and Table 7-2 shows the AST for the M25 J1b – 3 widening.
7.2. The AST presents a brief description of the scheme, a statement detailing the problems that the scheme planned to address, and makes an assessment of the scheme’s predicted qualitative and quantitative impacts against the following objectives:
Environment – an estimate of the impact of the scheme on factors such as noise, local air quality, landscape, biodiversity, and water;
Safety – measured reduction in the number and severity of collisions and qualitative assessment of impacts on security;
Economy – estimated impact of the scheme upon journey times, vehicle operating costs, scheme costs, journey time reliability and wider economic impact;
Accessibility – a review of scheme impact upon access to the public transport network, community severance, and non-motorised user impact; and
Integration – a description of how a scheme is integrated with wider local planning, regional and national policy objectives.
Evaluation Summary Table 7.3. The EST was devised for the POPE process to record a summary of the outturn impacts
against the same objectives, compared to the predictions in the AST.
7.4. Table 7-3 and Table 7-4 presents the EST for the A2/A282 Dartford Improvement scheme and M25 J1b – 3 widening scheme respectively. An assessment of each of the objectives at the FYA stage is given. Where possible, the format of the EST mirrors the appearance and process of the AST to enable direct comparison between the two.

Post Opening Project Evaluation A2/A282 Dartford Improvement & M25 Jn 1b-Jn 3 Widening - Five Year After Study
148
Table 7-1 Appraisal Summary Table: A2/A282 Dartford Improvement
Appraisal Summary Table (REV 2) A2 / A282 Dartford Improvement
Option: Description:
Improvement comprising free flow links for E-N, N-E movements. Includes 3 multi-span viaducts and 4 further interchange bridges. Also includes 2km of A2 widening
between M25 and Bean.
Problems: Junction needs improvement and A2 needs
widening to avoid peak period congestion
Present Value of Costs to Government £102.2m
(all costs are 2002 values discounted to 2002)
OBJECTIVE
SUB-OBJECTIVE QUALITATIVE IMPACTS QUANTITATIVE ASSESSMENT ASSESSMENT
Environment
Noise No properties would experience an increase in noise levels in the Design Year (2022) due to use of low noise surfacing, mounds and fencing. 51 properties would experience a reduction in noise levels of between 0.7 and 7.5 dB(A), 20 of which would experience a reduction greater than 3 dB(A). Without the Scheme, use of low noise surfacing in the Design Year would mean 45 properties would experience a reduction of between 1 and 3dB (A).
No. of properties experiencing:
Increase in noise 0
Decrease in noise 51
30 less people highly annoyed in 2022
Local Air Quality Local air quality is poor particularly in close proximity to the A2 and A282. ‘Cleaner’ vehicles in the future are likely to contribute to an improvement in air quality. Nevertheless anticipated improvement overall would be less with the Scheme when compared to Do-Minimum Scenario.
No. of properties experiencing:
27 properties – Better air quality
64 properties – Worse air quality
Weighted property concentrations (opening year):
PM10 +1780.2μg/m3
NO2 +2344.60μg/m3
Greenhouse Gases Overall CO2 emissions from the road network will increase slightly over the period 2007 to 2022 as a result of increased traffic flows. This broad assessment does not take into account the likely benefits due to the reduction in congestion at the junction.
Traffic which would have previously used link E will now flow onto a temporary Link located on the existing roundabout, which does not result in traffic flow change to any other road links. Therefore, the assessment score does not alter with Link E omitted from the scheme.
Not applicable Increase in greenhouse gases as a result of the Scheme in Year 2022 of +5187 tonnes/year = +9.5%
Landscape Degraded urban fringe landscape, existing motorway/link road/junction screened by mounding and planting. ‘4th tier’ to Junction 2 visible. Not applicable Slight Adverse
Townscape Not applicable Not applicable Not applicable
Heritage of Historic Resources Deterioration to the setting of listed buildings and Scheduled Ancient Monument at Hawley Manor and reduction in the completeness of later prehistoric and Roman remains.
Not applicable Slight Adverse
Biodiversity No direct impact on designated sites, but indirect effect on Darenth Wood SSSI, calcareous grassland, hedgerows of county significance and potential disturbance to Dormouse habitat.
Not applicable Moderate Adverse
Water Soakaways relocated and/or replaced with balancing ponds. Enhanced pollution control facilities before discharging into river. Not applicable Slight Beneficial
Physical Fitness No change to distances cycled or walked Not applicable Neutral
Journey Ambience Less congestion and stress reduced due to improved signing Not applicable Slight Beneficial
Safety
Accidents Improved junction layout to deal with peak-time queuing problem on A2 and M25 should improve safety.
(Figures include accidents saved in Kent Thameside and exclude accidents during maintenance and construction)
Accidents -77 PVB =£1.5m
(£0.9m if maintenance and
construction accidents
are included)
Deaths 0
Serious -3
Slight -103
Security Proposed CCTV coverage at Junction 2 Not applicable Slight beneficial
Economy
Transport Economic Efficiency Provides positive benefits in both high and low growth forecasts Public Accounts Central Govt PVC = £102.2m
TEE Bus users and Transport Providers Consumer Users PVB = £73.326m
Private Sector P’vders PVB = £16.550m
TEE consumers Business Users PVB = £89.123m
Reliability Scheme should improve reliability due to improved flow through M25 J2 Not applicable Moderate beneficial
Wider Economic Impacts Improve access from M25 and A2 to regeneration areas in Kent. Vital for the future development of Kent Thameside. Serves designated regeneration area?
Development depends on scheme
Yes
No
Accessibility
Option Values No effect Not applicable Neutral
Severance Severance already caused by existing junction. Not applicable Neutral
Access to the Transport System Benefits to existing network, increased opportunities for public transport initiatives not assessed. Facilitates access to Ebbsfleet International Rail Station and to regeneration areas
Not applicable Neutral
Integration
Transport Interchange Forms integral part of public transport based strategy for Kent and Thameside development. Not applicable Moderate Beneficial
Land-use Policy Some loss of good agricultural land which is against local and national policy objectives Not applicable Adverse
Other Government Policies Direct and indirect effect on Green Belt, nature and heritage conservation designations which is contrary to local and national policy objectives Not applicable Adverse
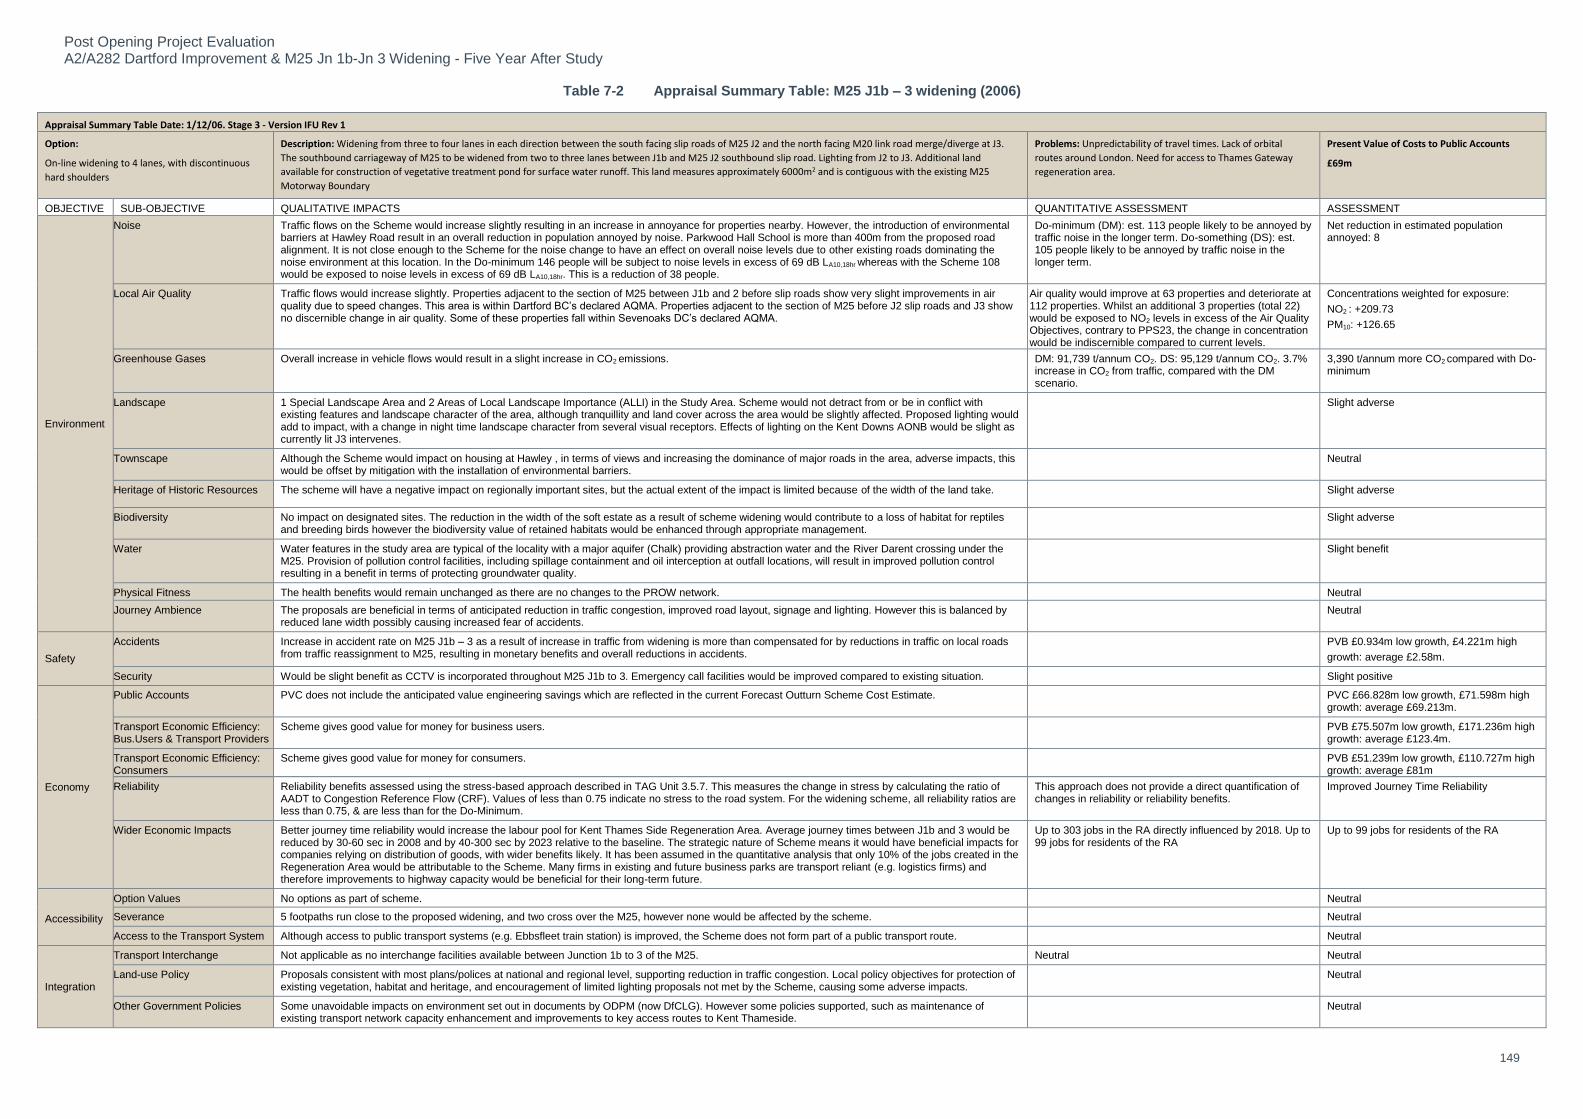
Post Opening Project Evaluation A2/A282 Dartford Improvement & M25 Jn 1b-Jn 3 Widening - Five Year After Study
149
Table 7-2 Appraisal Summary Table: M25 J1b – 3 widening (2006)
Appraisal Summary Table Date: 1/12/06. Stage 3 - Version IFU Rev 1
Option:
On-line widening to 4 lanes, with discontinuous
hard shoulders
Description: Widening from three to four lanes in each direction between the south facing slip roads of M25 J2 and the north facing M20 link road merge/diverge at J3.
The southbound carriageway of M25 to be widened from two to three lanes between J1b and M25 J2 southbound slip road. Lighting from J2 to J3. Additional land
available for construction of vegetative treatment pond for surface water runoff. This land measures approximately 6000m2 and is contiguous with the existing M25
Motorway Boundary
Problems: Unpredictability of travel times. Lack of orbital
routes around London. Need for access to Thames Gateway
regeneration area.
Present Value of Costs to Public Accounts
£69m
OBJECTIVE
SUB-OBJECTIVE QUALITATIVE IMPACTS QUANTITATIVE ASSESSMENT ASSESSMENT
Environment
Noise Traffic flows on the Scheme would increase slightly resulting in an increase in annoyance for properties nearby. However, the introduction of environmental barriers at Hawley Road result in an overall reduction in population annoyed by noise. Parkwood Hall School is more than 400m from the proposed road alignment. It is not close enough to the Scheme for the noise change to have an effect on overall noise levels due to other existing roads dominating the noise environment at this location. In the Do-minimum 146 people will be subject to noise levels in excess of 69 dB LA10,18hr whereas with the Scheme 108 would be exposed to noise levels in excess of 69 dB LA10,18hr. This is a reduction of 38 people.
Do-minimum (DM): est. 113 people likely to be annoyed by traffic noise in the longer term. Do-something (DS): est. 105 people likely to be annoyed by traffic noise in the longer term.
Net reduction in estimated population annoyed: 8
Local Air Quality Traffic flows would increase slightly. Properties adjacent to the section of M25 between J1b and 2 before slip roads show very slight improvements in air quality due to speed changes. This area is within Dartford BC’s declared AQMA. Properties adjacent to the section of M25 before J2 slip roads and J3 show no discernible change in air quality. Some of these properties fall within Sevenoaks DC’s declared AQMA.
Air quality would improve at 63 properties and deteriorate at 112 properties. Whilst an additional 3 properties (total 22) would be exposed to NO2 levels in excess of the Air Quality Objectives, contrary to PPS23, the change in concentration would be indiscernible compared to current levels.
Concentrations weighted for exposure:
NO2 : +209.73
PM10: +126.65
Greenhouse Gases Overall increase in vehicle flows would result in a slight increase in CO2 emissions. DM: 91,739 t/annum CO2. DS: 95,129 t/annum CO2. 3.7% increase in CO2 from traffic, compared with the DM scenario.
3,390 t/annum more CO2 compared with Do-minimum
Landscape 1 Special Landscape Area and 2 Areas of Local Landscape Importance (ALLI) in the Study Area. Scheme would not detract from or be in conflict with existing features and landscape character of the area, although tranquillity and land cover across the area would be slightly affected. Proposed lighting would add to impact, with a change in night time landscape character from several visual receptors. Effects of lighting on the Kent Downs AONB would be slight as currently lit J3 intervenes.
Slight adverse
Townscape Although the Scheme would impact on housing at Hawley , in terms of views and increasing the dominance of major roads in the area, adverse impacts, this would be offset by mitigation with the installation of environmental barriers.
Neutral
Heritage of Historic Resources The scheme will have a negative impact on regionally important sites, but the actual extent of the impact is limited because of the width of the land take. Slight adverse
Biodiversity No impact on designated sites. The reduction in the width of the soft estate as a result of scheme widening would contribute to a loss of habitat for reptiles and breeding birds however the biodiversity value of retained habitats would be enhanced through appropriate management.
Slight adverse
Water Water features in the study area are typical of the locality with a major aquifer (Chalk) providing abstraction water and the River Darent crossing under the M25. Provision of pollution control facilities, including spillage containment and oil interception at outfall locations, will result in improved pollution control resulting in a benefit in terms of protecting groundwater quality.
Slight benefit
Physical Fitness The health benefits would remain unchanged as there are no changes to the PROW network. Neutral
Journey Ambience The proposals are beneficial in terms of anticipated reduction in traffic congestion, improved road layout, signage and lighting. However this is balanced by reduced lane width possibly causing increased fear of accidents.
Neutral
Safety
Accidents Increase in accident rate on M25 J1b – 3 as a result of increase in traffic from widening is more than compensated for by reductions in traffic on local roads from traffic reassignment to M25, resulting in monetary benefits and overall reductions in accidents.
PVB £0.934m low growth, £4.221m high
growth: average £2.58m.
Security Would be slight benefit as CCTV is incorporated throughout M25 J1b to 3. Emergency call facilities would be improved compared to existing situation. Slight positive
Economy
Public Accounts PVC does not include the anticipated value engineering savings which are reflected in the current Forecast Outturn Scheme Cost Estimate. PVC £66.828m low growth, £71.598m high growth: average £69.213m.
Transport Economic Efficiency: Bus.Users & Transport Providers
Scheme gives good value for money for business users. PVB £75.507m low growth, £171.236m high growth: average £123.4m.
Transport Economic Efficiency: Consumers
Scheme gives good value for money for consumers. PVB £51.239m low growth, £110.727m high growth: average £81m
Reliability Reliability benefits assessed using the stress-based approach described in TAG Unit 3.5.7. This measures the change in stress by calculating the ratio of AADT to Congestion Reference Flow (CRF). Values of less than 0.75 indicate no stress to the road system. For the widening scheme, all reliability ratios are less than 0.75, & are less than for the Do-Minimum.
This approach does not provide a direct quantification of changes in reliability or reliability benefits.
Improved Journey Time Reliability
Wider Economic Impacts Better journey time reliability would increase the labour pool for Kent Thames Side Regeneration Area. Average journey times between J1b and 3 would be reduced by 30-60 sec in 2008 and by 40-300 sec by 2023 relative to the baseline. The strategic nature of Scheme means it would have beneficial impacts for companies relying on distribution of goods, with wider benefits likely. It has been assumed in the quantitative analysis that only 10% of the jobs created in the Regeneration Area would be attributable to the Scheme. Many firms in existing and future business parks are transport reliant (e.g. logistics firms) and therefore improvements to highway capacity would be beneficial for their long-term future.
Up to 303 jobs in the RA directly influenced by 2018. Up to 99 jobs for residents of the RA
Up to 99 jobs for residents of the RA
Accessibility
Option Values No options as part of scheme. Neutral
Severance 5 footpaths run close to the proposed widening, and two cross over the M25, however none would be affected by the scheme. Neutral
Access to the Transport System Although access to public transport systems (e.g. Ebbsfleet train station) is improved, the Scheme does not form part of a public transport route. Neutral
Integration
Transport Interchange Not applicable as no interchange facilities available between Junction 1b to 3 of the M25. Neutral Neutral
Land-use Policy Proposals consistent with most plans/polices at national and regional level, supporting reduction in traffic congestion. Local policy objectives for protection of existing vegetation, habitat and heritage, and encouragement of limited lighting proposals not met by the Scheme, causing some adverse impacts.
Neutral
Other Government Policies Some unavoidable impacts on environment set out in documents by ODPM (now DfCLG). However some policies supported, such as maintenance of existing transport network capacity enhancement and improvements to key access routes to Kent Thameside.
Neutral

Post Opening Project Evaluation A2/A282 Dartford Improvement & M25 Jn 1b-Jn 3 Widening - Five Year After Study
150
Table 7-3 Evaluation Summary Table: A2/A282 Dartford Improvement (2014)
A2/A282 Dartford Improvement
OBJECTIVE SUB-OBJECTIVE QUALITATIVE IMPACTS QUANTITATIVE ASSESSMENT ASSESSMENT
Environment Noise No meaningful conclusions in terms of Noise can be drawn from the percentage changes in HGV usage/ speed since the scheme opened. As expected
Local Air Quality The observed traffic flows on the northbound M25J1B-J2 & A282 link road and the free flow link from the A2 westbound to the A282 northbound are significantly less than the high growth forecasts, with the overall number of vehicles falling short of the predicted figures by over 1,000 AADT.
Potentially better than expected, although NO2 air quality criteria are being exceeded.
Greenhouse Gases There is an increase in emissions due to an increase in traffic volumes and improved speeds, however the increase in carbon in absolute terms is not as much as expected.
787 tonnes of carbon, 10% increase Adverse (better than expected)
Landscape
The full rang The landscape mitigation measures have been implemented as part of the scheme. Planting throughout the scheme is progressing well, with plant stock generally establishing, healthy, and in good condition. Visual screening and landscape integration functions of the planting proposals are also generally developing well. Exchange Land has been provided to replace the 2,905m2 of land taken from Darenth Country Park.
Slight adverse (as expected)
Townscape
No significant changes regarding the effects of either scheme on townscape were identified during the FYA site visit, and there were no unresolved issues from the OYA report. The surface under the Littledale viaduct has been surfaced using informal hard landscaping to provide a tidy visual appearance on approach to the village.
n/a
Heritage of Historic Resources
Although the deposition of finds is outstanding; all other aspects of the proposed mitigation phases have been addressed for both schemes as reported at OYA.
Slight adverse (as expected)
Biodiversity
There is no reason to suggest that the impact of the scheme on species, protected or otherwise, are anything other than as expected, and it is considered that habitat establishment and maintenance is in line with the ecological mitigation proposals.
Moderate adverse (as expected)
Water Water quality and drainage mitigation measures have been implemented as part of the scheme, although there may be an issue with the highway drainage system on the A2 in the vicinity of Wood Lane. In the absence of water quality monitoring data, there is no reason to suggest that the impact of the schemes on water quality is anything other than as expected.
Slight beneficial (as expected)
Physical Fitness
The AST and ES indicate that the change to footpath DR36 was a result of the A2/A282 scheme. The footpath has been diverted but it cannot be ascertained whether this a direct result of the changes implemented by the scheme. The distance of the diversion is negligible.
There is no change in the degree of community severance.
Neutral (as expected)
Journey Ambience There has been no change regarding traveller care of traveller views. The faded road markings at J2 have resulted in an increased degree of driver frustration borne out of route uncertainty, which leads to poor lane discipline and erratic lane movements, this increasing fear regarding accidents.
Neutral (worse than expected)
Safety Accidents
Annual accident saving much better than expected Average accident saving of 4.2 accidents per annum.
PVB = £10.0 M
(Better than expected)
Security CCTV installed Slight beneficial (as expected)
Economy Transport Economic Efficiency
The lower than forecast saving is due to the small number of vehicle hours saving derived from small journey time savings. PVB = £149.6 M
(16% lower than forecast)
Reliability Data unavailable hence no assessment has been made - -
Wider Economic Impacts
Through the improvements to infrastructure and observed beneficial impacts on journey times and reliability, the scheme has benefited the regeneration area and improved this part of the strategic road network to assist with national competitiveness.
- Beneficial
Accessibility Option Values
There has been no impact on option values, as the schemes are improvements to the existing highway network and do not provide the user with any additional transport choices.
- Neutral (as expected)
Severance The as-built drawings confirm that the impacts on right of way are as predicted. The only footpath diversion is minor (caused by the A2/A282 scheme), makes negligible change to its route length or amenity value. This was confirmed by the site visit.
- Neutral (as expected)
Access to the Transport System
By relieving congestion at this busy junction, and improving capacity on the A2 and M25, it is therefore considered that the scheme has had a beneficial impact improving and facilitating access to employment opportunities in regeneration areas, Ebbsfleet International Railway Station which opened in 2007 and retail facilities at Bluewater shopping centre.
- Beneficial (Better than expected)
Integration Transport Interchange
It is considered that the ‘moderate beneficial’ impact forecast in the A2/A282 scheme appraisal was an over-estimate of the benefit, given the small journey time savings observed.
- Slight beneficial (worse than expected)
Land-use Policy The AST forecast did not take account of all policies, some of which are aligned with the scheme impacts, such as reducing congestion and catering for growth as well as facilitating access to other transport links.
- Slight adverse (better than expected)
Other Government Policies The AST forecast did not take account of all policies, some of which are aligned with the scheme impacts, such as reducing congestion and catering for growth as well as facilitating access to other transport links.
- Slight adverse (better than expected)

Post Opening Project Evaluation A2/A282 Dartford Improvement & M25 Jn 1b-Jn 3 Widening - Five Year After Study
151
Table 7-4 Evaluation Summary Table: M25 J1b – 3 widening (2014)
M25 J1b – 3 widening
OBJECTIVE SUB-OBJECTIVE QUALITATIVE IMPACTS QUANTITATIVE ASSESSMENT ASSESSMENT
Environment Noise No meaningful conclusions in terms of Noise can be drawn from the percentage changes in HGV usage/ speed since the scheme opened. Better than expected
Local Air Quality The observed traffic flows on the M25 are significantly less than the high growth forecasts, with the overall number of vehicles falling short of the predicted figures by at least 8,000 AADT.
Better than expected
Greenhouse Gases Insufficient data is available at FYA to make a robust evaluation of the scheme as a whole due to the lack of robust data on speeds and HGVs on M25 Jn 1b – Jn 2.
Not Applicable
Landscape The landscape mitigation measures have been implemented as part of the scheme. Planting throughout the scheme is progressing well, with plant stock generally establishing, healthy, and in good condition. Visual screening and landscape integration functions of the planting proposals are also generally developing well.
Slight adverse (as expected)
Townscape No significant changes regarding the effects of either scheme on townscape were identified during the FYA site visit, and there were no unresolved issues from the OYA report.
Neutral (as expected)
Heritage of Historic Resources Although the deposition of finds is outstanding; all other aspects of the proposed mitigation phases have been addressed for both schemes as reported at OYA.
Slight adverse (as expected)
Biodiversity
There is no reason to suggest that the impact of the scheme on species, protected or otherwise, are anything other than as expected, and it is considered that habitat establishment and maintenance is in line with the ecological mitigation proposals.
Slight adverse (as expected)
Water The full range of water quality and drainage mitigation measures implemented as part of the scheme. In the absence of water quality monitoring data, there is no reason to suggest that the impact of the schemes on water quality is anything other than as expected.
Slight beneficial (as expected)
Physical Fitness Footpath DR39 has been diverted, but it cannot be ascertained whether this is a direct result of the changes implemented by the scheme. However the distance of the diversion is negligible, and there is no change in the degree of community severance.
Neutral (as expected)
Journey Ambience There has been no change to Traveller Care, views or Stress. Neutral (as expected)
Safety Accidents
The traffic analysis in this report shows little evidence of accident savings on local roads, and it is difficult to examine this in any further detail due to the sparsity of recent traffic data on local roads in Kent. From the information that has been available for this evaluation, it is considered that the
forecast collision saving from reduction in traffic on local roads has not transpired.
Average annual increase of 9.8 accidents per annum.
PVB = -£27.8 M
(worse than expected)
Security CCTV installed Slight beneficial (as expected)
Economy
Transport Economic Efficiency
Traffic volumes have reduced over recent years and traffic volumes at FYA are significantly lower than forecast, therefore fewer vehicles are receiving the journey time benefits.
Journey time savings along Jn 2 – Jn 3 are less than the forecast estimate.
PVB = £56.7 M
(73% lower than expected)
Reliability There are clear improvements in reliability southbound on the M25 between Jn 2 – Jn 3, and some evidence of improvement northbound along the same section, however the latter is less conclusive.
Beneficial (as expected)
Wider Economic Impacts By relieving congestion at this busy junction, and improving capacity on the A2 and M25, it is therefore considered that the schemes has had a beneficial impact improving and facilitating access to employment opportunities in regeneration areas, Ebbsfleet International Railway Station which opened in 2007 and retail facilities at Bluewater shopping centre.
Beneficial (as expected)
Accessibility Option Values
There has been no impact on option values, as the schemes are improvements to the existing highway network and do not provide the user with any additional transport choices.
- Neutral (as expected)
Severance The as-built drawings confirm that the impacts on right of way are as predicted. The only footpath diversion is minor (caused by the A2/A282 scheme), makes negligible change to its route length or amenity value. This was confirmed by the site visit.
- Neutral (as expected)
Access to the Transport System By relieving congestion at this busy junction, and improving capacity on the A2 and M25, it is therefore considered that the schemes has had a beneficial impact improving and facilitating access to employment opportunities in regeneration areas, Ebbsfleet International Railway Station which opened in 2007 and retail facilities at Bluewater shopping centre.
- Slightly (better than expected)
Integration Transport Interchange
Improvements to the M25 and A2 will have improved and further facilitated access to the Ebbsfleet International Railway Station, which is accessed from the A2 east of the A2/A282. The scheme will facilitate improved journeys to and from the Ebbsfleet International Station.
Slight beneficial (better than expected)
Land-use Policy The scheme is in line with policies to reduce congestion but it has an adverse impact on environmental policies. The scheme has catered for growth and has made small improvements to journey times and reliability on some sections.
Neutral (as expected)
Other Government Policies The scheme is in line with policies to reduce congestion but it has an adverse impact on environmental policies. The scheme has catered for growth and has made small improvements to journey times and reliability on some sections.
Neutral (as expected)

Post Opening Project Evaluation A2/A282 Dartford Improvement & M25 Jn 1b-Jn 3 Widening - Five Year After Study
152
8. Conclusions
8.1. To conclude this report, this section summarises how the scheme is meeting its specified objectives.
Scheme Specific Objectives 8.2. Table 8-1 and Table 8-2 present an evaluation of the two scheme’s objectives using the
evidence presented in this study.
Table 8-1 Success against scheme objectives: A2/A282 Dartford Improvement
Objective Has the scheme objective been achieved?
Reduce journey times and improve reliability
Journey times have reduced since scheme opening and for traffic using the new free-flow links there have been journey time savings of up to 2 minutes during the peak periods. Journey time reliability has improved in the A2 eastbound direction but there is no evidence that reliability has improved in the westbound direction.
Partial
Improve safety at the junction
The average number of collisions per annum has reduced above the level forecast, with a saving of 4.2 collisions per annum since the scheme opened.
Provide enhanced access from the M25 to the major regeneration area of Kent Thames-side and other regeneration areas in north and east Kent
Through improvements to infrastructure and observed beneficial impacts on journey times and reliability, the scheme has benefitted the Kent Thame-side regeneration area and improved this part of the strategic road network to assist with national competitiveness.
Facilitate access to Ebbsfleet International Rail Station from the national motorway and trunk road network
By relieving congestion at this busy junction and improving capacity on the A2 and M25, the schemes have had a beneficial impact on improving and facilitating Ebbsfleet International Rail Station. The scheme has also benefitted the Kent Thame-side regeneration area and improved this part of the strategic road network to assist with national competitiveness.
Limit the environmental impact of the scheme, especially regarding noise
The impact of the scheme on the majority of the sub-objectives is as expected, including noise.

Post Opening Project Evaluation A2/A282 Dartford Improvement & M25 Jn 1b-Jn 3 Widening - Five Year After Study
153
Table 8-2 Success against scheme objectives: M25 Jn 1b – 3 Widening
Objective Has the scheme objective been achieved?
Reduce journey times by 30 – 60 seconds per vehicle
Savings of 30 – 60 seconds have only been achieved on the M25 Jn 2 – Jn 3 northbound. Between Jn 2 and 3, northbound journey times in the PM Peak have reduced by 2 minutes and on the A2, west of A2/A282 junction, eastbound PM peak journey times have reduced by 25 seconds (the Controlled Motorway which opened between OYA and FYA will have contributed to the savings). Data is not available for a before and after comparison of the M25 between Jn 1b and Jn 2.
Partial
Improve reliability
Reliability has improved, particularly in the southbound direction on the M25 between Jn 2 and Jn 3. There are known issues of queues stemming back from the Dartford Crossing. Overall, it is however concluded that there has been an improvement in reliability.
Create jobs in Kent Thames-Side regeneration area through increase labour pool and impacts on companies relying on distribution of goods
Through improvements to infrastructure and observed beneficial impacts on journey times and reliability, the scheme has benefitted the Kent Thame-side regeneration area and improved this part of the strategic road network to assist with national competitiveness. The scheme has improved and facilitated access to employment opportunities in regeneration areas, Ebbsfleet International Railway Station and retail facilities at Bluewater shopping centre.
Mitigate the environmental impacts of the scheme and upgrade water control measures
The impact of the scheme on the majority of the sub-objectives is as expected and the water sub-objective is better than expected.
Facilitate future demand management measures to provide some constraint on induced traffic and lock in benefits from the widening
Controlled Motorway has opened between OYA and FYA.

Post Opening Project Evaluation A2/A282 Dartford Improvement & M25 Jn 1b-Jn 3 Widening - Five Year After Study
154
Appendices

Post Opening Project Evaluation A2/A282 Dartford Improvement & M25 Jn 1b-Jn 3 Widening - Five Year After Study
155
Appendix A. Data Requested for Section 5: Environment
A.1. Sources
Table A.1– Information requested to evaluate the Environment objective.
Environment Specific Requirements
OYA Response FYA Response
Environment Statement (ES) or Stage 3 Scheme Assessment Report (SAR) or Environmental Assessment Report (EAR) including Environmental Masterplan (EMP) drawings.
M25 junctions 1b to 3 Widening Scheme ES, November 2006: Volume 1A – main text; Volume 1b – figures; Volume 3 – appendices; Non-Technical Summary.
A2/A282 Dartford Improvement ES, March 2003: Volume 1 – main text and appendices; Volume 2 – figures.
Received at OYA.
AST. A2/ A282 AST, January 2004.
A2/ A282 AST Link E Deferral, June 2006.
M25 J1B-3 AST, December 2006
Received at OYA.
Any amendments / updates, additional surveys or reports since the ES / SAR / EAR.
A2/A282 Dartford Improvement Report on Deferment of Link E and Revised Landscape and Drainage Attenuation Proposals in North West Quadrant of Junction 2, Issued at IFI, April 2006.
A2/A282 Dartford Improvement AST Comparison, Issued at IFI, January 2008.
No additional information received at FYA.
Any changes to the scheme since the ES / SAR / EAR e.g. to lighting and signs, retention of material on site in earthworks in the form of landscape bunds or other, or to proposed mitigation measures.
- No additional information received at FYA
As built drawings for landscape/ biodiversity/ environmental mitigation measures/ drainage/ fencing/ earthworks etc.
Not yet completed for landscape and ecology.
A2/ A282 drainage drawings received.
M25 drainage drawings received.
Drainage as-builts received as noted at OYA.
A2/ A282: Additional as-builts received for Fencing, Road Restraint System, Lighting Ducts, Earthworks, Pavement, Kerbs/ Footways/ Paved areas, Road Markings and Traffic Sign Layout, Street Lighting, Electrical Design, COMMS, Structures (CCTV Masts, Culverts, Gantries, Retaining Walls & Structures).
No As-Builts received for Landscape or Ecology.
M25 J1B-3: Additional as-builts received for Road Restraint

Post Opening Project Evaluation A2/A282 Dartford Improvement & M25 Jn 1b-Jn 3 Widening - Five Year After Study
156
Environment Specific Requirements
OYA Response FYA Response
System, Inlet Structures Ducts, Earthworks, Pavement Treatment, Kerbs/ Footways/ Marker Posts Paved areas, Road Markings, Verge Signs and Marker Posts, Street Lighting, Structures (CCTV Masts, Gantries, Noise Barriers, Existing Utilities, Network Management Assets).
No As-Builts received for Landscape or Ecology.
Construction Environment Management Plan (CEMP), Landscape and Ecology Aftercare Plan (LEAP), Landscape Management Plan (LMP) or Handover Environmental Management Plan (HEMP).
Landscape and Ecology Management Plans not yet completed, but generic HEMPs received for both schemes.
A2/ A282 HEMP incorporating Partial As-Built LMPs (2011).
M25 J1B-3 HEMP incorporating First Issue LMPs (2011).
Health and Safety File – Environment sections (to include all environment As-Built reports).
- H&S file received.
A2/ A282: As-builts received for Fencing, Road Restraint System, Lighting Ducts, Earthworks, Pavement, Kerbs/ Footways/ Paved areas, Road Markings and Traffic Sign Layout, Street Lighting, Electrical Design, COMMS, Structures (CCTV Masts, Culverts, Gantries, Retaining Walls & Structures).
No As-Builts received for Landscape or Ecology.
M25 J1B-3: As-builts received for Road Restraint System, Inlet Structures Ducts, Earthworks, Pavement Treatment, Kerbs/ Footways/ Marker Posts Paved areas, Road Markings, Verge Signs and Marker Posts, Street Lighting, Structures (CCTV Masts, Gantries, Noise Barriers, Existing Utilities, and Network Management Assets).
No As-Builts received for Landscape or Ecology.
Relevant Contact Names for consultation.
Contact details received Received at OYA.
Some sourced by POPE.
Archaeological Reports (popular and academic).
Not yet completed. Due for completion later in 2010.
A2/ A282/ M25 Improvement Scheme, Dartford District, Kent, Post-Excavation

Post Opening Project Evaluation A2/A282 Dartford Improvement & M25 Jn 1b-Jn 3 Widening - Five Year After Study
157
Environment Specific Requirements
OYA Response FYA Response
Summary (Oxford Archaeology, February 2008).
The A2/ A282/ M25 Post-Excavation Archaeological Assessment was not received.
The Road Surface Influence (RSI) value of any low noise surface installed.
- None received.
The insulation performance properties of any noise barriers installed (The BS EN 1794-2 result provided by the noise barrier manufacturer).
- None received.
Employers Requirements Works Information - Environment sections.
- None received.
Reports for any pre/ post opening survey and monitoring work e.g. for noise, biodiversity, water quality).
A2/ A282 Dartford Improvement & M25 J1b-J3 Widening Scheme Handover Water Quality Monitoring Report.
No others made available to POPE
A2/ A282 Dartford Improvement Scheme and M25 J1B-3 Widening Scheme Road Safety Audit (Stage 4) 12-Month Monitoring Report (November 2011)
A2/A282 Dartford Improvement Acoustics Report (Post-Construction Noise Level Measurements and Comparison with Baseline Measurements), February 2009.
Animal mortality data. Not made available to POPE, None received.
Pre or Post opening Non-motorised User (NMU) Audits or Vulnerable User Surveys.
No post-opening NMU survey completed for either scheme due to lack of impacts on NMUs.
As noted at OYA.
Information may be available regarding environmental enhancements to streetscape/ townscape for bypassed settlements
N/ A As noted at OYA.
Scheme Newsletters / publicity material/ Award information for the scheme.
Material utilised from Highways England website.
As noted at OYA.

Post Opening Project Evaluation A2/A282 Dartford Improvement & M25 Jn 1b-Jn 3 Widening - Five Year After Study
158
Appendix B. Update to Handover Environmental Management Plans
In 2011, the HEMPs for the A2/ A282 scheme and the M25 J1b-3 scheme were updated to incorporate their respective Landscape Management Plans and as such, supersede the (2008) HEMPs that were available at the time of the OYA evaluation. The full range of mitigation measures confirmed as being implemented by the 2011 HEMPs for both schemes are therefore summarised;
LANDSCAPE
Existing retained vegetation: A limited amount of woody vegetation has been retained
within the A2/ A282 scheme. The retained planting is of mixed age and value, and
tends to be more mature towards the east in the Darenth Wood area. Cover is sparse
at the western edge of the scheme and in these and other areas, infill reinforcement
planting has been included as part of the landscape design. There are impacts on
Darenth Country Park due to medium term loss of screening vegetation on the
highway embankments; the tree screen has been replaced but its initial loss will result
in a medium term exposure of the Country Park to the new elevated road. Finally,
there is a hedgerow classified as ‘important’, under the Hedgerow Regulations 1997,
as amended, south east of Littledale viaduct, which has been retained and reinforced.
Within the M25 J1b-3 scheme, from the River Darent to the Yew Tree footbridge there is some retained vegetation comprising a mix of wooded strips, scrub and grassland, the tree and shrub species being predominantly native and dense in nature. Some of the retained trees are in very poor condition particularly just north of the Hawley Road southbound, some are dead and there is a line of conifers in poor condition, also southbound, just south of Hawley Road. It should be noted that these conifers, although not good specimens, do provide a vital screening function and are a very sensitive local issue. From the Yew Tree footbridge to the edge of Ship Lane none of the existing vegetation was retained, and South of Ship Lane for the remainder of the Scheme, there are varying amounts of retained vegetation on steep embankments with little opportunity to supplement with new planting;
Non-native invasive and injurious weeds: Ragwort (Senecio jacobaea) is present
along the highway embankments of the A2/ A282 and the M25 J1b-3 scheme.
Japanese Knotweed (Fallopia japonica) was found in several places within the A2/
A282 scheme, and in several places around the M25 J2. All instances of this weed
were removed and subsequently buried in accordance with best practice and with the
approval of the local Environment Agency office, seven metres deep at two locations
(around J2) - the north-east quadrant grassland, and the north-west quadrant
grassland; Two small treated stands of Japanese Knotweed remain outside the
highway boundary, one in the north west quadrant (of J2) approximately 100 metres
away from the river Darenth, adjacent to the river outfall pipe from the pond at Plot
18, and the second between Bean and J2 westbound near the disused Mabledon
Hospital site. Further surveys at these locations will be undertaken as part of the
regular inspections during the five year planting aftercare period;
New Planting: New planting commenced in January 2008, and was completed in
March 2008 for most areas within both schemes. Some of the A2/ A282 planting plots
were dependant on the M25 J1b-3 works, and these areas were planted by the end
of March 2009. The main types of planting are low density infill planting with native
trees and shrubs, areas of new or replacement native tree and shrub planting to
create either dense woodland with trees or dense scrub vegetation, and grassland
seeding, both open and species rich; and

Post Opening Project Evaluation A2/A282 Dartford Improvement & M25 Jn 1b-Jn 3 Widening - Five Year After Study
159
Off-site planting/ Accommodation works: A number of accommodation works were
carried out as part of the A2/ A282 scheme to meet commitments made in the ES,
and all accommodation works and offsite planting have now been handed back to the
landowners with no ongoing management or maintenance requirements. All
construction for the M25 J1b-3 works has taken place within the Highway boundary
and without the need to affect adjacent landowners in the long term.
The A2/ A282 HEMP also confirmed that the scheme has provided the following landscape mitigation measures:
Agricultural reinstatement: Three areas of land were taken for construction purposes
and have been returned to agriculture - two have been seeded with pasture grass
mix, and the third is a mix of pasture and arable. In the north-east quadrant an area
of approximately 12,000m2 has been returned to grazing, in the north-west quadrant
an area of approximately 28,600m2 south of Darenth Farm Cottages (west of the M25/
A282 embankment and east of the main drainage lagoon) has been returned to
pasture, and land taken in the south-east section for construction has been reinstated
and returned (to the landowner) for pasture and arable; and
Hard landscape feature: The surface under the Littledale viaduct has been surfaced
using informal hard landscaping to provide a tidy visual appearance on approach to
the village.
HERITAGE
With the deferment of Link E, the “Green Retaining Solutions” referred to by the ES
were no longer required to reduce the visual impact of the A2/ A282 scheme on the
Listed Buildings and Scheduled Monuments at Hawley Manor;
A scheme-wide archaeological watching brief was carried out along all cut sections
of the M25, the methodology for which was discussed with Kent County Council
Heritage Conservation Group); and
Trial trenching was undertaken within the footprint of the treatment pond in the
northwest quadrant (of J2), noted as being an area of high archaeological potential
(Plot 18).
BIODIVERSITY
Darenth Wood Site of Special Scientific Interest (SSSI): An area of calcareous
grassland and scrub measuring approximately 0.4ha has been lost to the A2/ A282
scheme. In mitigation, an area of calcareous grassland was translocated to a receptor
site in the north-east quadrant near Junction 2. This receptor site will be monitored
and maintained together with the landscape planting for up to 5 years, with steps
being taken to ensure that the grassland is successful. In addition, species rich
grassland has been created on a calcareous substrate near the new attenuation pond
in the north-west quadrant of Junction 2;
Disused Mabledon Hospital Grounds: The Local Wildlife Site at this location includes
a hedgerow classified as ‘Important’ under the Hedgerow Regulations (1997), and the
A2/ A282 ES stated that mitigation should comprise the translocation of approximately
50m of this hedgerow. However, through a revision to the design, the hedgerow was
retained in its entirety with no direct loss of habitat. A retaining wall was built alongside
the hedgerow to protect it from construction impacts, and a commitment has been
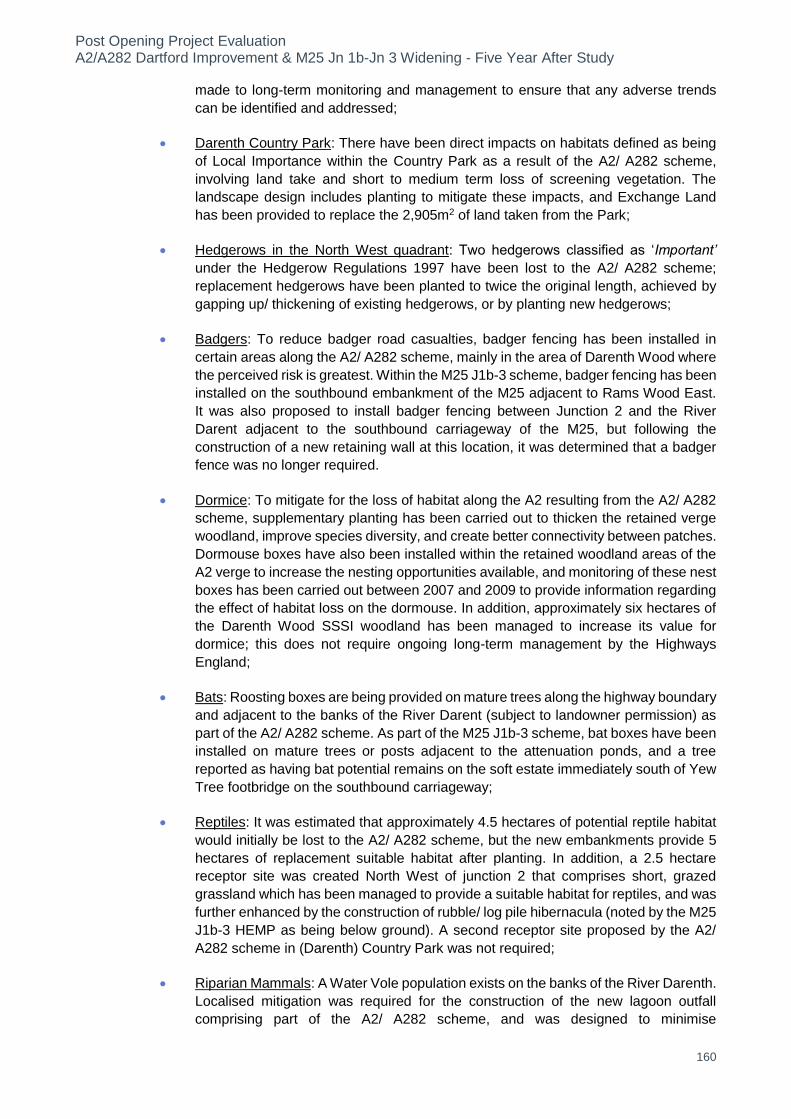
Post Opening Project Evaluation A2/A282 Dartford Improvement & M25 Jn 1b-Jn 3 Widening - Five Year After Study
160
made to long-term monitoring and management to ensure that any adverse trends
can be identified and addressed;
Darenth Country Park: There have been direct impacts on habitats defined as being
of Local Importance within the Country Park as a result of the A2/ A282 scheme,
involving land take and short to medium term loss of screening vegetation. The
landscape design includes planting to mitigate these impacts, and Exchange Land
has been provided to replace the 2,905m2 of land taken from the Park;
Hedgerows in the North West quadrant: Two hedgerows classified as ‘Important’
under the Hedgerow Regulations 1997 have been lost to the A2/ A282 scheme;
replacement hedgerows have been planted to twice the original length, achieved by
gapping up/ thickening of existing hedgerows, or by planting new hedgerows;
Badgers: To reduce badger road casualties, badger fencing has been installed in
certain areas along the A2/ A282 scheme, mainly in the area of Darenth Wood where
the perceived risk is greatest. Within the M25 J1b-3 scheme, badger fencing has been
installed on the southbound embankment of the M25 adjacent to Rams Wood East.
It was also proposed to install badger fencing between Junction 2 and the River
Darent adjacent to the southbound carriageway of the M25, but following the
construction of a new retaining wall at this location, it was determined that a badger
fence was no longer required.
Dormice: To mitigate for the loss of habitat along the A2 resulting from the A2/ A282
scheme, supplementary planting has been carried out to thicken the retained verge
woodland, improve species diversity, and create better connectivity between patches.
Dormouse boxes have also been installed within the retained woodland areas of the
A2 verge to increase the nesting opportunities available, and monitoring of these nest
boxes has been carried out between 2007 and 2009 to provide information regarding
the effect of habitat loss on the dormouse. In addition, approximately six hectares of
the Darenth Wood SSSI woodland has been managed to increase its value for
dormice; this does not require ongoing long-term management by the Highways
England;
Bats: Roosting boxes are being provided on mature trees along the highway boundary
and adjacent to the banks of the River Darent (subject to landowner permission) as
part of the A2/ A282 scheme. As part of the M25 J1b-3 scheme, bat boxes have been
installed on mature trees or posts adjacent to the attenuation ponds, and a tree
reported as having bat potential remains on the soft estate immediately south of Yew
Tree footbridge on the southbound carriageway;
Reptiles: It was estimated that approximately 4.5 hectares of potential reptile habitat
would initially be lost to the A2/ A282 scheme, but the new embankments provide 5
hectares of replacement suitable habitat after planting. In addition, a 2.5 hectare
receptor site was created North West of junction 2 that comprises short, grazed
grassland which has been managed to provide a suitable habitat for reptiles, and was
further enhanced by the construction of rubble/ log pile hibernacula (noted by the M25
J1b-3 HEMP as being below ground). A second receptor site proposed by the A2/
A282 scheme in (Darenth) Country Park was not required;
Riparian Mammals: A Water Vole population exists on the banks of the River Darenth.
Localised mitigation was required for the construction of the new lagoon outfall
comprising part of the A2/ A282 scheme, and was designed to minimise

Post Opening Project Evaluation A2/A282 Dartford Improvement & M25 Jn 1b-Jn 3 Widening - Five Year After Study
161
environmental impact by using lined, grassed channel and stone filled mesh gabions
rather than concrete outfall structures. The M25 J1b-3 scheme had no direct impact
on the River Darent and the habitat used by water voles, although the new wetland
constructed as an enhancement near Hawley may provide suitable habitat when
established;
Wood Ant: A number of colonies of red wood ant were present along the A2
embankments, and mitigation was carried out to translocate the nests to pre-prepared
receptor sites along the edge of the Darenth Wood SSSI as part of the A2/ A282
scheme. Monitoring of the nests translocated in 2006 indicated that there was a low
success rate, with ant colonies abandoning translocated nests and establishing new
nests nearby. However, nests translocated during 2007 showed a greater level of
success, and there was evidence of colonies continuing to occupy these nests
throughout the season; and
Dittander: A plant normally associated with salt marsh habitat, Dittander was found at
soakaway WB4 (Blackdale Farm), which has been lost to the A2/ A282 scheme.
Mitigation involved the collection of plants prior to storage and replanting by the new
balancing pond area. The Dittander is being monitored for 2 years to assess the
success of the translocation.
The M25 J1b-3 HEMP also confirmed that the scheme has provided the following ecological enhancements at three key locations:
A new vegetative treatment lagoon in an area of limited ecological value: The
boundary of this site has been planted with native trees and shrubs and species rich
grassland has been created around the perimeter. The lagoon itself has been
designed to maintain a minimum water level where aquatic vegetation can establish;
An existing drainage pond south of the River Darent: This has been removed from
the M25 drainage system and in this location a new wetland with associated aquatic
planting has been created. The boundary has been reinforced with locally indigenous
trees and shrubs and log piles and hibernacula have been constructed to increase
the value of the site for reptiles and amphibians; and
South-east of Hawley Road Bridge: This site formerly consisted of horse-grazed
pasture. This area has been enhanced to improve the botanical interest through
appropriate management to reduce its nutrient status, and the grazing regime has
been removed. The continuity of existing hedgerows has been enhanced by
supplementary planting and hedgerow creation, and log piles and hibernacula have
been constructed to enhance the value of the site for reptiles.
WATER QUALITY AND DRAINAGE
A2/ A282
The design assessed in the ES included three ponds (Pond A, Pond B, and Bean) but in accordance with the alternative proposal (with link E deferral), an enlarged pond (Plot 18) has been constructed in the north-west quadrant, and Pond B replaced by 450m of 975mm diameter pipe out falling into the pond at Plot 18. An infiltration pond (Plot 18a) has been constructed just north of Plot 18 to deal with land drainage and run off from the embankments. The existing 1050mm diameter land drain that passes under the A282 (which drains the north-east quadrant) has been extended under the new embankments and drains to the pond at Plot 18a.

Post Opening Project Evaluation A2/A282 Dartford Improvement & M25 Jn 1b-Jn 3 Widening - Five Year After Study
162
A 1200mm diameter highway drain has been constructed under the A282 to convey highway runoff to the Pond at Plot 18. The outfall pipe/ ditch from Plot 18 to the River Darent has been relocated further to the southeast of the original proposed location to avoid Thames Water sewers and the existing hedgerow. The alternative proposal also included for the provision of a flood compensation pond, the construction of which has been deferred until link E is constructed. The third pond is at Bean (Plot 70), and takes water from the A2 east of the Darenth Woods overbridge.
M25 J1b-3
Two separate discharge points in the form of soakaways very close to the River Darent, and situated in an Inner Source Protection Zone, have been abandoned and the runoff from those catchments diverted to the new treatment/ attenuation pond near Hawley. The other two soakaway discharge points have been abandoned and the runoffs diverted to Hawley and Swanley infiltration ponds respectively. This has resulted in reduced maintenance requirements as, with the new system, there are only two discharge points compared to six separate discharge points on the previous system. The installations of Class 1 Bypass Oil Separators37 at each discharge point also reduce the amount of hydrocarbons and sediments reaching the infiltration ponds. The oil separators are fitted with a sensor and alarm with signalling capability to alert to high oil levels. In order to reduce the impact of a serious pollution incident, penstock chamber and spillage containment tanks are installed at each infiltration pond compound. In addition, there are two intermediate spillage containment tanks between Swanley and Hawley. These assist in controlling any spillage into smaller sections with a subsequent reduction in any potential clean-up works. In order to improve the runoff quality at the discharge point located within the Inner Source Protection Zone near Hawley, a new treatment/ attenuation pond has been installed to provide partial vegetative treatment to the runoff, reducing heavy metal and sediment content. A Vortex Separator38 has been provided at the infiltration pond near Swanley to trap highway runoff sediment.
The M25 J1b-3 HEMP confirmed that a new attenuation/ treatment pond has been constructed to the south of the existing infiltration pond near Hawley and in addition to providing additional storage capacity by retaining the runoff, the new pond will also provide limited vegetative treatment to the initial runoff. The existing infiltration ponds at Hawley and Swanley will be maintained as before, and the soakaways and infiltration pond near the River Darent have been abandoned with the commissioning of the new drainage system.
37 Bypass Oil Separators can be specified as Class 1 or Class 2; Class 1 separators have a higher quality of filtration then Class 2
separators. 38 Vortex Separators are used to separate a mixture of materials of differing densities into two components.

A2/ A282 & M25 J1B-3: Five Year Post-Opening Project Evaluation
163
B.1. Photographic Record of Scheme
Figure B.1: 3m high environmental barriers (metal and wooden fencing) at Hawley (M25 Dartford Road underbridge)
OYA (February 2010)
FYA (July 2014)
The OYA report noted that 3m high (rather than 2m high) environmental barriers were implemented along the M25 following consultation on the ES. Although designed primarily for visual impact reasons, these barriers also have a benefit in terms of the noise environment.

A2/ A282 & M25 J1B-3: Five Year Post-Opening Project Evaluation
164
Figure B.2: Environmental Barriers (earth mounds) at edge of Links A and D at M25 J2
OYA (February 2010)
FYA (July 2014)
The planting on the embankments is establishing and although the remodelled landform remains evident, the planting is beginning to disguise the earthworks and integrate them into the landscape.

A2/ A282 & M25 J1B-3: Five Year Post-Opening Project Evaluation
165
Figure B.3: Additional environmental barrier near pond 3
OYA (February 2010)
FYA (July 2014)
Although the FYA site visit was unable to directly access the majority of balancing ponds, observations made from publicly accessible locations suggest that the planting plots surrounding the ponds appear to be establishing well.

A2/ A282 & M25 J1B-3: Five Year Post-Opening Project Evaluation
166
Figure B.4: Additional environmental barrier at M25/ Button Street underbridge
OYA (February 2010)
FYA (July 2014)
The planting adjacent to the additional environmental barrier at the M25/ Button Lane underbridge is establishing well and performing the visual screening and landscape integration functions for which it was intended.

A2/ A282 & M25 J1B-3: Five Year Post-Opening Project Evaluation
167
Figure B.5: View southbound along A282 towards M25 J2 showing new planting with individual shelters
OYA (February 2010)
FYA (July 2014)
Although not considered to be particularly significant at this stage, it should be noted that plant vigour was observed by the FYA site visit to vary within some of A2/ A282 planting plots around the M25 J2, notable examples being the plots flanking the A282 southbound exit slip road to the M25 J2 roundabout.

A2/ A282 & M25 J1B-3: Five Year Post-Opening Project Evaluation
168
Figure B.6: View of M25 J2 Link A from Blackdale Farm Cottages
OYA (February 2010)
FYA (July 2014)
Despite the remodelled landform and use of false cuttings, the visual impacts at Blackdale Farm Cottages are considered substantially adverse as expected. New planting has been implemented, and is beginning to ‘soften’ and integrate the embankment into the landscape as it establishes.

A2/ A282 & M25 J1B-3: Five Year Post-Opening Project Evaluation
169
Figure B.7: Listed building (wall) at Sutton Place with new gantry in distant view
OYA (February 2010)
FYA (July 2014)
Although the M25 and new gantries are visible from listed structures, the landscape settings were already in view of the existing M25 pre-construction. Due to the distance of the scheme, any impacts are considered minimal adverse, and it is considered likely that with the maturation of the mitigation planting, the impact will be reduced to neutral by design year, as expected.

A2/ A282 & M25 J1B-3: Five Year Post-Opening Project Evaluation
170
Figure B.8: Planting at edge of Darenth Wood SSSI
OYA (February 2010)
FYA (July 2014)
The reinforcement planting along the A2 westbound carriageway at the edge of Darenth Wood SSSI in the vicinity of Wood Lane overbridge is establishing well.
.

A2/ A282 & M25 J1B-3: Five Year Post-Opening Project Evaluation
171
Figure B.9: Ancient Woodland at Rams Wood East
OYA (February 2010)
FYA (July 2014)
Vegetation running adjacent to the clockwise carriageway of the M25, ancient woodland at Rams Wood East; although the M25 was already in place, the scheme involved the removal of screening vegetation, making the road more prominent within this area of rural character. It can be seen that the remaining vegetation continues to perform a screening function.

A2/ A282 & M25 J1B-3: Five Year Post-Opening Project Evaluation
172
Figure B.10: Diversion to Footpath DR36
OYA (February 2010)
FYA (July 2014)
The planting on the embankments is establishing and although the remodelled landform remains evident, the planting is beginning to disguise the earthworks and integrate them into the landscape.

Post Opening Project Evaluation A2/A282 Dartford Improvement & M25 Jn 1b - Jn 3 widening - Five Years After
173
Figure B.11: Photomontage: Proposed view towards M25 J2 from Edge of Dartford (Darenth Country Park)
A2/ A282 Dartford Improvement ES, Figure 25: Proposed View Year 1
OYA (February 2010)

Post Opening Project Evaluation A2/A282 Dartford Improvement & M25 Jn 1b - Jn 3 widening - Five Years After
174
FYA (July 2014)
The Littledale Viaduct and approaches are visible in the foreground, as is the M25 J2 in the distance. Replacement planting, combined with existing planting, has resulted in very little visual change and along with the false cuttings, is absorbing and integrating the links and the A2 into the landscape; however, the elevated link remains visible.

Post Opening Project Evaluation A2/A282 Dartford Improvement & M25 Jn 1b - Jn 3 widening - Five Years After
175
Figure B.12: Photomontage: Proposed view of widened Littledale Viaduct from Gore Road (Not Green Street/ Green Road, as noted in the ES).
A2/ A282 Dartford Improvement ES, Figure 26: Proposed View Year 1
OYA (February 2010)

Post Opening Project Evaluation A2/A282 Dartford Improvement & M25 Jn 1b - Jn 3 widening - Five Years After
176
FYA (July 2014)
A short length of the A2 widening is visible, but there is little change to the view now the planting on the embankment (left) is establishing and starting to
‘soften’ the earthworks; as such, the planting is currently considered to be on track to provide the landscape integration function for which it was intended.

Post Opening Project Evaluation A2/A282 Dartford Improvement & M25 Jn 1b - Jn 3 widening - Five Years After
177
Figure B.13: Before and After: Looking South West from Green Street/ Green Road over Blackdale Farm towards Junction 2.
A2/ A282 Dartford Improvement Proof of Evidence for the Public Inquiry, Photograph 1 (c.2004)
FYA (July 2014)
The scheme is closer to Blackdale Farm (left) and while the use of false cuttings assists in screening traffic, the elevated sections of the scheme is still visible. The vegetation designed to further screen traffic on the embankments varies in vigour and although not considered to be particularly significant at this stage, it is considered that some form of selected coppicing next season in line with the suggested management included in the A2/ A282 HEMP, it is likely that as well
as varying and maintaining age diversity throughout the planting plots, vigorous and bushy growth may be promoted in the affected plants.

Post Opening Project Evaluation A2/A282 Dartford Improvement & M25 Jn 1b - Jn 3 widening - Five Years After
178
Figure B.14: Before and After: Looking South along Trolling Down Hill (not Green Street/ Green Road as stated in the Proof of Evidence presented at Public Inquiry) towards Littledale Viaduct.
A2/ A282 Dartford Improvement Proof of Evidence for the Public Inquiry, Photograph 2 (c.2004)
FYA (July 2014)
Although there is little discernible change in view of the widened Littledale Viaduct, the new planting on the embankment (far right, and behind the existing off
site vegetation, centre) is establishing well and starting to ‘soften’ the earthworks; as such, the planting is currently considered to be on track to provide the landscape integration function for which it was intended.

Post Opening Project Evaluation A2/A282 Dartford Improvement & M25 Jn 1b - Jn 3 widening - Five Years After
179
Figure B.15: Before and After: Looking South from the Darent Valley Path towards the A2.
A2/ A282 Dartford Improvement Proof of Evidence for the Public Inquiry, Photograph 11 (c.2004)
FYA (July 2014)
Hawley Manor is just visible to the right of the photograph; views to the East towards the M25 J2 remain largely screened by Riverside vegetation (left).

Post Opening Project Evaluation A2/A282 Dartford Improvement & M25 Jn 1b - Jn 3 widening - Five Years After
180
Figure B.16: Before and After: Looking East from the Darent Valley Path.
A2/ A282 Dartford Improvement Proof of Evidence for the Public Inquiry, Photograph 12 (c.2004)
FYA (July 2014)

Post Opening Project Evaluation A2/A282 Dartford Improvement & M25 Jn 1b - Jn 3 widening - Five Years After
181
The reinforcement planting to the existing motorway embankment (centre right) appears to establishing well and combined with new planting on the environmental barriers (earth mounds) at the edge of Links A & D on the M25 J2 (left), there is no reason to suggest at this stage that the existing views from the Darent Valley Path will not be improved as intended by design year.
Figure B.17: Before and After: Looking South East from Footpath DR36 across open farmland.
A2/ A282 Dartford Improvement Proof of Evidence for the Public Inquiry, Photograph 13 (c.2004)
FYA (July 2014)

Post Opening Project Evaluation A2/A282 Dartford Improvement & M25 Jn 1b - Jn 3 widening - Five Years After
182
The environmental barriers in the form of false cuttings at the edge of Link A and Link D at the M25 J2 (centre and left) are substantially closer to Blackdale Farm Cottages than the pre-scheme situation, but generally obscure views of traffic as expected. The planting on the false cuttings is establishing well and subject to ongoing management and maintenance, is considered likely to screen views of traffic and disguise these earth works by design year. The A2, visible to the far right of the Proof of Evidence for the Public Inquiry photograph, is now almost completely screened by intervening vegetation.

Post Opening Project Evaluation A2/A282 Dartford Improvement & M25 Jn 1b - Jn 3 widening - Five Years After
183
Appendix C. Casualty analysis
Table 1. Number of Casualties by Severity in the Wider Area.
Time Period Number of Casualties by
Severity Total
From To Fatal Serious Slight
Before
Aug/2001 Jul/2002 4 20 223 247
254.6
Aug/2002 Jul/2003 1 24 215 240
Aug/2003 Jul/2004 2 14 266 282
Aug/2004 Jul/2005 1 15 243 259
Aug/2005 Jul/2006 3 23 219 245
Construction Aug/2006 Jul/2007 3 21 231 255
262.5 Aug/2007 Jul/2008 2 26 242 270
Without Scheme Counterfactual (adjusted for background reduction)39 207.5
After
Aug/2008 Jul/2009 3 8 222 233
232.2
Aug/2009 Jul/2010 1 20 225 246
Aug/2010 Jul/2011 3 18 235 256
Aug/2011 Jul/2012 2 4 211 217
Aug/2012 Jul/2013 0 11 198 209
Figure 1. Number of Casualties on Year by Year Basis for Wider Area
39 Background factor in collision numbers for South East 2004-2011 was 0.815
0
50
100
150
200
250
300
Au
g-2
001 t
o J
ul-
2002
Au
g-2
002 t
o J
ul-
2003
Au
g-2
003 t
o J
ul-
2004
Au
g-2
004 t
o J
ul-
2005
Au
g-2
005 t
o J
ul-
2006
Au
g-2
006 t
o J
ul-
2007
Au
g-2
007 t
o J
ul-
2008
Au
g-2
008 t
o J
ul-
2009
Au
g-2
009 t
o J
ul-
2010
Au
g-2
010 t
o J
ul-
2011
Au
g-2
011 t
o J
ul-
2012
Au
g-2
012 t
o J
ul-
2013
Nu
mb
er
ofC
asu
alt
iess p
er
Year
Fatal Serious Slight
BeforeConstruction
PeriodPost-Opening

Post Opening Project Evaluation A2/A282 Dartford Improvement & M25 Jn 1b - Jn 3 widening - Five Years After
184
Table 2. Number of Casualties by Severity in the A2/A282 scheme area
Time Period Number of Casualties by
Severity Total
From To Fatal Serious Slight
Before
Aug/2001 Jul/2002 1 5 67 73
73.0 Aug/2002 Jul/2003 0 7 48 55
Aug/2003 Jul/2004 0 2 58 60 Aug/2004 Jul/2005 0 2 101 103
Aug/2005 Jul/2006 2 2 70 74
Construction The construction period has not been included here as it overlapped with the
construction period for the M25 Jn 1b – Jn 3 widening scheme
Without Scheme Counterfactual (adjusted for background reduction)40 59.5
After
Aug/2008 Jul/2009 0 0 51 51
50.4
Aug/2009 Jul/2010 0 4 59 63
Aug/2010 Jul/2011 0 0 51 51 Aug/2011 Jul/2012 1 1 39 41
Aug/2012 Jul/2013 0 4 42 46 Figure 2. Number of Casualties on Year by Year Basis for A2/A282 scheme area
40 Background factor in collision numbers for South East 2004-2011 was 0.815
0
20
40
60
80
100
120
Au
g-2
001 t
o J
ul-
2002
Au
g-2
002 t
o J
ul-
2003
Au
g-2
003 t
o J
ul-
2004
Au
g-2
004 t
o J
ul-
2005
Au
g-2
005 t
o J
ul-
2006
Au
g-2
008 t
o J
ul-
2009
Au
g-2
009 t
o J
ul-
2010
Au
g-2
010 t
o J
ul-
2011
Au
g-2
011 t
o J
ul-
2012
Au
g-2
012 t
o J
ul-
2013
Nu
mb
er
ofC
asu
alt
iess p
er
Year
Fatal Serious Slight
Before Post-Opening
Co
nstr
ucti
on
Peri
od

Post Opening Project Evaluation A2/A282 Dartford Improvement & M25 Jn 1b - Jn 3 widening - Five Years After
185
Table 3. Number of Casualties by Severity in the M25 Jn 1b – Jn 3 scheme area
Time Period Number of Casualties by
Severity Total
From To Fatal Serious Slight
Before
Aug/2001 Jul/2002 1 4 42 47
60.8
Aug/2002 Jul/2003 1 9 59 69 Aug/2003 Jul/2004 0 3 83 86
Aug/2004 Jul/2005 0 2 42 44 Aug/2005 Jul/2006 1 6 51 58
Construction The construction period has not been included here as it overlapped with the
construction period for the M25 Jn 1b – Jn 3 widening scheme 49.6
Without Scheme Counterfactual (adjusted for background reduction)41
After
Aug/2008 Jul/2009 1 3 48 52
57.8
Aug/2009 Jul/2010 1 9 55 65
Aug/2010 Jul/2011 0 1 60 61 Aug/2011 Jul/2012 0 1 71 72
Aug/2012 Jul/2013 0 1 38 39 Figure 3. Number of Casualties on Year by Year Basis for M25 Jn 1b – Jn 3 scheme area
41 Background factor in collision numbers for South East 2004-2011 was 0.815
0
10
20
30
40
50
60
70
80
90
100
Au
g-2
001 t
o J
ul-
2002
Au
g-2
002 t
o J
ul-
2003
Au
g-2
003 t
o J
ul-
2004
Au
g-2
004 t
o J
ul-
2005
Au
g-2
005 t
o J
ul-
2006
Au
g-2
008 t
o J
ul-
2009
Au
g-2
009 t
o J
ul-
2010
Au
g-2
010 t
o J
ul-
2011
Au
g-2
011 t
o J
ul-
2012
Au
g-2
012 t
o J
ul-
2013
Nu
mb
er
ofC
asu
alt
iess p
er
Year
Fatal Serious Slight
Before Post-Opening

Post Opening Project Evaluation A2/A282 Dartford Improvement & M25 Jn 1b - Jn 3 widening - Five Years After
186
Appendix D. Glossary
Term Definition
Accessibility Accessibility can be defined as ‘ease of reaching’. The accessibility objective is concerned with increasing the ability with which people in different locations, and with differing availability of transport, can reach different types of facility.
ADT, AADT Average Daily Traffic, Annual Average Daily Traffic. Average of 24 hour flows, seven days a week.
AM denoting the morning peak period
AONB Area of Outstanding Natural Beauty
AQMA Air Quality Management Area Area subject to monitoring by the local authority because national air quality objectives are at risk from not being achieved.
AST Appraisal Summary Table. This records the impacts of the scheme according to the Government’s five key objects for transport, as defined in DfT guidance contained on its Transport Analysis Guidance web pages, WebTAG
ATC Automatic Traffic Count, a machine which measures traffic flow at a point in the road.
AWT, AAWT Average Weekday Traffic, Annual Average Weekday Traffic. As ADT but for five days, (Monday to Friday) only.
BC Borough Council
BCR Benefit Cost Ratio
CC County Council
CEMP Construction Environment Management Plan
CO Carbon Monoxide
CO2 Carbon Dioxide, for transport, this is the main greenhouse gas
COBA Cost Benefit Analysis – a computer program which compares the costs of providing road schemes with the benefits derived by road users (in terms of time, vehicle operating costs and accidents), and expresses the results in terms of a monetary valuation. The COBA model uses the fixed trip matrix unless it is being used in Accident-only mode.
Controlled Motorway
Motorway with an automatic speed-control environment, based on MIDAS, which uses of mandatory speed limit signals rather than advisory speed limits displayed on traditional motorway signals
dB(A) dB or decibel is the unit used for the measurement of sound on a logarithmic scale. (A) is the weighting applied to the decibel unit to represent the frequency response of the human ear.
DfT Department for Transport
Discounting Discounting is a technique used to compare costs and benefits that occur in different time periods and is the process of adjusting future cash flows to their present values to reflect the time value of money, e.g. £1 worth of benefits now is worth more than £1 in the future. A standard base year needs to be used which is 2002 for the appraisal used in this report.
Discount Rate The percentage rate applied to cash flows to enable comparisons to be made between payments made at different times. The rate quantifies the extent to which a sum of money is worth more to the Government today than the same amount in a year's time.
DMRB Design Manual for Roads and Bridges
Do Minimum (DM)
In scheme modelling, this is the scenario which comprises the existing road network plus improvement schemes that have already been committed.
Do Something (DS)
In scheme modelling, this is the scenario detailing the planned scheme plus improvement schemes that have already been committed
EA Environment Agency
EAR Economic Assessment Report
EH English Heritage
EN English Nature
ERT Emergency Roadside Telephone

Post Opening Project Evaluation A2/A282 Dartford Improvement & M25 Jn 1b - Jn 3 widening - Five Years After
187
Term Definition
ES Environmental Statement. This must be submitted with the initial planning application and covers all potential significant impacts that the road project may have.
EST Evaluation Summary Table. In POPE studies, this is a summary of the evaluations of the TAG objectives using a similar format to the forecasts in the AST.
FYA Five Years After
HEMP Handover Environmental Management Plan
HER Historic Environment Record
HGV Heavy Goods Vehicle.
High Growth / Low Growth
Within traffic modelling, these define the growth assumptions to be applied to traffic, economic and fuel costs.
IP Inter Peak, the time between the AM and PM peaks
KSI Killed or Seriously Injured. KSI measurement is the proportion of casualties who are killed or seriously injured and is used as a measure of accident severity
LEAP Landscape and Ecology Aftercare Plan
LGV Light Goods Vehicle
LTP Local Transport Plan. These set out each authority's local transport strategies and policies, and include an implementation programme.
MAC Managing Agent Contractor – organisation normally contracted in 5-year terms for undertaking the management of the road network within a Highways England area.
NATA New Approach To Appraisal Used for transport scheme appraisal since 1998.
NB northbound
NE Natural England
NMU Non-Motorised User. A generic term covering pedestrians, cyclists and equestrians
NO2 Nitrogen Dioxide
NRTF National Road Traffic Forecast. This document defines the latest forecasts produced by the Department of the Environment, Transport and the Regions of the growth in the volume of motor traffic. At the time this scheme was appraised, the most recent one was NRTF97, i.e. dating from 1997.
NTS Non-technical Summary of the Environmental Statement Describes the Published Scheme proposals and summarises the Environmental Statement in non-technical language.
OPR Order Publication Report
OYA One Year After
PIA/mvkm PIA/mvkm is the number of PIAs per million vehicle kilometres where ‘vehicle kilometres’ are the number of vehicles using a section of the road multiplied by the length of the road.
PM evening peak period
PM10 Particulate Matter measuring less than 10µm. This is the generally accepted measure of particulate material in the atmosphere likely to be inhaled by humans
POPE Post Opening Project Evaluation, before & after monitoring of all major highway schemes in England.
PROW Public Right of Way
PVB Present Value Benefits Value of a stream of Benefits accruing over the appraisal period of a scheme expressed in the value of a single ‘present’ year. For this scheme this is 2002.
PVC Present Value Cost As for PVB, but for a stream of costs
QUADRO Queues And Delays at Roadworks. Modelling software which is used to identify the economic impacts of construction and maintenance
Reassignment This is where traffic travelling between A and B has transferred to an alternative route between A and B.
RPG Regional Planning Guidance

Post Opening Project Evaluation A2/A282 Dartford Improvement & M25 Jn 1b - Jn 3 widening - Five Years After
188
Term Definition
RSS Regional Spatial Strategy. The RSS sets out a strategy to guide planning and development in an area. It covers economic development, housing, the environment, transport, waste management, culture, sport and recreation, mineral extraction and implementation.
RTS Regional Transport Strategy. The RTS is the regional framework that outlines the investment programme of local authorities and other key stakeholders, and aims to support the wider regional objectives of delivering a more sustainable pattern of development. This is included within the RSS.
SAC Special Area of Conservation, a protected site designated under the EC Habitats Directive.
SAR Scheme Assessment Report is produced during the scheme appraisal in accordance with DMRB guidance
Screenline An imaginary line drawn across a transport corridor used to determine flows between areas on either side. Each road crossed by the screenline is monitored by a traffic count (ATC).
Seasonality Seasonality is the variation in traffic behaviour across the year due to varying daylight levels, weather conditions, school holidays, etc.
Severance Community severance is the separation of adjacent areas by road or heavy traffic, causing negative impact on non-motorised users, particularly pedestrians.
SINC Site of Importance for Nature Conservation. A conservation designation awarded by local authorities to an area as being of local conservation interest.
SLA Special Landscape Area Non-statutory designation in a Local Plan.
SMR Sites and Monuments Record. A list of known archaeological sites maintained by the local authority.
SSSI Site of Special Scientific Interest
STATS19 A database of injury accident statistics recorded by police officers attending accidents
TAG Transport Analysis Guidance, as defined in WebTAG.
TAME Traffic Appraisal, Monitoring and Evaluation
TEE Transport Economic Efficiency
TEMPRO Trip End Model Program. This is a PC program which provides access to the Department for Transport’s national Trip End Model projections of growth in travel demand, and the underlying car ownership and planning data projections.
TPO Tree Preservation Orders
TRADS Highways EnglandTraffic Flow Data System
TUBA Transport Users Benefit Analysis. A computer system issued and maintained by Highways England. The program calculates the costs and benefits that would accrue to users of a transport system, companies, national and local government as a result of making improvements to a transport network.
Turning Movements
The movements of vehicles at a road junction or through a road network.
Vehicle hours Vehicle hours refers to the total time spent by all vehicles using a road and is expressed normally as a yearly value. For example, if 10,000 vehicles a day used a route with a 6 minute journey time, then the route’s vehicle hours for the year would be 365,000.
VOC Vehicle Operating Costs
webTAG Department for Transport’s website for guidance on the conduct of transport studies at http://www.webtag.org.uk/

Post Opening Project Evaluation A2/A282 Dartford Improvement & M25 Jn 1b - Jn 3 widening - Five Years After
189
Appendix E. Tables and Figures in this Report
Tables Table 2-1 FYA turning movements at the A2/A282 junction compared to ‘before’ 31
Table 2-2 Average Journey Times on M25 Jn 2 – Jn 3 and A2 either side of A2/A282 junction 33
Table 2-3 HGV% on AWT 46
Table 2-4 Comparison of Do-Minimum AADT forecasts with counterfactual 49
Table 2-5 Comparison of Do-Something forecasts with FYA AADTs 50
Table 2-6 Comparison of Do-Minimum AADT forecasts with counterfactual 52
Table 2-7 Comparison of Do-Something forecasts with FYA AADTs 52
Table 2-8 Forecast vs. Observed Change in Route Stress 59
Table 3-1 Number of Collisions by Severity in the Wider Area 68
Table 3-2 Number of Collisions by Severity in the A2/A282 scheme area 70
Table 3-3 Number of Collisions by Severity in the M25 Jn 1b – Jn 3 widening scheme area 71
Table 3-4 Statistical significance of changes in collisions 73
Table 3-5 Observed Collision Rates (PIC/mvkm) for Key Links 73
Table 3-6 Collision Severity Index by study area 74
Table 3-7 Summary of change in casualty numbers alongside change in collision numbers 74
Table 3-8 FWI on the key links 75
Table 3-9 Comparison of ‘before’ and ‘after’ Contributory Factors 79
Table 3-10 Comparison of Forecast and Outturn Net Collision number changes 81
Table 4-1 Forecast Costs and Benefits for A2/A282 scheme (Link E deferred indefinitely) 90
Table 4-2 Forecast Costs and benefits for M25 scheme (Link E deferred scenario) 91
Table 4-3 Summary of the outturn TEE Benefits from PAR method 92
Table 4-4 Summary of the Forecast Safety Benefits 94
Table 4-5 Outturn Monetised Safety Benefits 94
Table 4-6 Investment Costs in 2002 prices 95
Table 4-7 Forecast and Outturn BCR (A2/A282 scheme) 97
Table 4-8 Forecast and Outturn BCR (M25 scheme) 97
Table 4-9 Combined Schemes’ BCR 98
Table 5-1 Summary of Environmental Consultation Responses 105
Table 5-2 Existing, Opening and Design Years for the A2/ A282 and M25 J1b-3 Schemes. 106
Table 5-3 A2/ A282: Comparison of Do-Something forecasts with FYA AADTs 106
Table 5-4 A2/ A282: HGV% of AWT 107
Table 5-5 A2/ A282: Average A2 speeds (kph) 107
Table 5-6 M25 J1b-3: Comparison of Do-Something forecasts with FYA AADTs 107
Table 5-7 M25 J1b-3: Average M25 Speeds (kph) 108
Table 5-8 A2/ A282 Evaluation Summary: Noise 112
Table 5-9 M25 J1b-3 Evaluation Summary: Noise 112
Table 5-10 M25 J1b-3: Comparison of Modelled and Monitored NO2 Results in 2010 µg/m3 113
Table 5-11 A2/ A282: Annual mean NO2 concentrations measured at sites in Dartford, µg/m3 114
Table 5-12 A2/ A282 Evaluation Summary: Local Air Quality 115
Table 5-13 M25 J1b-3 Evaluation Summary: Local Air Quality 115
Table 5-14 Summary of Greenhouse Gases Evaluation – A2/A282 scheme 116
Table 5-15 Summary of Greenhouse Gases Evaluation – M25 Jn 1b – Jn 3 scheme 117
Table 5-16 A2/ A282 Evaluation Summary: Landscape 121
Table 5-17 M25 J1b-3 Evaluation Summary: Landscape 121
Post Opening Project Evaluation A2/A282 Dartford Improvement & M25 Jn 1b - Jn 3 widening - Five Years After
190
Table 5-18 A2/ A282 Evaluation Summary: Townscape 123
Table 5-19 M25 J1b-3 Evaluation Summary: Townscape 123
Table 5-20 A2/ A282 Evaluation Summary: Heritage 125
Table 5-21 M25 J1b-3 Evaluation Summary: Heritage 125
Table 5-22 A2/ A282 Evaluation Summary: Biodiversity 128
Table 5-23 M25 J1b-3 Evaluation Summary: Biodiversity 128
Table 5-24 A2/ A282 Evaluation Summary: Water Quality and Drainage 131
Table 5-25 M25 J1b-3 Evaluation Summary: Water Quality and Drainage 131
Table 5-26 A2/ A282 Evaluation Summary: Physical Fitness 134
Table 5-27 M25 J1b-3 Evaluation Summary: Physical Fitness 134
Table 5-28 A2/ A282 Evaluation Summary: Journey Ambience 137
Table 5-29 M25 J1b-3 Evaluation Summary: Journey Ambience 137
Table 6-1 Assessment of Schemes’ Alignment with National, Regional and Local Policy 144
Table 7-1 Appraisal Summary Table: A2/A282 Dartford Improvement 148
Table 7-2 Appraisal Summary Table: M25 J1b – 3 widening (2006) 149
Table 7-3 Evaluation Summary Table: A2/A282 Dartford Improvement (2014) 150
Table 7-4 Evaluation Summary Table: M25 J1b – 3 widening (2014) 151
Table 8-1 Success against scheme objectives: A2/A282 Dartford Improvement 152
Table 8-2 Success against scheme objectives: M25 Jn 1b – 3 Widening 153
Figures
Figure 1-1 Regional Context of the Schemes 8
Figure 1-2 Key elements of A2/A282 Dartford Improvement scheme 10
Figure 1-3 Key elements of M25 Jn 1b – Jn 3 widening scheme 12
Figure 1-4 History of the two schemes 16
Figure 1-5 Other nearby major schemes 17
Figure 2-1 Nationally Observed Trends by Road Type 21
Figure 2-2 Regionally and Locally Observed Trends 22
Figure 2-3 Long term trends in AWT on A2 23
Figure 2-4 Long term trends in AWT on M25 24
Figure 2-5 12hr flows at A2/A282 (M25 Jn 2) 26
Figure 2-6 12hr flows around the scheme area 27
Figure 2-7 24hr AWTs on Local Roads 29
Figure 2-8 Average journey times by hour: M25 Jn 2 - Jn 3 Northbound 34
Figure 2-9 Average journey times by hour: M25 Jn 2 - Jn 3 Southbound 35
Figure 2-10 Average journey times by hour: A2 east of A282 (M25 Jn 2) Eastbound 37
Figure 2-11 Average journey times by hour: A2 east of A282 (M25 Jn 2) Westbound 38
Figure 2-12 Average journey times by hour: A2 west of A282 (M25 Jn 2) Eastbound 39
Figure 2-13 Average journey times by hour: A2 west of A282 (M25 Jn 2) Westbound 40
Figure 2-14 Route 1: A2 westbound to M25 N/B using new free flow link road - 2.3km 42
Figure 2-15 Route 2: A2 westbound to M25 S/B using segregated slip lane 2.4km 42
Figure 2-16 Route 3: A2 eastbound to M25 N/B using circulatory – 1.4km 43
Figure 2-17 Route 4: A2 eastbound to M25 S/B using circulatory – 1.8km 43
Figure 2-18 Route 5: M25/A282 southbound to A2 E/B using new free flow link – 2.2km 44
Figure 2-19 Route 6: A282 southbound to A2 W/B using circulatory – 1.7km 44
Figure 2-20 Route 7: M25 northbound to A2 E/B using circulatory – 2.6km 45
Figure 2-21 Percentage Change Comparison (Forecast vs. Observed) 51
Figure 2-22 Percentage Change Comparison (Forecast vs. Observed) 53
Figure 2-23 Standard Deviation of Average Journey Times (A2 east of M25 Jn 2 - Eastbound) 55

Post Opening Project Evaluation A2/A282 Dartford Improvement & M25 Jn 1b - Jn 3 widening - Five Years After
191
Figure 2-24 Standard Deviation of Average Journey Times (A2 east of M25 Jn 2 - Westbound) 56
Figure 2-25 Standard Deviation of Average Journey Times (A2 west of M25 Jn 2 - Eastbound) 57
Figure 2-26 Standard Deviation of Average Journey Times (A2 west of M25 Jn 2 - Westbound) 58
Figure 2-27 Standard Deviation of Average Journey Times (M25 Jn 2 – Jn 3 Northbound) 61
Figure 2-28 Standard Deviation of Average Journey Times (M25 Jn 2 – Jn 3 Southbound) 62
Figure 3-1 Collision Study Areas 67
Figure 3-2 Number of Collisions on Year by Year Basis for Wider Area 69
Figure 3-3 Number of Collisions on Year by Year Basis for A2/A282 Scheme Area 70
Figure 3-4 Number of Collisions on Year by Year Basis for M25 Jn 1b – Jn 3 scheme area 72
Figure 3-5 Collisions at A2/A282 junction (Five years before construction) 76
Figure 3-6 Collisions at A2/A282 junction (Five years after opening) 77
Figure 3-7 Faded Markings at A2/A282 Junction 82
Figure 3-8 Poor Visibility to Sign Gantry at A2/A282 Junction 83
Figure 3-9 Blocked Gully at Wood Lane Overbridge on the A2 Eastbound 83
Figure 3-10 CCTV image from trafficengland.com website 85
Figure 3-11 CCTV at Junction 2 Circulatory 86
Figure 3-12 ERTs on M25 Junctions 2-3 86
Figure 5-1 Instances of varying plant vigour within the planting plots flanking the A282 southbound exit
slip road to the M25 J2. 120
Figure 5-2 Typical planting plots adjacent to the A2 eastbound entry slip road southwest of Gore Farm
Cottages (left), and on the false cutting of the A282 northbound entry slip road, directly
east of Blackdale Farm Cottages (right). 121
Figure 5-3 New hard landscaping under the Littledale viaduct, with the new A2 eastbound entry slip
road clearly visible to the upper left of the picture. 123
Figure 5-4 The A2 as seen from the Wood Lane overbridge, illustrating a partially blocked highway
drain on the eastbound carriageway (left), and silt build-up adjacent to the central
concrete barrier on the westbound carriageway (right) 130
Figure 5-5 Footpath DR26 as seen from Blackdale Farm Cottages, west of the realigned A282
northbound entry-slip road (from J2) and the A2 eastbound/ A282 northbound link 132
Figure 5-6 The photograph on the left is looking south towards the Yew Tree overbridge along Footpath
DR39 at the point where the Illustrative Environmental Design Plans indicate that the
footpath should turn right (through the fence) to meet Footpath DR49. The photograph on
the right is looking north towards the Hawley Road underpass from the new section of
Footpath DR39. 133
Figure 5-7 The (M2) Canterbury A2 ADS recommended for removal by the RSA-4, seen looking north
from the B260 overbridge (left), and when travelling adjacent to the A282 exit-slip road
leading to the J2 roundabout (right). 135
Figure 5-8 Typical examples of the faded road markings at the M25 Junction 2 roundabout; yellow box
markings (left), and directional/ lane markings (right). 136
Figure 6-1 Relocated stile on footpath DR36 142