aalborg universitet bosaso harbour burcharth, hans falk...
TRANSCRIPT

Aalborg Universitet
Bosaso Harbour
Burcharth, Hans Falk; Toschi, P.B; Turrio, E.; Balestra, T.; Noli, A.; Franco, L.; Betti, A.;Mezzedimi, S.Published in:Third International Conference on Coastal and Port Engineering in Developing Countries, Mombasa, Kenya,September 16-20, 1991
Publication date:1991
Document VersionAccepted author manuscript, peer reviewed version
Link to publication from Aalborg University
Citation for published version (APA):Burcharth, H. F., Toschi, P. B., Turrio, E., Balestra, T., Noli, A., Franco, L., ... Mezzedimi, S. (1991). BosasoHarbour: a new hot-climate port development. In Third International Conference on Coastal and PortEngineering in Developing Countries, Mombasa, Kenya, September 16-20, 1991 (pp. 649-666)
General rightsCopyright and moral rights for the publications made accessible in the public portal are retained by the authors and/or other copyright ownersand it is a condition of accessing publications that users recognise and abide by the legal requirements associated with these rights.
? Users may download and print one copy of any publication from the public portal for the purpose of private study or research. ? You may not further distribute the material or use it for any profit-making activity or commercial gain ? You may freely distribute the URL identifying the publication in the public portal ?
Take down policyIf you believe that this document breaches copyright please contact us at [email protected] providing details, and we will remove access tothe work immediately and investigate your claim.
Downloaded from vbn.aau.dk on: juni 29, 2018

H.F. Burcharth et al.
BOSASO HARBOUR, SOMALIA
A new hotclimate port development
May 1991

L
Third International Conference on Coastal & Port Engineering in Developing Countries
COPEDEC Ill, Mombasa, Kenya: 16-20th September 1991
H.F. Burcharth et al.
BOSASO HARBOUR, SOMALIA
A new hotclimate port development
May 1991

BOSASO HARBOUR, SOMALIA
A NEW HOT-CLIMATE PORT DEVELOPMENT
by
H.F. Burcharth 1 P.B. Toschi 2 E. Turrio 3 T. Balestra 4
A. Noli 5 L. Franco 6 A. Betti 7 S. Mezzedimi 8
1. INTRODUCTION
The paper deals with some design and construction aspects related to the new port at Bosaso, which is the terminal of the newly completed road system which connects northern Somalia with Mogadishu in the south, Fig. 1. The port and the road project was financed by The
Ministry of Foreign Affairs, Funding Agency for Developing Contries, Italy. The basic design and supervision of the work were performed by TECHINT, Milano, with the supervision of CESEN, Genoa. The construction of the port was performed by SACES, Rome, with COSMEZZ Costruzioni, Rome, as subcontractor.
Infrastructure studies resulted in a design programme for a harbour to accommodate one 6,000 DWT general cargo/Ro-Ro vessel and a number of smaller cargo vessels (dhows) and fishing boats.
AFRICA
' ,.--" /
,' I I I I I I I
ARABIA
0
Fig. 1. Position of port of Bosaso with new road (dotted line).
1 Professor of Marine Civil Engineering, University of Aalborg, Denmark (Consultant to TECHINT) 2Technical director, TECHINT, Milano 3 Project manager, TECHINT, Milano 4 Consulting eng. TECON, Milano (Consultant to TECHINT) 5 Professor of Maritime Structures, University of Rome (Consultant to SACES) 6 Professor of Coastal Engineering, Politecnico Milano (Consultant to SACES) 7 Director SACES, Rome 8 Director COSMEZZ Costruzioni, Rome
1

2. ENVIRONME NTAL CONDITIONS
Fig. 2 shows the most relevant environmental conditions.
Wave s l a lis lics al Bm depth Bore H~ m
2
10 Sand - i ravel
8 Hard limest on e
6
4
2
0
0 .00 1 0 .01 0 . 1 I 0 I 00 7.
I , I I '
N - 10 I /
Tidal r ange: , ," ~ -- .... , ) MHHW +0.2m ',,, \ 1
MHW -0.2m \ / MTL -o.am ,, ..... _ ......... , ',, _./
' MLW -1 .3m ',, \ \ MLWS - l.Bm {C .D.) ',, __ _-' \
/ --/
/ /
,. ..... ------'
\
'
' ' ', /
/ /
1 I
I
~ - -
/ _ .. -" \
' Bore hole 2
---------,
~+2
' ' '
- -, I
I I
Coral reef ',, ' I ---- ' I
..... __ ,
',
\ I I I I
', ---
.... __ _________ _________________ -
-...-------c:==---
0 100 200 m
+
/ - -
h o le
.
1 Bo r e
Sa n d - &ravel
Soft lime ston e
Hard limestone
/
I I
I I
' ' ' '
h ole
/ I
/
/ /
/
2
__ , ' I
- 2 ------
TOWN OF BOSASO ~
Fig. !2. Environmental conditions at Bosaso .
The area is dominated by monsoon winds. During the winter season the northeast monsoon dominates. Wind speeds exceed 9 m/s in 14% of the time in January and northeast is the prevailing direction. During the summer season the southerly monsoon winds predominate. Tropical cyclones are rare. The 100 year return period storm is estimated to contain 3 hours average wind speeds larger than 30 m/s.
As seen from the figure northeast and north waves dominate the area. The 1 year and the 100 year return period significant wave heights, s; and H;00
, are estimated to exceed 3.0 m and
5.5 m, respectively, in 8m water depth. The dominant range of spectral peak periods for H3
larger than 3 m is 7 - 12 s.
2
As to the current, the depth averaged velocities of tidal , wind drift, and geost rophic components in 6 m chart depth are 0.7 m/sand 0.9 m/s for 1 year and 100 year return periods , respectively. The wave generated currents, which are important in the shallow water, might reach 1.5 m/ s within the surf zone during heavy seas.
The sediment seaward of the coral reefs where most of the sediment transport takes place has
a mean diameter of a pp. 0.5 mm and a density of 2. 77 g/ cm3 . Based on the assumption of a sandcovered sea bed the annuallongshore sediment transport capacity is estimated to 140,000 m3/year using the method described in Deigaard et al., 1986. However, the actual transport is estimated to be approximately 70,000 m3 /year. This is due to the large surface roughness of the seaward slope of the coral reef on which a large portion of the wave breaking will take place and which will consequently be the area of larger wave generated longshore currents. This estimate is supported by observed wide gradations in the sediment samples and by the information from local people that no significant seasonal changes of the coastline occur. The dominant direction of sediment transport is from ENE towards WSW, but the relatively rare severe storms from westerly directions can create transport the opposite way.
3. LAY-OUT OF THE HARBOUR
The first proposal considered was an unprotected pile-supported pier for berthing of two 3,000 DWT fully loaded vessels (or 5,000 DWT partly loaded vessels) plus sambuchies (dhows) of
app. 500 DWT and fishing boats. The pier extended some 600 m from the coast line in order to reach the necessary undredged water depth. Based on further investigations of the meteomarine conditions it was concluded that the operational down-time would be unacceptable and the necessary high deck level unconvenient for the handling of the smaller vessels.
Further studies resulted in a design programme for a harbour with a first phase capacity corresponding to simultaneous accommodation of one 6,000 DWT general cargo/ Ro-Ro vessel and a number of sambuchies and fishing boats.
Because some limited down-time was acceptable, it was not necessary to design a fully protected basin. Due to prevailing waves from the N-NE sector it was obvious to place a breakwater on the northeast reef and establish berths in a dredged basin behind the reef with access through a dredged channel situated between the two reefs indicated in Fig. 2.
In order to optimize the design several lay-outs were investigated in physical wave disturbance models with moored ships at DHI, Danish Hydraulic Institute, Denmark, as well as in the real-time ship manoeuvring simulator at CETEN A, Italy.
Because no tug-boat assistance was planned to be available for berthing operations there was a demand for good manoeuvring space with the Ro-Ro quay situated conveniently for prevailing winds including easy and safe departure possibilities of the vessels in case of sudden storms.
Fig. 3 shows the final lay-out with the Ro-Ro quay situated along the breakwater.
3

-10
' ' \
\ \
\
---
I'
~- ...... ' t
I _,., .- - -1 , ,
; - - - ' I ' I
\ I \ I
' I \ I ' .... _,
I
I I
I
, __
; "' ___ _ _
Reclaimed area (fill from dredging)
0 100 200m
I I
' I
' , , \
I I
-10
/ /
/ -6
N
I
Fishing harbour
Fig. 3. Final lay-out of port of Bosaso. Bed levels refer to a zero between MHHW and MHW, cf. Fig. 2.
Other lay-outs with the Ro-Ro quay and the fishing harbour placed on the land side giving easier landward access were rejected due to too large ship movements and/or unacceptable manoeuvring conditions. Some experience related to these points is presented in the following
sections on wave disturbance tests and manoeuvring simulations.
The orientation of the access channel was chosen as a compromise between a more northerly
direction involving less dredging and a more westerly direction giving easier access for the larger
vessels due to less turning when reducing speed for berthing.
In order to reduce the frequency of the maintenance dredging in the access channel, a 60,000 m3
holding capacity sand pit was established by a one meter overdredging to level -9.8 m along
the eastward edge of the channel. Hopefully, this reservoir will catch most of the westward
sediment transport estimated to be 70,000 m3 per year .
A cutter section dredge with a 3,000 HP cutter-head performed the dredging in sand, soft and hard limestone, cd. Fig. 2. showing two typical bore holes among the 18 driven in the area.
4. SHIP MANOEUVRING SIMULATIONS
The purpose of the numerical real time manoeuvring simulations at CETEN A was to evaluate
the manoeuvring conditions for alternative lay-outs including the access channel.
4

The simulations proved the necessity of the relatively large width of 240 m for the "single ship
passage" access channel (app. 12 x beam or app. 2.2 x length of max. ship size). The steering of the large vessels is significantly affected by the cross currents which were estimated to be 1.5-2 knots (0.7-1.0 m/s) with an average occurrence of 35 days per year. Cross currents larger than 3 knots only occur few hours per year. The blocking effect of the breakwater creates a concentration of the WSW directed current in a narrow zone along the seaward side of the breakwater which causes rapid changes in the cross current over small distances.
Fig. 4 shows examples of manoeuvring simulations for two alternative lay-outs, A and C, where a twin screw/one rudder 5,700 t displacement. Ro-Ro vessel in ballast conditions tries to berth under given wind-wave-current conditions. Lay-out A was rejected due to the high risk of collision with either the head of the breakwater or the north end of the Ro-Ro berth. Also berthing in medium to stronger W-SW winds and departures during the prevailing strong monsoon winds from the eastern sector would be very difficult.
N Layout A
\ Wind from SW 15 m/s Current: to EKE 2 knots Waves none
·~ .. ,
N Layout C
Wind from E~E 15 m/s Current : to WSW 3 knots Waves NE, H s =2.5 m, Ts =8 sec
Fig. 4. Examples of manoeuvring simulations.
5

In general it was concluded that, considering the normal variation in manoeuvrability of general cargo and Ro-Ro vessels, some tug-boat assistance will be necessary when winds exceed 10 m/s and cross currents exceed 2 knots, if normal risk levels should be obtained. Such conditions occur approximately 1 - 1 ~ month per year.
5. CRITERIA FOR MOVEMENTS OF MOORED SHIPS
As the basis for the evaluation of the down-time for the various lay-out proposals two sets of criteria for acceptable movements were formulated, namely criteria for safe mooring of the vessels (Table 1) and criteria for operation (loading and unloading) of the vessels (Table 2). The movements considered are surge, sway, heave, pitch, roll, and yaw, cf. Fig. 5. Besides this also the transverse movement aft was studied for Ro-Ro vessels using stern ramps.
Heave
Sway
Fig. 5. The six components of ship movements.
The criteria given in Table 1 and 2 are not valid in the case of long period movements (as for example response to seiches) but are only valid for response to wind generated waves and swell. Seiching is not expected in Bosaso harbour and was not observed in the physical model tests.
The values given in Table 1 assume that appropriate fenders are provided along the berths.
Table 1. Maximum movements (peak to peak values) for safe mooring.
Type of vessel Surge Sway Heave Yaw Pitch Roll m m m de g. de g. de g.
Fishing and cargo vessels Loa 15-40 m 1.3 1.5 0.8 6 5 10
Freighters 1,000-3,000 DWT and Ro-Ro ships 1.5 1.5 1.2 4 3 6 up to 5,000 DWT
Max velocities Surge Sway Heave Yaw Pitch Roll for freighters m m m de g. de g. de g. and Ro-Ro ships
1,000 DWT 0.6 m/s 0.6 mjs 2 deg.js 2 deg./s 2,000 DWT 0.4 m/s 0.4 m/s 1.5 deg.fs 1.5 deg./s 5,000 DWT 0.3 m/s 0.3 mjs 1.0 deg./s 1.0 deg./s
6

Table 2. Maximum movements (peak to peak values) for loading and unloading of vessels.
Type of vessel Surge Sway Heave Yaw Pitch Roll m m m de g. de g. de g.
Fishing and cargo vessels Loa. 15-40 m 1.2 1.2 0.6 4 4 5 lift on/off operation
Freighters 1,000-3,000 DWT lift on/off operation with 1.5 •) 1.3 •) 0.8 •) 3 2 3 crane on vessel or on quay
Ro-Ro ships 2,000-5,000 DWT 0.6 **) 0.6 u) 0.6 1 1 2 u)
•) Handling of containers (lift on/off) demands much smaller values (up to 50% of the given figures dependent on the frequency .
.. ) A surge and sway of 0.6 m assumes that the ship uses a side ramp fitted with rollers. In case of bow or stern ramps other values must be adopted. The lirruting values are dependent on the width, the stiffnes and the design of the ramp. Ramps which are not too wide, say app. 6 meters, can be used in surge of 0.6-1.0 m and a roll of 4 deg. If equipped with long flaps even larger roll can be accepted.
The maximum velocity for safe operation should not exceed half of the values given in Table 1.
6. WAVE DISTURBANCE TESTS WITH MOORED SHIPS
The three-dimensional model at DHI was constructed to a linear scale of 1 : 45 with correctly reproduced sea bed topography. Four of the seven tested lay-outs are shown in Fig. 6.
The following items were investigated: Influence on vessel movements of lay-out , ship size, mooring system, breakwater length, water level, wave height -period -direction, dredging depth in the entrance area.
The fender system for the Ro-Ro berth corresponded to two cylindrical fenders (Bridgestone 800 x 400 mm, rubber grade Rr) with a length of 1.0 m each per 6 m.
Lay-out 1 gave unacceptable large movements especially roll and transversal movement aft at
the ramp for the Ro-Ro vessel, even for mild offshore sea states corresponding to H30 = 1 m where at the berth H 3 was only 0.3 m. The reason is that the moored ship is exposed to quarter seas (wave direction 45° relative to the quay front). The down-time exceeded 10%. The fishing harbour was very quiet with excellent mooring conditions.
In lay-out 2 the Ro-Ro berth is turned in order to avoid quarter seas. Thereby the situation improved considerably with respect to roll, sway, and pitch (reduced by app. 30%) and transversal movements aft (reduced by app. 50%) but only by 10% with respect to surge and yaw.
7

Layout 1 Layout 2
N
Fishing - - -'ri'i-t-harbour
---0
Final layout Revised final layout
Fig. 6. Examples of investigated lay-outs, depths refer to chart datum MLWS.
The effect of increasing the length of the breakwater was investigated. On an average, the movements decreased by 10% - 20% when the breakwater was extended by 15 m.
The various test series made it possible to estimate the exceedence frequencies for the vessel movements. Table 3 (from DHI's report) shows the results for a 3,200 DWT Ro-Ro vessel for two mooring systems M2 and M4 as shown in Fig. 7. The reduction in vessel movements at low water levels is taken into account.
M2
Mooring stiffness 16.7 t/m Pre-tension 5t
M4
Mooring stiffness 33.4 t/m Pre-tension 5t
Fig. 7. Example of investigated mooring systems m the physical model.
8

Table S. Exceedence frequencies in %for movements of S,£00 DWT Ro-Ro vessel, layout 2.
Exceedence of movement
Moor. Sys. M4
Moor. Sys. M2
Moor. Sys. M4 Moor. Sys. M2
Surge 0.6 m 1.0 m 1.5 m
5.2 2.2 1.5
9.7 4.6 2.3
Heave 0.6 m 0.8 m
2.1 0.8 2.1 0.8
Sway Transversal aft 0.6 m 1.3 m 0.6 m 1.3 m
0.2 0.3
0.3 6.0 0.5
Yaw Pitch Roll 10 30 10 20 2 0 3 0 4 0
0.2 0.1 13.5 8.0 2.7 2.5 - 0.1 12.2 7.6 2.5
It appears that the extra mooring in the stern and the larger stiffness of the moorings in system
M4 gave a rather large reduction of the exceedence percentages for the horizontal movements while the number for the vertical movements are almost unchanged. The test s showed that
winds up to 18 m/s have very little influence on the movements.
In order to reduce the downtime at the Ro-Ro berth it was decided to move this berth to
the more protected position on the land side of the breakwater . This involves larger costs
and a somewhat longer transport of the goods to the centre of the town. Two solutions were
investigated as shown in Fig. 6. In the first solution called the final lay-out the fishing harbour
was kept on the coastline in front of the town.
This solution was modified to the revised final lay-out, also shown in Fig. 3, by moving the
fishing harbour to a more protected location in the east corner of the port area. This was
done in order to reduce the cost of the rather exposed fishing harbour breakwater which is
almost unprotected against large north-west waves approaching through the dredged channel. A
shallow water sea bed in front of the breakwater to ensure wave breaking and thereby reduction
of the impact on the breakwater could not be established due to the need for manoeuvring space
for the larger cargo vessels. Also, the fishing harbour breakwater caused some reflection of north and north west waves into the Ro-Ro berth area which increased the movements of the moored
Ro-Ro vessels. Moreover, the surge movements in the fishing harbour were relatively large. The
exceedence frequency of the acceptable upper limit of 1.2 m was estimated to be approximately
3-10%, the larger value relates to the quay along the rear side of the breakwater and the smaller
value to the opposite quay. A 60 m tested prolongation of the breakwater would reduce the
surge movements by approximately 50%.
Compared to lay-out 2 the movements for the Ro-Ro vessel in the final and revised final lay-outs
were reduced somewhat, except for wave direction N. This is due to wave reflection from the
steep western edge of the dredged channel, as indicated in Fig. 8. This reflection caused the
largest ship movements at water depths corresponding to mean water level. The reflection and,
consequently, also the movements were smaller at higher water levels.
9

\ , I
I
' ,, \
.... __ / I I
Fig. 8. Reflection of waves from north into the harbour.
The revised final lay-out was tested with a larger Ro-Ro vessel of 7,300 t displacement. The · exceedence frequencies for movements are shown in Table 4 (from DHI's report).
Table 4. Exceedence frequ encies for movements of 7,300 t displacement vessel. Stiffness of mooring lines 4 0 tjm.
Movement Surge Sway Transversal aft 0.6 m 1.0 m 1.5 m 0.6 m 1.3 m 0.6 m 1.3 m
Exc. freq. (%) 3.0 0.8 0.2 0.5 < 0.1 7.5 2.5
Heave aft Yaw Pitch Roll 0.6 m 0.8 m 10 20 10 20 2 0 3 0 4 0
1.7 0.5 3.5 < 0.1 < 0.1 8.0 3.6 0.7
In order to optimise the fishing harbour lay-out with respect to movements of the fishing vessels a test series with alternative lay-outs, some of which are shown in Fig. 9, was carried out.
1 2 3 4
0 50 lOOm
Fig. 9. Some investigated lay-outs for the fishing harbour.
10

Fig. 10 shows typical, but unacceptable, surge and sway movements for a 280 t displacement vessel for offshore wave directions N and NW for lay-out 1. The reduction in movements for the other lay-outs relative to lay-out 1 is indicated in Figure 11. Note that waves from north produce again the largest movements due to reflection from the steep western edge of the
dredged channel, cf. Fig. 8. (Results shown in Figs. 10 and 11 are from DHI's report. )
m
4
3
2
1
0
m
3
2
1
0
NW-waves
J~ Surge
Cl
a L>.
V' I
0 1 2
J~ Sway
~!7 0 ~ i. !"' L
0 2
H 5 ,0 -~ 3 m
H s, 0
---.. 3 m
m S
4
3
2
1
0
Jjl
0
N- waves
urge
~~ j p .l~ ~
1 2
m Sway
" 3
2
1
0 0
~t7 i. lP i.~
1 2
l.
Legend
Tp (s)
H s ,0
-3 m
Hs ,0 " ~
3 m
8 10 12 b. D V'
Fig. 10. Typical movements for a 280 t displacement fishing vessel in lay-out 1, Fig. 9.
% Surge % Sway Legend:
120 Surge( 1)
12 0 Sway{ 1) 0 Hs=1m T p = 12s
8 ~ b. H s=2m Tp = 12s
100 0 100 !l e D H s=3m Tp=12s
9 b. 80 80 [J
~ 8 b. 60 ~ 60 A 9 40 D 40
20 20 Layout Layout
0 0 1 2 3A 3B 4 1 2 3A 3B 4
Fig. 11. Comparison of movements for a 280 t displacement fishing vessel for the lay-outs shown in Fig. 9.
11

7. DESIGN AND CONSTRUCTION PHILOSOPHY FOR THE STRUCTURES
Due to the remote location of Bosaso the design of the breakwater and the quays were based on minimum need for future maintenance. Basically, this implies structures built of good quality rock material and massive unreinforced concrete elements, designed for a low probability of failure. The difficult logistics in a remote place also put restrictions to the type, size and capacity of the construction equipment. In this case the construction was performed solely with land based equipment.
8. THE BREAKWATER
The breakwater was designed for marginal damage when exposed to the 100 year return period sea state corresponding to a deep water significant wave height, H 8 of approximately 7.0 m and a corresponding spectral peak period, TP of approximately 13 s. This constitutes a very safe design criterium because even at the deepest part of the breakwater the larger storm wave are depth limited, i.e. the difference in H 8 between the 100 year and the 500 year return period sea state is extremely small. Only the wave period will increase slightly with the return period.
The entire breakwater was tested at DHI with respect to armour layer stability and overtopping in a 3-dimensional model with correctly modelled sea bed topography. The last point is very important because the size, degree of instability and direction of the waves approaching the structure at the various sections are very much influenced by the relatively large variations in the sea bed levels in front of the breakwater.
Rock armour stones of 1-3 t from a quarry few kilometers from the site were used as main armour for the inner part of the breakwater where water depths are up to app. 3 m at HHW. The sizes of the quarry rock were controlled by visual comparison with selected stone samples with weights corresponding to the gradation limits (0.3 t, 1.0 t , 3.0 t) placed at the quarry and at the truck weighing station near the breakwater.
For the deeper sections several types of unreinforced concrete armour units were considered
and a grooved cube (Antifer type) was chosen due to its relatively good hydraulic stability and strength and because it is easier to produce than most of the complex types of units. 4.4 t, 7.2 t and 30 t blocks were used in water depth ranges at HHW of 2.5-4.0 m, 2.5-4.8 m and 4.8-7 m, respectively. These water depths are at the seaward toe of the structure.
The armour unit sizes were determined by the model tests and are generally larger than would be calculated from conventional stability formulae, like the Hudson formula. There are four reasons for this: Firstly, the topography of the coral reef amplifies the waves on some sections. Secondly, the breakwater bends are less stable than straight trunk sections and, consequently, need heavier units. Thirdly, the shift in armour unit size and type at some locations along the breakwater constitutes areas with relative reduction in armour layer stability. Finally, the toe in the deepest sections and at the roundhead was less stable. 20 t units would suffice for the main armour in the roundhead, but 30 t units were needed to ensure the necessary supporting stability of the toe of the armour. Alternatively a trench at the toe would have been necessary to prevent sliding of the armour units. Fig. 12 shows a cross section with 30 t units.
12
30t modified cubes with holes
0.65
\
11.1m I• .. 1 7.85
Quarry run
Coral reef
7 .2t Antifer blocks
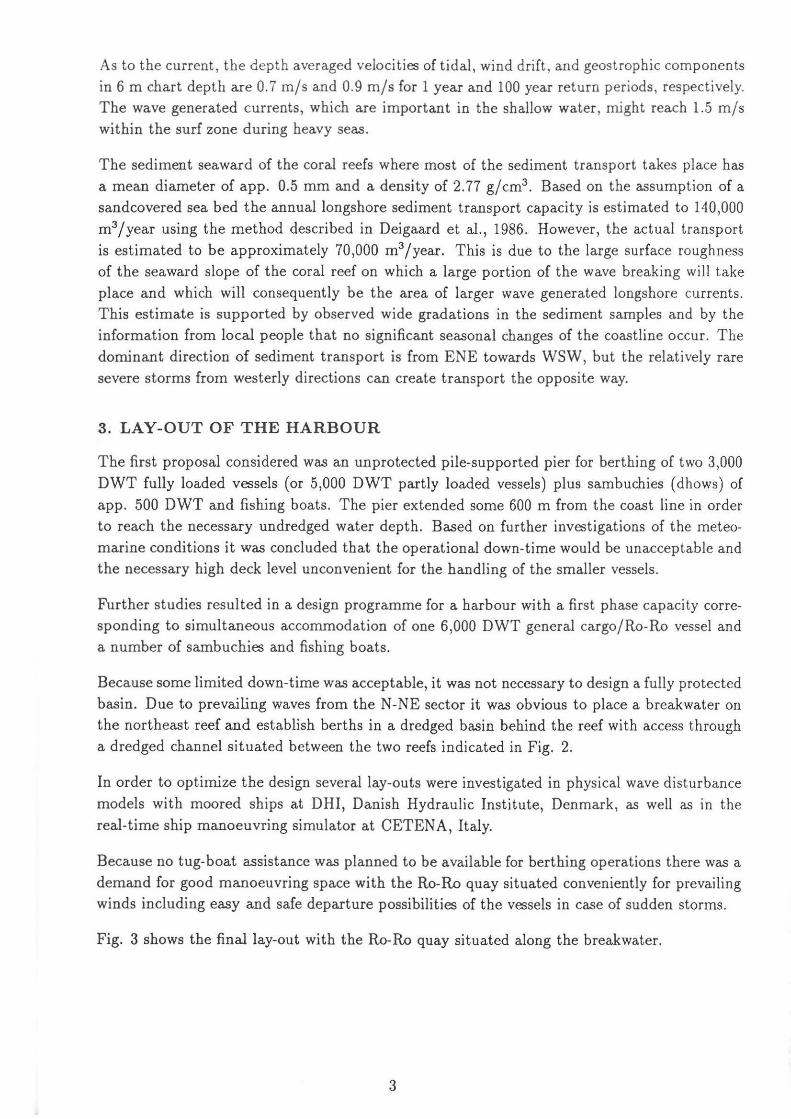
Fig. 12. Breakwater cross section with 30 t units on the seaward side.
The width of the cross section is partly determined by space requirement for the dumpers and
the crane operating on a construction road on the top of the core which was dumped progressing from land. The 1-3 t rocks were placed by a RUSTON BUCYRUS R.B.71-90 t crane, and the concrete blocks by a MANITOWOC 4100-180 t crane. The construction sequences are indicated
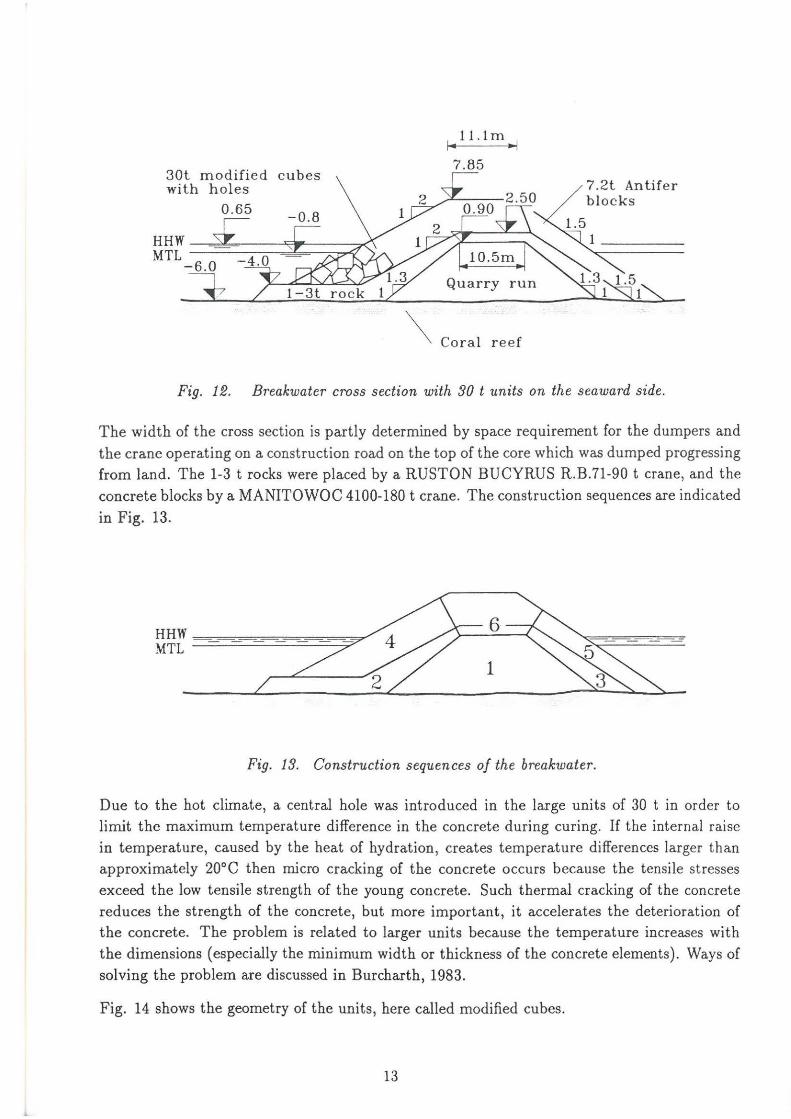
in Fig. 13.
Fig. 13. Construction sequences of the breakwater.
Due to the hot climate, a central hole was introduced in the large units of 30 t in order to limit the maximum temperature difference in the concrete during curing. If the internal raise in temperature, caused by the heat of hydration, creates temperature differences larger than approximately 20°0 then micro cracking of the concrete occurs because the tensile stresses exceed the low tensile strength of the young concrete. Such thermal cracking of the concrete reduces the strength of the concrete, but more important, it accelerates the deterioration of the concrete. The problem is related to larger units because the temperature increases with the dimensions (especially the minimum width or thickness of the concrete elements). Ways of solving the problem are discussed in Burcharth, 1983.
Fig. 14 shows the geometry of the units, here called modified cubes.
13

60
40
20
0
J~
Cross sec tion A-A
0. 925a
0.315a 0 .3 7a
0.35a 0 .3a
Volume 0.72a3 = 13.0m3 a= 2. 62m
Fig. 1.4. 30 t modified hollow cube by Burcharth, based on the Antif er type.
Bloc k witho ut hole
(Winter cas ting)
Celsius d egrees
/ D 60
'~ Cel s ius
Bloc k wi t h hole
(Winte r casting)
d egrees
m k(_ __
-.......---- -----
~
V ----- ~ ----- ---40
0
.L_ - Time after casting
10 20
Block with hole
(Summe r casting)
Celsius d egrees
30
in _lloo -
20
hours
0
--Time a fte r casting in h
-""" -0 10 20 30
Leg e nd:
60+-------.--------.--------• Temp . meas uring points
Temperature in ce ntre Air temperature Max t empe rat ure difference between c entre and surface
20+-------~-------+------~
0 castmg in hours
0 10 20 30
Fig. 15. Examples of temperature development zn 30 t modified cubes with and without a hole.
14
ou r s
The hydraulic stabili ty of these units is almost the same as the Antifer units . Run up is slightly
lower because of the larger porosity. Fig. 15 shows examples of the temperature development
in blocks with and without the hole. The reduced maximum temperature difference introduced . by the hole is clearly seen by comparison of the two blocks casted in winter t ime. In fact it was easier to keep the 20°C temperature difference limit in the 30 t units with a hole than in the
7 t units without a hole. It turned out to be necessary to use chilled water even for the 4.4 t
units.
The density of the concrete was 2.33 t/m3 and the composition as follows:
Cement Italian standard sulphate resistant pozzolan type 325, 300 kg/m3
Water-cement ratio < 0.50
Plasticizer Rheobuild 561, 1 l per 100 kg cement
Aggregate 0-5mm 35%, 5-10mm 15%, 10-20mm 20%, 20-40 mm 30%
Water temperature 5-6°C for 30 t blocks (chilled fresh water)
The temperature of the fresh concrete mix was generally 25-35°C, and the air temperature in
the range 25-45°C. Removal of the form work took place 5-7 hours after casting and immediately
after the block surfaces were sprayed with curing compound to prevent fast water evaporation. Handling of the units took place 10 days or more after casting.
Temperature readings were performed every hour by connecting a cheap pocket instrument to
the free wire ends of a 2 x 0.7 mm2 cobber-constantin thermo-wire cast into the concrete. The wire insulation was removed at the tip which was placed in the wanted point of temperature measurement.
Fig. 16 shows a photo of the completed round head.
· ... :. -~-
)• ..
~ ·: -:-
:o~S· ••
Fig. 16. Airphoto of completed roundhead.
15

9. THE QUAY WALLS
Gravity type blocks walls were used for all quays. Fig. 17 shows a typical cross section of the Ro-Ro quay. To allow placement of the quay wall blocks with land based cranes, the blocks were produced as thin-walled reinforced concrete frame elements with weights of up to 17.8 t. After placement underwater mass concrete was pumped into the frames and, finally, the reinforced concrete crown was cast in situ. The cement content in the concrete for the quay wall frame
elements was 350 kg/m3 .
Overdredging, caused by difficult soil conditions along some parts of the quay walls, necessitated scour protection in order to avoid erosion from propeller thrusts. A solution based on the principle that the already cast quay elements could be used, was adopted as shown in Fig. 17. The 2-3 t stones and the reinforced concrete slabs will be stable for propeller jet velocities up to app. 5 mfs at the sea bed. This put some restrictions to the draft of the vessels berthing and departing. Typically, a keel clearance of app. 2.0 m to the top of the stone is needed in case of a 5-6,000 DWT vessels using full engine power, as must be foreseen. A typical max draft for a 5,000 DWT Ro-Ro vessel is 5.3 m. Consequently, such a ship can operate at MLWS corresponding to water level -1.80 m. A fully loaded 6,000 DWT general cargo vessel with a draft of 6.3 m can use full propeller power only at MTL or higher water levels. This is acceptable because with such a draft manoeuvring and passage of the access channel can be difficult and dangerous at lower water levels due to loss of manoeuvrability with reduced keel clearance.
Detail of scour protection slab with pressure relieve holes (reinforcement not shown}
2.0
.r: 0.~ 1 · , .~·?. , 1 0.5 0
+2.4
A~A MTL -0.8
0
l DD J -=---- ------DD
1(.)
~ '
~
a! s;t; ;~· o 2.0 2.0 0.4m
reinforced concrete on geotextile
1 2 m m in
1-3t roe
0 .25
slab
concrete
mass. concrete
------~.---------+
0.3-lt rock
0 ~ ... 0 ..,. ... 0 ..,. ...
run
Fig. 17. Typical cross section of the Ro-Ro quay gravity block wall with scour protection.
16
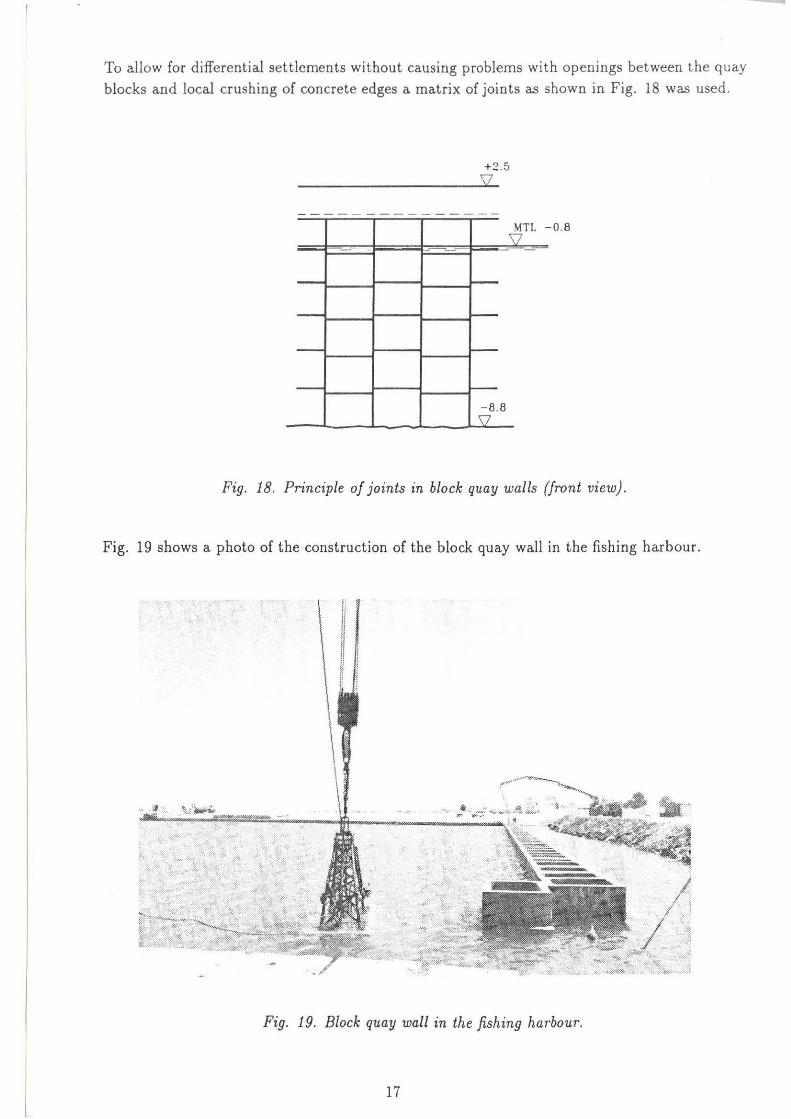
To allow for differential settlements without causing problems with openings between the quay blocks and local crushing of concrete edges a matrix of joints as shown in Fig. 18 was used.
+2 .5
~TL -0.8
- -- 1---
- 1--
- --8.8
51
Fig. 18. Principle of joints in block quay walls (front view).
Fig. 19 shows a photo of the construction of the block quay wall in the fishing harbour.
Fig. 19. Block quay wall in the fishing harbour.
17

10. CONCLUSIONS
• Wave disturbance model tests with moored ships and real time ship manoeuvring simulations are necessary tools in the design of semi-protected harbours where evaluat ion of the down-time is essential.
• 3-dimensional model tests are necessary for the evaluation of the stability and overtopping of a rubble mound breakwater placed on a reef with relatively large variations in sea bed levels or on any complex sea bed topography.
• The design philosophy for structures at remote locations with difficult logistics should
be based on the principle of easy construction procedure and minimum need for future maintenance.
• Special attention should be given to the concrete technology necessary to avoid thermal cracking in hot climates.
11. ACKNOWLEDGEMENTS
The authors acknowledge The Ministry of Foreign Affairs, Italy, for the permission to publish the paper.
12. REFERENCES
Burcharth, H.F. Materials, Structural Design of Armour Units. Seminar on rubble mound breakwaters. Royal Institute of Technology, Stockholm, Sweden, 19. April1983. Bulletin No. TRITA-VBI-120 (Ed. Gosta Werner).
Deigaard, R., Freds(3e, J., Hedegaard, L Mathematical Mode/for Littoral Drift. J.W.W., ASCE Vol 112, No. 3, 1986
18