aalborg universitet rotational capacity of reinforced...
TRANSCRIPT

Aalborg Universitet
Rotational Capacity of Reinforced Concrete Beams
Ulfkjær, J. P.; Henriksen, M. S.; Brincker, Rune; Hansen, Lars Pilegaard; Heshe, Gert;Jensen, Jens Kristian JehrboPublished in:Modern Design of Concrete Structures : Proceedings of Nordic Symposium, Aalborg University, May 3-5, 1995
Publication date:1995
Document VersionPublisher's PDF, also known as Version of record
Link to publication from Aalborg University
Citation for published version (APA):Ulfkjær, J. P., Henriksen, M. S., Brincker, R., Hansen, L. P., Heshe, G., & Jensen, J. K. J. (1995). RotationalCapacity of Reinforced Concrete Beams. In Aakjær, K. (ed.) (Ed.), Modern Design of Concrete Structures :Proceedings of Nordic Symposium, Aalborg University, May 3-5, 1995: R / Institut for Bygningsteknik, AalborgUniversitet (R9513 ed., pp. 345-356). Aalborg: Department of Mechanical Engineering, Aalborg University. TheNordic Symposium on Modern Design of Concrete Structures , No. R9512
General rightsCopyright and moral rights for the publications made accessible in the public portal are retained by the authors and/or other copyright ownersand it is a condition of accessing publications that users recognise and abide by the legal requirements associated with these rights.
? Users may download and print one copy of any publication from the public portal for the purpose of private study or research. ? You may not further distribute the material or use it for any profit-making activity or commercial gain ? You may freely distribute the URL identifying the publication in the public portal ?
Take down policyIf you believe that this document breaches copyright please contact us at [email protected] providing details, and we will remove access tothe work immediately and investigate your claim.
Downloaded from vbn.aau.dk on: juni 29, 2018
ROTATIONAL CAPACITY OF REINFORCED CONCRETE BEAMS
J. P. Ulfkjær, M. S. Hcnriksen, R. Brinckcr, L. P. Hansen, G. Heshc and J. K. Jehrbo
Aalborg University , Department ofBuilding Technology and Structural Engineering,
Sohngaardsholmsvej 57, DK-9000 Aalborg, Denmark.
ABSTRACT
The European Structurallntegrity Society-Technical Commitlee 9, has initiated a Round Robin
on 'Scale Effects and Transitional Failure Phenomena ofReinforced Concrete Beams in Flexure'.
In Denmark, Aalborg Universily is participating. The programme for Aalborg University involves
an experimental progranune where 120 reinforced concrete beams, 54 plain concrete beams and
324 concrete cylinders are tested. For the reinforced concrete beams four different parameters are
varied. The slenderness is 6, 12 and 18, the beam depth is l 00 mm, 200 mm and 400 mm giving
nine different geometries, five reinforcement ratios between 0.14% and 1.57%, and the concrete
has a compressive strength o f approximately 60 MPa or 90 MPa. The beams are Iested in three
point bending in a servo controlled materiais testing system specially designed for the wide range
of geometri es. The easting ofthe bean1s is finished. The experiments are present! y performed and
will continue until the summer of 1995. At present only results for the beam type with the
dimension l 00 mm x l 00 mm x 1200 11ll11 of normal strength concrete for all the reinforcement
ratios and for geometrically similar beams with the reinforcement ratio 1.57% is available. The
results are presentedasnon-dimensional ultimate bending moments and the rotational capacity.
The results show that the ultimate non-dimensional bending moment is dependent on the
reinforcement ratio, when the reinforcement ratio is smal!, and independent for larger
reinforcement ratios and that the rotational capacity is dependent on the reinforcement ratio,
especially increasing at low reinforcement ratios. For geometrically similar beams indifferent
size scales the experiments show that the non-dimensional moment is decreasing with size and
that the rotational capacity both increases and decreases with the size scale.
Key words: Rotational Capacity, Concrete Beams, Experiments, Size Effect.
345
346
I INTRODUCTION
When designing concrete structures one o f the most imporiant t asks for the designer is to ensure
that the theoretical fraelure will occur as a duetile fracture. One of themeasures o f the ductility
o f a concrete structure is the rotational capacity. When designing concrete structures according
to the theory of piasticity for one dimensional structures, i t is very important that the plastic
rotation in the critical cross-sections is lower than the rotatianaJ capacity. ln most codes the
rotatianaJ capacity is assumed only to be dependent on the non-dimensional size of the
compression zone [!]. With the development offracture mechanics and offast numerical tools
the it is evident that ductility of concrete structures is dependent on many other factors than just
the strength and the stiffness o f the steel and concrete used and the reinforcement arrangement.
lnstead i t is realized that the type uf fraelure is al so dependent on the size o f the structure, the
fraelure energy ofthe concrete, etc. [2],[3] ,[4] and [5]. The influence ofthese parameters has so
far not been ful! y investigated or understood. There is therefore a Jack o f knowledge of how the
rotational capacity is dependent on several factors. CEB has therefore starled task group 2.2
'Ductility Requirements for Structural Concrete - Reinforcement', [6]. Also the European
Structurallntegrity Society-Technical-Committee 9 (ESIS-TC9) on concrete, chaired by professor
Alberto Carpinteri has initiated a Round Robin on 'Scale Effects and Transitional Failure
Phenomena of Reinforced Concrete Beams in Flexure'. The programme involves both
experimental and numerical contributions. At Aalborg Universily the experimental programme
with four different parameters is started. The slenderness is 6, 12 and 18, and the beam depth is
l 00 nun, 200mmor 400 mm giving nine different geometri es, the reinforcement ratio is between
0.14% and 1.57% and the concrete has a compressive strcngth o f approximately 60 MPa o r 90
M P a.
2 EXPEIUMENTS
2.1 Materia ls
Concrete
At present o n! y beams o f normal strength concretc have been tested. The same mi x is used for
all the beams. Since the cross section o f the smallest bean1s is o n! y I 00 mm x I 00 mm, the !argest
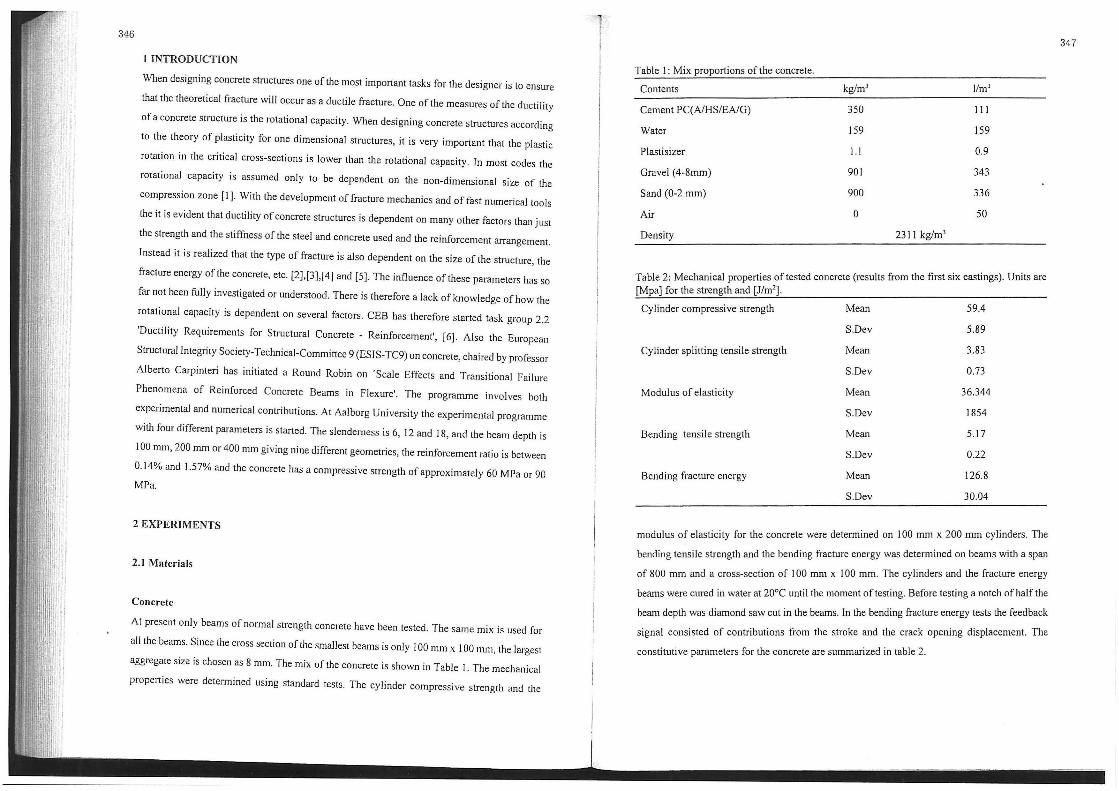
aggregate size is chosen as 8 mm. The mix ofthe concrete is shown in Table I. The mechanical
properties were determined using standard tests. The c y linder compressive strength and the
Tab le J: Mix proportions ofthe concrete.
Contents kglm3 11m 3
Cement PC(AIHS/EA/G) 350 III
Water 159 I 59
Piastisizer l. J 0.9
Grave] (4-8mm) 90I 343
Sand (0-2 mm) 900 336
Air o 50
Density 231 I kg/m3
Table 2: Mechanicai properties oftested concrete (results from the first six castings). Unitsare [Mpa] for the strength and [Jim'].
Cylinder compressive strength Mean 59.4
S.Dev 5.89
Cyl inder splitting tensile strength Mean 3.83
S.Dev 0.73
Modulus o f elasticity Mean 36.344
S.Dev 1854
Bending tensile strength Mean 5.17
S.Dev 0.22
Bending fraelure energy Mean I26.8
S.Dev 30.04
modulus of elasticity for the concrete were determined on I 00 mm x 200 mm cylinders. The
bending tensile strength and the bending fraelure energy was determined on beams with a span
o f 800 mm and a cross-section of J 00 mm x l 00 mm. The cylinders and the fraelure energy
bean1s were cured in water at 20°C until the moment o f testing. B e fore testing a note h o f h alf the
beam depth was diamund saw cut in the beams. In the bending fraelure energy tests the feedback
signal consisted of contributions from the stroke and the crack opening displacement. The
constitutive parameters for the concrete are summarized in tab le 2.
347
348
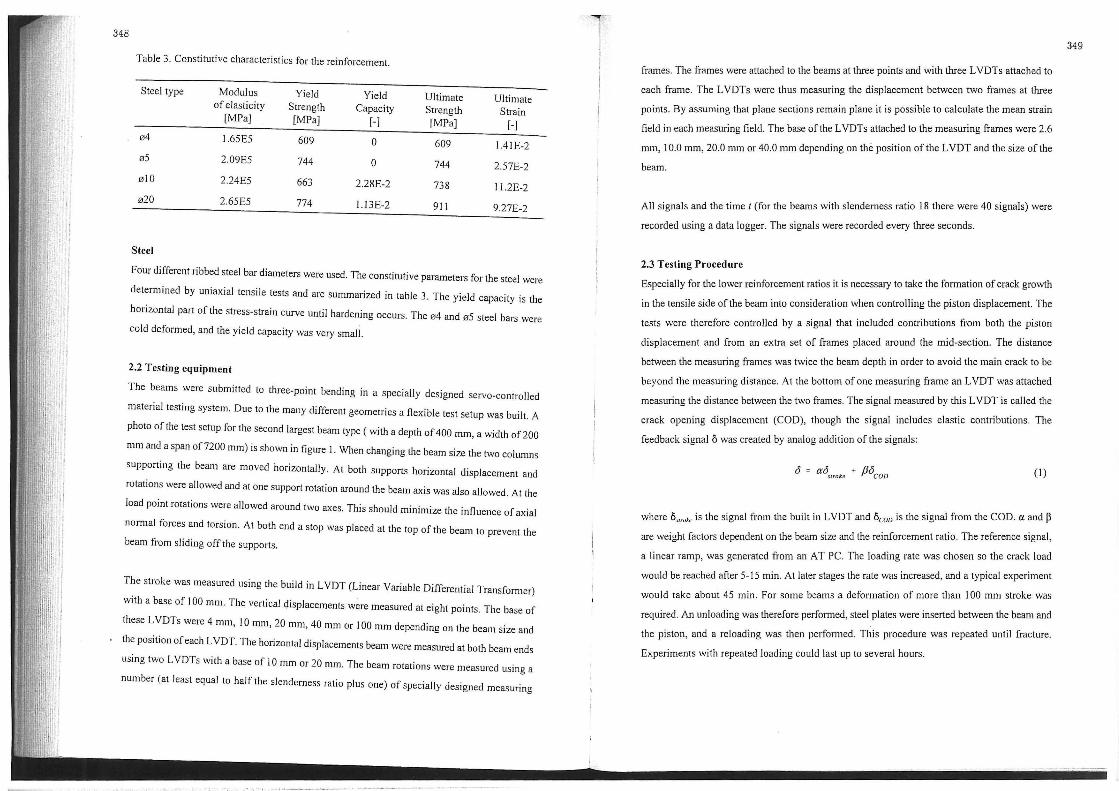
Table 3. Constitutive characteristics for the reinforcement.
Steel type Modulus Yield Yield U Jtimate Ultimate o f elasticity Strength Capacity Strength Strain
[M PaJ [MPa] f-l [MPa] (-] ø4 1.65E5 609 o 609 1.41E-2 ø5 2.09E5 744 o 744 2.57E-2 øl O 2.24E5 663 2.28E-2 738 11.2E-2 ø20 2.65E5 774 1.13E-2 911 9.27E-2
Steel
Four different ribbed steel bar diameters were used. The constitutive parameters for the steel were
determined by uniaxial tensi le tests and are summarized in table 3. The yield capacity is the
horizontal part o f the stress-strain curve unti l hardening occurs. The ø4 and ø5 steel bars were
cold deformed, and the yield capacity was very small.
2.2 Testing equipment
The beams were submitted to three-point hending in a specially designed servo-controlled
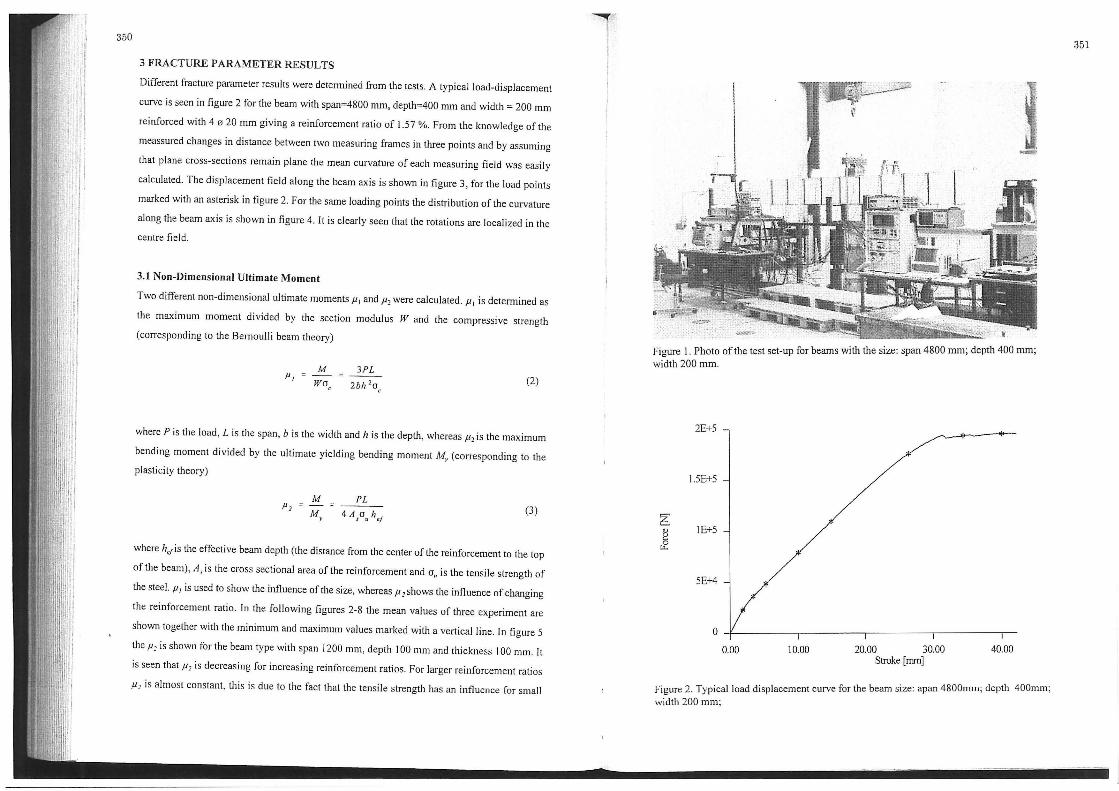
material testing system. Due to the many different geomelries a flexib le test setup was built. A
ph o to o f the test setup for the second !argest beam type ( with a depth o f 400 mm, a width o f 200
mm and a span of7200 mm) is shown in ligure l. When changing the beam size the two columns
supporting the beam are moved horizontally. At both supports horizontal dispiacement and
rotations were allowed and at ane support rotation araund the bean1 axis was also allowed. At the
load point rotations were allowed araund two axes. Thi s should minimize the influence o f axial
normal forces and torsion. At both end a stop was placed at the top o f the beam to prevent the
beam from sliding off the supports.
The stroke was measured using the build in L VDT (Linear Variable Differential Transformer)
with a base of l 00 mm. The vertica l dispiacements were measured at eight points . The base af
these L VDTs were 4 mm, l O mm, 20 mm, 40 mm or l 00 mm depending on the beam size and
the position o f each L YD T. The horizontal dispiacements beam were measuredat both beam ends
using two L VDTs with a base o f l O mm or 20 mm. The beam rotations were measured using a
number (at least equal to hal f the slenderness ratio plus one) o f specially designed measuring
,~
j
frames. The frames were attached to thc beams at three points and with three LVDTs attached to
each frame. The L VDTs were thus measuring the dispiacement between two frames at three
points. By assuming that plane sections remain plane i t is possible to calculate the mean strain
field in each measuring field. The base ofthe L VDTs attached to the measuring frames were 2.6
mm, 10.0 mm, 20.0 mm or 40.0 mm depending o n the position o f the L VDT and the size o f the
beam.
All signals and the time t (for the beams with slendemess ratio 18 there were 40 signals) were
recorded using a data logger. The signals were recorded every three seconds.
2.3 Testing Procedure
Especiai ly for the lower reinforcement ratios it is necessary to take the formation of crack growth
in the tensile side ofthe beam into consideration when centrolling the piston displacement. The
tests were therefore controlled by a signal !hat included contributions from both the piston
dispiacement and from an extra set af frames placed araund the mid-section. The distance
between the measuring frames was twice the beam depth in arder to avoid the main crack to be
beyond the measuring distance. At the hottom of one measuring frame an L VDT was attached
measuring the distance between the two frames. The signal measured by this L VDT is called the
crack opening dispiacement (COD), though the signal ineludes elastic contributions. The
feedback signal o was created by analog addition o f the signals:
(l)
where 6,""~.- is the signal from the built in L VDT and Dco/J is the signal from the COD. et and P are weight factors dependent an the beam size and the reinforcement ratio . Thc reference signal,
a linear ram p, was generaled from an A T PC. The loading rate was chosen so the crack load
would be reached after 5-15 min. At later stages the rate was increased, and a typical experiment
would tak e about 45 min. For same beams a deformation o f more than l 00 mm stroke was
required. An unloading was therefore perfom1ed, steel piates were inserted between the beam and
the piston, and a reloading was then performed. Tl;is procedure was repeated until fracture.
Experiments with repeated loading could last up to several hours.
349
350
3 FRACTURE PARAMETER RESULTS
Different fraelure parameter restdis were detem1ined fi·om the tests. A typical load-dispiacement
curve is secn in figure 2 for the beam with span=4800 mm, depth=400 mm and width = 200 mm
reinforced with 4 ø 20 mm giving a reinforcement ratio of 1.57 %. From the knowledge ofthe
meassmed changes in distance between two measuring framesin three points and by assuming
!hat plane cross-sections remain plane the mean curvature o f each measuring field was easily
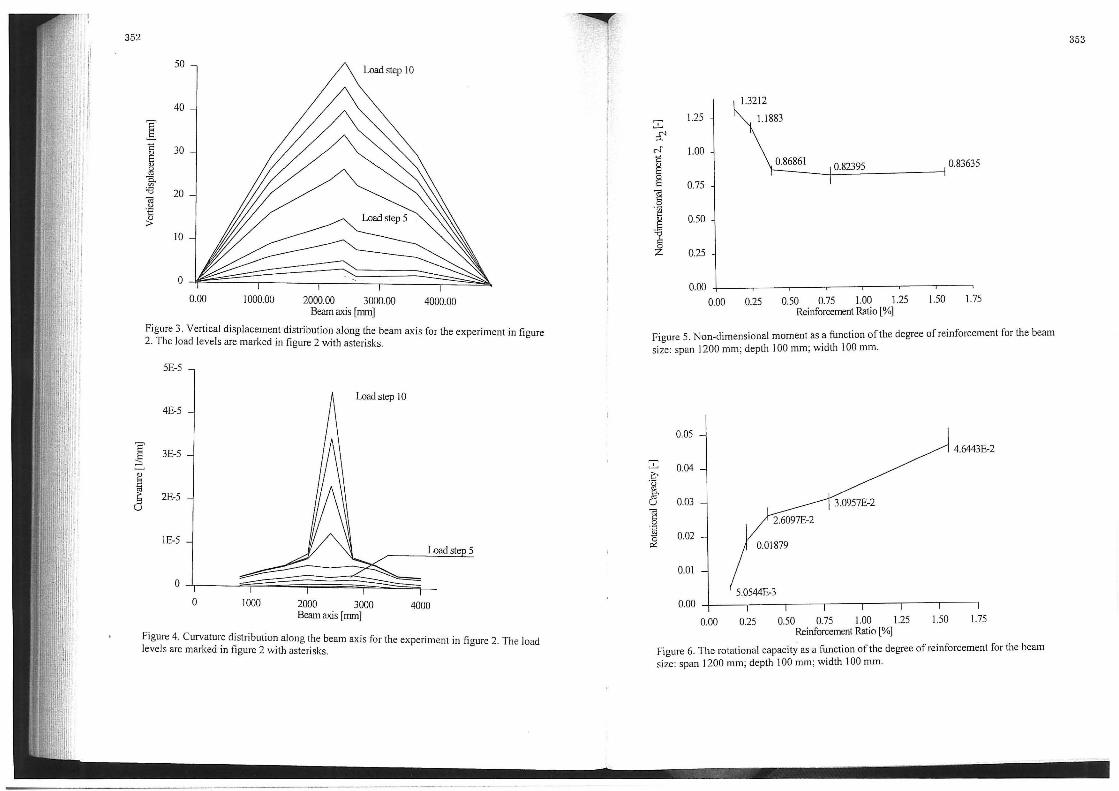
calculated. The dispiacement ficld along the beam axis is shown in tigure 3, for the load points
marked with an asterisk in figure 2. For the same loading points the distribution of the curvature
along the beam axis is shown in tigure 4. It is clearly seen that the rotations are localized in the
centre field.
3.1 Non-Dimensional Ultimate Moment
Two different non-dimensional ultimate moments 11 1 and 111 were calculated. f11
is determined as
the maximum moment divided by the section modulus W and the compressive strength
(corresponding to the Bernoulli beam theory)
M P,
3PL
2bh 'o, (2)
where P is the load, L is the span, b is the width and h is the depth, whereas 11, is the maximum
bending moment divided by the ultimate yielding bending moment M,, (corresponding to the
piasticity theory)
M PL (3)
where h,1 is the effective beam depth (the distance from the center ofthe reinforcement to the top
of the beam), A, is the cross sectional area o f the reinforcement and o., is the tensile strength of
the steel . 11 1 is u s ed to show the influence o f tb e size, whereas 11, shows the influence o f changing
the reinforcement ratio. In the foliowing tigures 2-8 the mean values o f three experiment are
shown together with the minimum and maximum values marked with a vertical line. In tigure 5
the !le is shown for the beam type with span 1200 mm, depth l 00 mm and thickness l 00 mm. lt
is seen that 112 is decreasing for increasing reinforcement ratios . For larger reinforcement ratios
11 2 is almost constant. thisis due to the faet that thc tensile strength has an influence for small
Figure J. Photo ofthe test set-up for beams with the size: span 4800 mm; depth 400 mm; width 200 mm.
1.5E+5
~ IE+S "' ~
to-
5E+4
0.00 10.00 20.00 30.00 40.00 Stroke [mm]
Figure 2. Typicalload dispiacement curve for the beam size: apan 4800mm; depth 400mm; width 200 mm;
351
352
I ~ B
~
50
40
I c 30 ~ " g ~ '8 20 -æ u .€ "' >
IO
o 0.00 1000.00 2000.00 3000.00 4000.00
Beam axis [mm]
F i g ure 3. Vertical di spiacement distribution along the beam axis for the experiment in figure 2. The load levels aremarked in figure 2 with asterisks.
SE-S
Load step IO
4E-5
3E-5
2E-5
IE-5 Load ste 5
o o 1000 2000 3000 4000
Beam axis [mm]
F i g ure 4. Curvature distribution a!ong the beam axis for the experiment in figure 2. The load levels are marked in figure 2 with asteri sks.
1.3212
~ 1.25 1.1883
:f'
"' 1.00 c 0.82395 0.83635 §
g 0.75 -æ c: o .i!]
0.50 " ,g 6 o z 0.25
0.00
0.00 0.25 0.50 0.75 1.00 1.25 !.50 1.75 R.einforcernent Ratio [%]
Figure s. Non-dimensional moment as~ ftmction ofthe degree ofreinforcement for the beam size: span I 200 mm; depth l 00 mm; w1dth I 00 mm.
0.05 4.6443E-2
~ 0.04 o ·c:; ro o. ro
0.03 u -a c: o
~ 0.02 0.01879
0.00 0.25 0.50 0.75 1.00 1.25 1.50 1.75 Reinforcement Ratio [%]
Figure 6. The rotational capacity as a function ofthe degree ofreinforcement for the beam size: span 1200 mm; depth l 00 mm; w1dth l 00 mm.
353
354
0.16
0.12
0.00 100.00 200.00 Beam Depth [mm]
300.00 400.
Figure 7. Non-dimensional moment as fu · ment 1.57 %. a netion ofthe beam size for the degree ofreinforce-
2 b ·c:;
8 § '§ a er:
0.08
006
0.04
0.02
0.00
0.00 100.00 200.00 BeamilepUl [mm]
300.00 400.0
Figure 8. The rotatianaJ capacity as a function ofthe . 1.57% and slendemess 12. beam SIZe for the reinforcement ratio
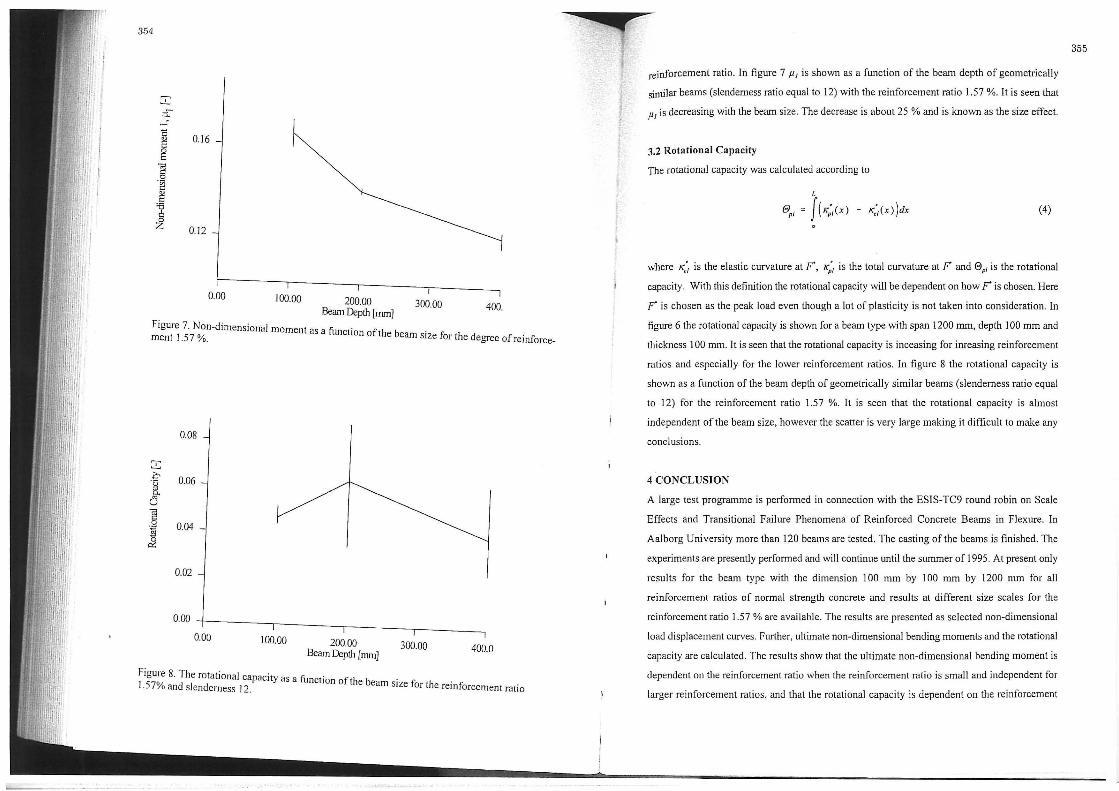
reinforcement ratio. In tigure 7 J1 1 is shown as a function o f the beam depth of geometrically
similar beams (slendemess ratio equal to 12) with the reinforcement ratio 1.57 %. It is seen that
JlJ is decreasing with the beam size. The decrease is about 25 %and is known as the size effect.
3.2 Rotational Capacity
The rotational capacity was ca!culated according to
L
€Jpl = j(K;1(x) - <,(x))dx (4)
where K~ is the elastic curvature at F, K;, is the total curvature at F and eP, is the rotatianaJ
capacity. With thi s definition the rotatianaJ capacity will be dependent o n how F is chosen. H e re
F is chosen as the peak load even though a lot of piasticity is not taken into consideration. In
tigure 6 the rotational capacity is shown for a bearn type with span 1200 mm, depth l 00 mm and
thickness l 00 mm. !t is seen that the rotational capacity is inceasing for inreasing reinforcement
ratios and especially for the lower reinforcement ratios . In tigure 8 the rotational capacity is
shownas a function ofthe beam depth of geometrically similar beams (slenderness ratio equal
to 12) for the reinforcement ratio 1.57 %. It is seen that the rotatianaJ capacity is almost
independem of the beam size, however the scatter is very large making it difficult to make any
conclusions.
4 CONCLUSION
A large test programme is performed in conneelion with the ESIS-TC9 ro und ro bi n on Scale
Effects and Transitional Failure Phenomena of Reinforced Concrete Beams in Flexure. In
Aalborg Universily morethan 120 beams are tested. The easting ofthe bearns is finished. The
experiments are present! y performed and will continue until the summer of 1995. At present only
results for the beam type with the dimension l 00 mm by l 00 mm by 1200 mm for all
reinforcement ratios of normal strength concrete and results at different size scales for the
reinforcement ratio 1.57 % are available. The results are presented as selected non-dimensional
load dispiacement curves. Further, ultimate non-dimensional bending moments and the rotational
capacity are calculated. The results show that the ultimate non-dimensional bending moment is
dependent on the reinforcement ratio when the reinforcement ratio is small and independent for
larger reinforcement ratios, and that the rotatianaJ capacity is dependent on the reinforcement
355
356
ratio, especially increasing at lo w reinforcement ratios. For geometrically similar bearos is seen
that a size effect is present on the load carrying capacity. Due tothelarge scatter on the temporary
results for the rotational capacity it is tor the time being difficult to give any condusions
regarding the intluence on size on the rotational capacity.
6 ACKNOWLEDGEMENTS
The financial support from the Danish Technical Research Council (STVF) IS gratefully
acknowledged.
7 REFERENCES
[1] Comile Euro-Intemationl du Beton (CEB), "CEB-FIP Model Code !990- Firs/ draji",
Bulletin D ' Information N°196, pp. 3.39- 3.40 (1990).
[2] Hillerborg, A." Fraelure Mechanics Concepts Applied to Moment Capacity and Rotational
Capacity ofReinforced Concrete Beams", Engineering Fraelure Meehanies, Vol. 35, pp.233-240,
1990.
[3] Cederwall, K., Losberg, A. and Palm, G., "Armereda Betonbalkars Rotationskapasitet",
Journal ofthe Nordie Conerete Federation. V ol 4, pp. 9-16, 1974. (In Swedish)
[4] Bigaj , A. and Walraven, J.C. , "Size Effect on Rotational Capacity of Plastic Hinges in
Reinforced Concrete Beams" , CEB,Bulletin D ' Information N°2l8, pp. 7-23 (1993).
[5] Bosco, C. and Carpinteri , Al. , " Scale Effects and Transiiianal Phenomena of Failure in
Reinforced Concrete Beams" , ES/S Teehnieal Comi/ee 9 on Conerete , Vienna, pp. 1- 12, 1992.
[6] Comile Euro-Jnternationl du Beton (CEB), "Ductility - Reinforcement ",CEB,Bulletin
D'Jnformation N°218, pp. l- 273 (1993).
ABSTRACT
SHEAR STRENGTH OF NON SHEAR REINFORCED CONCRETE BEAMS
Jin Ping Zhang Department of Structural Engineering
Technical Universily of Denmark Building 118,2800 Lyngby,Denmark
lt has been observed that, in general , the shear failure of non shear reinforced concrete beruns is featured by the formation of a critical diagonal crack. In this paper, a physical explanation is given for this faet under the hypothesis that the cracking of concrete introduces potential yield lines which may be more dangerous than the anes found by the usual plastic theory. The critical diagonal cracking load is a problem o f fracture mechanics, while the ultimate load carrying capacity is f o und according to the plastic theory. The strength of cracked concrete is expressed by introducing a factor which retlects the reduction of sliding resistance of concrete due to cracking. Theoretical calculations are compared with the experimental results of reinforced concrete beams. Good agreement has been found.
Key Words: Shear Strength, Concrete Beams, Diagonal Cracks.
l. INTRODUCTION
Shear failure mechanism and shear strengtil of reinforced concrete bearos have been the subject o f research for man y years[ l ][2].
Among the many attempts to salve the shear problem, the plastic theory for non shear reinforced concrete bearos and slabs was developed in the 70 ' s by works of Nielsen et al[3][4][5][6]. An effectiveness factor had to be introduced in arder to get agreement with experimental results. !t turned out that, besides the usual and easily understanciable parameters, the effectiveness factor also contained the intluence of the shear span ratio, the physical meaning of which has never really been understood.
Observations from experiments show that the shear failure of non shear reinforced concrete bearos with a normal shear span ratio is gavemed by the formation of a critical diagonal crack. Since the sliding strength is reduced considerably by the cracking, this phenomenon suggests that the cracking of concrete introduces potential yield lines which are more dangerous than those predicted by the usual plastic theory.
Under this hypothesis, the load carrying capacity of reinforced concrete beruns may be calculated by plastic theory with an effectiveness factor containing effects of only quite natura! parameters such as the compressive strength of concrete, the reinforcement ratio and a size effect parameter. The influence of cracking is taken into account by a reduction factor.
357