aalborg universitet long-range channel measurements on...
TRANSCRIPT

Aalborg Universitet
Long-Range Channel Measurements on Small Terminal Antennas Using Optics
Yanakiev, Boyan; Nielsen, Jesper Ødum; Christensen, Morten; Pedersen, Gert F.
Published in:I E E E Transactions on Instrumentation and Measurement
DOI (link to publication from Publisher):10.1109/TIM.2012.2196391
Publication date:2012
Document VersionEarly version, also known as pre-print
Link to publication from Aalborg University
Citation for published version (APA):Yanakiev, B., Nielsen, J. Ø., Christensen, M., & Pedersen, G. F. (2012). Long-Range Channel Measurements onSmall Terminal Antennas Using Optics. I E E E Transactions on Instrumentation and Measurement, 61(10),2749-2758. DOI: 10.1109/TIM.2012.2196391
General rightsCopyright and moral rights for the publications made accessible in the public portal are retained by the authors and/or other copyright ownersand it is a condition of accessing publications that users recognise and abide by the legal requirements associated with these rights.
? Users may download and print one copy of any publication from the public portal for the purpose of private study or research. ? You may not further distribute the material or use it for any profit-making activity or commercial gain ? You may freely distribute the URL identifying the publication in the public portal ?
Take down policyIf you believe that this document breaches copyright please contact us at [email protected] providing details, and we will remove access tothe work immediately and investigate your claim.
Downloaded from vbn.aau.dk on: maj 22, 2018

This material is presented to ensure timely dissemination of scholarly and technical work. Copyrightand all rights therein are retained by authors or by other copyright holders. All persons copying thisinformation are expected to adhere to the terms and constraints invoked by each author’s copyright. Inmost cases, these works may not be reposted without the explicit permission of the copyright holder.
c© 2012 IEEE. Personal use of this material is permitted. However, permission to reprint/republish thismaterial for advertising or promotional purposes or for creating new collective works for resale orredistribution to servers or lists, or to reuse any copyrighted component of this work in other worksmust be obtained from the IEEE.
DOI: 10.1109/TIM.2012.2196391
URL: http://ieeexplore.ieee.org/xpl/login.jsp?tp=&arnumber=6220880
Boyan YanakievLindholm Brygge 359400 NørresundbyDenmarkPhone: +45 60699017Fax: +45 98151564Email: [email protected]

IEEE TRANSACTIONS ON INSTRUMENTATION AND MEASUREMENT 2011 1
Long Range Channel Measurements on SmallTerminal Antennas Using Optics
Boyan Yanakiev, Jesper Ødum Nielsen, Morten Christensen and Gert Frølund Pedersen
Abstract—In this paper details are given on a novel measure-ment device for radio propagation channel measurements. Toavoid measurement errors due to the conductive cables on smallterminal antennas, as well as to improve the handling of theprototypes under investigation, an optical measurement devicehas been developed. It utilizes thin, light and flexible glass fibersas opposed to a heavy, stiff and conductive coaxial cables. Thepaper looks at the various system parameters such as overallgain, noise figure and dynamic range and compares the solutionto other methods. An estimate of the device accuracy is alsogiven. Selected parts of the circuitry are given in more details.Typical measurement results are also shown.
Index Terms—optical fiber, propagation measurements, opticalfiber measurement applications, antenna, MIMO systems, elec-trically small antennas, handset antennas
I. INTRODUCTION
MOST up-to-date and future communication standards(WiMax, LTE, LTE-A, 802.11n) include some type of
Multiple Input - Multiple Output (MIMO) scheme with thepurpose of boosting the overall throughput in the system.Many of these standards also include small, mobile phonesize, device categories [1], where the antenna design is ingeneral challenging due to the fundamental limitations ofantennas [2], [3]. It is also known that if the antenna canbe identified as electrically small, measurement cable effectsbecome a significant source of errors in nearly all typesof antenna measurements, [4]–[7]. The additional antennasrequired for the MIMO schemes, pose even further challengesto the design as well as performance evaluation. The alreadyscarce space for leading out measurement cables, becomeseven less and new problems arise due to the cables (one foreach antenna), for example changes in coupling. Removingsuch measurement errors brings the antenna design closer toreality, which can be very beneficial at the early design stage.
Typical antenna measurements, which can be improved withthe use of optical fiber are radiation pattern measurements,Over The Air (OTA) system measurements or propagationchannel measurements. These pose different challenges thatare difficult to meet with one solution. Also, it is desirablethat a solution is flexible in terms of carrier frequency, can
B. Yanakiev and M. Christensen are with Molex Antenna Business Unit inAalborg, Denmark .
B. Yanakiev (postdoctoral researcher), J. Ø. Nielsen and G. F. Pedersenare with the Antennas, Propagation and Radio Networking section at theDepartment of Electronic Systems, Faculty of Engineering and Science,Aalborg University, Denmark
B. Yanakiev and J. Ø. Nielsen are sponsored by the Danish Advanced Tech-nology Foundation (Højteknologifonden) as part of the Converged AdvancedMobile Media Platform (CAMMP) project.
�����������
�
��������������������
���������
����������
������������
��������������������
Fig. 1. Block diagram of an optical link solution for low power output. Theamplifier (PA) may not be needed.
accommodate high bandwidth and is easy to handle andmechanically robust.
In the case of low propagation loss between the Transmitter(TX) and the Receiver (RX), only relatively low power needsto be emitted by the TX to give sufficient power at the RXside. This would typically be the case for radiation patternmeasurements or propagation measurements at short distances.Fig. 1 shows a block diagram of a typical optical solutionsuitable for the low channel loss scenario. The output ofan optical detector diode can often be used directly, with-out additional amplification. For typical optical power levelsaround 3-10 dBm, the current is 3-6 mA. The RF outputpower is about 0 dBm and the device can be used from about100 MHz to about 6 GHz, depending on the componentsselected, all commercially available. In the example of Fig. 2an Emcore [8] detector diode is used. The block size is about20 × 17 × 10 mm and integrated as part of the radiatingstructure of a small Planar Inverted F Antenna (PIFA) antenna.The detector requires an external power source but since theconsumption is low, a single cell battery is sufficient forseveral hours of operation. Attention has to be paid to thebattery maximum continuous current drain specifications toensure the linearity of the link. The other end of the opticalfiber is connected to a laser. Since this unit would be locatedtogether with the stationary equipment, the size and powerconsumption are not critical. Thus, an off-the-shelf laser canbe used. An even better solution is available to manufacturers;the detector diode inside the unit is actually very small,about 1 mm in diameter, and hence could easily be integratedinto, e.g., an SubMiniature version A (SMA) connector. Thistype of solution is popular in literature when optical patternmeasurements are needed - [9], [10].
This paper looks at an alternative type of optical mea-surement device for long range propagation channel mea-surements, for example in urban environments. Most of thedevelopments in the area are either too big [10], [11], shortrange [9], [10], [12] or suitable for anechoic chamber only. The

2 IEEE TRANSACTIONS ON INSTRUMENTATION AND MEASUREMENT 2011
PIFA
Battery
Optical
fiber
50 ohm
connectorcm
Fig. 2. Example of a PIFA antenna with an optical link device for low powertransmission. The scale is in cm.
device presented here is specifically designed to fit in a smallvolume and is optimized for low power consumption, thusimitating the phone electronics. It can be used in an anechoicor reverberation chambers, however it is best suited for longrange channel sounding. The paper gives further details andsupports the work presented in [13] and [14].
Using the channel reciprocity, the high power needed forlong range applications, can be at the stationary equipmentside and the Device Under Test (DUT) is then a receiver.Fitting a linear, analog laser in small volume however isnot easy. The insertion loss is rather high, increasing thenoise dramatically unless the signal is pre-amplified. However,adding the needed about 20 dB of gain inside a small DUTcan lead to oscillations due to signals coupling back into theAntenna Under Test (AUT). Furthermore, a number of filterswould be needed, to ensure the device’s compatibility withsystems such as Global System for Mobile communication(GSM) already operating in the area, where the sounding is tobe performed. All this adds to the size and complexity of thecircuit. Fig. 3 shows a block diagram of the realized circuit,where it is noted that multiple antennas can be included byswitching.
Despite the increased complexity of the RX optical solution,there can be major advantages when long range channelsounding is needed. For example, the measurements describedin [15], [16] include two separate Base Stations (BSs) withmultiple transmitters on each and large separation (severalhundred meters) in urban environment. In a typical correlationsounder, the receiver is usually much more complex andexpensive than the transmitter, making the split to receivingbase stations undesirable. Also, synchronization over multiplekilometers becomes an issue when truly simultaneous channelsounding is required. Alternatively, if the base stations aretransmitting, the much simpler and cheaper transmitter needsto be split. In addition the range of the sounding can be easilyextended by adding additional amplification at the stationaryequipment side. Note that additional 20 dB amplification on abattery powered mobile handset can be an issue.
The RX optical device in this paper addresses a channelsounding scenario with multiple BSs and high propagationchannel loss conditions. The fully parallel architecture andsimultaneous sounding allows for investigations in the area
BPF
Digital RX
Analog TX
DUT
Analog RX
Digital TX
Stationary Equipment
Analog Frontend
RF out
Optical Fibers
Control Signals
AUTs
Fig. 3. Block diagram of a battery driven receiving DUT with optical output.
of cooperative MIMO using measurement data.The paper is organized as follows: Section II introduces
the main considerations for the optical link design followedin Section III by a description of the actual device built.Section IV looks at the device RF performance and analyzespotential sources of errors and Section V shows measurementresults. Section VI concludes the paper.
II. INTRINSIC OPTICAL LINK
Analog optical links at microwave frequencies are mostcommonly used for antenna remote operations as well as inthe CAble TeleVision (CATV) sector. Most laser componentson the market target those applications. Although, antennameasurements with optical links are gaining more attention,the optical components, available on the market are stilllimited to relatively large devices, most often with built-incooling elements. The cooled lasers are inadequate for theapplication in this paper, due to the large size and about 1.5A current consumption of the Peltier cooling element [17].
Thus un-cooled lasers must be used, which can lead to non-linearity due to temperature variation. Since the target appli-cation of the device described here is channel measurements,and those can take place both outdoor and indoor, temperaturevariability can be an issue. Another major size constraint isthe modulator. The use of the industry standard Mach-Zehnderoptical modulator is difficult, again due to the typically largesize of those devices. Therefore, direct modulation is the bestcandidate with size being the major benefit, despite the overallworse performance in terms of any other parameter such asnoise figure (NF), insertion loss etc. With the above applicationspecific considerations in mind, the implementation of theoptical antenna measurement tool follows a standard path.
All equations relating to the optical link are directly takenfrom [18]. The goal here is to highlight the practical con-siderations for the specific application described, rather than

YANAKIEV et al.: CHANNEL MEASUREMENTS ON SMALL TERMINAL ANTENNAS USING OPTICS 3
VCC
L
GND
VCC
G
GND
VSIN
GND
RF Feed
DFB Laser Photo monitor
RF blocking coil
Voltage ControlledCurrent Source
GND
Fig. 4. Laser biasing block diagram. The RF feed is amplitude modulating thelaser current around the bias point set by the current driver. Voltage feedbackfrom the built in photo-monitor moves the biasing point, according to thetemperature related optical power variation and stabilizes it around the desiredlevel.
improve on existing optical link technologies. Following thedefinition in [18], the link including the optical modulator, biascircuit and detector is called intrinsic. The device parameters,including the switching, filter blocks and pre-amplificationstage are called Optical Unit (OU) parameters.
All results presented here are obtained by using an off-the-shelf detector diode from Discovery Semiconductors (DSC50)in the other end of the link.
A. Laser bias
Fig. 4 shows the basic laser biasing schematic of the OU.A current driver, implemented with a precision operationalamplifier [19], provides the basic laser DC operating point atabout 15 mA. This is according to what most manufacturersgive as the best DC bias point following
Iop = Ith + 10 [mA] (1)
where Iop is the operating current and Ith = 5 mA is thelaser diode threshold current. Due to the very low poweroperational amplifier (ISY < 1 µA [19]) the total currentconsumption of the block is effectively equal to the currentin the laser. The output optical power in this case, is around3 dBm. Temperature stabilization is implemented utilizing thebuilt in photo monitor and providing control voltage feedbackto the current driver. All values given are typical based on ahigh efficiency Emcore laser diode [20].
It can be seen from Fig. 4 that the input impedance as seenfrom the RF part will not necessarily be 50 ohm. Thereforea series resistor is needed for matching. This way of directmodulation leads to the high insertion loss of the circuit.
B. Intrinsic link gain - Gintr
Despite the name it has been shown [21] that, it is hard toachieve actual positive gain in direct modulation intrinsic links.In this case the measured gain is around −14 dB dependingon frequency. A simple theoretical formula is given in [18]Gintr = s2l r
2d = −13.6 dB, where sl = 0.30 W/A is the
laser slope efficiency and rd = 0.7 A/W is the detectorresponsivity, with their typical values. The formula assumes
perfect match between input and output impedances. Theseparameters however can vary significantly from one laser toanother.
C. Intrinsic link Noise Figure (NF) - NFintr
When calculating the system NF using Friis’ cascade equa-tion, it is worth noting that for optical links, the NF is notsimply the reciprocal of the loss as in attenuators for example.Additional noise sources such as the laser Relative IntensityNoise (RIN) and the detector shot noise, contribute to the totalnoise in the overall intrinsic link. When direct modulationis used the RIN noise is assumed dominant and calculatedaccording to [18]
NFintr = 10 lg
(2 +
(I2D10RIN10 RLOAD)
2s2l r2dkT
)≈ 26.4 [dB]
(2)where ID = OP×rd is the detector current, RIN = −150dB/Hz is the RIN from the laser specifications in dB/Hz,RLOAD = 50 ohm is the loading impedance, OP = 2 mWis the delivered optical power, k is the Boltzmann constantand finally T = 293 K is the absolute temperature. All valuesgiven are typical.
For the device presented here the measured NF is about 28-30 dB depending on frequency. From a practical point of viewsuch high noise figure is hard to measure and only the gainmethod [22] gives adequate results.
D. Intrinsic link Dynamic Range (DR) - IMF3,intr
The dynamic range is also an important parameter espe-cially when the goal is to characterize fast fading mobilechannels. Again [18] provides a simple engineering formulaIMF3,intr = 2/3(IP3,intr−(Gintr+NFintr+kT∆f)) = 58dB, for the inter-modulation free dynamic range of the intrinsiclink, where IP3 is the third order intercept point and ∆f is thebandwidth. All parameters are in dB or dBW. The calculationis made for a 40 MHz bandwidth and computed third orderintercept point of IP3,intr = −27.6 dBW.
III. PROPOSED OU
The high NF and insertion loss require a pre-amplificationblock feeding the laser. The complete device proposed hereconsists of the following major components:
• Laser bias and modulator (essentially a part of the intrin-sic optical link discussed in Section II)
• RF amplification block• DC-DC step-up converter for battery power supply• Control block for antenna switching
Fig. 5 shows the complete optical unit (OU) integrated intoa 100x40 mm phone mock-up with two PIFA antennas. Onlythe bottom cover is shown in the photo. The small devicesize allows for the complete OU to be integrated within theradiating structure, which includes the entire mock-up lengthat the lower GSM bands.
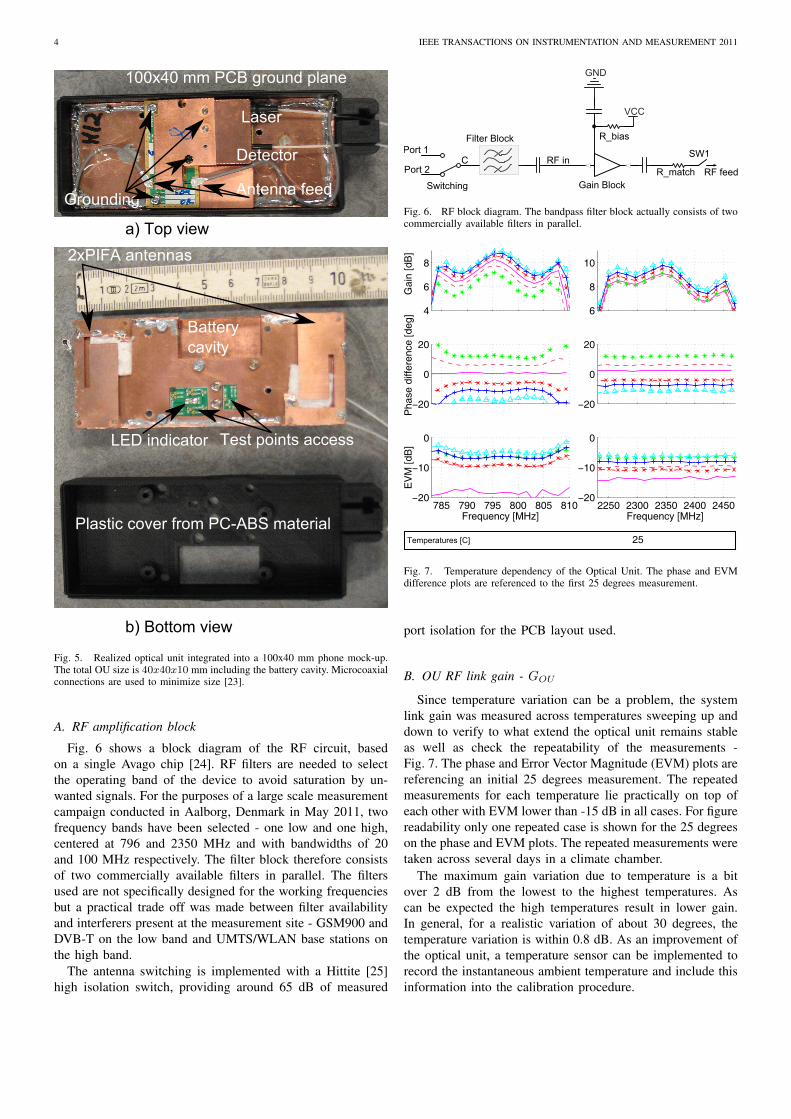
4 IEEE TRANSACTIONS ON INSTRUMENTATION AND MEASUREMENT 2011
a) Top view
b) Bottom view
Plastic cover from PC-ABS material
100x40 mm PCB ground plane
2xPIFA antennas
Battery
cavity
Test points accessLED indicator
Laser
Detector
GroundingAntenna feed
Fig. 5. Realized optical unit integrated into a 100x40 mm phone mock-up.The total OU size is 40x40x10 mm including the battery cavity. Microcoaxialconnections are used to minimize size [23].
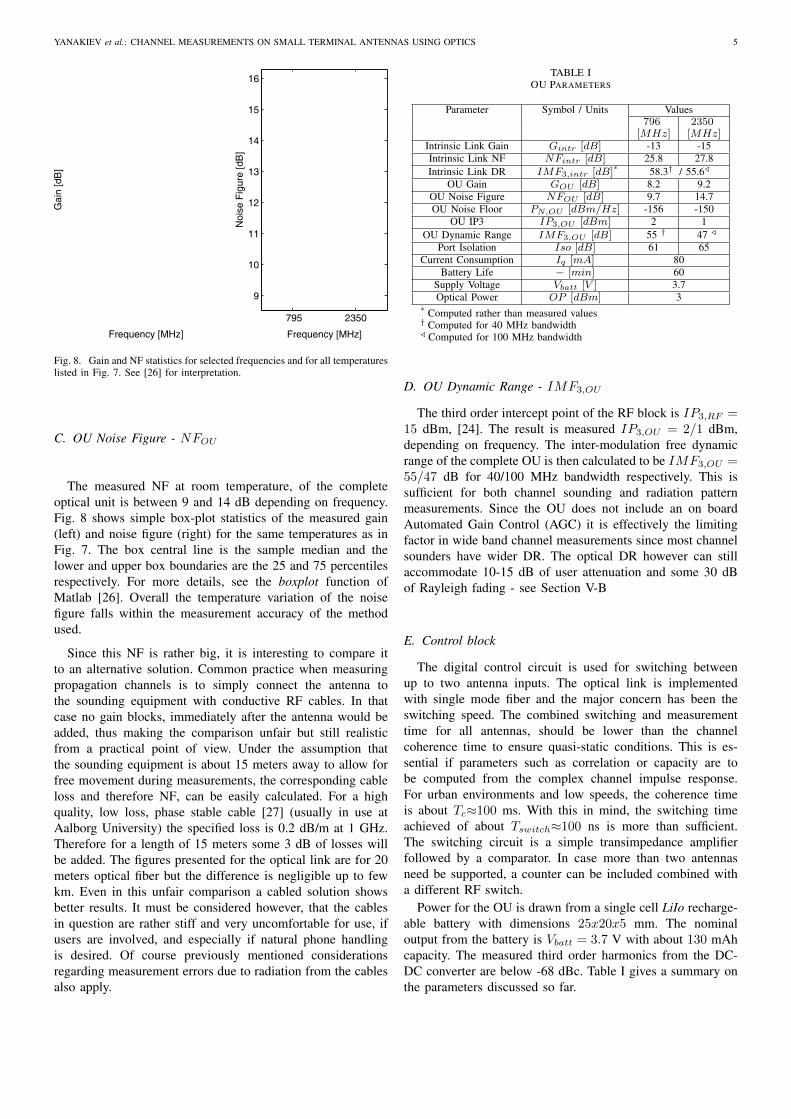
A. RF amplification block
Fig. 6 shows a block diagram of the RF circuit, basedon a single Avago chip [24]. RF filters are needed to selectthe operating band of the device to avoid saturation by un-wanted signals. For the purposes of a large scale measurementcampaign conducted in Aalborg, Denmark in May 2011, twofrequency bands have been selected - one low and one high,centered at 796 and 2350 MHz and with bandwidths of 20and 100 MHz respectively. The filter block therefore consistsof two commercially available filters in parallel. The filtersused are not specifically designed for the working frequenciesbut a practical trade off was made between filter availabilityand interferers present at the measurement site - GSM900 andDVB-T on the low band and UMTS/WLAN base stations onthe high band.
The antenna switching is implemented with a Hittite [25]high isolation switch, providing around 65 dB of measured
VCC
GND
Gain Block
Filter Block
RF inRF feed
Switching
Port 1
Port 2C
R_bias
R_match
SW1
Fig. 6. RF block diagram. The bandpass filter block actually consists of twocommercially available filters in parallel.
Fig. 7. Temperature dependency of the Optical Unit. The phase and EVMdifference plots are referenced to the first 25 degrees measurement.
port isolation for the PCB layout used.
B. OU RF link gain - GOU
Since temperature variation can be a problem, the systemlink gain was measured across temperatures sweeping up anddown to verify to what extend the optical unit remains stableas well as check the repeatability of the measurements -Fig. 7. The phase and Error Vector Magnitude (EVM) plots arereferencing an initial 25 degrees measurement. The repeatedmeasurements for each temperature lie practically on top ofeach other with EVM lower than -15 dB in all cases. For figurereadability only one repeated case is shown for the 25 degreeson the phase and EVM plots. The repeated measurements weretaken across several days in a climate chamber.
The maximum gain variation due to temperature is a bitover 2 dB from the lowest to the highest temperatures. Ascan be expected the high temperatures result in lower gain.In general, for a realistic variation of about 30 degrees, thetemperature variation is within 0.8 dB. As an improvement ofthe optical unit, a temperature sensor can be implemented torecord the instantaneous ambient temperature and include thisinformation into the calibration procedure.
YANAKIEV et al.: CHANNEL MEASUREMENTS ON SMALL TERMINAL ANTENNAS USING OPTICS 5
Frequency [MHz]
Gai
n [d
B]
795 2350
9
10
11
12
13
14
15
16
Frequency [MHz]
Noi
se F
igur
e [d
B]
Fig. 8. Gain and NF statistics for selected frequencies and for all temperatureslisted in Fig. 7. See [26] for interpretation.
C. OU Noise Figure - NFOU
The measured NF at room temperature, of the completeoptical unit is between 9 and 14 dB depending on frequency.Fig. 8 shows simple box-plot statistics of the measured gain(left) and noise figure (right) for the same temperatures as inFig. 7. The box central line is the sample median and thelower and upper box boundaries are the 25 and 75 percentilesrespectively. For more details, see the boxplot function ofMatlab [26]. Overall the temperature variation of the noisefigure falls within the measurement accuracy of the methodused.
Since this NF is rather big, it is interesting to compare itto an alternative solution. Common practice when measuringpropagation channels is to simply connect the antenna tothe sounding equipment with conductive RF cables. In thatcase no gain blocks, immediately after the antenna would beadded, thus making the comparison unfair but still realisticfrom a practical point of view. Under the assumption thatthe sounding equipment is about 15 meters away to allow forfree movement during measurements, the corresponding cableloss and therefore NF, can be easily calculated. For a highquality, low loss, phase stable cable [27] (usually in use atAalborg University) the specified loss is 0.2 dB/m at 1 GHz.Therefore for a length of 15 meters some 3 dB of losses willbe added. The figures presented for the optical link are for 20meters optical fiber but the difference is negligible up to fewkm. Even in this unfair comparison a cabled solution showsbetter results. It must be considered however, that the cablesin question are rather stiff and very uncomfortable for use, ifusers are involved, and especially if natural phone handlingis desired. Of course previously mentioned considerationsregarding measurement errors due to radiation from the cablesalso apply.
TABLE IOU PARAMETERS
Parameter Symbol / Units Values796 2350
[MHz] [MHz]Intrinsic Link Gain Gintr [dB] -13 -15Intrinsic Link NF NFintr [dB] 25.8 27.8Intrinsic Link DR IMF3,intr [dB]* 58.3† / 55.6/
OU Gain GOU [dB] 8.2 9.2OU Noise Figure NFOU [dB] 9.7 14.7OU Noise Floor PN,OU [dBm/Hz] -156 -150
OU IP3 IP3,OU [dBm] 2 1OU Dynamic Range IMF3,OU [dB] 55 † 47 /
Port Isolation Iso [dB] 61 65Current Consumption Iq [mA] 80
Battery Life − [min] 60Supply Voltage Vbatt [V ] 3.7Optical Power OP [dBm] 3
* Computed rather than measured values† Computed for 40 MHz bandwidth/ Computed for 100 MHz bandwidth
D. OU Dynamic Range - IMF3,OU
The third order intercept point of the RF block is IP3,RF =15 dBm, [24]. The result is measured IP3,OU = 2/1 dBm,depending on frequency. The inter-modulation free dynamicrange of the complete OU is then calculated to be IMF3,OU =55/47 dB for 40/100 MHz bandwidth respectively. This issufficient for both channel sounding and radiation patternmeasurements. Since the OU does not include an on boardAutomated Gain Control (AGC) it is effectively the limitingfactor in wide band channel measurements since most channelsounders have wider DR. The optical DR however can stillaccommodate 10-15 dB of user attenuation and some 30 dBof Rayleigh fading - see Section V-B
E. Control block
The digital control circuit is used for switching betweenup to two antenna inputs. The optical link is implementedwith single mode fiber and the major concern has been theswitching speed. The combined switching and measurementtime for all antennas, should be lower than the channelcoherence time to ensure quasi-static conditions. This is es-sential if parameters such as correlation or capacity are tobe computed from the complex channel impulse response.For urban environments and low speeds, the coherence timeis about Tc≈100 ms. With this in mind, the switching timeachieved of about Tswitch≈100 ns is more than sufficient.The switching circuit is a simple transimpedance amplifierfollowed by a comparator. In case more than two antennasneed be supported, a counter can be included combined witha different RF switch.
Power for the OU is drawn from a single cell LiIo recharge-able battery with dimensions 25x20x5 mm. The nominaloutput from the battery is Vbatt = 3.7 V with about 130 mAhcapacity. The measured third order harmonics from the DC-DC converter are below -68 dBc. Table I gives a summary onthe parameters discussed so far.
6 IEEE TRANSACTIONS ON INSTRUMENTATION AND MEASUREMENT 2011
I_q
[mA
]]
04080
120
V_b
att [
V]
2.53
3.5
Time [min]
VC
C [V
]
75 800
5
Time [min]
Battery 1
Fig. 9. DC-DC output voltage vs. battery depletion for two batteries.
IV. SOURCES OF ERRORS AND LINEARITY
Multiple sources of errors are possible in a measurementsystem utilizing such OU. The ones related to the OU itselfand optical fibers are analyzed here.
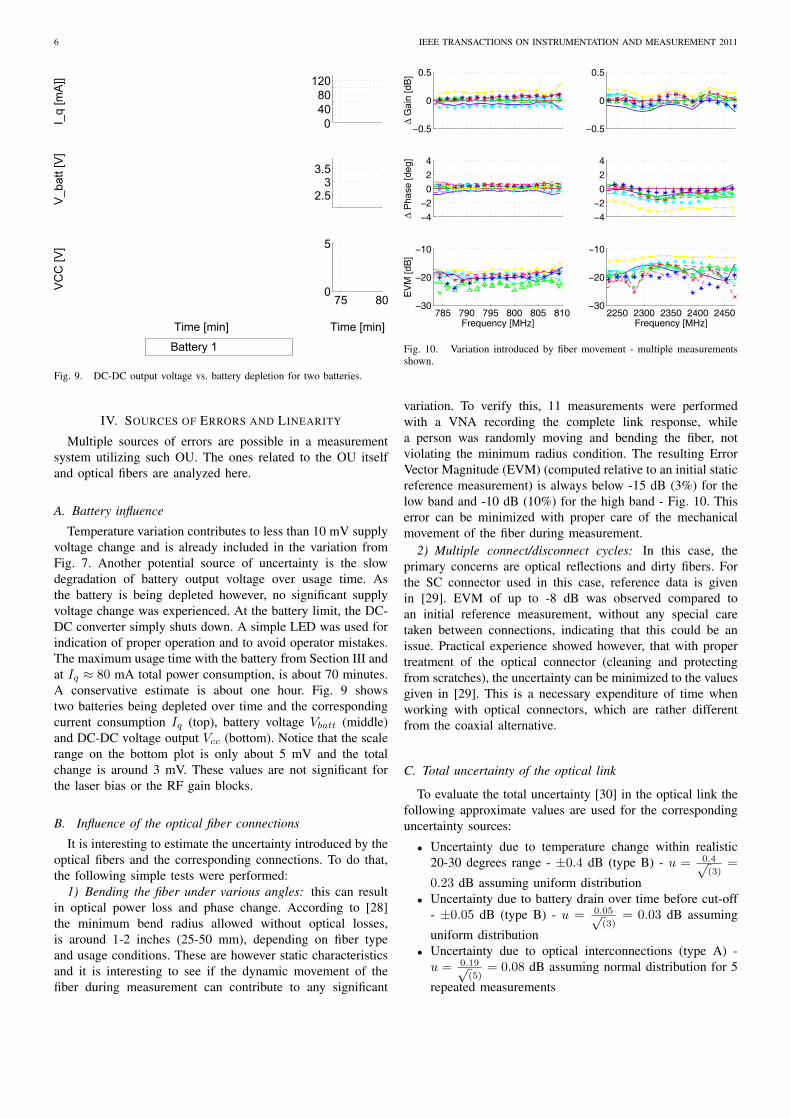
A. Battery influence
Temperature variation contributes to less than 10 mV supplyvoltage change and is already included in the variation fromFig. 7. Another potential source of uncertainty is the slowdegradation of battery output voltage over usage time. Asthe battery is being depleted however, no significant supplyvoltage change was experienced. At the battery limit, the DC-DC converter simply shuts down. A simple LED was used forindication of proper operation and to avoid operator mistakes.The maximum usage time with the battery from Section III andat Iq ≈ 80 mA total power consumption, is about 70 minutes.A conservative estimate is about one hour. Fig. 9 showstwo batteries being depleted over time and the correspondingcurrent consumption Iq (top), battery voltage Vbatt (middle)and DC-DC voltage output Vcc (bottom). Notice that the scalerange on the bottom plot is only about 5 mV and the totalchange is around 3 mV. These values are not significant forthe laser bias or the RF gain blocks.
B. Influence of the optical fiber connections
It is interesting to estimate the uncertainty introduced by theoptical fibers and the corresponding connections. To do that,the following simple tests were performed:
1) Bending the fiber under various angles: this can resultin optical power loss and phase change. According to [28]the minimum bend radius allowed without optical losses,is around 1-2 inches (25-50 mm), depending on fiber typeand usage conditions. These are however static characteristicsand it is interesting to see if the dynamic movement of thefiber during measurement can contribute to any significant
−0.5
0
0.5
∆G
ain
[dB
]
−0.5
0
0.5
−4
−2
0
2
4
∆P
hase
[deg
]
−4
−2
0
2
4
785 790 795 800 805 810−30
−20
−10
Frequency [MHz]
EV
M [d
B]
2250 2300 2350 2400 2450−30
−20
−10
Frequency [MHz]
Fig. 10. Variation introduced by fiber movement - multiple measurementsshown.
variation. To verify this, 11 measurements were performedwith a VNA recording the complete link response, whilea person was randomly moving and bending the fiber, notviolating the minimum radius condition. The resulting ErrorVector Magnitude (EVM) (computed relative to an initial staticreference measurement) is always below -15 dB (3%) for thelow band and -10 dB (10%) for the high band - Fig. 10. Thiserror can be minimized with proper care of the mechanicalmovement of the fiber during measurement.
2) Multiple connect/disconnect cycles: In this case, theprimary concerns are optical reflections and dirty fibers. Forthe SC connector used in this case, reference data is givenin [29]. EVM of up to -8 dB was observed compared toan initial reference measurement, without any special caretaken between connections, indicating that this could be anissue. Practical experience showed however, that with propertreatment of the optical connector (cleaning and protectingfrom scratches), the uncertainty can be minimized to the valuesgiven in [29]. This is a necessary expenditure of time whenworking with optical connectors, which are rather differentfrom the coaxial alternative.
C. Total uncertainty of the optical link
To evaluate the total uncertainty [30] in the optical link thefollowing approximate values are used for the correspondinguncertainty sources:
• Uncertainty due to temperature change within realistic20-30 degrees range - ±0.4 dB (type B) - u = 0.4√
(3)=
0.23 dB assuming uniform distribution• Uncertainty due to battery drain over time before cut-off
- ±0.05 dB (type B) - u = 0.05√(3)
= 0.03 dB assuming
uniform distribution• Uncertainty due to optical interconnections (type A) -u = 0.19√
(5)= 0.08 dB assuming normal distribution for 5
repeated measurements
YANAKIEV et al.: CHANNEL MEASUREMENTS ON SMALL TERMINAL ANTENNAS USING OPTICS 7
XZ Plane − Gain (Total) [dB]
−30
−20
−10
0030
60
90
120
150180
210
240
270
300
330
Cabled - 14−Mar−2011 - Weak Cable EffectCabled - 17−Feb−2011 - Stong Cable EffectCST Simulation reference
Cabled - 01−Mar−2011 - Repeated Cabled measurement
YZ Plane − Gain (Total) [dB]
−30
−20
−10
0030
60
90
120
150180
210
240
270
300
330
Optical - 01−Apr−2011 - 5 [deg] resolutionCST Simulation referenceOptical - 01−May−2011 - 15 [deg] resolution Optical - 10−May−2011 - 15 [deg] resolution
Optical - 23−Mar−2011 − 5 [deg] resolution
XY Plane − Gain (Total) [dB]0
30
60
90
120
150180
210
240
270
300
330
−30
−20
−10
0
XY Plane − Gain (Total) [dB]0
30
60
90
120
150180
210
240
270
300
330
−30
−20
−10
0
YZ Plane − Gain (Total) [dB]0
30
60
90
120
150180
210
240
270
300
330
−30
−20
−10
0
XZ Plane − Gain (Total) [dB]0
30
60
90
120
150180
210
240
270
300
330
−30
−20
−10
0
Fig. 11. Multiple 796 MHz radiation pattern measurements with cables (top three) and with optics (bottom three). The discontinuity at θ = 0 is due tomisalignment when positioning the mock-up.
• Uncertainty due to fiber movement (type A) - u =0.19√(11)
= 0.03 dB assuming normal distribution for 11
repeated measurementsThe combined uncertainty for two optical connections is
uc = 0.26 dB. Finally the expanded uncertainty with k factorof 2 (95%) is ±0.53 dB. For the target application of channelsounding this is well below the expected channel variations,therefore acceptable. The short range solution can have betteraccuracy due the possibility of using cooled lasers and staticfibers. It must be noted that other sources of uncertainty withinthe complete measurement set-up are not included in theestimate above. Also the uncertainty mentioned here is relatedonly to the gain of the optical link and does not contribute tochanges in the directivity pattern.
V. MEASUREMENT VERIFICATION
To verify the proposed device two types of measurementsare presented - controlled, anechoic chamber pattern mea-surements and outdoor-to-indoor long range channel soundingmeasurements. The goal of the first one is to demonstrate thebenefits of the optical fiber connection in terms of patternaccuracy and overall systems stability and repeatability. Thepropagation measurements presented here should be seen as
confirmation of the sufficient dynamic range, speed and signalquality the device provides.
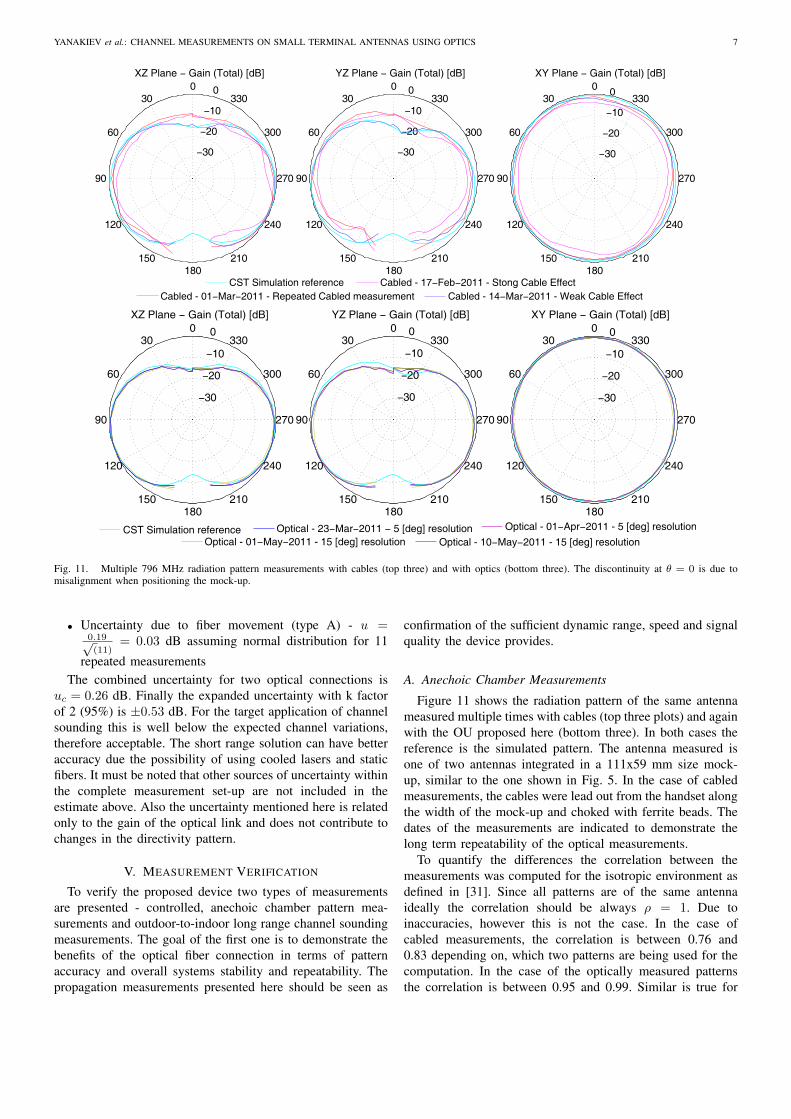
A. Anechoic Chamber Measurements
Figure 11 shows the radiation pattern of the same antennameasured multiple times with cables (top three plots) and againwith the OU proposed here (bottom three). In both cases thereference is the simulated pattern. The antenna measured isone of two antennas integrated in a 111x59 mm size mock-up, similar to the one shown in Fig. 5. In the case of cabledmeasurements, the cables were lead out from the handset alongthe width of the mock-up and choked with ferrite beads. Thedates of the measurements are indicated to demonstrate thelong term repeatability of the optical measurements.
To quantify the differences the correlation between themeasurements was computed for the isotropic environment asdefined in [31]. Since all patterns are of the same antennaideally the correlation should be always ρ = 1. Due toinaccuracies, however this is not the case. In the case ofcabled measurements, the correlation is between 0.76 and0.83 depending on, which two patterns are being used for thecomputation. In the case of the optically measured patternsthe correlation is between 0.95 and 0.99. Similar is true for
8 IEEE TRANSACTIONS ON INSTRUMENTATION AND MEASUREMENT 2011
multiple measurements on the second antenna of the mock-up.When computing the correlation between the two different
antennas of the handset, Fig. 12 is produced. The prefixes Cand O indicate cabled and optical measurements, respectively.The 5 and 15 degrees refer to both θ and φ angular steppingangles during the particular measurement, indicating that themetric is rather robust. It can be clearly seen that the cabledmeasurements produce very randomized and erroneous results,while the optical measurements have high degree of accuracyand repeatability. Similar conclusions can be extended toany antenna parameter taking into account the shape of theradiation pattern and the incoming power distribution as shownin [32].
It is worth noting that, while the accuracy of the shape ofthe radiation pattern is significantly better using optics, theantenna total efficiency accuracy is typically sacrificed, withthe uncertainties described in Section IV being higher than thecoaxial cable alternative. However this is only true assumingthe cable itself does not radiate, and ignoring for examplelosses in the used ferrite beads.
787 791 795 799 803 8070
0.1
0.2
0.3
0.4
0.5
0.6
0.7
0.8
0.9
1
Frequency [MHz]
Env
elop
e C
orre
latio
n
Fig. 12. Isotropic envelope correlation coefficient computed from multiplepattern measurements of a 111x59 mm dual antenna mock-up. The prefixesC and O indicate patterns measured with cables and optically, respectively.
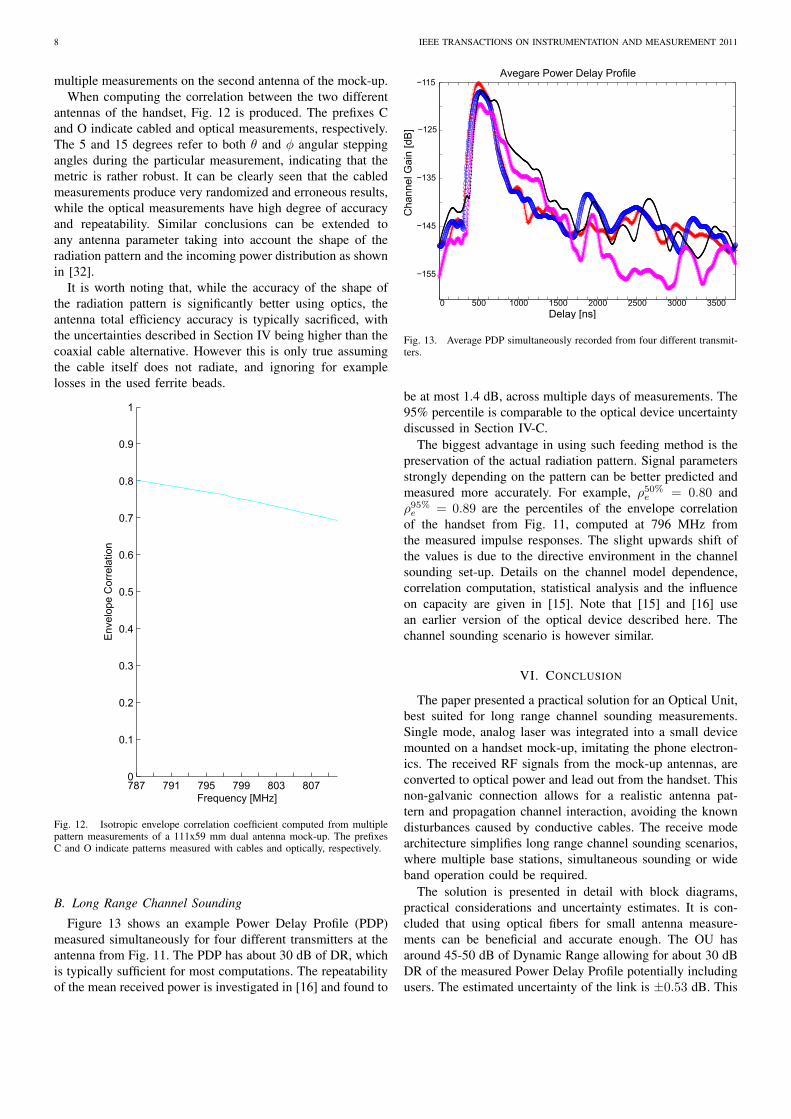
B. Long Range Channel Sounding
Figure 13 shows an example Power Delay Profile (PDP)measured simultaneously for four different transmitters at theantenna from Fig. 11. The PDP has about 30 dB of DR, whichis typically sufficient for most computations. The repeatabilityof the mean received power is investigated in [16] and found to
0 500 1000 1500 2000 2500 3000 3500
−155
−145
−135
−125
−115
Delay [ns]
Cha
nnel
Gai
n [d
B]
Avegare Power Delay Profile
Fig. 13. Average PDP simultaneously recorded from four different transmit-ters.
be at most 1.4 dB, across multiple days of measurements. The95% percentile is comparable to the optical device uncertaintydiscussed in Section IV-C.
The biggest advantage in using such feeding method is thepreservation of the actual radiation pattern. Signal parametersstrongly depending on the pattern can be better predicted andmeasured more accurately. For example, ρ50%e = 0.80 andρ95%e = 0.89 are the percentiles of the envelope correlationof the handset from Fig. 11, computed at 796 MHz fromthe measured impulse responses. The slight upwards shift ofthe values is due to the directive environment in the channelsounding set-up. Details on the channel model dependence,correlation computation, statistical analysis and the influenceon capacity are given in [15]. Note that [15] and [16] usean earlier version of the optical device described here. Thechannel sounding scenario is however similar.
VI. CONCLUSION
The paper presented a practical solution for an Optical Unit,best suited for long range channel sounding measurements.Single mode, analog laser was integrated into a small devicemounted on a handset mock-up, imitating the phone electron-ics. The received RF signals from the mock-up antennas, areconverted to optical power and lead out from the handset. Thisnon-galvanic connection allows for a realistic antenna pat-tern and propagation channel interaction, avoiding the knowndisturbances caused by conductive cables. The receive modearchitecture simplifies long range channel sounding scenarios,where multiple base stations, simultaneous sounding or wideband operation could be required.
The solution is presented in detail with block diagrams,practical considerations and uncertainty estimates. It is con-cluded that using optical fibers for small antenna measure-ments can be beneficial and accurate enough. The OU hasaround 45-50 dB of Dynamic Range allowing for about 30 dBDR of the measured Power Delay Profile potentially includingusers. The estimated uncertainty of the link is ±0.53 dB. This

YANAKIEV et al.: CHANNEL MEASUREMENTS ON SMALL TERMINAL ANTENNAS USING OPTICS 9
type of solution is preferred when working with small phoneform factors at frequencies below 1 GHz.
ACKNOWLEDGMENT
The authors would like to thank Svetoslav Gueorguiev forhis insights during the optical unit development.
REFERENCES
[1] 3GPP, 3GPP, Tech. Rep., October 2010. [Online]. Available: http://www.3gpp.org/LTE
[2] H. Wheeler, “Fundamental limitations of small antennas,” Proceedingsof the IRE, vol. 35, no. 12, pp. 1479 – 1484, dec. 1947.
[3] L. J. Chu, “Physical limitations of omni-directional antennas,” Journalof Applied Physics, vol. 19, no. 12, pp. 1163–1175, 1948. [Online].Available: http://link.aip.org/link/?JAP/19/1163/1
[4] W. A. T. Kotterman, G. F. Pedersen, and P. Eggers, “Cable-less measure-ment set-up for wireless handheld terminals,” in Personal, Indoor andMobile Radio Communications conference, PIMRC 2001, Sep. 2001, pp.B112–B116.
[5] C. Icheln, J. Ollikainen, and P. Vainikainen, “Reducing the influence offeed cables on small antenna measurements,” Electronics Letters, vol. 35,no. 15, pp. 1212 –1214, Jul. 1999.
[6] P. Massey and K. Boyle, “Controlling the effects of feed cable in smallantenna measurements,” in Antennas and Propagation, 2003. (ICAP2003). Twelfth International Conference on (Conf. Publ. No. 491), vol. 2,march-3 april 2003, pp. 561 – 564 vol.2.
[7] S. Saario, D. Thiel, J. Lu, and S. O’Keefe, “An assessment of cableradiation effects on mobile communications antenna measurements,”in Antennas and Propagation Society International Symposium, 1997.IEEE., 1997 Digest, vol. 1, jul 1997, pp. 550 –553 vol.1.
[8] 2651A/2651E Broadband Photodiode, Emcore Corporation, August2011, Data Sheet. [Online]. Available: http://emcore.com/assets/fiber/2651AE datasheet 2008.10.30.pdf
[9] I.-K. Cho, J.-I. Mun, S.-M. Kim, and J.-H. Yun, “Optical fiber linksystem for the antenna measurement,” in Photonics in Switching, 2009.PS ’09. International Conference on, sept. 2009, pp. 1 –2.
[10] R. Lao, W. Liang, Y.-S. Chen, and J. Tarng, “The use of electro-opticallink to reduce the influence of rf cables in antenna measurement,” inMicrowave, Antenna, Propagation and EMC Technologies for WirelessCommunications, 2005. MAPE 2005. IEEE International Symposium on,vol. 1, aug. 2005, pp. 427 –430 Vol. 1.
[11] N. Clow and I. Morrow, “Esa measurements using the hybrid fibre-opticreflection measurement system,” in Antennas Propagation Conference,2009. LAPC 2009. Loughborough, nov. 2009, pp. 793 –796.
[12] B. Yanakiev, P. Eggers, G. Pedersen, and T. Larsen, “Assessment ofthe Physical Interface of UHF Passive Tags for Localization,” in FirstInternational EURASIP Workshop on RFID Technology, Vienna, Austria,September 2007, pp. 25–28.
[13] B. Yanakiev, J. Ø. Nielsen, and G. F. Pedersen, “On small antenna mea-surements in a realistic MIMO scenario,” in Antennas and Propagation(EuCAP), 2010 Proceedings of the Fourth European Conference on, Apr.2010, pp. 1 –5.
[14] B. Yanakiev, J. Nielsen, and G. Pedersen, “MIMO channel measure-ments using optical links on small mobile terminals,” in Antennas andPropagation Society International Symposium (APSURSI), 2010 IEEE,Jul 2010, pp. 1 –4.
[15] B. Yanakiev, J. anddum Nielsen, M. Christensen, and G. Pedersen,“On small terminal antenna correlation and impact on MIMO channelcapacity,” Antennas and Propagation, IEEE Transactions on, vol. 60,no. 2, pp. 689 –699, feb. 2012.
[16] J. Nielsen, B. Yanakiev, I. Bonev, M. Christensen, and G. Pedersen,“User influence on MIMO channel capacity for handsets in data modeoperation,” Antennas and Propagation, IEEE Transactions on, vol. 60,no. 2, pp. 633 –643, feb. 2012.
[17] 1614W 1310 nm DFB Laser Module, Emcore Corporation, January2010, Data Sheet. [Online]. Available: http://www.emcore.com/assets/fiber/1614W datasheet 2010.01.08.pdf
[18] C. H. Cox, Analog Optical Links: theory and practice. Cambridge Uni-versity Press, 2004.
[19] LTC6078/LTC6079, Linear Technologies, Inc., 2010, Data Sheet.[Online]. Available: http://cds.linear.com/docs/Datasheet/60789fa.pdf
[20] Model 1933F/R/W Coaxial DFB Laser Diode, Emcore Corporation,August 2011, Data Sheet. [Online]. Available: http://www.emcore.com/assets/fiber/1933F-R-W datasheet 2010.12.12.pdf
[21] I. Cox, C.H., E. Ackerman, G. Betts, and J. Prince, “Limits on theperformance of rf-over-fiber links and their impact on device design,”Microwave Theory and Techniques, IEEE Transactions on, vol. 54, no. 2,pp. 906 – 920, feb. 2006.
[22] Fundamentals of RF and Microwave Noise Figure Measurements,Agilent Technologies, Inc., May 2010, Application Note 57-1. [Online].Available: http://cp.literature.agilent.com/litweb/pdf/5952-8255E.pdf
[23] Microcoaxial RF, 50 Ohm, PCB Vertical Jack Receptacle, SMT,1.25mm (.049) Mounted Height, Molex, November 2011, DataSheet. [Online]. Available: http://www.molex.com/webdocs/datasheets/pdf/en-us/0734120110 RF COAX CONNECTORS.pdf
[24] MGA-86563, 0.5 6 GHz Low Noise, GaAs MMIC Amplifier,Avago Technologies, August 2011, Data Sheet. [Online]. Available:http://www.avagotech.com/docs/AV02-2514EN
[25] HMC849LP4CE, High Isolation SPDT Non-Reflective Switch SMT,DC - 6 GHz, Hittite Microwave Corporation, August 2011, DataSheet. [Online]. Available: http://www.hittite.com/products/view.html/view/HMC849LP4CE
[26] Mathworks. (2011, August) Matlab help pages @ONLINE. [Online].Available: http://www.mathworks.se/help/toolbox/stats/boxplot.html
[27] UTiFLEX, Micro-Coax, Inc., 2010, Data Sheet. [Online]. Available:http://www.micro-coax.com/pages/technicalinfo/pdfs/UFB293C.pdf
[28] ANSI/TIA, “Optical fiber cabling components standard,” TELECOM-MUNICATIONS INDUSTRY ASSOCIATION, Tech. Rep. TIA/EIA-568-B.3, April 2000.
[29] Fiber Optic Cable Assemblies - Specifications and Dis-tribution, Molex Interconnect, 2011, Data Sheet. [On-line]. Available: http://rhu004.sma-promail.com/SQLImages/kelmscott/Molex/PDF Images/987650-6401.pdf
[30] “The expression of uncertainty and confidence in measurement,” UnitedKingdom Accreditation Service, Tech. Rep. UKAS publication M 3003,December 1997.
[31] R. Vaughan and J. Andersen, “Antenna diversity in mobile communica-tions,” Vehicular Technology, IEEE Transactions on, vol. 36, no. 4, pp.149 – 172, nov. 1987.
[32] J. Ø. Nielsen and G. Pedersen, “Mobile handset performance evaluationusing radiation pattern measurements,” Antennas and Propagation, IEEETransactions on, vol. 54, no. 7, pp. 2154 – 2165, july 2006.
10 IEEE TRANSACTIONS ON INSTRUMENTATION AND MEASUREMENT 2011
Boyan Yanakiev received a bachelors degree inphysics from Sofia University, Bulgaria in 2006 anda master’s degree in Wireless Communication anda PhD degree from Aalborg University, Denmarkin 2008 and 2011 respectively. His current positionis as an antenna design engineer at Molex AntennaBusiness Unit and an industrial postdoctoral fellowat Aalborg University. His primary interests are inthe area of small integrated mobile antennas, opticalantenna measurement techniques and radio channelmeasurements. He has been involved in the design
and development of multiple RF-to-optical convertors, for onboard handsetmeasurements.
Jesper Ødum Nielsen received his master’s degreein electronics engineering in 1994 and a PhD degreein 1997, both from Aalborg University, Denmark.He is currently employed at Department of Elec-tronic Systems at Aalborg University where mainareas of interests are experimental investigation ofthe mobile radio channel and the influence mobiledevice users have on the channel. He has beeninvolved in MIMO channel sounding and modeling,as well as measurements using live GSM and LTEnetworks. In addition he has been working with
radio performance evaluation, including over the air testing of active wirelessdevices.
Morten Christensen was born in 1973. He receivedthe M.Sc. degree in Electrical Engineering fromAalborg University, Denmark in 1998. In 1998,he joined Bosch Telecom A/S, Pandrup, Denmark(acquired by Siemens Mobile Phones in 2000),where he designed integrated antennas for mobileterminals. In 2006 he joined Motorola A/S, MobileDevices Aalborg where he was heading the EMCand Antenna department. He is now with Molex An-tenna Business Unit responsible for the RF Researchactivities. His areas of interests includes handset an-
tenna design, performance evaluation methods and radio propagation models.
Gert Frølund Pedersen was born in 1965 and mar-ried to Henriette and have 7 children. He receivedthe B.Sc. E. E. degree, with honour, in electricalengineering from College of Technology in Dublin,Ireland, and the M.Sc. E. E. degree and Ph. D.from Aalborg University in 1993 and 2003. He hasbeen employed by Aalborg University since 1993where he is now full Professor heading the Antenna,Propagation and Networking group and is also thehead of the doctoral school on wireless which some100 phd students enrolled. His research has focused
on radio communication for mobile terminals especially small Antennas,Diversity systems, Propagation and Biological effects and he has publishedmore than 75 peer reviewed papers and holds 20 patents. He has also workedas consultant for developments of more than 100 antennas for mobile terminalsincluding the first internal antenna for mobile phones in 1994 with lowestSAR, first internal triple-band antenna in 1998 with low SAR and high TRPand TIS, and lately various multi antenna systems rated as the most efficienton the market. He has been one of the pioneers in establishing over-the-airmeasurement systems. The measurement technique is now well establishedfor mobile terminals with single antennas and he was chairing the COST2100SWG2.2 group with liaison to 3GPP for over-the-air test of MIMO terminals.