aaron smith kenneth olmstead - pew research center
TRANSCRIPT

FOR RELEASE APRIL 30, 2018
BY Aaron Smith and Kenneth Olmstead
FOR MEDIA OR OTHER INQUIRIES:
Aaron Smith, Associate Director, Research
Tom Caiazza, Communications Manager
202.419.4372
www.pewresearch.org
RECOMMENDED CITATION
Pew Research Center, April 2018, “Declining Majority of
Online Adults Say the Internet Has Been Good for Society”

1
PEW RESEARCH CENTER
www.pewresearch.org
About Pew Research Center
Pew Research Center is a nonpartisan fact tank that informs the public about the issues, attitudes
and trends shaping America and the world. It does not take policy positions. It conducts public
opinion polling, demographic research, content analysis and other data-driven social science
research. The Center studies U.S. politics and policy; journalism and media; internet, science and
technology; religion and public life; Hispanic trends; global attitudes and trends; and U.S. social
and demographic trends. All of the Center’s reports are available at www.pewresearch.org. Pew
Research Center is a subsidiary of The Pew Charitable Trusts, its primary funder.
© Pew Research Center 2018
2
PEW RESEARCH CENTER
www.pewresearch.org
Declining Majority of Online Adults Say the Internet Has
Been Good for Society
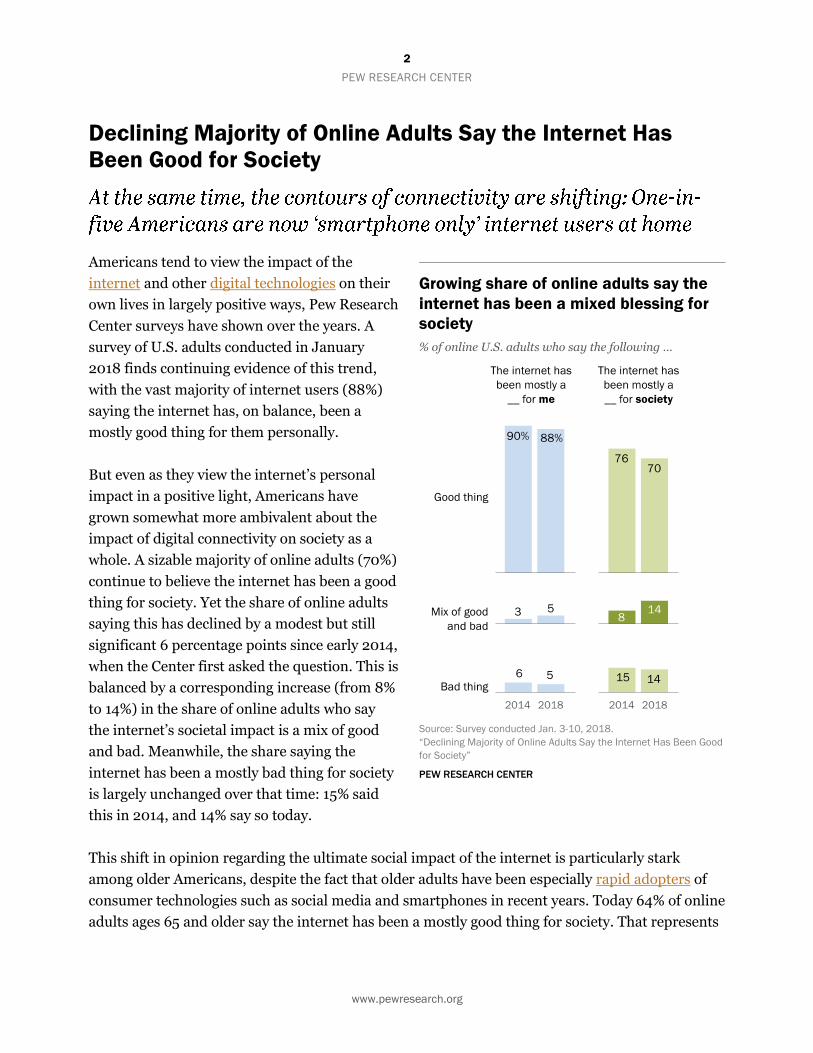
Americans tend to view the impact of the
internet and other digital technologies on their
own lives in largely positive ways, Pew Research
Center surveys have shown over the years. A
survey of U.S. adults conducted in January
2018 finds continuing evidence of this trend,
with the vast majority of internet users (88%)
saying the internet has, on balance, been a
mostly good thing for them personally.
But even as they view the internet’s personal
impact in a positive light, Americans have
grown somewhat more ambivalent about the
impact of digital connectivity on society as a
whole. A sizable majority of online adults (70%)
continue to believe the internet has been a good
thing for society. Yet the share of online adults
saying this has declined by a modest but still
significant 6 percentage points since early 2014,
when the Center first asked the question. This is
balanced by a corresponding increase (from 8%
to 14%) in the share of online adults who say
the internet’s societal impact is a mix of good
and bad. Meanwhile, the share saying the
internet has been a mostly bad thing for society
is largely unchanged over that time: 15% said
this in 2014, and 14% say so today.
This shift in opinion regarding the ultimate social impact of the internet is particularly stark
among older Americans, despite the fact that older adults have been especially rapid adopters of
consumer technologies such as social media and smartphones in recent years. Today 64% of online
adults ages 65 and older say the internet has been a mostly good thing for society. That represents
Growing share of online adults say the
internet has been a mixed blessing for
society
% of online U.S. adults who say the following …
Source: Survey conducted Jan. 3-10, 2018.
“Declining Majority of Online Adults Say the Internet Has Been Good
for Society”
PEW RESEARCH CENTER

3
PEW RESEARCH CENTER
www.pewresearch.org
a 14-point decline from the 78% who said this in 2014. The attitudes of younger adults have
remained more consistent over that time: 74% of internet users ages 18 to 29 say the internet has
been mostly good for society, comparable to the 79% who said so in 2014.
As was true in our 2014 survey, college graduates are more likely than those with lower levels of
educational attainment to say the internet has had a positive impact on society (and less likely to
say it has had a negative impact). Among online adults with a college degree, 81% say the impact of
the internet on society has been mostly good and just 7% say it has been mostly bad. By contrast,
65% of those with a high school diploma or less say the internet has had a mostly good impact on
society, and 17% say its impact has been mostly bad.
Positive views of the internet are often tied to information access and connecting with
others; negative views are based on a wider range of issues
Those who think the internet has had a good impact on society tended to focus on two key issues,
according to follow-up items which allowed respondents to explain their views in their own words.
Most (62% of those with a positive view) mentioned how the internet makes information much
easier and faster to access. Meanwhile, 23% of this group mentioned the ability to connect with
other people, or the ways in which the internet helps them keep more closely in touch with friends
and family.
By contrast, those who think the internet is a bad thing for society gave a wider range of reasons
for their opinions, with no single issue standing out. The most common theme (mentioned by 25%
of these respondents) was that the internet isolates people from each other or encourages them to
spend too much time with their devices. These responses also included references to the spread
and prevalence of fake news or other types of false information: 16% mentioned this issue. Some
14% of those who think the internet’s impact is negative cited specific concerns about its effect on
children, while 13% argued that it encourages illegal activity. A small share (5%) expressed privacy
concerns or worries about sensitive personal information being available online.
One-in-five Americans are now ‘smartphone only’ internet users at home
These attitudinal changes are occurring in a broader landscape in which the access options
available to ordinary Americans are shifting dramatically. Most notably, fully one-in-five
Americans (20%) are now “smartphone only” internet users at home – that is, they own a
smartphone but do not subscribe to traditional broadband service where they live. This represents
a 7-point increase compared with data from 2015, when 13% of Americans were smartphone-only
4
PEW RESEARCH CENTER
www.pewresearch.org
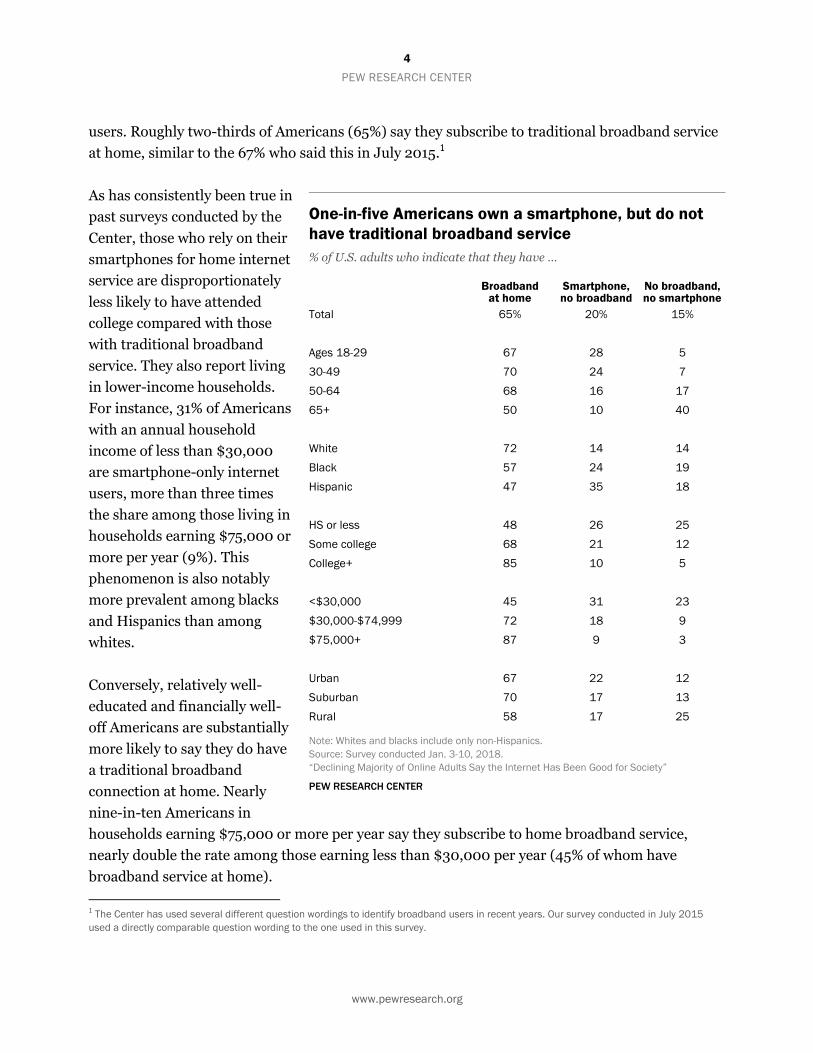
users. Roughly two-thirds of Americans (65%) say they subscribe to traditional broadband service
at home, similar to the 67% who said this in July 2015.1
As has consistently been true in
past surveys conducted by the
Center, those who rely on their
smartphones for home internet
service are disproportionately
less likely to have attended
college compared with those
with traditional broadband
service. They also report living
in lower-income households.
For instance, 31% of Americans
with an annual household
income of less than $30,000
are smartphone-only internet
users, more than three times
the share among those living in
households earning $75,000 or
more per year (9%). This
phenomenon is also notably
more prevalent among blacks
and Hispanics than among
whites.
Conversely, relatively well-
educated and financially well-
off Americans are substantially
more likely to say they do have
a traditional broadband
connection at home. Nearly
nine-in-ten Americans in
households earning $75,000 or more per year say they subscribe to home broadband service,
nearly double the rate among those earning less than $30,000 per year (45% of whom have
broadband service at home).
1 The Center has used several different question wordings to identify broadband users in recent years. Our survey conducted in July 2015
used a directly comparable question wording to the one used in this survey.
One-in-five Americans own a smartphone, but do not
have traditional broadband service
% of U.S. adults who indicate that they have …
Broadband
at home Smartphone, no broadband
No broadband, no smartphone
Total 65% 20% 15%
Ages 18-29 67 28 5
30-49 70 24 7
50-64 68 16 17
65+ 50 10 40
White 72 14 14
Black 57 24 19
Hispanic 47 35 18
HS or less 48 26 25
Some college 68 21 12
College+ 85 10 5
<$30,000 45 31 23
$30,000-$74,999 72 18 9
$75,000+ 87 9 3
Urban 67 22 12
Suburban 70 17 13
Rural 58 17 25
Note: Whites and blacks include only non-Hispanics.
Source: Survey conducted Jan. 3-10, 2018.
“Declining Majority of Online Adults Say the Internet Has Been Good for Society”
PEW RESEARCH CENTER

5
PEW RESEARCH CENTER
www.pewresearch.org
Beyond this growing reliance on smartphones for home internet service in lieu of traditional
broadband service, it is also notable that 15% of Americans indicate that they have neither
broadband service at home nor a smartphone. A large share of this group is not online at all: 11%
of Americans indicate that they do not use the internet or email from any location. In other cases,
the share without home broadband or a smartphone represents Americans who go online using
other means.
And as was the case with smartphone-only internet usage, those who lack both broadband service
and a smartphone are disproportionately likely to be from certain segments of the population.
Most notably, 40% of Americans ages 65 and older fall into this category. But this is also true for
substantial minorities of rural residents (25%), those who have not attended college (25%) and
those from households earning less than $30,000 per year (23%).

6
PEW RESEARCH CENTER
www.pewresearch.org
Acknowledgments
This report is a collaborative effort based on the input and analysis of the following individuals.
Find related reports online at pewresearch.org/internet.
Research team
Aaron Smith, Associate Director, Research
Kenneth Olmstead, Research Associate
Lee Rainie, Director, Internet and Technology Research
Andrew Perrin, Research Analyst
Editorial and graphic design
Margaret Porteus, Information Graphics Designer
David Kent, Copy Editor
Communications and web publishing
Tom Caiazza, Communications Manager
Shannon Greenwood, Associate Digital Producer

7
PEW RESEARCH CENTER
www.pewresearch.org
Methodology
The analysis in this report is based on telephone interviews conducted Jan. 3-10, 2018, among a
national sample of 2,002 adults, 18 years of age or older, living in all 50 U.S. states and the District
of Columbia (500 respondents were interviewed on a landline telephone, and 1,502 were
interviewed on a cellphone, including 1,071 who had no landline telephone). The survey was
conducted by interviewers under the direction of Abt Associates. A combination of landline and
cellphone random-digit-dial samples were used; both samples were provided by Survey Sampling
International. Interviews were conducted in English and Spanish. Respondents in the landline
sample were selected by randomly asking for the youngest adult male or female who is now at
home. Interviews in the cell sample were conducted with the person who answered the phone, if
that person was an adult 18 years of age or older. For detailed information about our survey
methodology, see: http://www.pewresearch.org/methodology/u-s-survey-research/
The combined landline and cellphone sample is weighted using an iterative technique that
matches gender, age, education, race, Hispanic origin and nativity and region to parameters from
the 2016 Census Bureau’s American Community Survey one-year estimates and population
density to parameters from the bureau’s decennial census. The sample also is weighted to match
current patterns of telephone status (landline only, cellphone only, or both landline and
cellphone), based on extrapolations from the 2016 National Health Interview Survey. The
weighting procedure also accounts for the fact that respondents with both landline and mobile
phones have a greater probability of being included in the combined sample and adjusts for
household size among respondents with a landline phone. The margins of error reported and
statistical tests of significance are adjusted to account for the survey’s design effect, a measure of
how much efficiency is lost from the weighting procedures.
The following table shows the unweighted sample sizes and the error attributable to sampling that
would be expected at the 95% level of confidence for different groups in the survey:
Group Unweighted sample size Plus or minus …
Total sample 2,002 2.4 percentage points
Ages 18-29 352 5.8
30-49 528 4.7
50-64 544 4.7
65+ 529 4.7
Total internet users 1,785 2.6

8
PEW RESEARCH CENTER
www.pewresearch.org
Sample sizes and sampling errors for other subgroups are available upon request.
In addition to sampling error, one should bear in mind that question wording and practical
difficulties in conducting surveys can introduce error or bias into the findings of opinion polls.
Pew Research Center undertakes all polling activity, including calls to mobile telephone numbers,
in compliance with the Telephone Consumer Protection Act and other applicable laws.
Pew Research Center is a nonprofit, tax-exempt 501(c)(3) organization and a subsidiary of The
Pew Charitable Trusts, its primary funder.
9
PEW RESEARCH CENTER
www.pewresearch.org
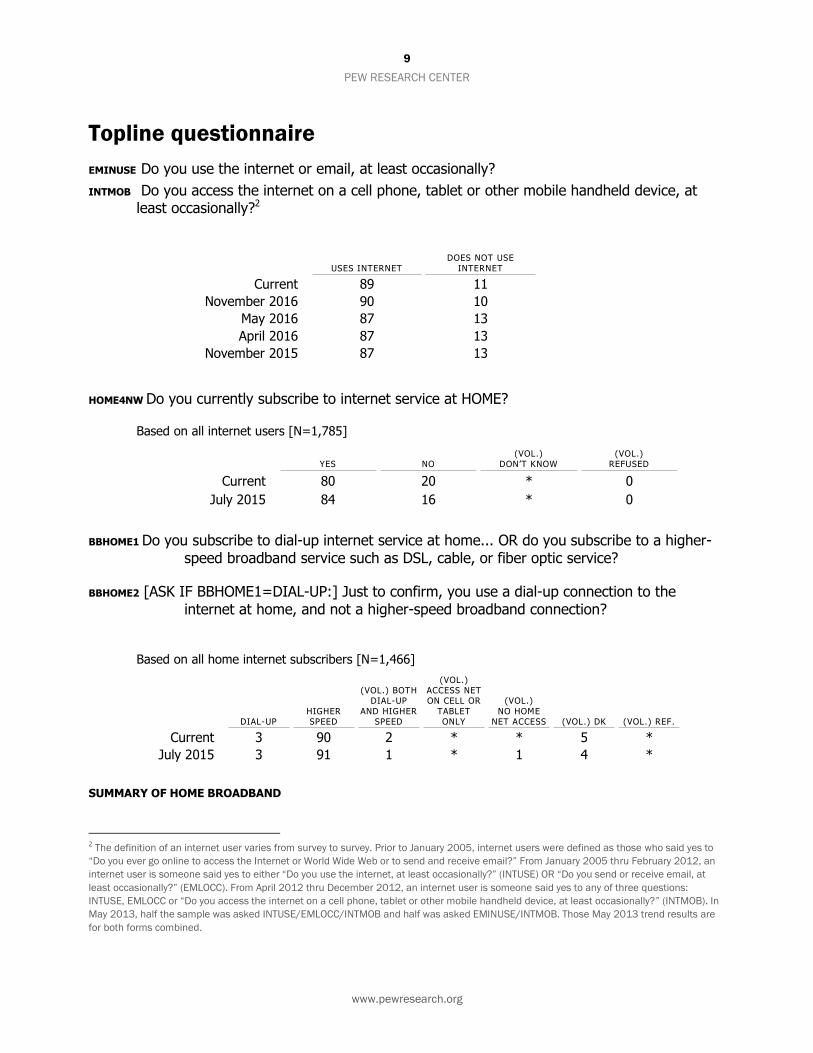
Topline questionnaire
EMINUSE Do you use the internet or email, at least occasionally?
INTMOB Do you access the internet on a cell phone, tablet or other mobile handheld device, at least occasionally?2
USES INTERNET
DOES NOT USE
INTERNET
Current 89 11
November 2016 90 10
May 2016 87 13
April 2016 87 13
November 2015 87 13
HOME4NW Do you currently subscribe to internet service at HOME?
Based on all internet users [N=1,785]
YES NO (VOL.)
DON’T KNOW (VOL.)
REFUSED
Current 80 20 * 0
July 2015 84 16 * 0
BBHOME1 Do you subscribe to dial-up internet service at home... OR do you subscribe to a higher-speed broadband service such as DSL, cable, or fiber optic service?
BBHOME2 [ASK IF BBHOME1=DIAL-UP:] Just to confirm, you use a dial-up connection to the internet at home, and not a higher-speed broadband connection?
Based on all home internet subscribers [N=1,466]
DIAL-UP HIGHER SPEED
(VOL.) BOTH DIAL-UP
AND HIGHER SPEED
(VOL.) ACCESS NET ON CELL OR
TABLET ONLY
(VOL.)
NO HOME NET ACCESS (VOL.) DK (VOL.) REF.
Current 3 90 2 * * 5 *
July 2015 3 91 1 * 1 4 *
SUMMARY OF HOME BROADBAND
2 The definition of an internet user varies from survey to survey. Prior to January 2005, internet users were defined as those who said yes to
“Do you ever go online to access the Internet or World Wide Web or to send and receive email?” From January 2005 thru February 2012, an
internet user is someone said yes to either “Do you use the internet, at least occasionally?” (INTUSE) OR “Do you send or receive email, at
least occasionally?” (EMLOCC). From April 2012 thru December 2012, an internet user is someone said yes to any of three questions:
INTUSE, EMLOCC or “Do you access the internet on a cell phone, tablet or other mobile handheld device, at least occasionally?” (INTMOB). In
May 2013, half the sample was asked INTUSE/EMLOCC/INTMOB and half was asked EMINUSE/INTMOB. Those May 2013 trend results are
for both forms combined.

10
PEW RESEARCH CENTER
www.pewresearch.org
Based on home internet subscribers [N=1,466]
CURRENT JULY 2015
% 91 Home broadband users 92
9 No home broadband/DK 8
Based on Total [N=2,002]
CURRENT JULY 2015
% 65 Home broadband users 67
35 No home broadband/DK 33
DEVICE1a Next, do you have a cell phone, or not?3
YES NO (VOL.) DON’T KNOW (VOL.) REFUSED
Current 95 5 0 0
November 2016 95 5 0 0
May 2016 92 8 0 0
April 2016 92 8 0 0
November 2015 91 9 0 0
July 2015 92 8 * *
SMART2 Is your cell phone a smartphone, or not?
Based on cell phone owners
YES, SMARTPHONE NO, NOT A
SMARTPHONE DON’T KNOW REFUSED
Current [N = 1,933] 82 17 1 *
November 2016 [N=2,926] 81 16 3 *
May 2016 [N=992] 76 17 7 0
April 2016 [N=1,535] 78 16 6 *
November 2015 [N=2,606] 76 17 7 *
July 2015 [N=1,903] 73 20 7 *
April 2015 [N=1,900] 73 21 5 *
September 2013 [N=5,763] 61 32 7 *
August 2013 [N=1,636] 60 33 6 *
May 2013 [N=2,076] 55 39 5 *
December 2012 [N=1,954] 52 41 6 *
November 2012 [N=1,992] 55 38 6 *
September 2012 [N=2,581] 53 40 6 *
April 2012 [N=1,954] 46 44 10 *
February 2012 [N=1,961] 45 46 8 *
May 2011 [N=1,914] 33 53 14 *
3 Question was asked of landline sample only. Results shown here have been recalculated to include cell phone sample in the "Yes"
percentage.

11
PEW RESEARCH CENTER
www.pewresearch.org
PIAL11 Overall, when you add up all the advantages and disadvantages of the internet, would you say the internet has mostly been [ROTATE: (a GOOD thing) or (a BAD thing)] for society?
CURRENT (BASED ON ALL
ADULTS]
CURRENT (BASED ON
INTERNET USERS)
JANUARY 2014 (BASED ON
INTERNET USERS)
% 65 Good thing 70 76 16 Bad thing 14 15
14 Some of both (VOL.) 14 8 4 Don’t know 1 1 1 Refused * *
PIAL11a What is the main reason you think the internet has been a [IF PIAL11=1 “good”; IF PIAL11=2 “bad”] thing for society? [OPEN END; RESPONSES CODED AFTER DATA COLLECTION]
Based on those who say internet has been a good thing for society [N=1,338]
CURRENT
% 62 Makes accessing information easier 23 Helps people connect
6 Other 9 Don’t know/Refused
Based on those who say internet has been a bad thing for society [N=294]
CURRENT
% 25 Isolates people 16 Fake news, misinformation
14 Bad for children 13 Criminal activities 5 Personal information/Privacy
19 Other 7 Don’t Know/Refused
PIAL12 How about you, personally? Overall, when you add up all the advantages and
disadvantages of the internet, would you say the internet has mostly been [ROTATE IN SAME ORDER AS PIAL11: (a GOOD thing) or (a BAD thing)] for you?
Based on internet users [N=1,785]
CURRENT JANUARY 2014
% 88 Good thing 90 5 Bad thing 6 5 Some of both (VOL.) 3
2 Don’t know 1 1 Refused *