aarp travel research: 2019 boomer travel trends: …...aarp 2019 boomer travel trends study | 2 a...
TRANSCRIPT
AARP 2019 Boomer Travel Trends Study | https://doi.org/10.26419/res.00263.003 1
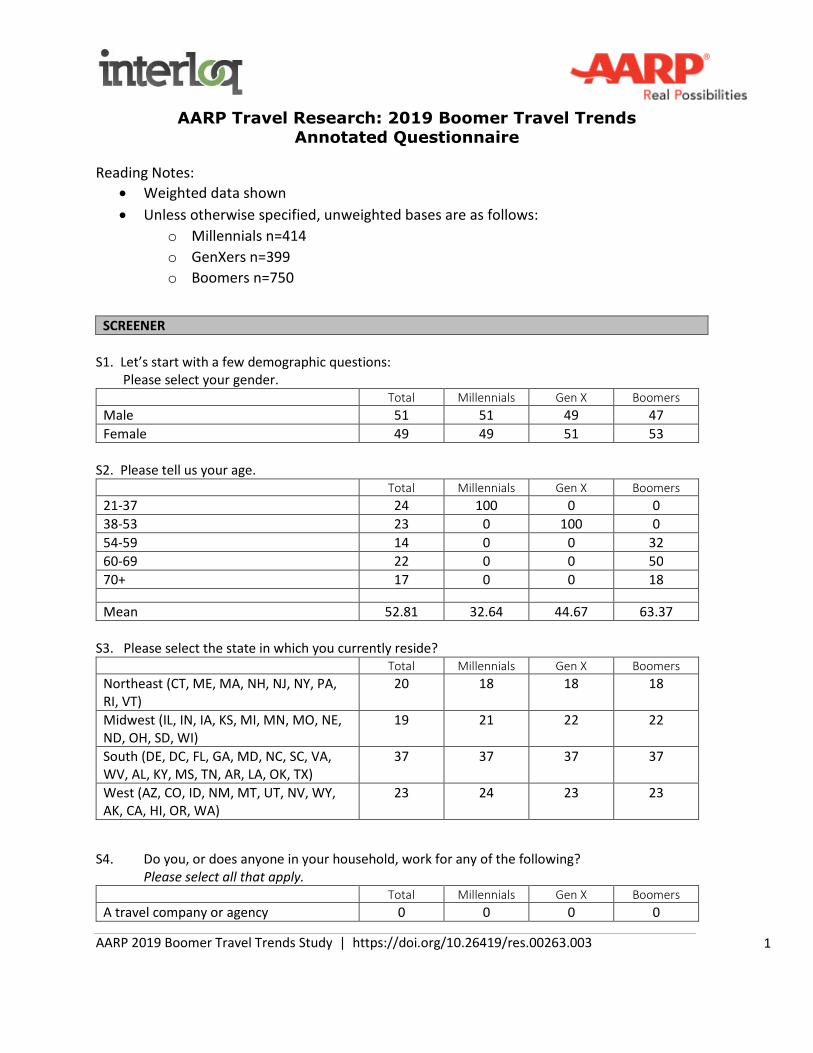
AARP Travel Research: 2019 Boomer Travel TrendsAnnotated Questionnaire
Reading Notes:
• Weighted data shown
• Unless otherwise specified, unweighted bases are as follows:
o Millennials n=414
o GenXers n=399
o Boomers n=750
SCREENER
S1. Let’s start with a few demographic questions:Please select your gender.
Total Millennials Gen X Boomers
Male 51 51 49 47
Female 49 49 51 53
S2. Please tell us your age.Total Millennials Gen X Boomers
21-37 24 100 0 0
38-53 23 0 100 0
54-59 14 0 0 32
60-69 22 0 0 50
70+ 17 0 0 18
Mean 52.81 32.64 44.67 63.37
S3. Please select the state in which you currently reside?Total Millennials Gen X Boomers
Northeast (CT, ME, MA, NH, NJ, NY, PA,RI, VT)
20 18 18 18
Midwest (IL, IN, IA, KS, MI, MN, MO, NE,ND, OH, SD, WI)
19 21 22 22
South (DE, DC, FL, GA, MD, NC, SC, VA,WV, AL, KY, MS, TN, AR, LA, OK, TX)
37 37 37 37
West (AZ, CO, ID, NM, MT, UT, NV, WY,AK, CA, HI, OR, WA)
23 24 23 23
S4. Do you, or does anyone in your household, work for any of the following?Please select all that apply.
Total Millennials Gen X Boomers
A travel company or agency 0 0 0 0

AARP 2019 Boomer Travel Trends Study | https://doi.org/10.26419/res.00263.003 2
A hotel or other hospitality company orprovider
0 0 0 0
A market research company or marketresearch department
0 0 0 0
A newspaper, radio or TVstation/program
0 0 0 0
An advertising agency 0 0 0 0
An airline, cruise or tour company 0 0 0 0
A sales promotion or public relationsagency
0 0 0 0
None of the above 100 100 100 100
S5a. Are you of Hispanic or Latino origin (ethnicity)?
Total Millennials Gen X Boomers
Yes 15 20 16 9
No 85 80 84 91
S5b. What is your race? Select all that applyTotal Millennials Gen X Boomers
White/Caucasian 72 78 79 81
Black/African American 16 14 13 11
Asian/Asian American 7 6 6 4
Native American 2 1 1 1
Other (Please Specify) 4 3 2 4
HRACE - ADD BEFORE hRaceTotal Millennials Gen X Boomers
Hispanic 15 20 16 9
Caucasian 60 60 65 73
Black/African American 15 12 12 10
Asian 7 5 5 4
Native American 0 0 0 0
Other 3 3 1 3
S6a. Which of the following best describes your current employment status?Total Millennials Gen X Boomers
Full-time employee 51 82 79 30
Full-time self employed 3 2 4 3
Part-time worker 7 7 6 7
Homemaker 3 5 5 2
Not currently working 2 3 2 2
Student 1 2 1 0
Retired 33 0 3 56

AARP 2019 Boomer Travel Trends Study | https://doi.org/10.26419/res.00263.003 3
S6b. What is your current annual household income, before taxes?Total Millennials Gen X Boomers
Below $20,000 (18) 2 5 1 0
$20,000 - $29,999 (25) 1 3 2 0
$30,000 - $49,999 (40) 16 13 11 17
$50,000 - $74,999 (62.5) 22 19 22 25
$75,000 - $99,999 (87.5) 21 26 20 21
$100,000 - $149,999 (125) 23 23 27 22
$150,000 or more (175) 14 11 16 15
Prefer not to answer 0 0 0 0
Mean in Thousands 93.73 89.94 99.31 94.48
S7a. Which of the following organizations are you currently a member of? Select all that applyTotal Millennials Gen X Boomers
Amazon Prime 51 68 58 44
Costco 41 44 42 41
AAA ('Triple A') 41 29 37 47
AARP 35 0 15 58
USAA 14 22 15 10
None of the above 13 16 15 9
S7b. In the past two years, which of the following travel sites have you visited? Select all that applyTotal Millennials Gen X Boomers
Hotel, Airline or Rental Car websites 85 79 83 88
Travel booking websites (i.e. Expedia,Travelocity, Orbitz, etc)
76 80 79 73
Review websites (TripAdvisor, Yelp, etc.) 64 70 67 64
Other Travel Sites (Please Specify) 9 3 6 12
None of the above 0 0 0 0
S8. In the past 2 years, how many personal trips did you take where you traveled at least 50 miles awayfrom home and stayed two or more nights? This could be within the U.S. or abroad. By personaltravel, we mean a vacation, getaway, or family-related trip; not business-related travel.
Total Millennials Gen X Boomers
None 0 0 0 0
One 5 5 5 5
Two 12 11 11 12
Three 10 11 12 9
Four or more 73 72 72 75
Mean 7.01 7.21 7.25 6.89
S9. And how many of those [S8 RESPONSE] personal trips (non-business related travel) were taken inthe past year, just thinking about the calendar year of 2018?

AARP 2019 Boomer Travel Trends Study | https://doi.org/10.26419/res.00263.003 4
Total Millennials Gen X Boomers
0 3 3 4 3
1 17 16 17 17
2 28 26 26 27
3 17 14 18 18
4 11 12 8 14
5-9 17 18 18 17
10+ 7 11 8 6
Mean 3.70 4.27 3.86 3.53
S10. How many more personal trips (non-business related travel) do you anticipate taking between nowand the end of the year?
Total Millennials Gen X Boomers
0 11 8 8 13
1 38 31 39 38
2 27 27 26 26
3 11 12 10 11
4+ 14 22 16 12
Mean 2.27 3.07 2.43 1.93
S11. And finally, how many personal trips do you anticipate taking next year, in the calendar year of2019? Your best estimate is fine.As a reminder, by personal travel we are referring to those trips where you travel at least 50 milesaway from home and stay two or more nights. This could be within the U.S. or abroad, but they arefor personal reasons only, not business related travel.
Total Millennials Gen X Boomers
1 10 12 11 10
2 24 24 25 21
3 21 18 19 22
4 14 12 13 15
5 9 10 9 9
6-10 16 16 16 17
11+ 6 8 8 5
Mean 4.60 4.92 4.93 4.42
SURVEY
Q1. Today’s survey is about your travel plans for the 2019 calendar year (January 2019 throughDecember 2019).
Q1a. A moment ago you mentioned you anticipate taking [S11 RESPONSE] personal trip(s) in 2019. Howmany of these will be an international trip and how many will be a domestic trip? Your bestestimate is fine.

AARP 2019 Boomer Travel Trends Study | https://doi.org/10.26419/res.00263.003 5
1. International Total Millennials Gen X Boomers
0 41 31 40 47
1 35 33 36 33
2 16 17 14 15
3 4 5 4 4
4+ 4 13 6 1
Mean incl. 0 1.13 1.86 1.20 0.81
Mean excl. 0 1.91 2.71 1.99 1.52
2. Domestic Total Millennials Gen X Boomers
0 6 7 5 6
1 22 28 23 18
2 25 25 25 24
3 17 13 16 18
4+ 30 27 30 34
Mean incl. 0 3.38 2.96 3.58 3.58
Mean excl. 0 3.59 3.17 3.79 3.79
INTERNATIONAL TRIPSASK IF Q1a_INTERNATIONAL =1 OR MORE, OTHERWISE SKIP TO Q4]Q2/Q2d. Let’s start by talking about your international trip(s).
For the international trip(s) you plan on taking next year, please read the list of trip types belowand select your primary motivation for EACH trip.
Total Millennials Gen X Boomers
Base: Total International Trips 1712 602 418 598
Bucket list trip, to check something offmy bucket list
15 7 8 24
Summer vacation 12 14 14 10
Family trip (parents, grandparents,children, all going to one destination tobe together)
11 11 13 7
Romantic getaway 9 9 9 10
Celebration vacation, to celebrate a lifemilestone
9 7 9 8
Solo vacation, traveling without friends,family, or significant other. It's a trip justfor you.
7 7 8 6
Family reunion 6 8 5 5
Holiday travel (Thanksgiving, Christmas,Hanukkah, etc.)
5 6 7 3
Spring break trip 4 7 5 2
Weekend getaway 4 5 6 2
AARP 2019 Boomer Travel Trends Study | https://doi.org/10.26419/res.00263.003 6
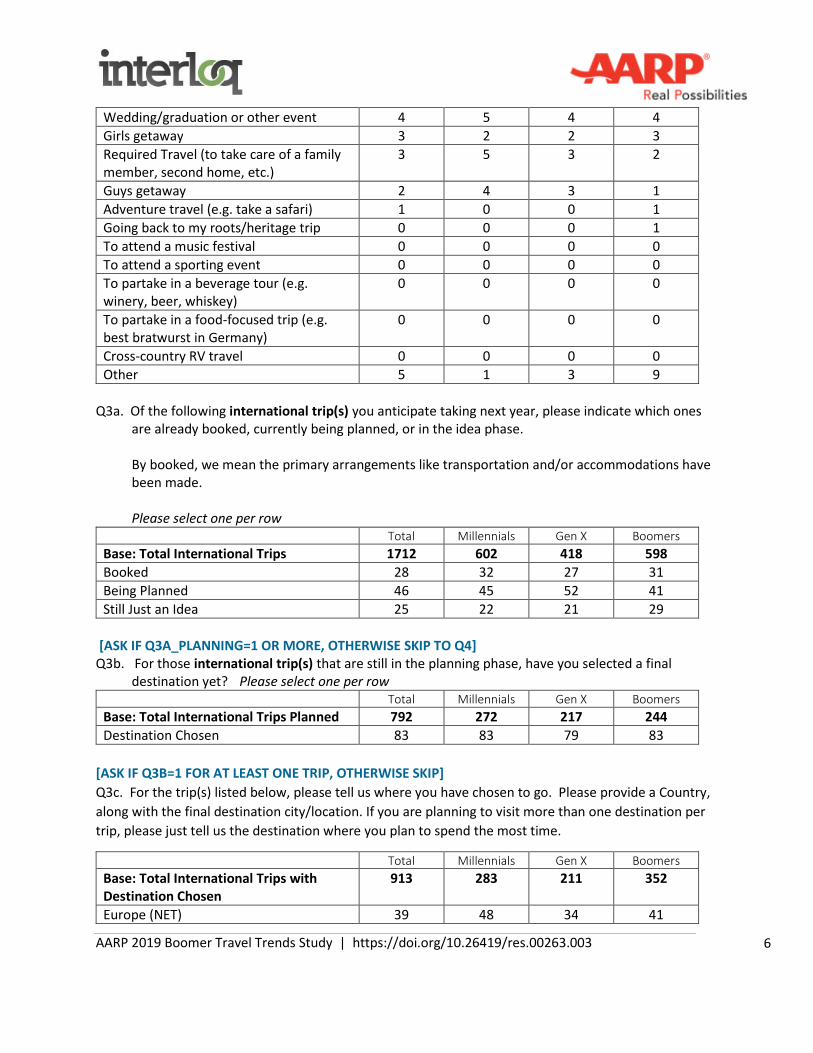
Wedding/graduation or other event 4 5 4 4
Girls getaway 3 2 2 3
Required Travel (to take care of a familymember, second home, etc.)
3 5 3 2
Guys getaway 2 4 3 1
Adventure travel (e.g. take a safari) 1 0 0 1
Going back to my roots/heritage trip 0 0 0 1
To attend a music festival 0 0 0 0
To attend a sporting event 0 0 0 0
To partake in a beverage tour (e.g.winery, beer, whiskey)
0 0 0 0
To partake in a food-focused trip (e.g.best bratwurst in Germany)
0 0 0 0
Cross-country RV travel 0 0 0 0
Other 5 1 3 9
Q3a. Of the following international trip(s) you anticipate taking next year, please indicate which onesare already booked, currently being planned, or in the idea phase.
By booked, we mean the primary arrangements like transportation and/or accommodations havebeen made.
Please select one per rowTotal Millennials Gen X Boomers
Base: Total International Trips 1712 602 418 598
Booked 28 32 27 31
Being Planned 46 45 52 41
Still Just an Idea 25 22 21 29
[ASK IF Q3A_PLANNING=1 OR MORE, OTHERWISE SKIP TO Q4]Q3b. For those international trip(s) that are still in the planning phase, have you selected a final
destination yet? Please select one per rowTotal Millennials Gen X Boomers
Base: Total International Trips Planned 792 272 217 244
Destination Chosen 83 83 79 83
[ASK IF Q3B=1 FOR AT LEAST ONE TRIP, OTHERWISE SKIP]
Q3c. For the trip(s) listed below, please tell us where you have chosen to go. Please provide a Country,
along with the final destination city/location. If you are planning to visit more than one destination per
trip, please just tell us the destination where you plan to spend the most time.
Total Millennials Gen X Boomers
Base: Total International Trips withDestination Chosen
913 283 211 352
Europe (NET) 39 48 34 41

AARP 2019 Boomer Travel Trends Study | https://doi.org/10.26419/res.00263.003 7
UK/Ireland 8 15 8 6
Italy 6 6 2 9
France 6 8 8 5
Caribbean/South America (NET) 34 27 37 33
Asia/Middle East (NET) 14 10 17 11
Canada (NET) 9 12 8 10
[ASK IF Q3B=1 FOR AT LEAST ONE TRIP, OTHERWISE SKIP TO Q4]
Q3d. What are all the different modes of transportation you will use to get to the internationaldestinations you plan on visiting next year? Select all that apply
Total Millennials Gen X Boomers
Base: Destination Chosen ForInternational Trip(s)
713 222 168 267
Airplane 86 85 87 86
Cruise ship 26 20 20 31
Rental vehicle 21 29 21 18
Personal vehicle 18 21 22 15
Train 18 23 19 18
Bus 12 19 10 11
Other (Specify) 2 2 3 3
Not sure yet 1 0 1 1
Q3e. Which of the following best describes the different types of accommodations you will be staying at
during your international travel next year? Select all that apply
Total Millennials Gen X Boomers
Base: Destination Chosen ForInternational Trip(s)
713 222 168 267
Hotel/Motel 60 60 62 62
Resort 26 35 30 15
Cruise ship cabin 26 18 18 33
With Friends or Family 22 35 26 15
Airbnb, VRBO, HomeAway, etc. (managedby owner)
17 30 22 13
Bed & Breakfast 14 25 11 10
Rental Home (managed by a company) 11 25 13 3
RV/Campground 4 13 4 0
Other (Specify) 2 1 0 4
Not sure yet 1 1 1 2
Q30a. Regarding the international trips you just detailed for us, are any of these trips going to be takenby grandparents and grandchildren only in 2019?
Total Millennials Gen X Boomers
Base: Taking International Trip(s) 1015 285 240 399
Yes (NET) 17 40 20 7

AARP 2019 Boomer Travel Trends Study | https://doi.org/10.26419/res.00263.003 8
Yes, I will be going with mygrandchild(ren)
14 32 16 6
Yes, I will be going with mygrandparent(s)
3 9 4 1
No 83 60 80 93
[ASK IF Q30A=1 (GRANDPARENT), OTHERWISE SKIPQ31a_1. Thinking specifically about the international trips you will take with your grandchild(ren) in
2019, which of the following best describes the planning of this trip?Total Millennials Gen X Boomers
Base - Grandparent 140 91 38 23
I will be doing most of the planning 74 81 69 73
The child's parent will be doing most ofthe planning
20 18 19 16
My grandchild(ren) will be doing most ofthe planning
3 1 4 0
My grandchild(ren) and I will be planningit together
2 0 4 11
Other (Please specify) 0 0 0 0
Don't know 1 0 4 0
[ASK IF Q30A=2 (GRANDCHILD), OTHERWISE SKIPQ31a_2. Thinking specifically about the international trips you will take with your grandparent(s) in
2019, which of the following best describes the planning of this trip?Total Millennials Gen X Boomers
Base – Grandchild 34 24 10 3
I will be doing most of the planning 88 87 87 100
My parent(s) will be doing most of theplanning
9 13 7 0
My grandparent(s) will be doing most ofthe planning
3 0 5 0
My grandparent(s) and I will be planningit together
0 0 0 0
Other (Please specify) 0 0 0 0
Don't know 0 0 0 0
[ASK IF Q30A=1 (GRANDPARENT), OTHERWISE SKIPQ32a_1. And regarding the cost of the international trips you will take with your grandchild(ren) in
2019, which of the following best describes how the costs will be covered for this trip?Total Millennials Gen X Boomers
Base - Grandparent 140 91 38 23
I will be paying for most of it 71 76 65 56
The child's parent will be paying for mostof it
23 22 30 17

AARP 2019 Boomer Travel Trends Study | https://doi.org/10.26419/res.00263.003 9
My grandchild(ren) and I will each bepaying for ourselves
4 1 1 14
My grandchild(ren) will be paying formost of it
1 0 0 5
Other (Please specify) 1 0 0 8
Don't know 1 0 4 0
[ASK IF Q30A=2 (GRANDCHILD), OTHERWISE SKIPQ32a_2. Thinking specifically about the international trips you will take with your grandparent(s) in
2019, which of the following best describes how the costs will be covered for this trip?Total Millennials Gen X Boomers
Base – Grandchild 34 24 10 3
I will be paying for most of it 71 86 72 0
My parent(s) will be paying for most of it 15 10 13 50
My grandparent(s) and I will each bepaying for ourselves
12 4 15 0
My grandparent(s) will be paying formost of it
0 0 0 0
Other (Please specify) 3 0 0 50
Don't know 0 0 0 0
DOMESTIC TRIPS[ASK IF Q1a_DOMESTIC =1 OR MORE, OTHERWISE SKIP TO Q33]
Q4/Q4d. Of the domestic trip(s) you plan on taking next year, please read the list of trip typesbelow and select your primary motivation for EACH trip.
Total Millennials Gen X Boomers
Base: Total Domestic Trips 4549 1012 1052 2103
Summer vacation 13 11 14 13
Weekend getaway 12 13 13 12
Family trip (parents, grandparents,children, all going to one destination tobe together)
12 14 12 10
Holiday travel (Thanksgiving, Christmas,Hanukkah, etc.)
9 10 11 8
Romantic getaway 8 8 10 6
Celebration vacation, to celebrate a lifemilestone
7 7 5 7
Solo vacation, traveling without friends,family, or significant other. It's a trip justfor you.
6 6 5 6
Family reunion 6 8 5 6
Bucket list trip, to check something offmy bucket list
6 5 5 7
Spring break trip 4 7 5 3

AARP 2019 Boomer Travel Trends Study | https://doi.org/10.26419/res.00263.003 10
Required Travel (to take care of a familymember, second home, etc.)
3 2 2 4
Wedding/graduation or other event 3 4 3 2
Girls getaway 3 2 3 3
Guys getaway 2 2 3 1
Adventure travel (e.g. take a safari) 1 0 1 1
To attend a sporting event 1 0 0 1
Cross-country RV travel 0 0 0 1
To attend a music festival 0 0 0 0
To partake in a food-focused trip (e.g.best bratwurst in Germany)
0 0 0 0
Going back to my roots/heritage trip 0 0 0 0
To partake in a beverage tour (e.g.winery, beer, whiskey)
0 0 0 0
Other 6 1 2 8
Q5a. Of the following domestic trip(s) you anticipate taking next year, please indicate which ones arealready booked, currently being planned, or in the idea phase.
By booked, we mean the primary arrangements like transportation and/or accommodations havebeen made. Please select one per row
Total Millennials Gen X Boomers
Base: Total Domestic Trips 4549 1012 1052 2103
Booked 16 23 18 14
Being Planned 42 43 43 39
Still Just an Idea 41 34 39 47
[ASK IF Q5A_PLANNING=1 OR MORE, OTHERWISE SKIP TO Q9c]
Q5b. For those domestic trip(s) that are still in the planning phase, have you selected a final destination
yet? Please select one per row
Total Millennials Gen X Boomers
Base: Total Domestic Trips Planned 1931 436 453 825
Destination Chosen 85 84 77 88
[ASK IF Q5B=1 FOR AT LEAST ONE TRIP, OTHERWISE SKIP]
Q5c. For the trip(s) listed below, please tell us where you have chosen to go. Please provide a State,
along with the final destination city/location. If you are planning to visit more than one destination per
trip, please just tell us the destination where you plan to spend the most time.
Base: Total Domestic Trips withDestination Chosen
2010 452 468 882
South (NET) 40 40 42 38
Florida 18 19 18 17
Texas 5 5 7 5
AARP 2019 Boomer Travel Trends Study | https://doi.org/10.26419/res.00263.003 11
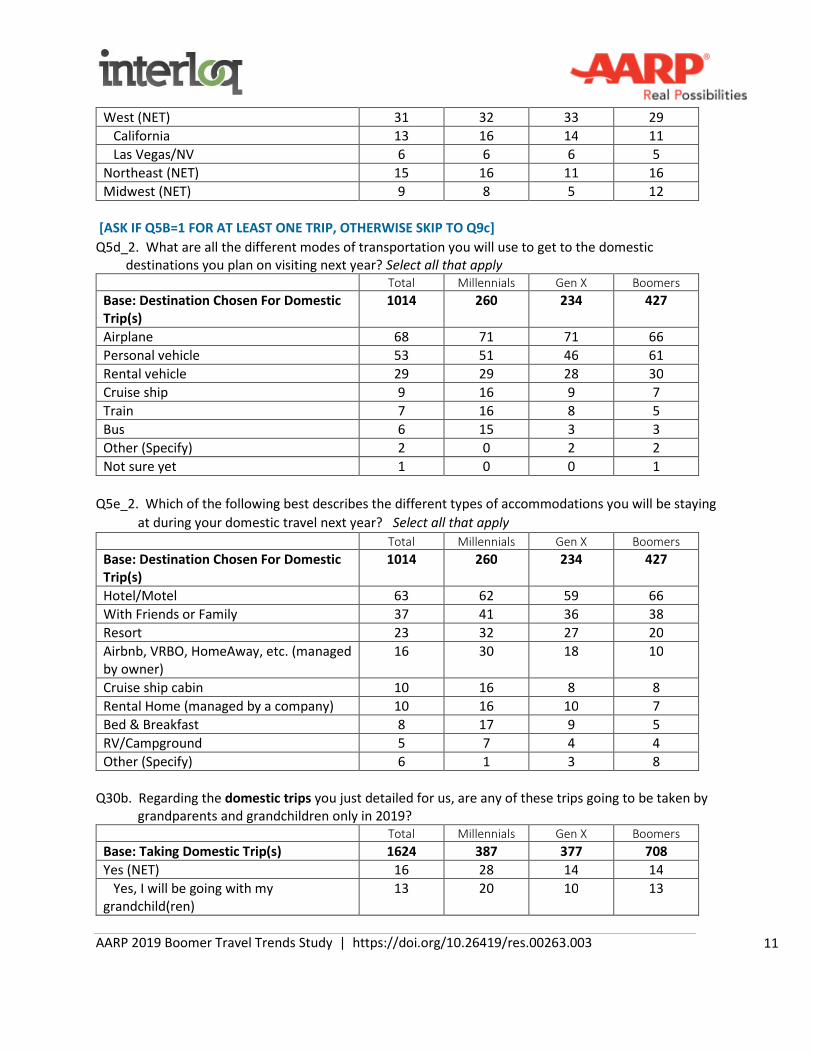
West (NET) 31 32 33 29
California 13 16 14 11
Las Vegas/NV 6 6 6 5
Northeast (NET) 15 16 11 16
Midwest (NET) 9 8 5 12
[ASK IF Q5B=1 FOR AT LEAST ONE TRIP, OTHERWISE SKIP TO Q9c]
Q5d_2. What are all the different modes of transportation you will use to get to the domesticdestinations you plan on visiting next year? Select all that apply
Total Millennials Gen X Boomers
Base: Destination Chosen For DomesticTrip(s)
1014 260 234 427
Airplane 68 71 71 66
Personal vehicle 53 51 46 61
Rental vehicle 29 29 28 30
Cruise ship 9 16 9 7
Train 7 16 8 5
Bus 6 15 3 3
Other (Specify) 2 0 2 2
Not sure yet 1 0 0 1
Q5e_2. Which of the following best describes the different types of accommodations you will be staying
at during your domestic travel next year? Select all that apply
Total Millennials Gen X Boomers
Base: Destination Chosen For DomesticTrip(s)
1014 260 234 427
Hotel/Motel 63 62 59 66
With Friends or Family 37 41 36 38
Resort 23 32 27 20
Airbnb, VRBO, HomeAway, etc. (managedby owner)
16 30 18 10
Cruise ship cabin 10 16 8 8
Rental Home (managed by a company) 10 16 10 7
Bed & Breakfast 8 17 9 5
RV/Campground 5 7 4 4
Other (Specify) 6 1 3 8
Q30b. Regarding the domestic trips you just detailed for us, are any of these trips going to be taken bygrandparents and grandchildren only in 2019?
Total Millennials Gen X Boomers
Base: Taking Domestic Trip(s) 1624 387 377 708
Yes (NET) 16 28 14 14
Yes, I will be going with mygrandchild(ren)
13 20 10 13
AARP 2019 Boomer Travel Trends Study | https://doi.org/10.26419/res.00263.003 12
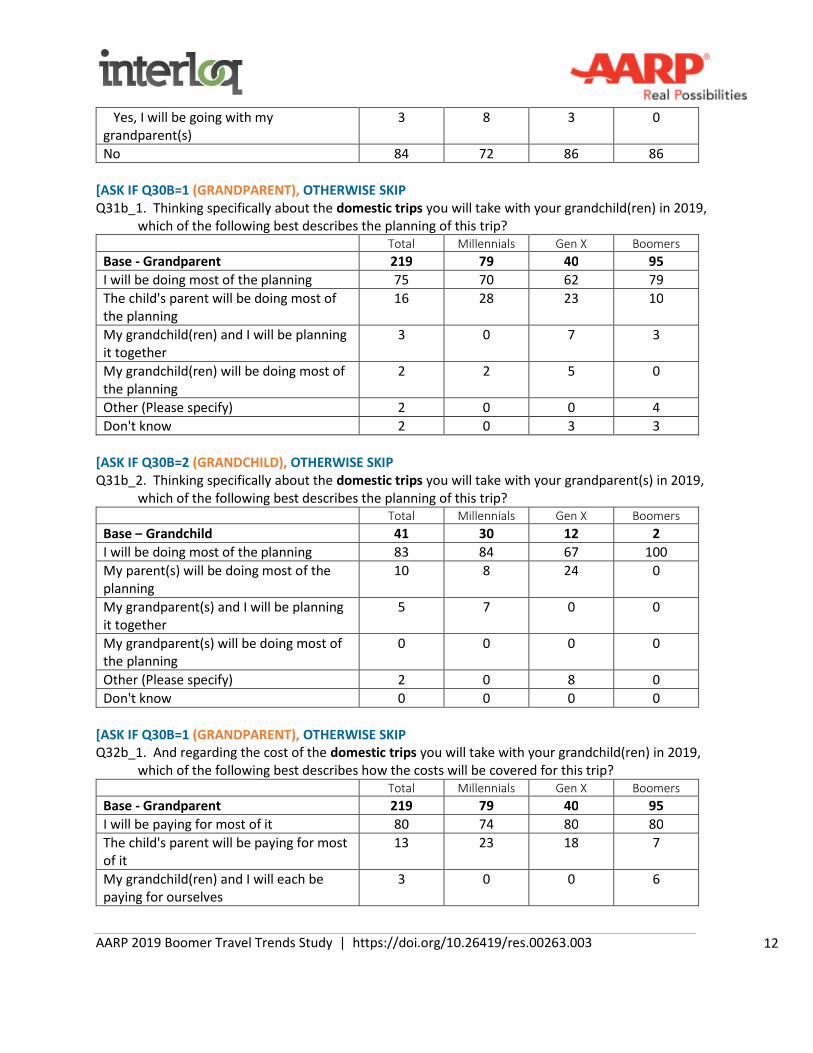
Yes, I will be going with mygrandparent(s)
3 8 3 0
No 84 72 86 86
[ASK IF Q30B=1 (GRANDPARENT), OTHERWISE SKIPQ31b_1. Thinking specifically about the domestic trips you will take with your grandchild(ren) in 2019,
which of the following best describes the planning of this trip?Total Millennials Gen X Boomers
Base - Grandparent 219 79 40 95
I will be doing most of the planning 75 70 62 79
The child's parent will be doing most ofthe planning
16 28 23 10
My grandchild(ren) and I will be planningit together
3 0 7 3
My grandchild(ren) will be doing most ofthe planning
2 2 5 0
Other (Please specify) 2 0 0 4
Don't know 2 0 3 3
[ASK IF Q30B=2 (GRANDCHILD), OTHERWISE SKIPQ31b_2. Thinking specifically about the domestic trips you will take with your grandparent(s) in 2019,
which of the following best describes the planning of this trip?Total Millennials Gen X Boomers
Base – Grandchild 41 30 12 2
I will be doing most of the planning 83 84 67 100
My parent(s) will be doing most of theplanning
10 8 24 0
My grandparent(s) and I will be planningit together
5 7 0 0
My grandparent(s) will be doing most ofthe planning
0 0 0 0
Other (Please specify) 2 0 8 0
Don't know 0 0 0 0
[ASK IF Q30B=1 (GRANDPARENT), OTHERWISE SKIPQ32b_1. And regarding the cost of the domestic trips you will take with your grandchild(ren) in 2019,
which of the following best describes how the costs will be covered for this trip?Total Millennials Gen X Boomers
Base - Grandparent 219 79 40 95
I will be paying for most of it 80 74 80 80
The child's parent will be paying for mostof it
13 23 18 7
My grandchild(ren) and I will each bepaying for ourselves
3 0 0 6

AARP 2019 Boomer Travel Trends Study | https://doi.org/10.26419/res.00263.003 13
My grandchild(ren) will be paying formost of it
1 2 2 0
Other (Please specify) 3 1 0 5
Don't know 0 0 0 1
[ASK IF Q30B=2 (GRANDCHILD), OTHERWISE SKIPQ32b_2. Thinking specifically about the domestic trips you will take with your grandparent(s) in 2019,
which of the following best describes how the costs will be covered for this trip?Total Millennials Gen X Boomers
Base: Grandchild 41 30 12 2
I will be paying for most of it 59 65 53 72
My grandparent(s) and I will each bepaying for ourselves
17 8 23 0
My parent(s) will be paying for most of it 15 23 0 28
My grandparent(s) will be paying formost of it
2 0 11 0
Other (Please specify) 5 0 13 0
Don't know 2 4 0 0
HERITAGE TRAVEL DEEP DIVE[ASK IF Q2d=1 or Q4d=1 (TAKING HERITAGE TRIP IN 2019), OTHERWISE SKIP TO Q9C]
Q33. Earlier you mentioned you are anticipating at least one Heritage trip in 2019, going back to
discover your roots or accompanying someone going back to discover theirs. So to clarify, whose
roots/home town is at the focus of this trip?
Total Millennials Gen X Boomers
Base: Anticipates Taking Heritage Trip 14 0 0 13
Mine, my immediate family's (e.g.Mother's/Father's)
79 0 0 79
My significant other's 21 0 0 21
Another family member's 0 0 0 0
My friend's 0 0 0 0
Other (Please specify) 0 0 0 0
[ASK IF Q33=1, OTHERWISE SKIP]Q34a. Best you can pinpoint, what motivating factor(s) got you wanting to take this kind of a trip? Select
all that apply.
Total Millennials Gen X Boomers
Base: Visiting Own Roots/Home Town 11 0 0 10
I have thought about it/talked about itfor a long time
45 0 0 51
I finally have the time/money 36 0 0 29
After talking to relatives 18 0 0 20
It just recently became important to me 18 0 0 10

AARP 2019 Travel Trends Study | Interloq, LLC 14
After doing some research onancestry.com
9 0 0 7
A specific travel promotion caught myeye
9 0 0 7
After obtaining DNA data from 23 andMe (or something similar)
0 0 0 0
Other (Please specify) 18 0 0 24
Don't recall 0 0 0 0
Q34b. To what degree does this Heritage trip overlap with destinations on your Bucket List?
Total Millennials Gen X Boomers
Base: Anticipates Taking Heritage Trip 14 0 0 13
100%, they are one in the same 29 0 0 27
Some Bucket List trips are Heritage trips,some are not
14 0 0 11
0%, my Bucket List trips are a totallyseparate list
7 0 0 5
I don't have a travel Bucket List 50 0 0 57
Q35. How many days will you spend visiting/exploring [your/their] roots/home town?
Total Millennials Gen X Boomers
Base: Anticipates Taking Heritage Trip 14 0 0 13
2 7 0 0 8
3 21 0 0 23
6 7 0 0 8
7 14 0 0 12
11 7 0 0 10
14 29 0 0 22
17 7 0 0 7
21 7 0 0 11
Mean 9.71 0.00 0.00 9.69
GENERAL TRAVEL INFOQ9c. While traveling in 2019, which of the following “authentic” experiences do you have an interest in?
Please select all that apply1. International Total Millennials Gen X Boomers
Base: Taking International Trip(s) 1015 285 240 399
Eat meals with locals 59 67 60 53
Tour with locals 52 58 52 50
Stay with locals 28 41 31 22
Other (Please specify) 3 1 2 3
None of the above 23 10 19 32
2. Domestic Total Millennials Gen X Boomers

AARP 2019 Travel Trends Study | Interloq, LLC 15
Base: Taking Domestic Trip(s) 1624 387 377 708
Eat meals with locals 47 55 47 42
Stay with locals 26 32 30 22
Tour with locals 29 37 32 24
Other (Please specify) 3 0 1 4
None of the above 39 24 33 47
[ASK IF Q3E=7 OR Q5E_2=7, OTHERWISE SKIP]Q13b. Earlier you indicated you anticipate renting a home from a home owner through a service such as
Airbnb, VRBO, etc. What do you believe are the benefits of using this type of an accommodationover other options such as motels, hotels, etc.? Please select all that apply.
Total Millennials Gen X Boomers
Base: Will Be Staying At Home Service 237 114 65 65
More amenities (e.g. kitchen,washer/dryer)
59 54 52 72
Cost of the accommodations is lessexpensive
59 49 53 74
Makes the trip less expensive (e.g. meals,beverages)
54 49 51 62
More space 52 50 49 61
To live more like a local/a more authenticexperience
43 36 51 46
Better locations 43 50 44 40
Can accommodate larger groups 37 43 30 40
Other (Please specify) 2 0 0 6
None of the above 0 0 0 0
[ASK IF Q3E≠7 AND Q5E_2≠7, OTHERWISE SKIP] Q13c. Earlier you did not indicate interest in renting a home from a home owner through a service such
as Airbnb, VRBO, etc. for any of your upcoming trip(s). Which of the following best describes whythat is? Please select all that apply.
Total Millennials Gen X Boomers
Base: Will Not Be Staying At HomeService
1487 300 334 685
I prefer hotel services (e.g. room service,concierge)
45 43 38 47
I don't need that much space 19 22 17 19
Doesn't feel as safe 15 20 16 12
Not familiar with the option 15 15 17 14
Don't want to be in a residential area 13 11 14 14
I have heard negative reviews of suchoptions
11 12 12 9
Don't want to be off the beaten path 9 8 13 7
Other (Please specify) 13 5 8 17
None of the above 13 14 11 14

AARP 2019 Travel Trends Study | Interloq, LLC 16
Q9b. From the list below, please select your top three motivators for your 2019 travel plans. Please
select up to three.
Total Millennials Gen X Boomers
To spend time with family or friends 52 45 46 57
To relax and rejuvenate 47 37 49 48
To get away from normal, everyday life 46 41 41 47
To visit somewhere I've always wanted togo
33 27 33 37
To share a new experience with mysignificant other
27 22 24 30
To go on an adventure 25 31 29 24
To try something new 22 31 25 17
To improve my health 6 13 7 2
To scout a place for my retirement 4 8 6 2
To scout a place for a new job/relocation 3 8 5 0
Other (Specify) 3 0 1 3
Q13d. Now that you have thought through your anticipated travel plans for 2019, approximately howmuch do you expect to spend on travel in 2019, in total? Your best estimate is fine. Please enter awhole dollar amount without using a comma or period.
Total Millennials Gen X Boomers
1-250 2 7 2 1
251-500 5 11 4 4
501-750 2 3 2 1
751-1000 8 10 6 7
1001-2500 20 23 21 18
2501-5000 30 26 34 30
5001-7500 8 6 10 10
7501-10000 12 7 11 14
10001+ 12 7 10 14
Mean 5937 4403 5400 6621
Q13e. And how does [Q13d RESPONSE] compare to your travel expenditures in 2018?Total Millennials Gen X Boomers
Travel spend will be higher in 2019 41 52 45 35
Travel spend will be about the same in2019
48 41 47 52
Travel spend will be lower in 2019 11 8 9 13

AARP 2019 Travel Trends Study | Interloq, LLC 17
Q5h. Please indicate the types of travel related loyalty programs you are currently a member of.Select all that apply
Total Millennials Gen X Boomers
Use ANY Awards Program (NET) 91 87 91 93
Airlines (e.g. AAdvantage, MileagePlus,Rapid Rewards)
73 66 68 78
Hotel (e.g. Hilton Honors, MarriottRewards, Starwood Preferred Guest)
72 64 72 76
Car Rental (e.g. Avis Preferred, HertzGold, Emerald Club)
40 35 40 40
Cruise Line (e.g. Disney, Princess,Norwegian)
23 17 18 27
Other Travel Programs (Specify) 2 0 2 2
None of the above 9 13 9 7
[ASK IF Q5h=1:3,6; OTHERWISE SKIP]Q5i. How often do you book with your travel loyalty program provider versus other options in the
marketplace when making leisure travel arrangements?1. Airlines Total Millennials Gen X Boomers
Base: Member of Airlines LoyaltyProgram(s)
1260 272 271 582
Top Two Box (NET) 75 81 73 75
I always use my loyalty provider 38 46 40 34
I use my loyalty provider most of thetime
38 35 32 41
I use my loyalty provider some of thetime
19 14 22 20
Bottom Two Box (NET) 6 5 6 5
I rarely use my loyalty provider 4 3 4 3
I never use my loyalty provider 2 2 2 2
2. Hotel Total Millennials Gen X Boomers
Base: Member of Hotel LoyaltyProgram(s)
1246 265 287 568
Top Two Box (NET) 69 78 69 65
I always use my loyalty provider 28 38 32 23
I use my loyalty provider most of thetime
41 39 37 43
I use my loyalty provider some of thetime
25 19 24 28
Bottom Two Box (NET) 7 3 7 7
I rarely use my loyalty provider 5 3 5 5
I never use my loyalty provider 1 0 1 2

AARP 2019 Travel Trends Study | Interloq, LLC 18
3. Car Rental Total Millennials Gen X Boomers
Base: Member of Car Rental LoyaltyProgram(s)
682 147 159 297
Top Two Box (NET) 72 83 74 67
I always use my loyalty provider 37 42 43 32
I use my loyalty provider most of thetime
35 41 30 35
I use my loyalty provider some of thetime
21 14 20 25
Bottom Two Box (NET) 7 4 7 8
I rarely use my loyalty provider 6 3 5 7
I never use my loyalty provider 1 0 2 1
4. Cruise Line Total Millennials Gen X Boomers
Base: Member of Cruise Line LoyaltyProgram(s)
394 69 72 205
Top Two Box (NET) 76 82 74 75
I always use my loyalty provider 39 44 44 38
I use my loyalty provider most of thetime
37 38 30 37
I use my loyalty provider some of thetime
16 14 18 17
Bottom Two Box (NET) 8 4 7 8
I rarely use my loyalty provider 6 3 3 7
I never use my loyalty provider 2 1 4 1
Q36. For which of the following type of trips do you typically bring a smartphone? Select all that apply.
Total Millennials Gen X Boomers
Domestic Travel 91 93 95 92
International Travel 59 70 59 54
Neither 6 0 2 7
[ASK IF Q36=1,2, OTHERWISE SKIP]
Q37. How important to your trip is your smartphone?
1. Domestic Total Millennials Gen X Boomers
Base: Takes Smartphone For DomesticTravel
1572 384 378 692
Couldn't imagine traveling without it 67 71 69 64
Certainly helpful, but more nice to havethan have to have
27 20 27 30
Could take it or leave it, minimal impacton my trip
6 8 4 6
AARP 2019 Travel Trends Study | Interloq, LLC 19
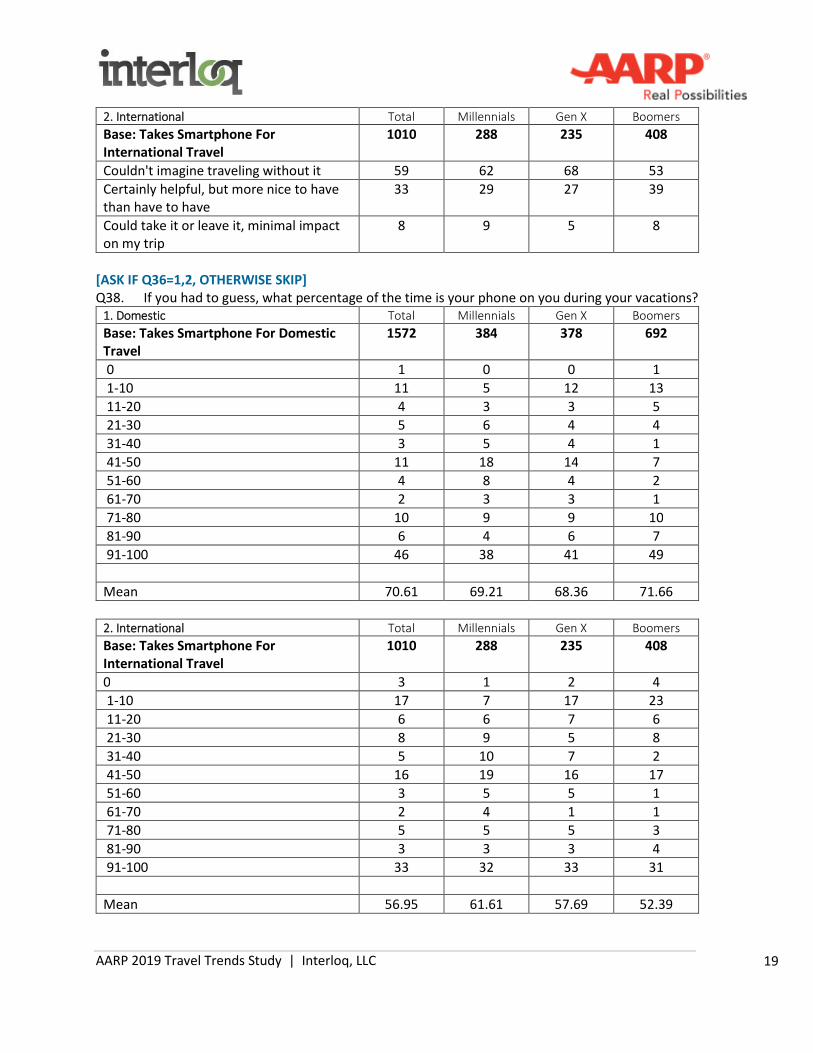
2. International Total Millennials Gen X Boomers
Base: Takes Smartphone ForInternational Travel
1010 288 235 408
Couldn't imagine traveling without it 59 62 68 53
Certainly helpful, but more nice to havethan have to have
33 29 27 39
Could take it or leave it, minimal impacton my trip
8 9 5 8
[ASK IF Q36=1,2, OTHERWISE SKIP]Q38. If you had to guess, what percentage of the time is your phone on you during your vacations?
1. Domestic Total Millennials Gen X Boomers
Base: Takes Smartphone For DomesticTravel
1572 384 378 692
0 1 0 0 1
1-10 11 5 12 13
11-20 4 3 3 5
21-30 5 6 4 4
31-40 3 5 4 1
41-50 11 18 14 7
51-60 4 8 4 2
61-70 2 3 3 1
71-80 10 9 9 10
81-90 6 4 6 7
91-100 46 38 41 49
Mean 70.61 69.21 68.36 71.66
2. International Total Millennials Gen X Boomers
Base: Takes Smartphone ForInternational Travel
1010 288 235 408
0 3 1 2 4
1-10 17 7 17 23
11-20 6 6 7 6
21-30 8 9 5 8
31-40 5 10 7 2
41-50 16 19 16 17
51-60 3 5 5 1
61-70 2 4 1 1
71-80 5 5 5 3
81-90 3 3 3 4
91-100 33 32 33 31
Mean 56.95 61.61 57.69 52.39
AARP 2019 Travel Trends Study | Interloq, LLC 20
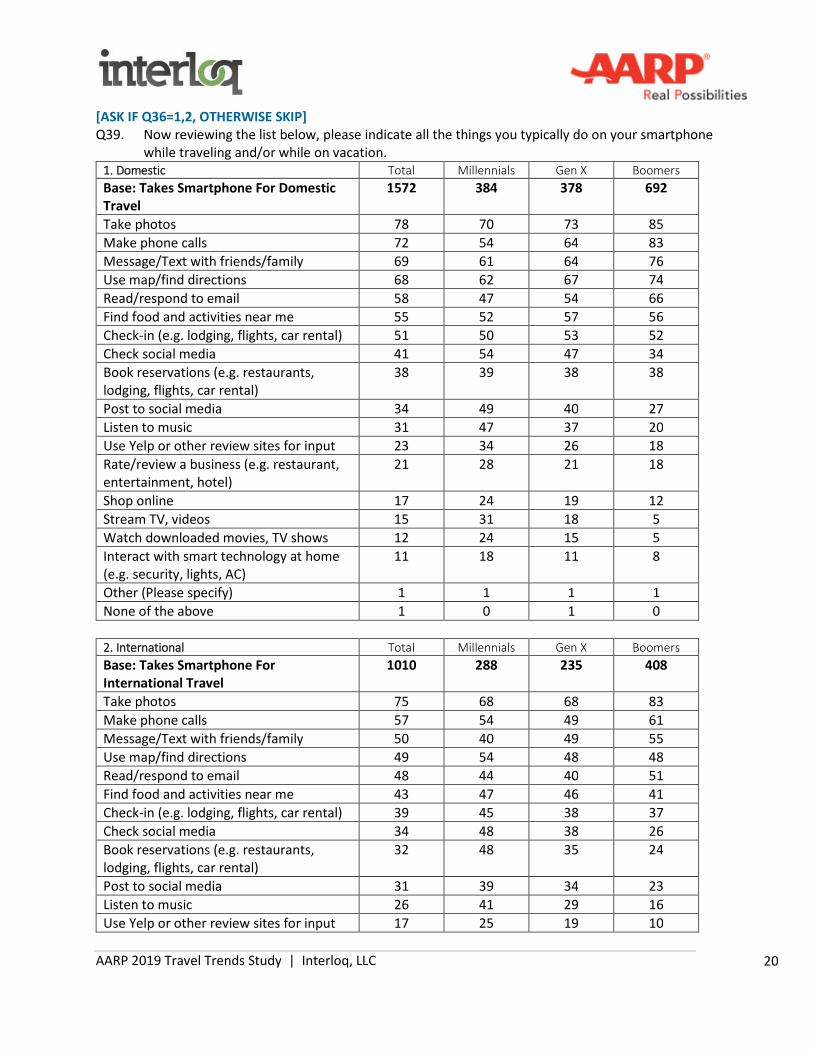
[ASK IF Q36=1,2, OTHERWISE SKIP]Q39. Now reviewing the list below, please indicate all the things you typically do on your smartphone
while traveling and/or while on vacation.1. Domestic Total Millennials Gen X Boomers
Base: Takes Smartphone For DomesticTravel
1572 384 378 692
Take photos 78 70 73 85
Make phone calls 72 54 64 83
Message/Text with friends/family 69 61 64 76
Use map/find directions 68 62 67 74
Read/respond to email 58 47 54 66
Find food and activities near me 55 52 57 56
Check-in (e.g. lodging, flights, car rental) 51 50 53 52
Check social media 41 54 47 34
Book reservations (e.g. restaurants,lodging, flights, car rental)
38 39 38 38
Post to social media 34 49 40 27
Listen to music 31 47 37 20
Use Yelp or other review sites for input 23 34 26 18
Rate/review a business (e.g. restaurant,entertainment, hotel)
21 28 21 18
Shop online 17 24 19 12
Stream TV, videos 15 31 18 5
Watch downloaded movies, TV shows 12 24 15 5
Interact with smart technology at home(e.g. security, lights, AC)
11 18 11 8
Other (Please specify) 1 1 1 1
None of the above 1 0 1 0
2. International Total Millennials Gen X Boomers
Base: Takes Smartphone ForInternational Travel
1010 288 235 408
Take photos 75 68 68 83
Make phone calls 57 54 49 61
Message/Text with friends/family 50 40 49 55
Use map/find directions 49 54 48 48
Read/respond to email 48 44 40 51
Find food and activities near me 43 47 46 41
Check-in (e.g. lodging, flights, car rental) 39 45 38 37
Check social media 34 48 38 26
Book reservations (e.g. restaurants,lodging, flights, car rental)
32 48 35 24
Post to social media 31 39 34 23
Listen to music 26 41 29 16
Use Yelp or other review sites for input 17 25 19 10
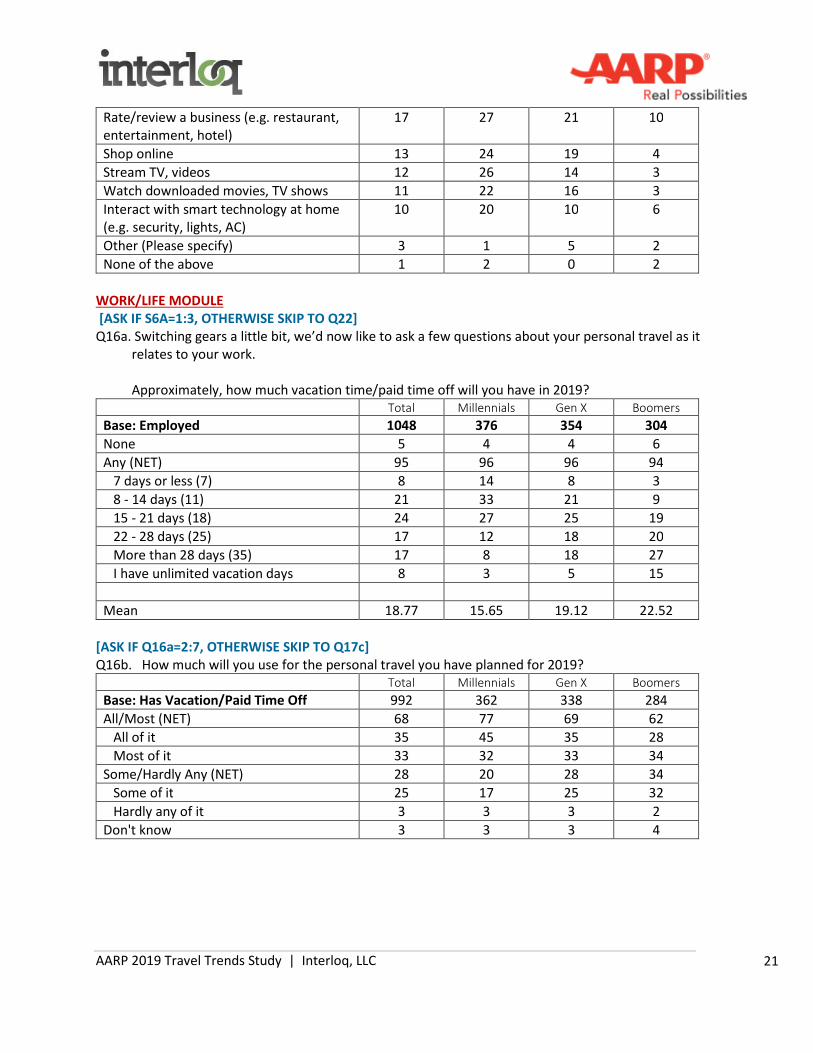
AARP 2019 Travel Trends Study | Interloq, LLC 21
Rate/review a business (e.g. restaurant,entertainment, hotel)
17 27 21 10
Shop online 13 24 19 4
Stream TV, videos 12 26 14 3
Watch downloaded movies, TV shows 11 22 16 3
Interact with smart technology at home(e.g. security, lights, AC)
10 20 10 6
Other (Please specify) 3 1 5 2
None of the above 1 2 0 2
WORK/LIFE MODULE[ASK IF S6A=1:3, OTHERWISE SKIP TO Q22]
Q16a. Switching gears a little bit, we’d now like to ask a few questions about your personal travel as itrelates to your work.
Approximately, how much vacation time/paid time off will you have in 2019?Total Millennials Gen X Boomers
Base: Employed 1048 376 354 304
None 5 4 4 6
Any (NET) 95 96 96 94
7 days or less (7) 8 14 8 3
8 - 14 days (11) 21 33 21 9
15 - 21 days (18) 24 27 25 19
22 - 28 days (25) 17 12 18 20
More than 28 days (35) 17 8 18 27
I have unlimited vacation days 8 3 5 15
Mean 18.77 15.65 19.12 22.52
[ASK IF Q16a=2:7, OTHERWISE SKIP TO Q17c]Q16b. How much will you use for the personal travel you have planned for 2019?
Total Millennials Gen X Boomers
Base: Has Vacation/Paid Time Off 992 362 338 284
All/Most (NET) 68 77 69 62
All of it 35 45 35 28
Most of it 33 32 33 34
Some/Hardly Any (NET) 28 20 28 34
Some of it 25 17 25 32
Hardly any of it 3 3 3 2
Don't know 3 3 3 4
AARP 2019 Travel Trends Study | Interloq, LLC 22
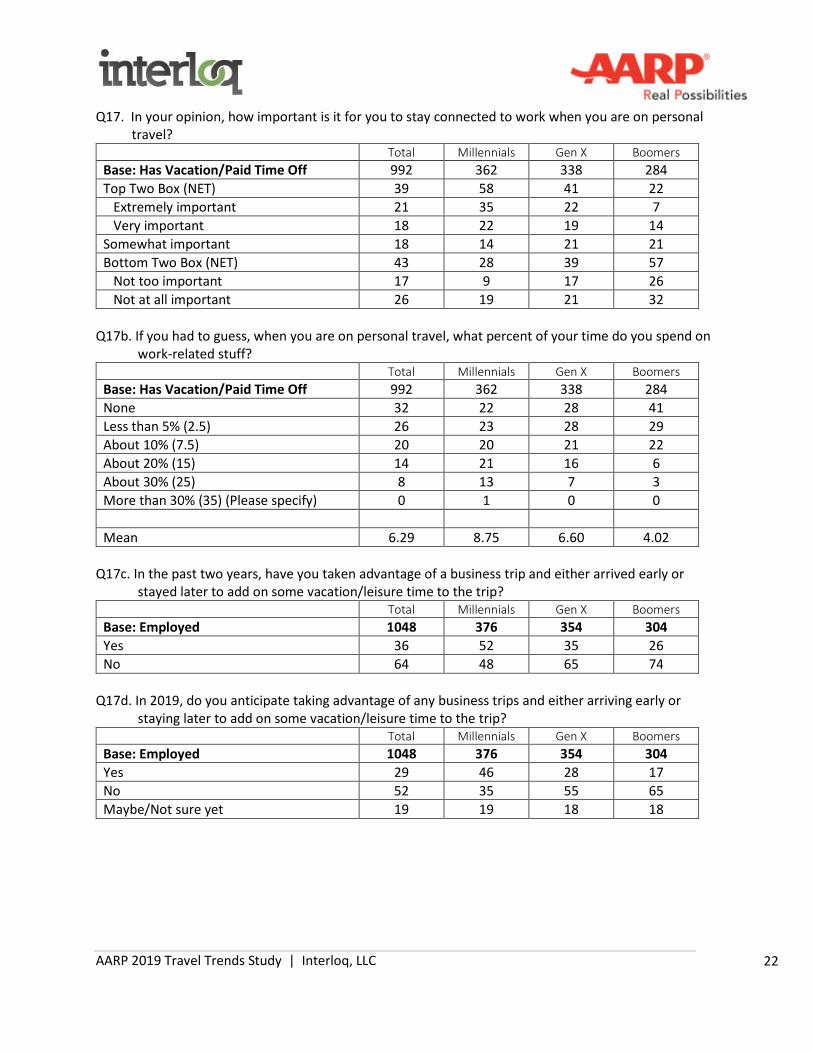
Q17. In your opinion, how important is it for you to stay connected to work when you are on personaltravel?
Total Millennials Gen X Boomers
Base: Has Vacation/Paid Time Off 992 362 338 284
Top Two Box (NET) 39 58 41 22
Extremely important 21 35 22 7
Very important 18 22 19 14
Somewhat important 18 14 21 21
Bottom Two Box (NET) 43 28 39 57
Not too important 17 9 17 26
Not at all important 26 19 21 32
Q17b. If you had to guess, when you are on personal travel, what percent of your time do you spend onwork-related stuff?
Total Millennials Gen X Boomers
Base: Has Vacation/Paid Time Off 992 362 338 284
None 32 22 28 41
Less than 5% (2.5) 26 23 28 29
About 10% (7.5) 20 20 21 22
About 20% (15) 14 21 16 6
About 30% (25) 8 13 7 3
More than 30% (35) (Please specify) 0 1 0 0
Mean 6.29 8.75 6.60 4.02
Q17c. In the past two years, have you taken advantage of a business trip and either arrived early orstayed later to add on some vacation/leisure time to the trip?
Total Millennials Gen X Boomers
Base: Employed 1048 376 354 304
Yes 36 52 35 26
No 64 48 65 74
Q17d. In 2019, do you anticipate taking advantage of any business trips and either arriving early orstaying later to add on some vacation/leisure time to the trip?
Total Millennials Gen X Boomers
Base: Employed 1048 376 354 304
Yes 29 46 28 17
No 52 35 55 65
Maybe/Not sure yet 19 19 18 18
AARP 2019 Travel Trends Study | Interloq, LLC 23
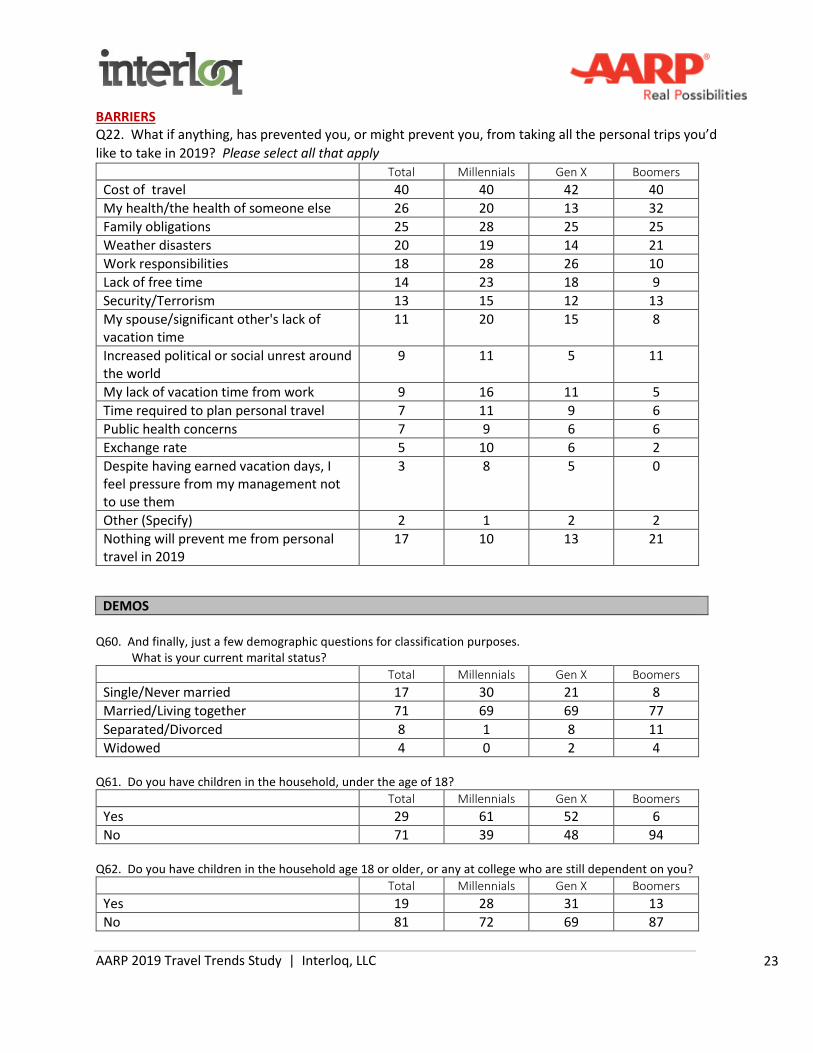
BARRIERSQ22. What if anything, has prevented you, or might prevent you, from taking all the personal trips you’d
like to take in 2019? Please select all that apply
Total Millennials Gen X Boomers
Cost of travel 40 40 42 40
My health/the health of someone else 26 20 13 32
Family obligations 25 28 25 25
Weather disasters 20 19 14 21
Work responsibilities 18 28 26 10
Lack of free time 14 23 18 9
Security/Terrorism 13 15 12 13
My spouse/significant other's lack ofvacation time
11 20 15 8
Increased political or social unrest aroundthe world
9 11 5 11
My lack of vacation time from work 9 16 11 5
Time required to plan personal travel 7 11 9 6
Public health concerns 7 9 6 6
Exchange rate 5 10 6 2
Despite having earned vacation days, Ifeel pressure from my management notto use them
3 8 5 0
Other (Specify) 2 1 2 2
Nothing will prevent me from personaltravel in 2019
17 10 13 21
DEMOS
Q60. And finally, just a few demographic questions for classification purposes.What is your current marital status?
Total Millennials Gen X Boomers
Single/Never married 17 30 21 8
Married/Living together 71 69 69 77
Separated/Divorced 8 1 8 11
Widowed 4 0 2 4
Q61. Do you have children in the household, under the age of 18?
Total Millennials Gen X Boomers
Yes 29 61 52 6
No 71 39 48 94
Q62. Do you have children in the household age 18 or older, or any at college who are still dependent on you?
Total Millennials Gen X Boomers
Yes 19 28 31 13
No 81 72 69 87

AARP 2019 Travel Trends Study | Interloq, LLC 24
Q63. Which of the following best describes the last level of education you have completed?
Total Millennials Gen X Boomers
Some high school or less 0 0 1 0
High School graduate 6 5 7 8
Some college 15 7 15 18
2-year college/technical school 12 8 10 14
4-year college 33 44 38 29
Some postgraduate work 6 5 5 6
Postgraduate degree 28 30 25 26
Q64. Those are all the questions we have for you, thank you so much for your time. We hope you have enjoyedthis survey. Based on the feedback you have provided, if we would like to speak to you a bit more aboutyour travel plans, would you be open to being contacted for some additional research?
Total Millennials Gen X Boomers
Yes 73 84 80 67
No 27 16 20 33
[ASK IF Q64=YES, OTHERWISE SKIP]Q65. Wonderful, thank you! You will be contacted by us, at e-Rewards, if further input is needed. Thanks again
and have a great day!
[ASK IF Q64=NO, OTHERWISE SKIP]Q66. No problem, we understand. Thank you again for your participation, have a great day!
[END SURVEY]