ab118184 – assay kit catalase specific activity - abcam.com · ab118184 – catalase specific...
TRANSCRIPT

ab118184 –
Catalase Specific Activity Assay Kit
Instructions for Use
For the measurement catalase (CAT) activity
This product is for research use only and is not intended for diagnostic use.

1

Table of Contents
1. Introduction 3
2. Assay Summary 7
3. Kit Contents 9
4. Storage and Handling 10
5. Additional Materials Required 10
6. Reagent Preparation 11
7. Test Sample Preparation 11
8. Assay Procedure 14
9. Data Analysis 18
2
1. Introduction
Principle: ab118184 is used to determine the relative specific
activity (activity and quantity) of catalase in a sample. The native
enzyme is immunocaptured within the wells of the microplate; this
removes all other enzymes. The assay buffer contains hydrogen
peroxide which reacts with a substrate to make a luminescent
product. Catalase functions rapidly to remove hydrogen peroxide
from the solution and reduce the production of light. Therefore the
light produced in each well is inversely proportional to the amount of
catalase activity (Figure 1).
H2O
H2O2
CAT
Light
Figure 1. Scheme of reactions used in this kit. Abbreviations are as
follows: catalase (CAT), Hydrogen peroxide (H2O2), water (H2O).
After activity measurement the quantity of catalase is measured by
adding to each well an anti-catalase primary detector antibody. After
washing away unbound detector antibody, HRP-conjugated labeled
secondary antibody specific for the primary detector antibody is
3
pipetted to the wells. The wells are again washed, a TMB substrate
solution is added to the wells and color develops in proportion to the
amount of catalase bound. The developing blue color is measured at
600 nm. Optionally the reaction can be stopped by adding
hydrochloric acid which changes the color from blue to yellow and
the intensity can be measured at 450 nm.
Background: Catalase is a heme containing peroxisomal
homotetrameric enzyme that has a detoxification role by catalyzing
the decomposition of the toxic cellular byproduct hydrogen peroxide
(H2O2) to water and oxygen. Hydrogen peroxide is formed in the
eukaryotic cell as a by-product of various oxidase and superoxide
dismutase reactions. Hydrogen peroxide is metabolized by catalase
and also glutathione peroxidase. Hydrogen peroxide is highly
deleterious to the cell and its accumulation causes oxidation of
cellular targets such as DNA, proteins, and lipids leading to
mutagenesis and cell death. Therefore removal of the hydrogen
peroxide from cells by catalase provides protection against oxidative
damage. The highest levels of catalase in humans are found in the
liver, kidney and erythrocytes. Defects in the catalase gene (CAT)
are the cause of acatalasia (ACATLAS); also known as
acatalasemia. This disease is characterized by absence of catalase
activity in red cells and is often associated with ulcerating oral
lesions.
4
This assay improves upon existing catalase activity assays by
isolating catalase from within each sample, this allows -
Sequential measurement of both activity and quantity of
catalase in each well, the relationship between which is the
specific activity.
Removal of other competing H2O2 metabolizing enzymes
such as glutathione peroxidase.
Removal of H2O2 creating enzymes in a sample such as
superoxide dismutase or other oxidases.
This assay also uses a novel luminescent detection method which
allows the rapid and stable catalase activity to be measured.
Therefore, unlike other methods, the reaction can be measured
shortly after addition of substrate and need not be stopped but can
be followed for a long period of time.
Limitations:
FOR RESEARCH US ONLY. NOT FOR DIAGNOSTIC
PROCEDURES.
Use this kit before expiration date.
Do not mix or substitute reagents from other lots or sources.
If experimental samples generate values above the range of
the control or normal sample standard curve, further dilute
the samples with 1X Incubation buffer and repeat the assay.
5

Any variation in operator, pipetting technique, washing
technique, incubation time or temperature, and kit age can
cause variation in binding.
Technical Hints:
To avoid cross contamination, change pipette tips between
additions of each sample and between reagent additions.
Also use separate clean, dry reservoirs for each reagent.
Cover plate during incubation steps.
Thorough and consistent wash technique is essential for
proper assay performance. Wash buffer must be forcefully
dispensed and completely removed from the wells by
aspiration or decanting. Remove remaining wash buffer by
inverting the plate and blotting on paper towels.
6

2. Assay Summary
Activity Determination
Prepare samples as instructed. Determine the protein concentration of
extracts.
Equilibrate all reagents to room temperature.
Dilute sample to desired protein concentration in 1X Incubation Buffer. Add
100L sample to each well used. Incubate 3 hours at room temp.
Aspirate and wash each well twice. Add 100 L 2X Activity Solution to each
well. Add 100 L 2X H2O2 Solution to each well.
Pop bubbles and record immediately the luminescence in each well for 30
minutes.
7
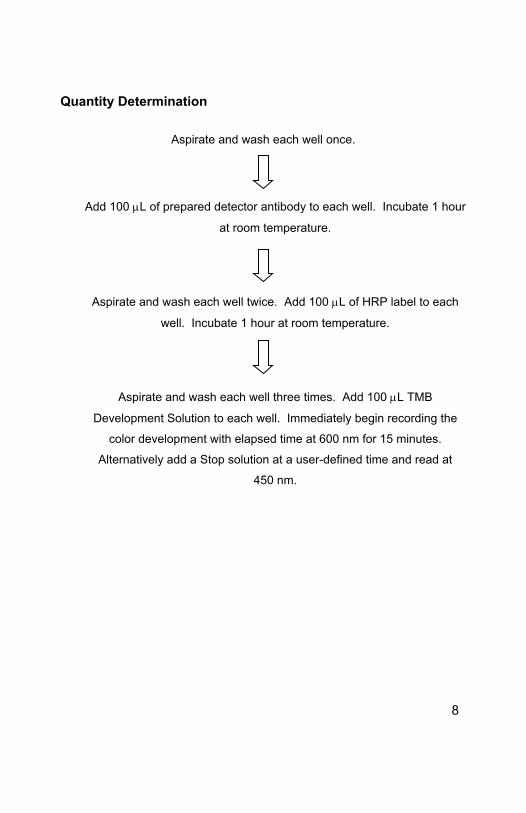
Quantity Determination
Aspirate and wash each well once.
Add 100 L of prepared detector antibody to each well. Incubate 1 hour
at room temperature.
Aspirate and wash each well twice. Add 100 L of HRP label to each
well. Incubate 1 hour at room temperature.
Aspirate and wash each well three times. Add 100 L TMB
Development Solution to each well. Immediately begin recording the
color development with elapsed time at 600 nm for 15 minutes.
Alternatively add a Stop solution at a user-defined time and read at
450 nm.
8
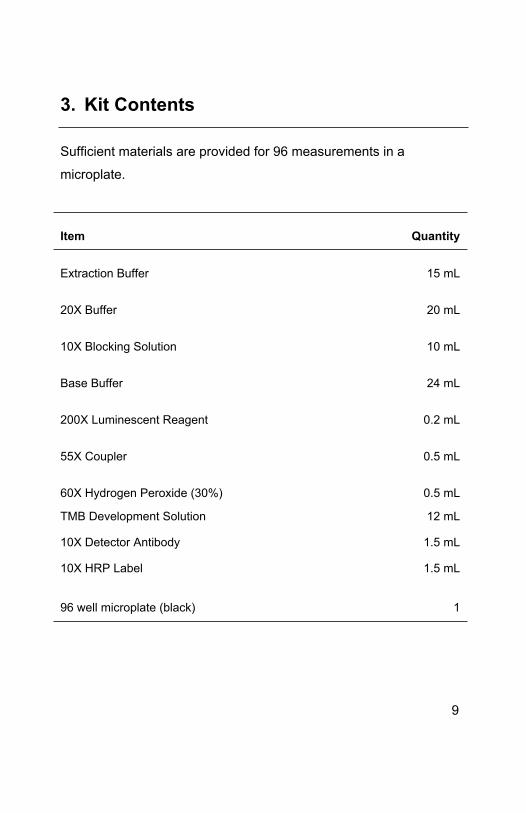
3. Kit Contents
Sufficient materials are provided for 96 measurements in a
microplate.
Item Quantity
Extraction Buffer 15 mL
20X Buffer 20 mL
10X Blocking Solution 10 mL
Base Buffer 24 mL
200X Luminescent Reagent 0.2 mL
55X Coupler 0.5 mL
60X Hydrogen Peroxide (30%) 0.5 mL
TMB Development Solution 12 mL
10X Detector Antibody 1.5 mL
10X HRP Label 1.5 mL
96 well microplate (black) 1
9
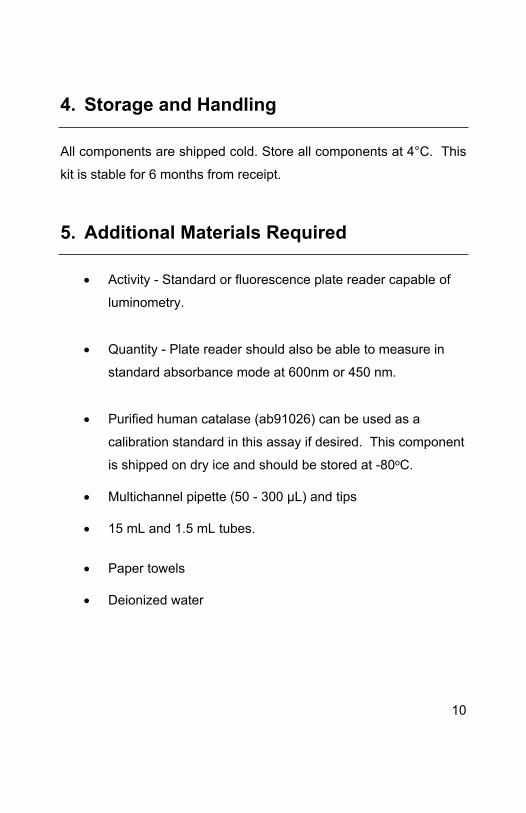
4. Storage and Handling
All components are shipped cold. Store all components at 4°C. This
kit is stable for 6 months from receipt.
5. Additional Materials Required
Activity - Standard or fluorescence plate reader capable of
luminometry.
Quantity - Plate reader should also be able to measure in
standard absorbance mode at 600nm or 450 nm.
Purified human catalase (ab91026) can be used as a
calibration standard in this assay if desired. This component
is shipped on dry ice and should be stored at -80oC.
Multichannel pipette (50 - 300 µL) and tips
15 mL and 1.5 mL tubes.
Paper towels
Deionized water
10

6. Reagent Preparation
6.1 Prepare 1X Wash Buffer by adding 20 mL 20X Buffer to
380 mL nanopure water. Mix throroughly.
6.2 Prepare 1X Incubation Buffer by adding 10 mL 10X
Blocking Solution to 90 mL 1X Wash Buffer. Mix
thoroughly.
6.3 Immediately prior to use prepare enough 2X Activity
Solution. For an entire plate dispense 12 mL Base buffer
into a clean tube. Add 0.455 mL 55X Coupler and
0.125 mL 200X Luminescent Reagent. Mix well.
6.4 Immediately prior to use prepare enough 2X Hydrogen
Peroxide Solution. For an entire plate dispense 12 mL
Base buffer into a clean tube. Add 0.417 mL 60X
Hydrogen Peroxide. Mix well.
7. Test Sample Preparation
Note: Extraction buffer can be supplemented with PMSF and protease inhibitor cocktail prior to use. Supplements should be used according to manufacturer’s instructions.
11

7.1 Cell lysates:
7.1.1 Collect non adherent cells by centrifugation or
scrape to collect adherent cells from the culture
flask. Typical centrifugation conditions for cells are
500 x g for 10 minutes at 4oC.
7.1.2 Rinse cells twice with PBS.
7.1.3 Solubilize cell pellet at 2x10⁷/mL in Extraction Buffer.
7.1.4 Incubate on ice for 20 minutes. Centrifuge at 16,000
x g, 4°C for 20 minutes. Transfer the supernatants
into clean tubes and discard the pellets. Assay
samples immediately or aliquot and store at -80°C.
The sample protein concentration in the extract may
be quantified using a protein assay.
7.2 Tissue lysates:
7.2.1 Tissue lysates are typically prepared by
homogenization of tissue that is first minced and
thoroughly rinsed in PBS to remove blood (dounce
homogenizer recommended).
7.2.2 Suspend the homogenate to 25 mg/mL in PBS.
12

7.2.3 Solubilize the homogenate by adding 4 volumes of
Extraction Buffer to a sample protein concentration
of 25 mg/mL.
7.2.4 Incubate on ice for 20 minutes. Centrifuge at 16,000
x g, 4°C for 20 minutes. Transfer the supernatants
into clean tubes and discard the pellets. Assay
samples immediately or aliquot and store at -80°C.
The sample protein concentration in the extract may
be quantified using a protein assay.
7.3 Sub-cellular organelle lysates e.g. peroxisomes:
7.3.1 Prepare the organelle sample by, for example, sub-
cellular fractionation.
7.3.2 Pellet the sample.
7.3.3 Solubilize the pellet by adding 9 volumes Extraction
Buffer.
7.3.4 Incubate on ice for 20 minutes. Centrifuge at 16,000
x g, 4°C for 20 minutes. Transfer the supernatants
into clean tubes and discard the pellets. Assay
samples immediately or aliquot and store at -80°C.
The sample protein concentration in the extract may
be quantified using a protein assay.
13

These test samples should be diluted to within the
working range of the assay in 1X Incubation Buffer.
As a guide, typical ranges of sample concentration
for commonly used sample types are shown below
in Data Analysis.
8. Assay Procedure
Equilibrate all reagents and samples to room temperature before use. It is recommended all samples and standards be assayed in duplicate.
8.1 Activity Measurement
8.2.1 Prepare all reagents, and samples as directed in the
previous sections.
8.2.2 Add 100 µL of each diluted sample per well. It is
recommended to include a dilution series of a control
(normal) sample as a reference. Also include a 1X
Incubation Buffer as a zero standard.
8.2.3 Cover/seal the plate and incubate for 3 hours at room
temperature. If available use a plate shaker for all
incubation steps at 300 rpm.
14

8.2.4 Aspirate each well and wash, repeat this once more
for a total of two washes. Wash by aspirating or
decanting from wells then dispensing 300 L 1X
Wash Buffer into each well as described above.
Complete removal of liquid at each step is essential
for good performance. After the last wash, remove
the remaining buffer by aspiration or decanting.
Invert the plate and blot it against clean paper towels
to remove excess liquid.
8.2.5 Gently add 100 L 2X Activity Solution (step 6.3) to
each well minimizing the production of bubbles.
8.2.6 Gently add 100 L 2X Hydrogen Peroxide Solution
(step 6.4) to each well minimizing the production of
bubbles.
8.2.7 Pop any bubbles immediately and record
luminescence in the microplate luminometer
prepared as follows:
Mode: Luminometer
Time: Read between 5 and 30 minutes
Shaking: Shake before reading
15
8.2.8 Record the data for analysis as described in
section 9, Data Analysis - Activity below.
8.2 Quantity measurement
8.2.1 Immediately prior to use prepare sufficient (12 mL for
the entire plate) 1X Detector Antibody in 1X
Incubation buffer. Repeat the aspirate/wash
procedure above.
8.2.2 Add 100 L 1X Detector antibody to each well used.
Cover/seal the plate and incubate for 1 hour at room
temperature. If available use a plate shaker for all
incubation steps at 300 rpm.
8.2.3 Repeat the aspirate/wash procedure above.
8.2.4 Immediately prior to use prepare sufficient (12 mL for
the entire plate) 1X HRP label in 1X Incubation
buffer. Add 100 L 1X HRP label to each well used.
Cover/seal the plate and incubate for 1 hour at room
temperature. If available use a plate shaker for all
incubation steps at 300 rpm.
8.2.5 Repeat the aspirate/wash procedure above, however,
performing a total of three washes.
16

8.2.6 Add 100 µL TMB Development Solution to each
empty well and immediately begin recording the blue
color development with elapsed time in the
microplate reader prepared with the following
settings:
Mode: Kinetic
Wavelength: 600 nM
Time: up to 15 min.
Interval: 20 sec. - 1 min.
Shaking: Shake between readings
Alternative– In place of a kinetic reading, at a user defined,
time record the endpoint OD data at (i) 600 nm or (ii) stop
the reaction by adding 100 µL stop solution (1N HCl) to each
well and record the OD at 450 nm.
8.2.7 Record the data for analysis as described in
section 9, Data Analysis - Quantity below.
17
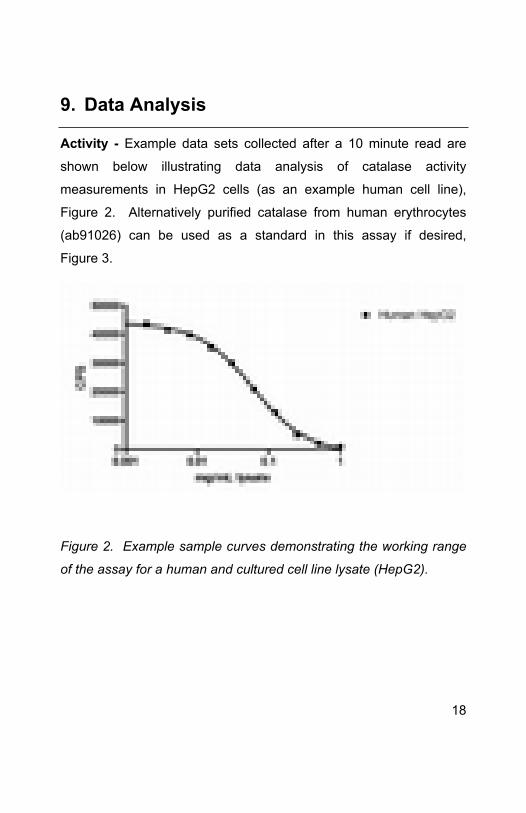
9. Data Analysis
Activity - Example data sets collected after a 10 minute read are
shown below illustrating data analysis of catalase activity
measurements in HepG2 cells (as an example human cell line),
Figure 2. Alternatively purified catalase from human erythrocytes
(ab91026) can be used as a standard in this assay if desired,
Figure 3.
Figure 2. Example sample curves demonstrating the working range
of the assay for a human and cultured cell line lysate (HepG2).
18

Figure 3. Example standard curve for the purified human catalase
sample ab91026.
To do this average the duplicate control sample readings and plot
against their concentrations. Draw the best smooth curve through
these points to construct a standard curve. Most luminometer
software or graphing software can plot these values and curve fit. A
four parameter algorithm (4PL) usually provides the best fit, though
other equations can be examined to see which provides the most
accurate (e.g. linear, semi-log, log/log, 4 parameter logistic).
Unknown samples should be interpolated from a reference sample
curves. This determined relative activity is the amount of reference
sample required to generate the same amount of activity as the
unknown sample and usually expressed as a per cent value.
19

ASSAY WORKING RANGE
This assay has been demonstrated with human, rat, and mouse liver
and tissue homogenate samples as well as HepG2 whole cell lysate.
Typical ranges for several sample types are described below. It is
highly recommended to prepare multiple dilutions for each sample to
ensure that each is in the working range of the assay.
Sample Type Range
Cultured whole cell extracts (type dependant) e.g. HepG2 0.001 – 1 mg/mL
Tissue extract (liver) 0.001 – 1 mg/mL
Tissue extract (mouse) 0.001 – 1 mg/mL
Tissue extract (rat) 0.001 - 0.125 mg/mL
Purified human catalase 0.004 – 1 g/mL
ACTIVITY REPRODUCIBILITY
Parameter %CVIntra (each n= 8) 5.6, 6.6, 9.2Inter (n=4 days) 9.9
20
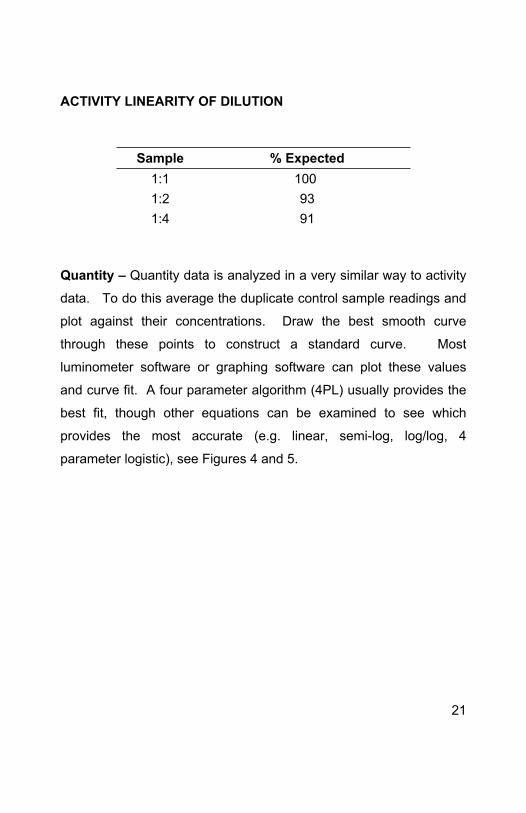
ACTIVITY LINEARITY OF DILUTION
Sample % Expected1:1 100 1:2 931:4 91
Quantity – Quantity data is analyzed in a very similar way to activity
data. To do this average the duplicate control sample readings and
plot against their concentrations. Draw the best smooth curve
through these points to construct a standard curve. Most
luminometer software or graphing software can plot these values
and curve fit. A four parameter algorithm (4PL) usually provides the
best fit, though other equations can be examined to see which
provides the most accurate (e.g. linear, semi-log, log/log, 4
parameter logistic), see Figures 4 and 5.
21
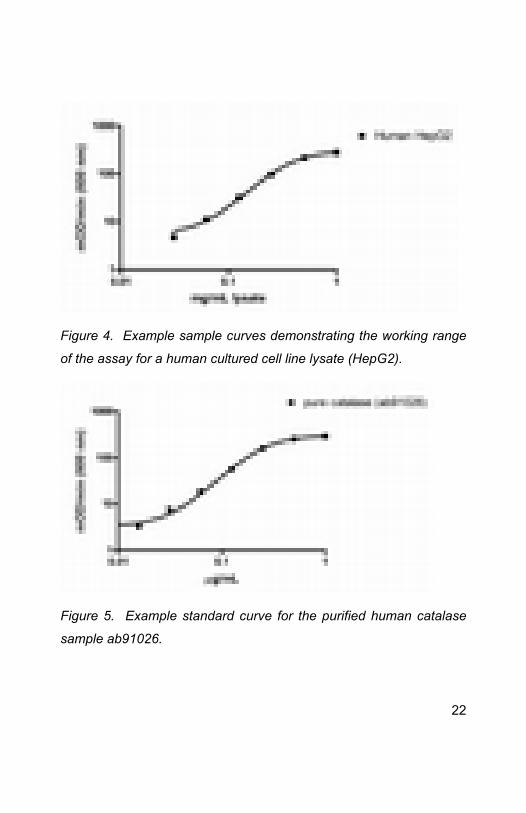
Figure 4. Example sample curves demonstrating the working range
of the assay for a human cultured cell line lysate (HepG2).
Figure 5. Example standard curve for the purified human catalase
sample ab91026.
22
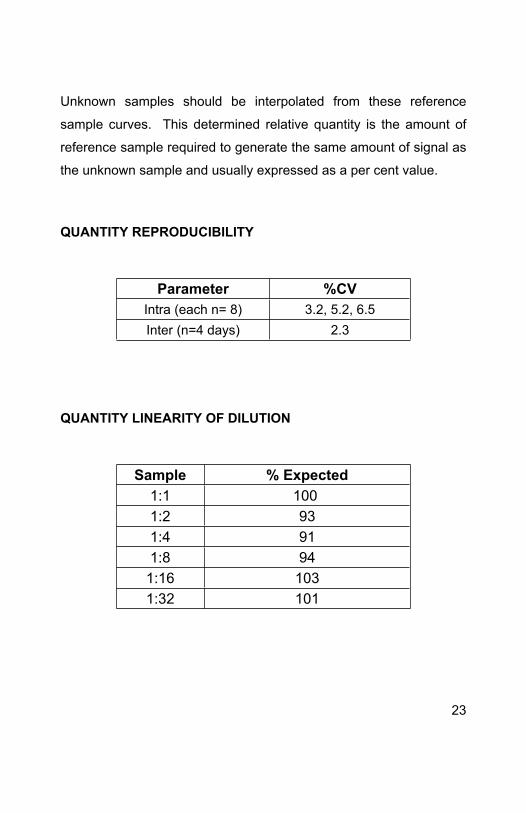
Unknown samples should be interpolated from these reference
sample curves. This determined relative quantity is the amount of
reference sample required to generate the same amount of signal as
the unknown sample and usually expressed as a per cent value.
QUANTITY REPRODUCIBILITY
Parameter %CVIntra (each n= 8) 3.2, 5.2, 6.5Inter (n=4 days) 2.3
QUANTITY LINEARITY OF DILUTION
Sample % Expected1:1 100 1:2 931:4 911:8 94
1:16 1031:32 101
23

Relative specific activity – this assay determines the activity and
quantity of catalase in a sample relative to either a control sample or
purified human catalase. The relationship between the determined
activity and the determined quantity can be expressed as a ratio or
graphed as shown below (Figure 6). Changes in the relationship of
activity to quantity indicate an increase or decrease in the activity of
individual catalase molecules, for example due to modifications
resulting from damage or regulation.
Figure 6. Example relative specific activity – comparing the activity
and quantity of purified erythrocyte catalase (ab91026) and catalase
from human hepg2 lysate. The HepG2 (▲) sample is determined to
have a higher specific activity rate.
24

SPECIFICITY
Species– human, rat, and mouse reactive. Others untested.
The anti-catalse antibody used as a detector antibody in this kit was
Immunoprecipitation with ab110292. This antibody was generated
by immunization of rat liver proteins. The resulting monoclonal
mouse antibody isolates, by immunoprecipitation, a single catalase
band to purity from a number of species (shown below). The
immunoprecipitate was confirmed to be catalase by mass
spectrometry. This antibody is cross reactive in
immunofluorescence microcopy and labels a peroxisomal
intracellular pattern (shown below)
Immunoprecipitation with ab110292.
25

Immunofluorecent labeling of peroxisomes with ab110292.
26

UK, EU and ROWEmail:
[email protected]: +44 (0)1223 696000www.abcam.com
US, Canada and Latin AmericaEmail: [email protected]: 888-77-ABCAM (22226)www.abcam.com
China and Asia Pacific Email: [email protected]: 108008523689 (中國聯通)www.abcam.cn
JapanEmail: [email protected]: +81-(0)3-6231-0940www.abcam.co.jp
27
Copyright © 2012 Abcam, All Rights Reserved. The Abcam logo is a registered trademark.
All information / detail is correct at time of going to print.