abass a. mallam - iupui
TRANSCRIPT

ONION CULTIVATION SYSTEM AND SPATIAL DISTRIBUTION CENTERS IN
TAHOUA REGION/NIGER
Abass A. Mallam
Submitted to the faculty of the University Graduate School in partial fulfillment of the requirements
for the degree Master of Science
in the Department of Geography, Indiana University
January 2019

ii
Accepted by the Graduate Faculty of Indiana University, in partial fulfillment of the requirements for the degree of Master of Science.
Master's Thesis Committee
______________________________________ Frederick L. Bein, PhD, Chair
______________________________________ Vijay Lulla, PhD
______________________________________
Rudy Banerjee, PhD
______________________________________
Jeffrey Wilson, PhD

iii
© 2018
Abass A. Mallam

iv
ACKNOWLEDGEMENT
I would like to thank and express my deepest gratitude to my supervisor Dr.
Frederick L. Bein for his supervision and contribution to this thesis. Dr. Rick has been so
great to me by given useful comments throughout my learning process during my
academic year. I am very gratefully thankful to the committee members Dr.Vijay Lulla,
Dr. Rudy Banerjee and Dr. Jeffrey Wilson for teaching me and their advices, comments,
encouragement and patience. Also, my sincere thanks to the entire faculty of the
Department of Geography at IUPUI for their teaching quality and especially to the Dr.
Owen J. Dwyer. My words will not be enough to express how grateful I am. This
accomplishment would not have been possible without them.
Finally, I express my very profound gratitude to my parents, my spouse and son
for their prayers and for providing me with unfailing support and continuous
encouragement throughout my years of study researching and writing this thesis.
v
Abass A. Mallam
ONION CULTIVATION SYSTEM AND SPATIAL DISTRIBUTION CENTERS IN
TAHOUA REGION/NIGER
Onion farming is the main irrigated crop that contributes to the economy of the
Tahoua region, Niger. There are two factors that promote the outstanding potentialities of
onion cultivation in Niger: the best productive variety “Violet Galmi”, and it is well
adapted to storage. It is produced during both growing seasons which creates a permanent
local supply of onions all year. Much of the producing areas are not accessible by road,
which inhibits the marketing network. Farmers are in need of an improved transportation
system in order to further develop onion production. The Violet of Galmi is grown by all
the onion producers of Niger. This onion has a major importance in the socio-economic
life of the Nigerien population. The consumers appreciate its cooking qualities and spicy
taste. It also has a commercial advantage in the local and the sub-regional markets.
Frederick L. Bein, PhD, Chair
vi
TABLE OF CONTENTS
LIST OF TABLES ............................................................................................................ vii LIST OF FIGURES ......................................................................................................... viii INTRODUCTION ...............................................................................................................1 STUDY OBJECTIVES ........................................................................................................3
Purpose of study ......................................................................................................3 Hypothesis................................................................................................................4
COUNTRY BACKGROUND .............................................................................................5 Geography of Niger .................................................................................................5 Demography of Niger ..............................................................................................8 History......................................................................................................................8
STUDY AREA BACKGROUND .....................................................................................10 Geography of Tahoua region .................................................................................10 Soils........................................................................................................................12 Demography of Tahoua region ..............................................................................12
ONIONS ............................................................................................................................14 Methodology ..........................................................................................................14 History of Niger’s onion ........................................................................................14 Supporting infrastructure for the onion..................................................................15 Distribution centers of onion collection sites.........................................................16
Main production regions ............................................................................16 Description of onion production in Tahoua ...........................................................17
Techniques of production ..........................................................................19 Transplantation system ..............................................................................21 Existing varieties ........................................................................................21 Irrigation system ........................................................................................22 The harvest .................................................................................................23
ONION MARKETING AND LOCATION ALLOCATION ............................................24 Commercialization .................................................................................................24 Economic and social place of the onion ................................................................28 Physical flow of onion ..........................................................................................28 Location allocation.................................................................................................30
CONCLUSION AND RECOMMENDATIONS ..............................................................36 APPENDIX ........................................................................................................................37 REFERENCES ..................................................................................................................39 CURRICULUM VITAE

vii
LIST OF TABLES
Table 1 Census data Niger population 2012, Source: Niger ................................................8 Table 2 Census data of Tahoua region population for 1988, 2001 & 2012 .......................13 Table 3: Locational component ........................................................................................32

viii
LIST OF FIGURES
Figure 1 Regions of Niger onion data 2012 .........................................................................1 Figure 2 Tahoua rainfall isohyet ..........................................................................................2 Figure 3 Map of Africa showing the localization of Niger ..................................................5 Figure 4 Map of Niger climatic zones .................................................................................6 Figure 5 The eight regions of Niger .....................................................................................7 Figure 6 Map of Tahoua region and administrative limit ..................................................10 Figure 7 Rainfall region of Tahoua ....................................................................................11 Figure 8 National onion production 2012-2013 of regions of Niger .................................16 Figure 9 Tahoua onion production 2010-2015 ..................................................................18 Figure 10 Irrigation parcels of onion in Keita, Tahoua/Niger ...........................................19 Figure 11 Rudu (Traditional storage of onions: Traditional storage of onions: structures are made of millet stalks) in the commune of Zangaratta, Keita, Tahoua/Niger. ....................................................................................................................20 Figure 12 Onion seed production, Keita/Tahoua ...............................................................20 Figure 13 Transplantation system ......................................................................................21 Figure 14a Moto” pump draws water from well ................................................................22 Figure 14b Pipe releasing irrigation water in the onion field ............................................22 Figure 14c Irrigation channel distributes water to the separate parcels .............................22 Figure 15 Irrigation System with animal traction in Tamaské ..........................................22 Figure 16 Careful onion harvest at Tamaské/Keita/Tahoua ..............................................23 Figure 17 The marketing distribution network of Niger onion ..........................................24 Figure 18 Onion transportation system to the loading place .............................................25 Figure 19 Onion loading point at Keita/Tahoua ................................................................26 Figure 20 Harvested onions at the field, ready for transportation to the marketed ...........26 Figure 21 Calendar of onion production in Niger ..............................................................27 Figure 22 Map of Niger onion consuming countries .........................................................29 Figure 23 Onion exports by west African ..........................................................................29 Figure 24 Eight facilities covered all demands in 230.8 km..............................................31

1
INTRODUCTION
Agriculture is the major economic activity occupying 90% of the people of Niger.
Subsistence farming dominates, while commercial farming is increasing in importance.
Because of the irregularity of rainfall, rain-fed crops fail to cover the needs of the
population. In addition to this, there is a general shortage of underground water for
irrigation as well as a lack of advanced technology for collecting that water. Niger places
its effort to reduce human poverty by developing agriculture in the rural sector. One goal
of Niger and its Non-Governmental Organization (NGOs) partnerships is to develop
groundwater and surface water controls systems (mini-dams, reservoirs and boreholes) to
enhance irrigation.
Figure 1: Regions of Niger onion data 2012
The numbers in the figure 1 represent for each region the cultivable estimated
areas of onion in Niger in 2012. In general, agriculture remains the primary economic
activity in the Tahoua region with an area of cultivable land estimated at 3,072,265
hectares or about 28% of the total area.
2
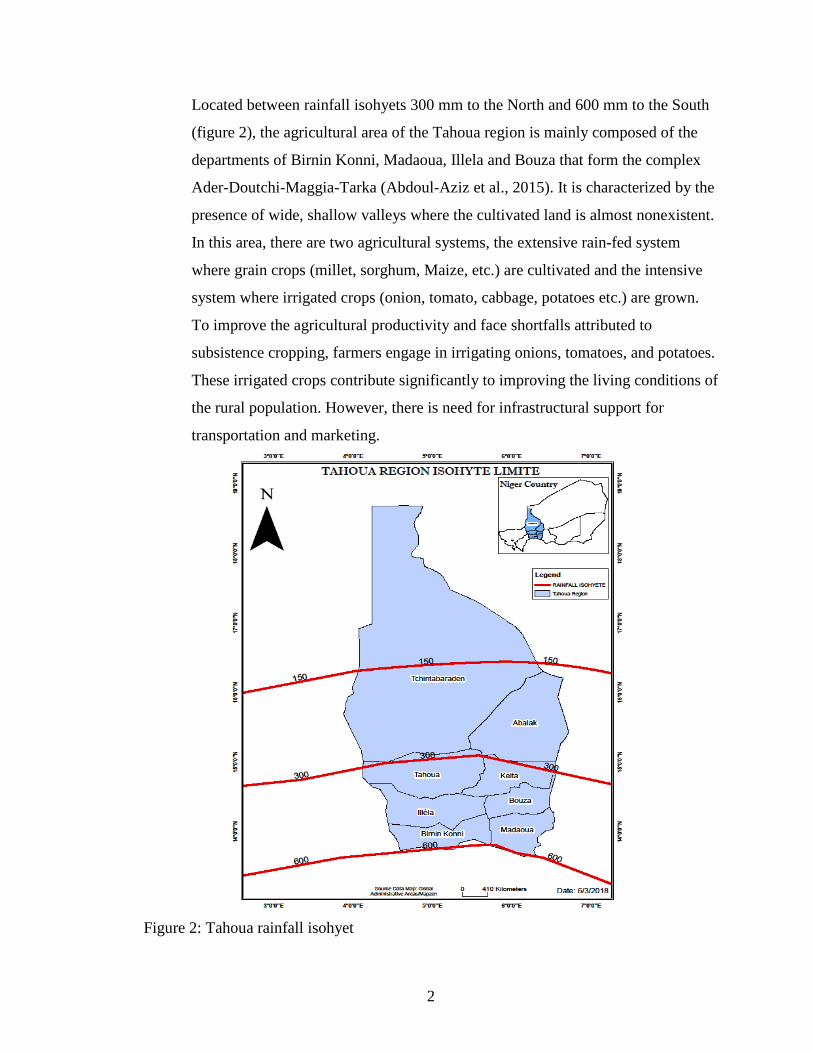
Located between rainfall isohyets 300 mm to the North and 600 mm to the South
(figure 2), the agricultural area of the Tahoua region is mainly composed of the
departments of Birnin Konni, Madaoua, Illela and Bouza that form the complex
Ader-Doutchi-Maggia-Tarka (Abdoul-Aziz et al., 2015). It is characterized by the
presence of wide, shallow valleys where the cultivated land is almost nonexistent.
In this area, there are two agricultural systems, the extensive rain-fed system
where grain crops (millet, sorghum, Maize, etc.) are cultivated and the intensive
system where irrigated crops (onion, tomato, cabbage, potatoes etc.) are grown.
To improve the agricultural productivity and face shortfalls attributed to
subsistence cropping, farmers engage in irrigating onions, tomatoes, and potatoes.
These irrigated crops contribute significantly to improving the living conditions of
the rural population. However, there is need for infrastructural support for
transportation and marketing.
Figure 2: Tahoua rainfall isohyet

3
STUDY OBJECTIVES
Purpose of study
The purpose of this study is to provide a description of onion production systems
in Tahoua region, Niger. The main problems follow below:
A. The development of Niger's economy involves improving agricultural production
through crop diversification mainly with irrigation.
B. Because of weather conditions characterized by spatial and temporal distribution of
irregular rainfall, the rain fed crops have failed to meet the food needs of the local
population (O. David, 1996).
C. To improve agricultural production and to face grain (Millet, Maize and Sorghum)
crop shortages, farmers engage in irrigated agriculture, which has contributed to the
growth of the national economy.
D. The main irrigated crops cultivated in Niger include onions, tomatoes, peanuts,
carrots, cabbage, sweet potatoes, watermelon and lettuce. However, in some areas, for
example the Department of Keita, the volume of irrigated crops has declined with the
collapse of its dam in 1978, resulting in lowering of the water table. In 2006 the cropping
area was 4,184 hectares. Onions, the main irrigated crop, are cultivated in almost all
regions of the country: Tahoua, Tillaberi, Agadez, Maradi, Diffa, Niamey and Dosso
(figure 5). The total cultivated area is estimated at 20,000 hectares (MDA, 2007). Tahoua
is the largest production region and produces one crop in the rainy season and one
irrigated crop during the dry season. The total annual cultivated area of Niger was
18,754.88 hectares in 2012-2013 (Ministry of Agricultural, 2013). Onions are very well
represented in the region of Tahoua with its most common variety, Violet de Galmi. This
variety remains a high-quality product known and appreciated by consumers in many
countries in Africa and Europe, exceeding competition from several other countries.
Market traders, inside and outside of the region, are interested in the export of Violet de
Galmi to international markets (Bruxelles, CSA, 2011). But this agriculture meets some
major constraints linked to the techniques of production, and the infrastructure for
transportation, marketing and commercialization. The onion is one of the main crops that
contributes to the development of economic activities in the Tahoua region.

4
The distance between the place of production and the centers of consumption has enabled
a certain number of Nigerians to create marketing networks ensuring the supply of
markets throughout the year. In this study, I would like to provide a full description of
onion production and irrigation systems in Tahoua Region. The GIS application is very
important in this study because it is used for spatial analysis of onion collection to map
the regions of farming and to show the dispersion of Niger’s onions. I will conclude by
providing a recommendation for improving the onion farming system and use a location
allocation model to find the optimum location for an onion distribution center.
Hypothesis
Does location optimization help supply onions to markets more efficiently?
How will rearranging market centers (nodes) in the network improve supply efficiently?
5
COUNTRY BACKGROUND
Geography of Niger
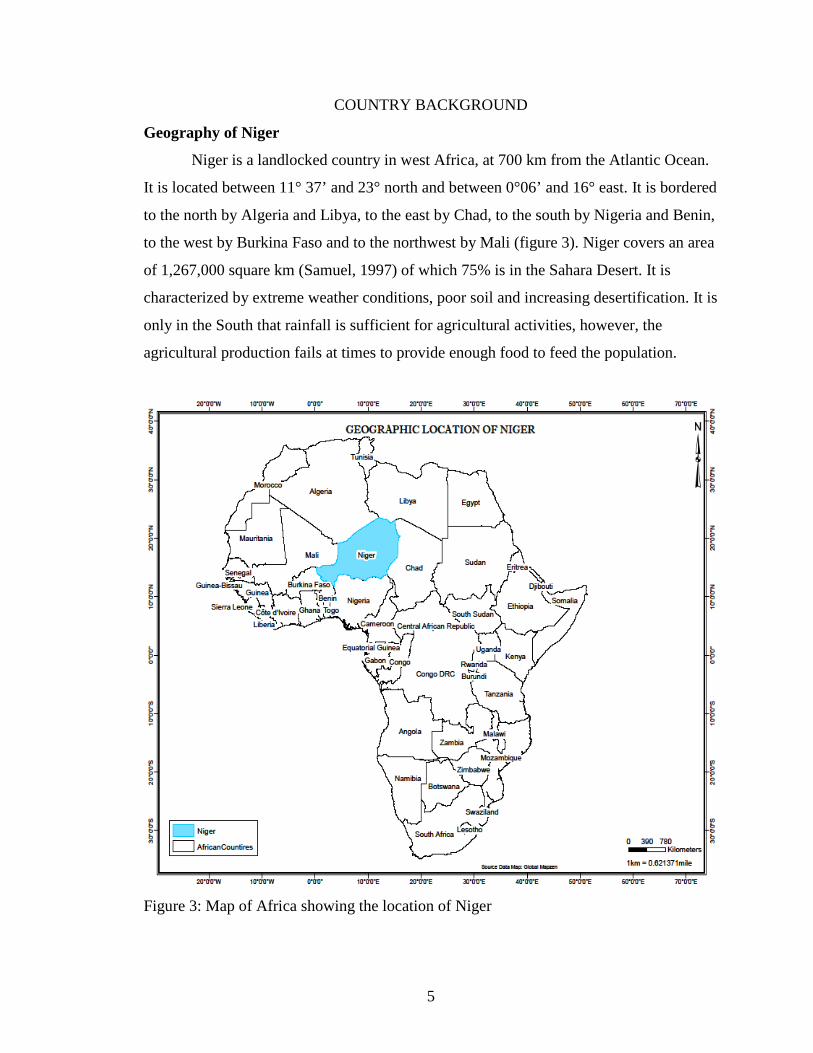
Niger is a landlocked country in west Africa, at 700 km from the Atlantic Ocean.
It is located between 11° 37’ and 23° north and between 0°06’ and 16° east. It is bordered
to the north by Algeria and Libya, to the east by Chad, to the south by Nigeria and Benin,
to the west by Burkina Faso and to the northwest by Mali (figure 3). Niger covers an area
of 1,267,000 square km (Samuel, 1997) of which 75% is in the Sahara Desert. It is
characterized by extreme weather conditions, poor soil and increasing desertification. It is
only in the South that rainfall is sufficient for agricultural activities, however, the
agricultural production fails at times to provide enough food to feed the population.
Figure 3: Map of Africa showing the location of Niger
6
Niger’s capital is Niamey and French is the official language (Mallam Garba,
2004). The population is composed of different sociolinguistic groups, including Hausa
(47.2%), Zarma (18.2%), Peuls (8.3%), Songai (5.2%), Touaregs (4.6%), Kanouri
(4.2%), Arab (3.4%), Mossi (0.9%) and Dendi (0.5) (Bamgbose, 1999). According to
Niger Demographic and Health Survey and Multiple Indicators, almost all of Niger’s
population is Muslim (99%). The Christians represent less than one percent (0.8%) and
the other religions 0.2% of the population. Niger’s population is unequally distributed
across the eight regions, and the most populous are in the south, Maradi (19.8%), Zinder
(18.5%), Tahoua (17.4%) and Tillabéry (16.3%), (Statistique (INS), Finances, &
International, 2013).
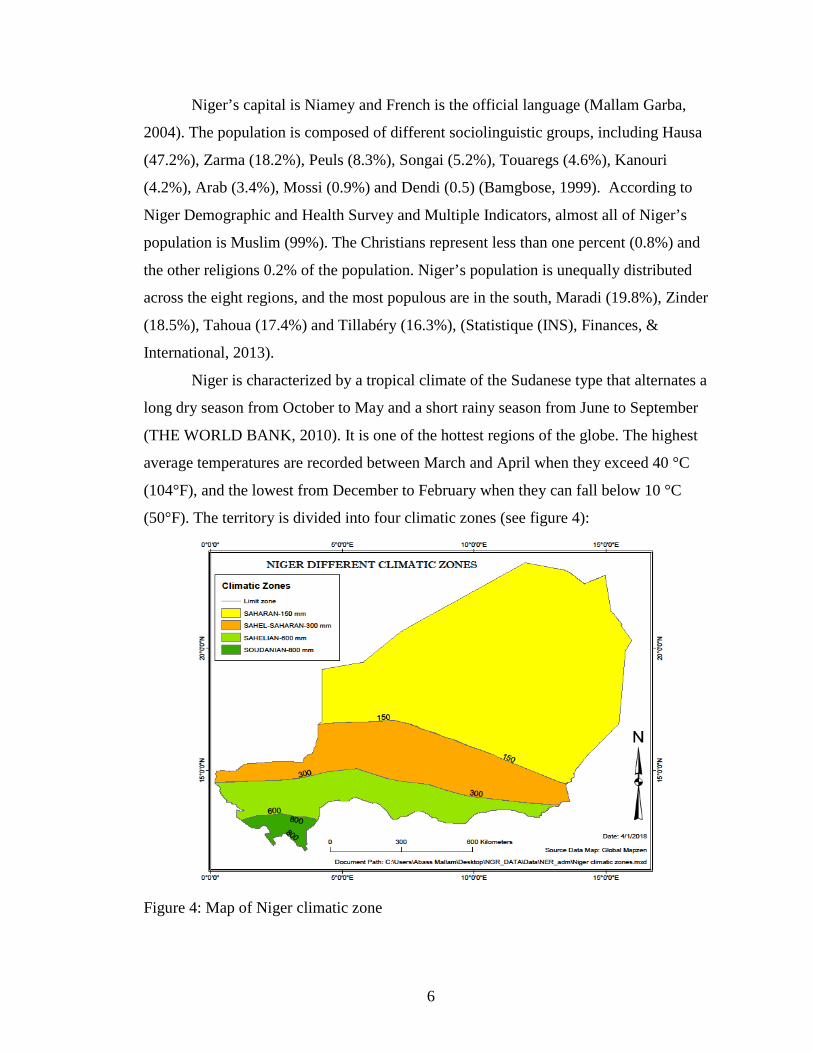
Niger is characterized by a tropical climate of the Sudanese type that alternates a
long dry season from October to May and a short rainy season from June to September
(THE WORLD BANK, 2010). It is one of the hottest regions of the globe. The highest
average temperatures are recorded between March and April when they exceed 40 °C
(104°F), and the lowest from December to February when they can fall below 10 °C
(50°F). The territory is divided into four climatic zones (see figure 4):
Figure 4: Map of Niger climatic zone
7
In the north, the Saharan zone reaches 150 mm annual precipitation which covers
three-fifths of the country and contains no agriculture, but does invest in the mining of
minerals uranium, cement, coal and gold.
In the center is the Sahel-saharan zone which receives an annual average rainfall
of 150 to 300 mm.
The Sahelian zone in the south which covers 10% of Niger’s total area, receives
an annual precipitation of 300 to 600 mm.
In the south, 1% of Niger’s area, a Sudanian zone receives the most rainfall in the
country, with an average of 600 to 800 mm per year. It is an agricultural zone
characterized by a Savanna climate and it is mainly devoted to millet, sorghum, maize
and peanut crops.
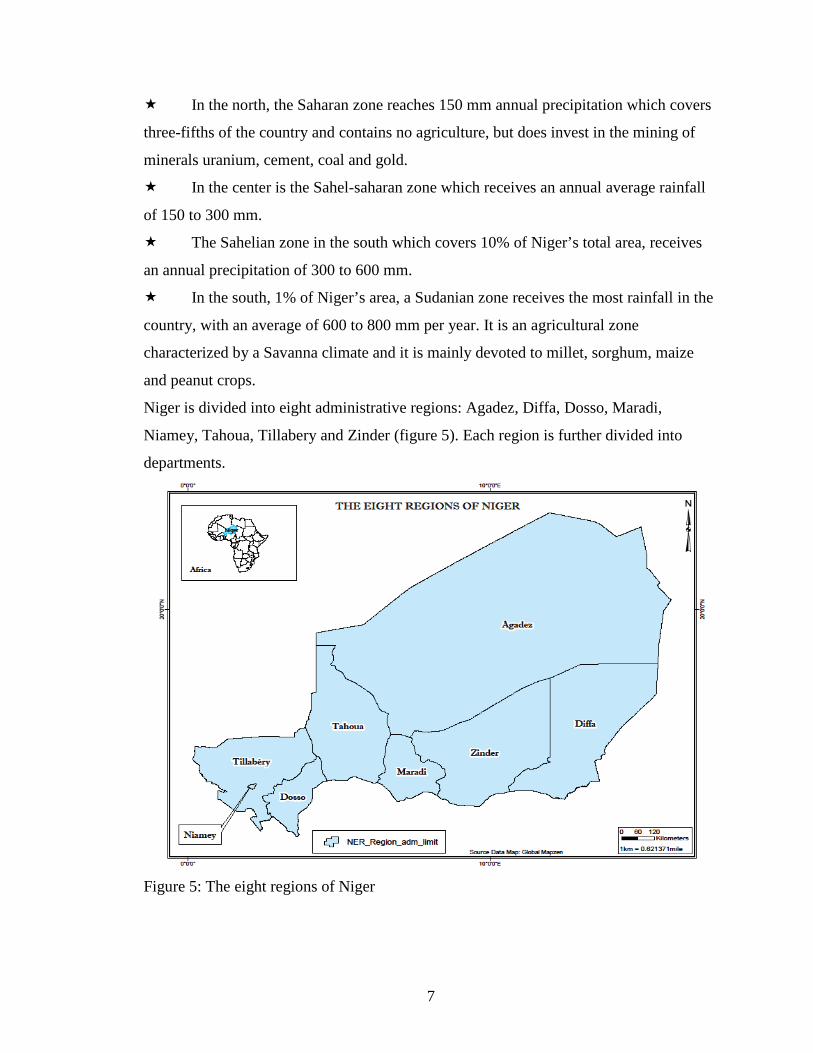
Niger is divided into eight administrative regions: Agadez, Diffa, Dosso, Maradi,
Niamey, Tahoua, Tillabery and Zinder (figure 5). Each region is further divided into
departments.
Figure 5: The eight regions of Niger
8
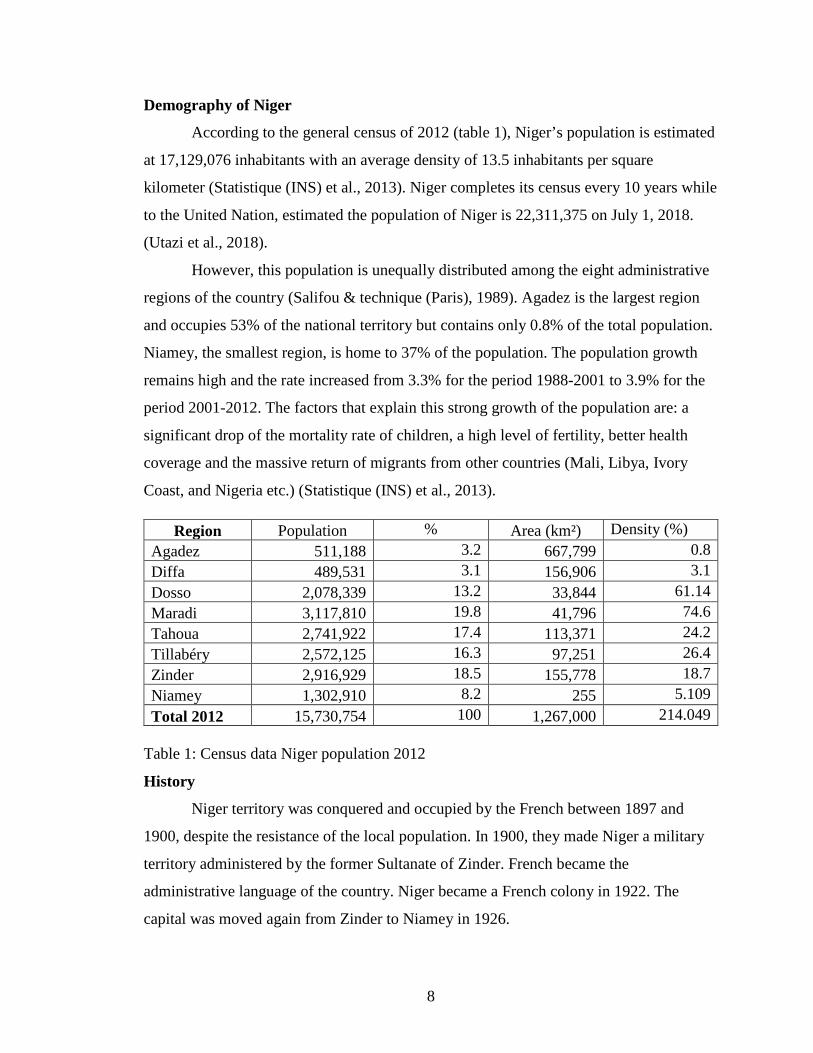
Demography of Niger
According to the general census of 2012 (table 1), Niger’s population is estimated
at 17,129,076 inhabitants with an average density of 13.5 inhabitants per square
kilometer (Statistique (INS) et al., 2013). Niger completes its census every 10 years while
to the United Nation, estimated the population of Niger is 22,311,375 on July 1, 2018.
(Utazi et al., 2018).
However, this population is unequally distributed among the eight administrative
regions of the country (Salifou & technique (Paris), 1989). Agadez is the largest region
and occupies 53% of the national territory but contains only 0.8% of the total population.
Niamey, the smallest region, is home to 37% of the population. The population growth
remains high and the rate increased from 3.3% for the period 1988-2001 to 3.9% for the
period 2001-2012. The factors that explain this strong growth of the population are: a
significant drop of the mortality rate of children, a high level of fertility, better health
coverage and the massive return of migrants from other countries (Mali, Libya, Ivory
Coast, and Nigeria etc.) (Statistique (INS) et al., 2013).
Region Population % Area (km²) Density (%) Agadez 511,188 3.2 667,799 0.8 Diffa 489,531 3.1 156,906 3.1 Dosso 2,078,339 13.2 33,844 61.14 Maradi 3,117,810 19.8 41,796 74.6 Tahoua 2,741,922 17.4 113,371 24.2 Tillabéry 2,572,125 16.3 97,251 26.4 Zinder 2,916,929 18.5 155,778 18.7 Niamey 1,302,910 8.2 255 5.109 Total 2012 15,730,754 100 1,267,000 214.049
Table 1: Census data Niger population 2012
History
Niger territory was conquered and occupied by the French between 1897 and
1900, despite the resistance of the local population. In 1900, they made Niger a military
territory administered by the former Sultanate of Zinder. French became the
administrative language of the country. Niger became a French colony in 1922. The
capital was moved again from Zinder to Niamey in 1926.

9
Niger became independent on August 3rd, 1960 and Diori Hamani (1960-1974) was
elected president by the National Assembly, under a single party. Accused of corruption
and incapacity in the management of relief (Salifou & technique (Paris), 1989), President
Diori Hamani was overthrown by a military coup in April 1974. It was then that
Lieutenant-Colonel Seyni Kountché took over the regime which he converted to a
military regime. His program focused on economic recovery and the pursuit of
cooperation with France, particularly in terms of uranium mining. In November 1987, the
president Senyni Kountche passed away and the Colonel Ali Seybou took control of the
country to become president in 1989 after civilians voted for a new constitution that
brought civilians back to power.
On March 27, 1993, during the first democratic election, Mahamane Ousmane
was elected President of the Republic, but was overthrown by a coup on January 27, 1996
led by Colonel Ibrahim Baré Maïnassara. In April 1999, President Maïnassara, was
assassinated by soldiers on the airfield of Niamey because of his refusal to have any
dialogue with the opposition. His successor, Commander Daouda Mallam Wanké, chief
of the Presidential Guard, described Maïnassara’s death as an "unfortunate accident", and
was named president by a national reconciliation council composed entirely of military
officers.
The elections of November 1999 gave the presidency to the retired colonel
Mamadou Tandja who led the country until 2010. On February 18, 2010, the president
Tandja was overthrown by a military coup. Salou Djibo the leader of the coup took
control of Niger from 2010-2011 as President of the Supreme Council for the Restoration
of Democracy. He transmitted the presidency on April 7th, 2011 to the newly elected
President of the Republic, Mahamadou Issoufou. Since Niger became independent from
France in 1960 to the present day there have been a total of nine people who have served
as head of state.
10
STUDY AREA BACKGROUND
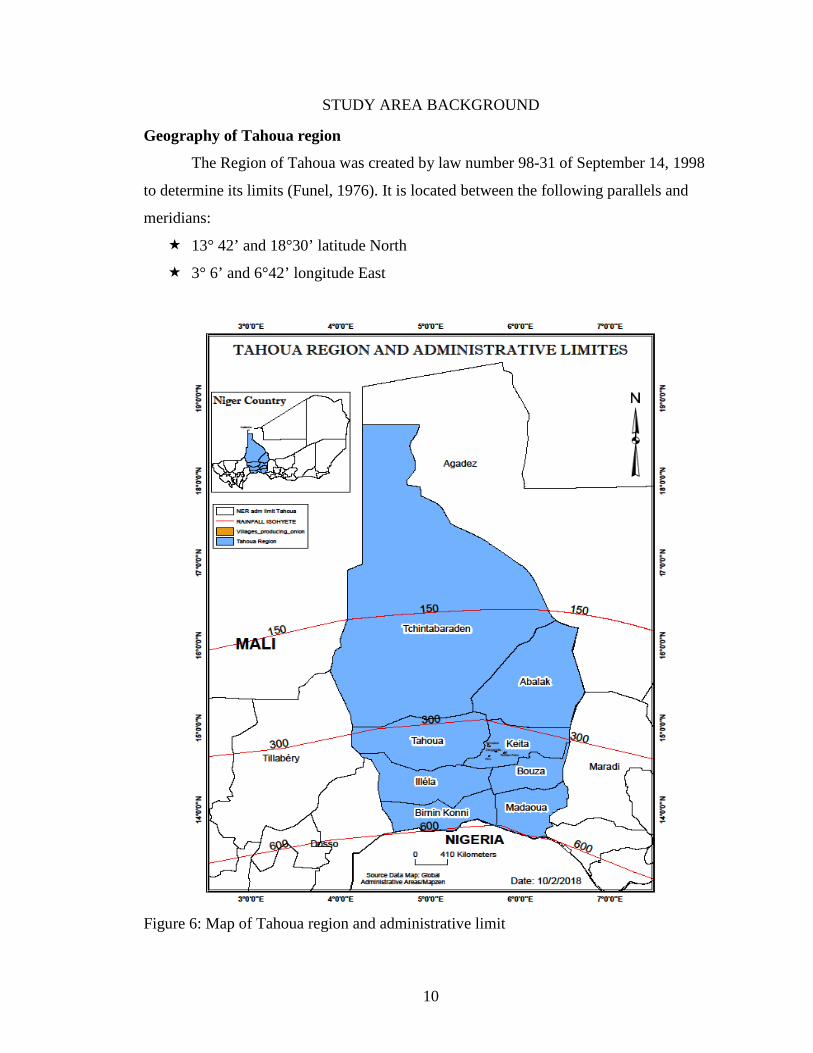
Geography of Tahoua region
The Region of Tahoua was created by law number 98-31 of September 14, 1998
to determine its limits (Funel, 1976). It is located between the following parallels and
meridians:
13° 42’ and 18°30’ latitude North
3° 6’ and 6°42’ longitude East
Figure 6: Map of Tahoua region and administrative limit
11
Tahoua region has an area of 113,371 square km and it represents 8.95% of the national
territory (Aziz Abdoul et al., 2015). The region is delimited in the north by the region of
Agadez, in the south by the Republic of Nigeria, in the east by the region of Maradi, in
the north west by the Mali Republic, in the west by the regions of Dosso and Tillabery
(figure 6). The Tahoua region is subdivided into eight departments Abalak, Birnin Konni,
Bouza, Illéla, Keita, Madaoua, Tahoua and Tchintabaraden. In general regions in Niger
correspond to states in US Census and departments correspond to counties.
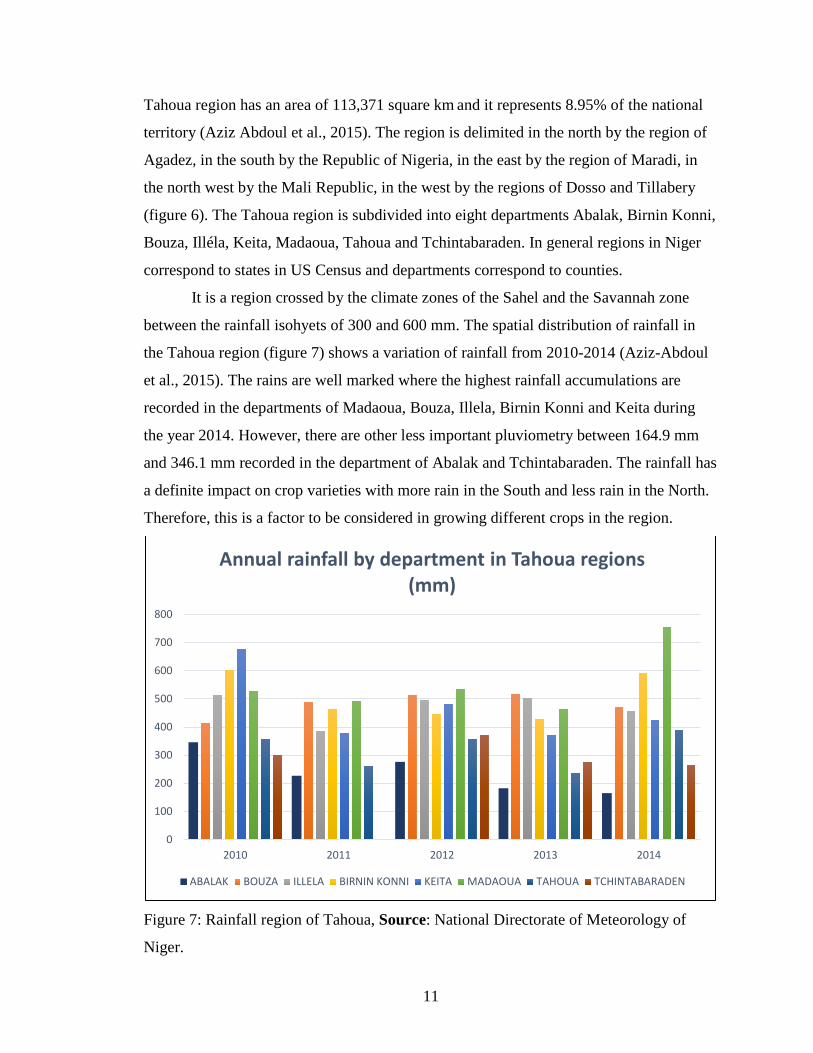
It is a region crossed by the climate zones of the Sahel and the Savannah zone
between the rainfall isohyets of 300 and 600 mm. The spatial distribution of rainfall in
the Tahoua region (figure 7) shows a variation of rainfall from 2010-2014 (Aziz-Abdoul
et al., 2015). The rains are well marked where the highest rainfall accumulations are
recorded in the departments of Madaoua, Bouza, Illela, Birnin Konni and Keita during
the year 2014. However, there are other less important pluviometry between 164.9 mm
and 346.1 mm recorded in the department of Abalak and Tchintabaraden. The rainfall has
a definite impact on crop varieties with more rain in the South and less rain in the North.
Therefore, this is a factor to be considered in growing different crops in the region.
Figure 7: Rainfall region of Tahoua, Source: National Directorate of Meteorology of
Niger.
0
100
200
300
400
500
600
700
800
2010 2011 2012 2013 2014
Annual rainfall by department in Tahoua regions (mm)
ABALAK BOUZA ILLELA BIRNIN KONNI KEITA MADAOUA TAHOUA TCHINTABARADEN
12
Soils
The relief is constituted of plateaus and hills overlooking slopes bordering the
fertile valleys. The geomorphology of Tahoua is composed of plateaus and fertile clay
valleys. These plateaus are covered by a typical vegetation association known as the
"brousse tigrée" (Tiger strips). Typical clay montmorillonite soil which shrink when dry
and swells when wet dominates the region There are few water permeable soils, which
accentuate runoff but also leave shallow soils that are poor in organics and nutrients. The
soils are extremely compact and acidic. The valley bottoms are characterized with fertile
clay soils that respond well to irrigation from ground water during the dry season. These
valleys are designated as good for growing onions.
Demography of Tahoua region
According to the general census data, December 24, 2012, the population of
Tahoua region was estimated at 3,328,365 habitants (Winfield, 2012). The major ethnic
groups that compose the population of this region are Hausa (the majority), Tuareg and
Fulani. Between 1988-2001 the average population annual growth was 3.3%. This
population is distributed unequally among the eight departments of Tahoua. The most
populated department is Birnin Konni with 253,879 people. The less populated
department is Tchintabaraden with 84,950 inhabitants. With the census results of 2001-
2012, the population of Tahoua region increased from 1,308,598 in 1988 to 1,972,907 in
2001 and finally to 2,810,716 inhabitants in 2012 (table 2). This can be explained by the
growth rate of the population which passed from 3.3% for the period 1988-2001 to 3.9%
for the period 2001-2012 (Statistique (INS) et al., 2013). In addition, the fertility rate and
health and the education level improved.

13
Tabl
e 2:
Cen
sus d
ata
of T
ahou
a re
gion
pop
ulat
ion
for 1
988,
200
1 &
201
2. P
opul
atio
n da
ta fo
r by
gend
er w
as n
ot a
vaila
ble
for 1
988
Dep
artm
ent
(Cou
ntie
s)
Popu
latio
n
1988
Popu
latio
n
2001
Popu
latio
n
2012
Tota
l
Mal
e
Fem
ale
Tota
l
Mal
e
Fem
ale
Tota
l
Mal
e
Fem
ale
Aba
lak
…
…
…
80,9
55
41,7
72
39,1
83
256,
301
134,
005
122,
296
Birn
in,K
onni
253,
879
…
…
363,
176
185,
065
178,
111
312,
886
157,
066
155,
820
Bou
za
180,
805
…
…
277,
782
138,
979
138,
803
445,
363
220,
749
224,
614
Illél
a
175,
080
…
…
263,
832
131,
498
131,
498
336,
621
168,
142
168,
479
Kei
ta
159,
675
…
…
218,
337
105,
447
112,
890
337,
098
165,
280
171,
818
Mad
aoua
214,
025
…
…
319,
374
162,
773
156,
601
545,
538
274,
507
271,
031
Taho
ua
240,
184
…
…
359,
994
174,
930
185,
064
431,
823
208,
931
222,
892
Tchi
ntab
arad
en
84,9
50
…
…
89,4
57
45,7
68
43,6
89
145,
086
72,6
75
72,4
11
Tota
l
1,30
8,59
8
…
…
1,97
2,90
7
986,
232
986,
675
2,81
0,71
6
1,40
1,35
5
1,42
1,28
7
14
ONIONS
Methodology
The methodology used in this research is based on documentary information and
field interviews with 100 onion farmers. The documentary research was done by the
author at the following research centers:
1. Laboratory Documentation Center for Studies and Research on Social dynamics
and Local development (LASDEL) in Niamey, Niger
2. The Regional Management for Tahoua Agricultural Development
This research links to some institutions such as the National Agricultural Institute of
Research in Niger (INRAN), the National Council of Public Transport users in Niger
(CNUT), the National Institute of Statistics (INS) and the Ministry of Agricultural
Development.
3. The following were setup for focused examinations:
The department of Tahoua region produces more onions because they are more assessible
to merchants. Some villages from the more important onion growing departments like
Tamaske and Guidan Foko are faced with poor road conditions.
During field investigations, the major onion producing areas were studied at the
department level. An interview questionnaire (see appendix) was given to the farmers of
the selected villages to collect information about the production, the transportation and
the process of onion commercialization. These interviews also provided the necessary
information about the onion storage system and the market pricing. These visits to the
research sites provided the information about the farmers, including data on land tenure,
irrigation methods and infrastructure provided by agricultural extension agents and
financial support groups.
History of Niger’s onion
Onion growing as practiced in Niger has developed with the use of irrigation.
According to David Olivier, its introduction probably took place in the seventh century
with the roads of trans-Saharan trade (Olivier David, 1999).
15
Indeed, the Hausa name for the onion "Al Bassa" found its origin from the
Egyptian Arabic term “bassal” or Bussul. Nevertheless, the evidence of its presence in
the Tahoua region dates to the seventeenth century, with the formation of the first
production center around Tamaské. The onion of Maggia, which was selected and named
“Violet de Galmi’’, has a history beginning in the 17th century. The importance and the
uniqueness of this crop can be attributed to the growing techniques (see pages 22-27)
acquired by the farmers of this region (NDIAYE et al., 2009). In 1970, the food
insecurity situation of Niger pushed the colonial regime to develop the rain fed crops;
particularly the traditional cereal crops (millet, sorghum, maize, and rice) and an
increasing interest in expanding the onion production area. This is what led to the
formation of a second production center in the valley of Maradi region.
Niger has two seasons when irrigated onion growing is productive: The first one
begins in October and extends until January. During this period, the concurrent
production of onions in the neighboring countries is less competitive than that of Niger
because of the climatic differences. This provides the Niger onion a huge economic
advantage. The second season extends from December to March. In this cropping period,
the crop productions in nearby countries such as Burkina Faso, Ghana, and Benin are the
same as in Niger and provide significant competition. Among the cultivated varieties, the
Violet de Galmi of Tahoua is very much in demand in West Africa and has a great
competitive advantage throughout the sub-regional markets.
Supporting infrastructure for the onion
Governmental and private institutions, such as agricultural research institutions,
and market information systems provide support for onion production and its marketing.
The National Network of Agricultural Chambers of Niger (Niger RECA) and the markets
Information System (SIMACO, 2007) help to improve the communication function in the
onion sector. They also serve to circulate information on prices and stocks. The point of
villager’s information (PIV) is a professional grouping center that offers information
supporting onion farmers. This information represents current details for the farmers in
accessing prices, inputs, inventory and transportation.
16
There are seven PIVs in Tahoua which produces 60% of the onion farming, two in the
region of Tillabery, one each in Zinder, Maradi, Dosso, Agadez and Niamey.
There are also other partners supporting onions sector such as:
CCAIAN: Translation (Chambre de Commerce, d'Agriculture, d'Industrie et d'Artisanat
du Niger), Chamber of Commerce, Agriculture, Industry and Crafts of Niger
ANIPEX: Translation (Agence Nigérienne pour la promotion des exportations), Nigerien
Agency for Export Promotion
ANPIP: Translation (Association nigérienne de promotion de l'irrigation privée), Niger
Association for the Promotion of Private Irrigation
ANFO: Translation (Association Nationale des Professionnels de la filière Oignon du
Niger), National Association for Onion Professionals sector of Niger (2004).
There is a growing awareness of the actors in the region with the creation of different
organizations in which many people are interested. Unfortunately, there are some
leadership problems hindering the effectiveness of these organizations. Some village
chiefs are at the same time producers, sellers and exporters of onions. This weakens the
price negotiating power of the poorer villagers
Distribution centers of onion collection sites
Main production regions
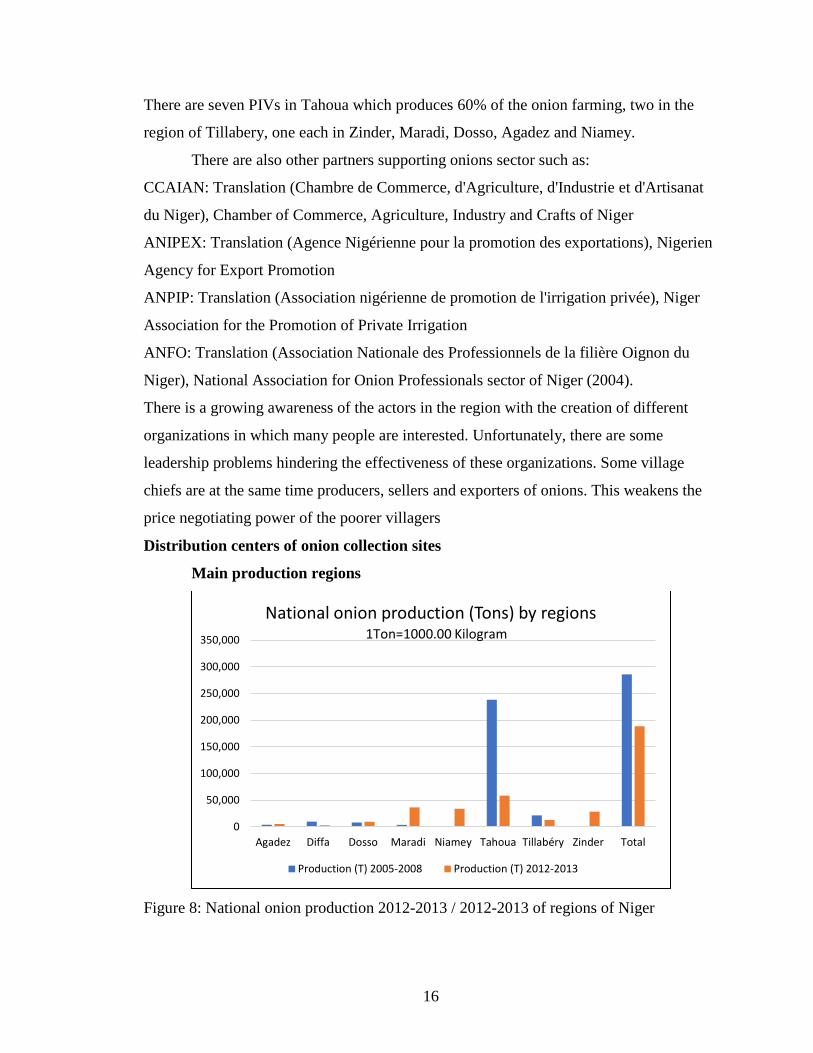
Figure 8: National onion production 2012-2013 / 2012-2013 of regions of Niger
0
50,000
100,000
150,000
200,000
250,000
300,000
350,000
Agadez Diffa Dosso Maradi Niamey Tahoua Tillabéry Zinder Total
National onion production (Tons) by regions
Production (T) 2005-2008 Production (T) 2012-2013
1Ton=1000.00 Kilogram

17
Onion is an irrigated crop grown in all regions of Niger but varies differently from
area to area. The largest production is concentrated in the Tahoua region where two
seasons are harvested annually, one irrigated and the other rain-fed. During the period
2005 - 2008, Tahoua represents 72% of all onions produced in Niger. In 2008 the
national production of onions was 373,600 tons from an area of 19,200 hectares (Statistic
(INS) et al., 2013). The national production has become 188,767.59 tons from an area
18,754.88 hectare during 2012-2013. This decrease of production and cultivated area is
due to the lowering of groundwater and the methods of production. Regarding onion
cultivation, all regions of Niger are good but the areas for onion cultivation varies from
one region to another. Figure 8 shows that Tahoua region has the highest production of
the country which represents the main production area. This is due to the willingness to
develop areas favorable for onion cultivation and to the expertise of the farmers. With the
large area, Tahoua has become the most significant region for growing onions in Niger.
In 2012-2013 the onion production of Tahoua achieved 58,863 tons with
cultivable area of 12,480.20 hectares. The onion data during 2005-2008 were not
available for Niamey and Zinder regions, figure 8 shows that there are some other
important production areas such as Diffa, Dosso and Tillabéry regions. Agadez and Diffa
have large areas, but they have less production than the other regions. This means that the
production may not only depend on the area favorable for onion cultivation, but it is
linked to the methods of production and the expertise from generation to generation. On
the other hand, the national production 2005-2008 was much better than the one in 2012-
2013. The production is declining although Tahoua is still the largest producing region in
Niger. The onion production over the four years is not the same around the national
territory (figure 8). Onion crop is concentrated mainly in Tahoua region with 238,240
tons. The remaining territories only produce 47,614 tons. The production is provided by
individual producers who benefit from the support of some actors who support the onion
production.
Description of onion production in Tahoua
Agriculture is the main economic activity of Tahoua region occupying more than
90% of the population. In Tahoua region the land tenure is acquired through inheritance
(70%), purchase (10%) and rental (20%).
18
The major irrigated crops of Tahoua region are, in order of importance; onion, tomato,
potato, sweet potato, cassava, watermelon and lettuce.
Most of the production is destined for sale. Income from onions is used for paying taxes,
social spending and the purchase of livestock (cattle, goats, and sheep). The development
of the onion sector in Tahoua region is essential for food security, but also for generating
tax revenues for the Departments. Onion production provides an overall safety-net with
respect to the economy of the region.
Environmentally, the main constraints are particularly important with respect to
several elements such as soil erosion, inadequate rainfall, and attacks by crops pests.
Added to this, there are difficulties in accessing pesticides, improved seeds and irrigation
water. The cultivation of the onion has a long history in the Tahoua region. People
exploited the onion before independence, especially in the communes of Keita and
Tamaské. The Hausa are the first people in Niger to be interested in the culture of the
onion. Although the practice is ancient, women are engaged in small scale onion culture
but not large commercial farming. Traditionally women do not engage in commercial
agriculture because of the difficulties and its limited resources and the purchase of inputs
such as fertilizers and pesticides. This activity is emphasized and recognized for its social
place in Hausa society. The local markets cannot consume all the onion production and
much of it goes to Tahoua and more distant Niger. A good road is being constructed to
support exchanges over longer distances.
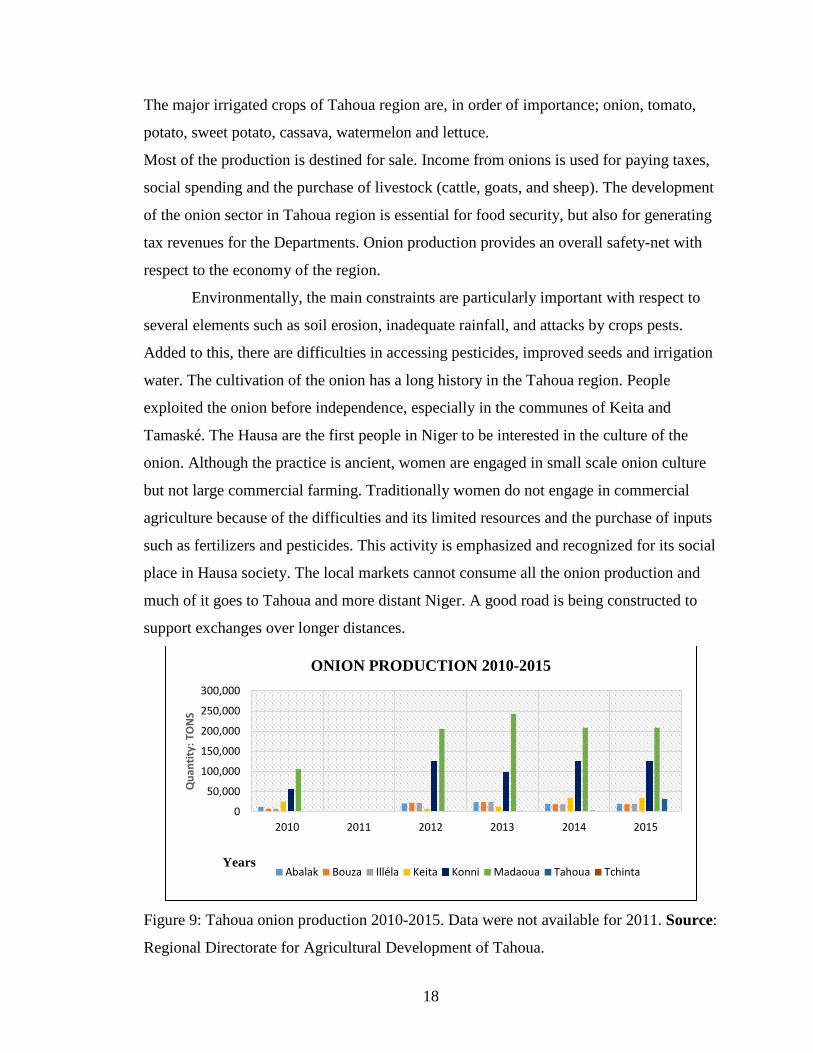
Figure 9: Tahoua onion production 2010-2015. Data were not available for 2011. Source:
Regional Directorate for Agricultural Development of Tahoua.
0
50,000
100,000
150,000
200,000
250,000
300,000
2010 2011 2012 2013 2014 2015
Qua
ntity
: TO
NS
Years
ONION PRODUCTION 2010-2015
Abalak Bouza Illéla Keita Konni Madaoua Tahoua Tchinta

19
Onion cultivation is concentrated mainly in Madaoua and Konni Departments
from 2010-2015. This activity is a highly recognized in the Hausa society. However,
there are large and small growers who produce large amounts of onions in the
Departments of Keita, Bouza, Abalak, Illela and Tchintabaraden. The production was
high in 2013-2014 because of higher precipitation. This was not the same in the
Departments of Abalak, Tahoua and Tchintabaraden. In 2015 the weather conditions of
Niger were favorable, and the highest quantity of onions were produced in Madaoua with
208,670.51 tons (figure 9).
Techniques of production
In Tahoua region, the onion fields are divided into 2-5 m2 parcels (figure 10),
some dedicated to produce seeds and others for growing onions for consumption (Ndiaye
et al., 2009). Most of the farmers produce their own onion seeds based on their personal
expertise. The purchase of onion seed is rare even though the seeds are available in the
shops in some markets. The purchase of the seed is avoided, and great care is taken to
preserve the genetic purity of the local seed which would otherwise be diluted with seeds
from the market. Only a few onion farmers buy germinated seeds from the plant nurseries
and replant them on their farm. The cost of these seedlings varies depending on the size
of the parcel. The seed producers give credit to the farmers to be repaid in onion bags of
50kg or 150kg. The survey shows that farmers are well known for this practice. The
discussions with the farmers of the department of Keita indicate that the seed pods are
selected from those preserved in a traditional shelter named Rudu (figure 11) with a
deferred sales payment following five to six months of storage.
Figure 10: Irrigation parcels of onion in Keita, Tahoua/Niger

20
Figure 11: Rudu (Traditional storage of onions: structures are made of millet stalks) in the commune of Zangaratta, Keita, Tahoua/Niger
The onion bulbs are generally chosen according to the following criteria: absence
of early sprouting, an average weight, and a violet color indicating good capacity to be
stored up to 6 months. The bulbs selected must not have flowered the first year and have
an average weight of about 150g. After sorting, the one-inch diameter bulbs are cut
crosswise into two parts: the bottom part of the bulb, which will become the root is
planted, and the top portion is consumed by farm families. This traditional transplant
technique by these farmers is based on the practice where the bottom half of the bulbs
grow to become seed onions. Once planted, it takes forty days to produce seeds (figure
12). These plants produce yellow flowers garnished with seeds. These in turn transition
from yellow to black, showing that the seeds have reached maturity. The stems holding
the black seeds are cut, hung on a hanger facing the sun until they become dry. Once they
are dry, they are processed with a mortar and pestle to be transferred to a dry location and
stored in cotton bags for up to a few months before planting.
Figure 12: Onion seed production, Keita/Tahoua

21
Transplantation system
In Tahoua region, a few farmers purchase onion sprouts grown in another farmers
nursery while most farmers transplant their personal nursery. The nursery is planted in
mid-October; however, some farmers prepare their nurseries in September at the end of
the rainy season, planting in dry places to prevent excess water from damaging the young
plants. The gap, 15- to 20 cm between transplanted bulbs provides high-caliber onions,
greater than or equal to 50g. When transplanted with approximately 10 cm, the bulbs are
able to grow to an average size of 50g which is preferred by the traders for better
preservation during transport. The bulbs transplanted early in the first season are for an
early harvest.
Figure 13: Transplantation system
Sections transplanted early in the first season (October-January) are for an early harvest
in 2010 (figure 13). Seven-centimeter-high soil ridges are constructed to hold irrigation
water that soaks the young onion plants in the first growing season (October- January).
Water is brought through the small ditch to the right and temporary cuts in the ridges
allow water to flood each parcel separately for one day.
Existing varieties
According to the survey results there are several varieties of onions grown in the
Tahoua region. The white and red Soumarana were introduced from Nigeria. However,
the Violet de Galmi is the common local variety and is known throughout this sub-region.
Consumers recognize the Violet de Galmi by its purple color and spicy flavor for which it
is famous. The qualities of this variety are certainly related to the local soil, but also to
the expertise of farmers that is passed down from generation to generation. The seed
production system of the Violet de Galmi onion is standard for all the farmers.

22
The majority of the farmers produce their own seeds in the field and follow techniques
that maintain the purity of the varieties. Most farmers buy seed only from farmers who
have gained this expertise. This understanding reflects a high degree of trust between the
farmers.
Irrigation system
With irrigation, farmers are able to regulate the production of onions. Traditional
wells (figure 14a), modern wells and boreholes produce the water for growing onions
(figure 14b, 14c). According to farmers, the use of the hand pumps forces them to irrigate
only short distances. The hand pumps are replacing more traditional water wells where
buckets are drawn to the surface with ropes from 5 meters below. Some of these wells
collapse each year and need to be re-dug. In the region of Tahoua, the onion farmers use
motor water pumps more than they use the manual hand pumps and animal traction
systems (figure 15). The mismanagement of irrigation water by farmers and the high
evaporation rates lower the level of the ground water. Because of this, there is a need to
modernize the irrigation techniques to conserve water for onion production.
Figure 15: Irrigation system with animal traction in Tamaske, a donkey lifts water 10
meters from a traditional well with a pulley.
Figure 14b: Pipe releasing irrigation ground water in the onion field
Figure 14a: “Moto” pump draws water from a traditional well
Figure 14c: Irrigation channel distributes ground water to the separate parcels

23
These pictures show the animal traction system used to draw water from the wells for the
last 40 years. A donkey pulls the rope to bring the water bucket from the well. The water
is poured into a channel connecting to the onion field.
The harvest
After 120 to 150 days of planting, normally in December the onion farmers dig up
bulbs with great care to avoid bruising (figure 16). The onions leaves are cut to cover the
harvested bulbs which are left drying in the field for 4 to 10 days for partial dehydration.
Then, the onions remain stored in one place and are covered with the same leaves to
protect them from the sun. Because of the two onion harvest cycles, the department of
Keita is unique from the surrounding regions. The onions harvested in the first cycle are
marketed directly to wholesalers who export directly to neighboring countries. The
second harvest in March, the onions are stored temporarily until the price get high.
Figure 16: Careful onion harvest at Tamaské/Keita/Tahoua

24
ONION MARKETING AND LOCATION ALLOCATION
Commercialization
Marketing involves several actors: merchant-exporters, importers and other actors
in the onion sector (Terpend, 2006). The distribution circuits come in various forms
ranging from the relationship between the producer and the consumer through many
intermediaries. In general, the marketing of onions takes a long circuit containing many
actors. Most often family relationships play an important role in the marketing network
between producers, intermediaries, retailers and transporters.
Figure 17: The marketing distribution network of Niger onions
Moreover, depending on the degree of trust, the farmers give their harvest to the
Nigerien traders who are responsible for export. The traders pay money to the farmer
once they return from selling the onions. The intermediaries inform traders of the
availability of onions through telephone contacts.
Farmers
Commercialization system
Local consumers Local markets
Local consumers
Intermediate
External markets(from the sub-region)
External consumers(from sub-region)
Local markets
Local consumers

25
Their role is to collect onions; find customers; and negotiate the onion prices based on the
product quality. In addition, they supervise the filling of bags (packaging), the payments
and the loading. When the buyers arrive, the intermediaries inform the farmers about the
price negotiated with the merchants. They also control the quality before starting to fill
the onion bags.
Indeed, the purchase is done at the primary collection centers (farms) and at the
secondary collection centers at the loading center. The commercialization of Niger onions
can be represented by a graphic which shows the marketing distribution network (figure
17). While local consumers’ diets include some onions, most of the onions are sent to
external markets for consumers of the sub-region (Bruxelles, CSA, 2011).
The surveys (appendix) of the various villages show the after-harvest onion
production as follows: consumption and gifts (10%), farmer’s credit repayment
(approximately 50%) and the cost of marketing (40%). The amount of onion for
commercialization can be sold entirely at the farm (figure 20) when there is a huge need,
sometimes stored, partially or totally. In the department of Keita some producers
transport their onions using a cart or on the back of a camel (figure 18) from the field to a
storage place, or from a village to the distribution center (figure 19) and the rates vary
depending on the distance.
Figure 18: Onion transportation system to the loading place.
26
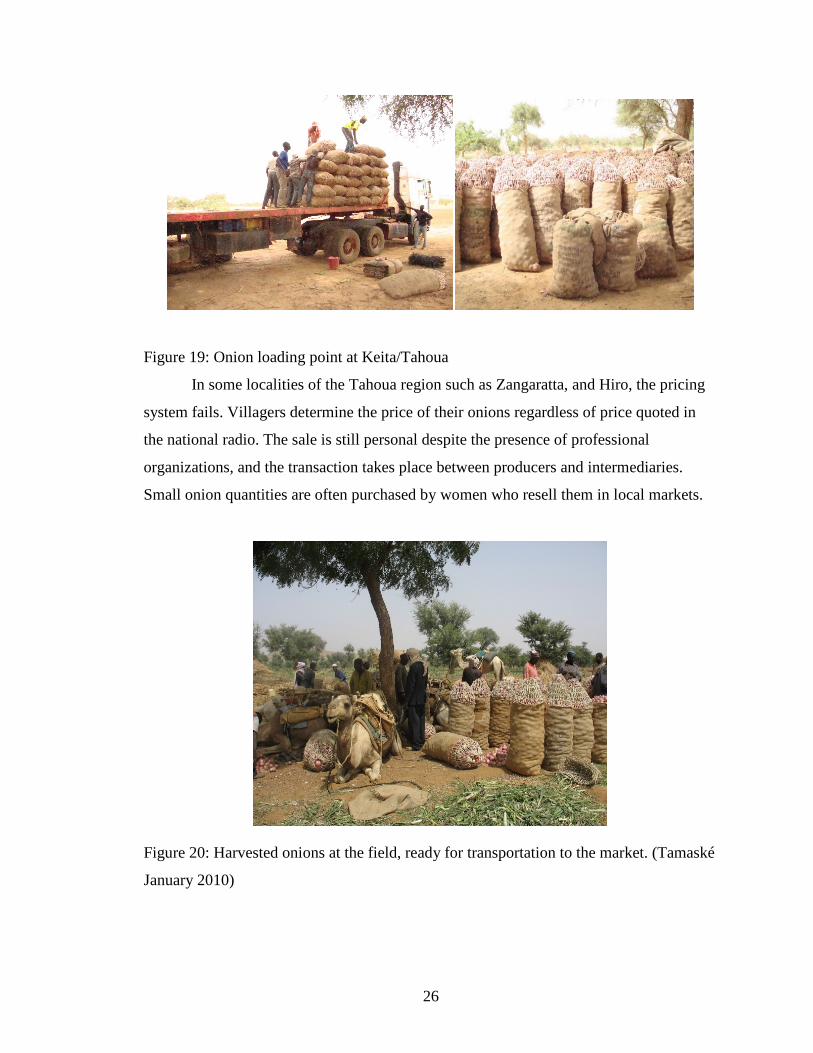
Figure 19: Onion loading point at Keita/Tahoua
In some localities of the Tahoua region such as Zangaratta, and Hiro, the pricing
system fails. Villagers determine the price of their onions regardless of price quoted in
the national radio. The sale is still personal despite the presence of professional
organizations, and the transaction takes place between producers and intermediaries.
Small onion quantities are often purchased by women who resell them in local markets.
Figure 20: Harvested onions at the field, ready for transportation to the market. (Tamaské
January 2010)

27
Act
iviti
es
Jun
July
Aug
ust
Sept
embe
r
Oct
ober
Nov
embe
r
Dec
embe
r
Janu
ary
Febr
uary
Mar
ch
Apr
il
May
Soil
Prep
arat
ion
Plot
deve
lopm
ent
Tran
spla
ntat
ion
Ferti
lizer
appl
icat
ion
Irrig
atio
n
Har
vest
Figure 21: Calendar of onion production in Niger
As previously noted, Niger's weather conditions allow two onion production
cycles:(figure 21) from September to December (first cycle) and from December to
March (second cycle). Fertilization is done by using manure and imported chemical
fertilizer which are marketed in supply centers privately owned through formal and
informal channels.
28
The irrigation system is classified into two categories:
a traditional system, where water is hand bucketed from wells
a diesel pumping system from wells.
However, there is also a diesel power water sprinkle system on the large-scale farms (5-
10ha).
Economic and social place of the onion
Onion production is a major component of the national economy. Onions are also
consumed throughout the region, although there are significant disparities in consumption
between urban and rural areas. Rural farmers are more interested in the money for
investing in other foods or personal necessities while the urbanists consume onions at a
higher rate. Onions are consumed during the whole year for the preparation of sauces,
except in some areas where they are part of the traditional eating habits. The unit costs of
production in the countries of the sub region vary according to the soil type, climate, and
the economic conditions in which farmers operate. They influence both yields and the
factors of production including quality, quantity and price of labor and inputs.
Consideration should be given to the costs of different means of transportation, which
help to establish the competitive capacity of the various production areas in the
consuming markets.
The region of Tahoua has fertile valleys favorable to crop production that
generate revenue contributing to the strategy of reducing poverty. West African countries
produce a variety of onions. However, Niger is the country that exports significant
surplus onions throughout the region. An opportunity for exchange between these
countries derives from the gap between supply and demand throughout the sub region.
Ivory Coast, Ghana, Benin, and Togo have significant onion demand that cannot be met
by their own production. The onion most wanted by sub-regional consumers is Violet de
Galmi of which Niger remains the main supplier(Bruxelles, CSA, 2011).
Physical flow of onion
In west Africa, the onion market is very important. This fact is highlighted by the
increase in production and consumption in recent years. The onion of Niger dominates
the market of the sub region during a certain period.There are many countries importing
onions from Niger to meet the domestic need of their population (figure 22).
29
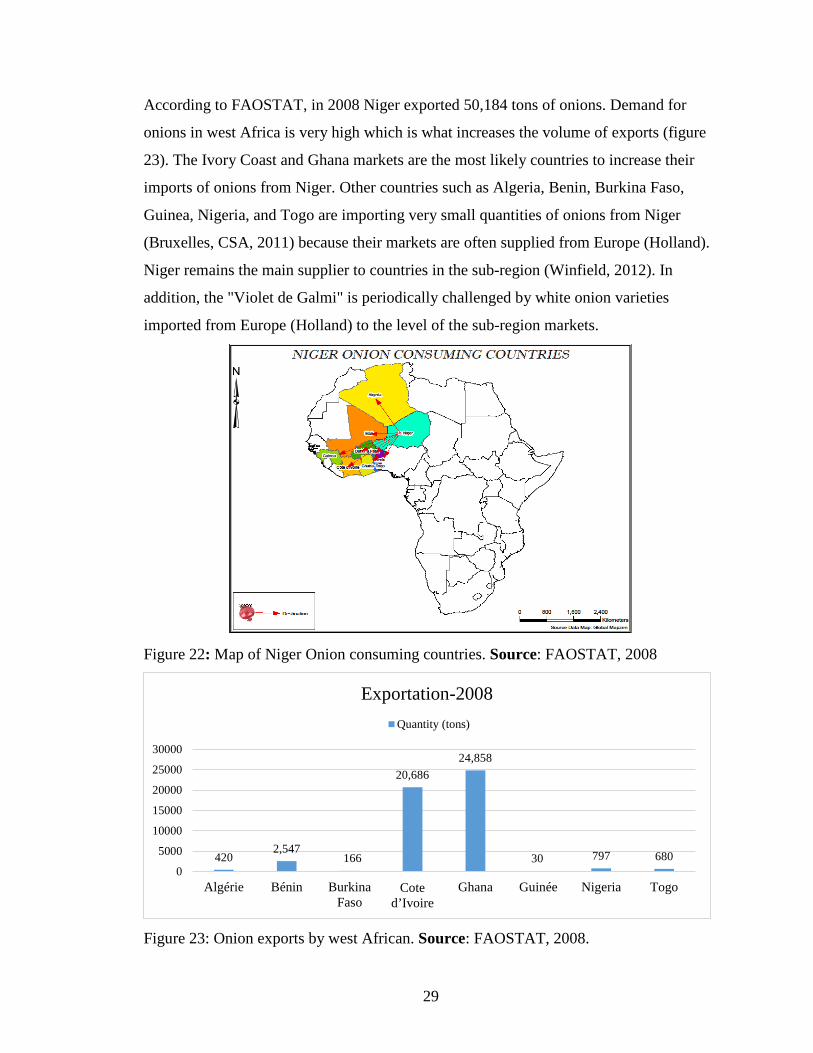
According to FAOSTAT, in 2008 Niger exported 50,184 tons of onions. Demand for
onions in west Africa is very high which is what increases the volume of exports (figure
23). The Ivory Coast and Ghana markets are the most likely countries to increase their
imports of onions from Niger. Other countries such as Algeria, Benin, Burkina Faso,
Guinea, Nigeria, and Togo are importing very small quantities of onions from Niger
(Bruxelles, CSA, 2011) because their markets are often supplied from Europe (Holland).
Niger remains the main supplier to countries in the sub-region (Winfield, 2012). In
addition, the "Violet de Galmi" is periodically challenged by white onion varieties
imported from Europe (Holland) to the level of the sub-region markets.
Figure 22: Map of Niger Onion consuming countries. Source: FAOSTAT, 2008
Figure 23: Onion exports by west African. Source: FAOSTAT, 2008.
4202,547
166
20,68624,858
30 797 6800
5000
10000
15000
20000
25000
30000
Algérie Bénin BurkinaFaso
Cote d’Ivoire
Ghana Guinée Nigeria Togo
Exportation-2008Quantity (tons)

30
Location allocation
With scientific advances, facility location problems became a branch of
optimization (Tafazzoli & Mozafari, 2009). The objective of this study is to minimize the
transportation cost by identifying the optimal locations of onion distribution centers and
to find the best locations to sell all onion production. Previously, the different
departments of Tahoua region had an original location for distribution centers (data is not
available) based on tradition that facilitated access to the loading points for the trucks.
Unfortunately, those loading points were chosen without any location optimization
considerations. Mathematically, the transport cost increased for all demand points which
intern added to the cost for all the actors involving (famers, buyers and seller) in the
sector.
A total of 8 facilities are needed to cover all 202 demand nodes with an average
minimum distance of 230.8 km. figure 24 shows the proposal collection sites that would
minimize travel expenses from all the demand points. The classification of facility
location is based on optimizing the decisions to locate facilities to minimize the variable
costs and maximize the assignment for customers (Masudin, 2013). The customers are
the most important consideration in selecting facility location regarding minimize their
transportation costs. It means that the location-allocation analysis tools using GIS makes
it possible to determine the best locations to reach for each department of Tahoua region
if the onion gets the same price of production everywhere in Tahoua region. The chosen
facilities represent the optimal places where the intermediaries in charge of onion export
would also benefit with the minimization of their transportation cost.

31
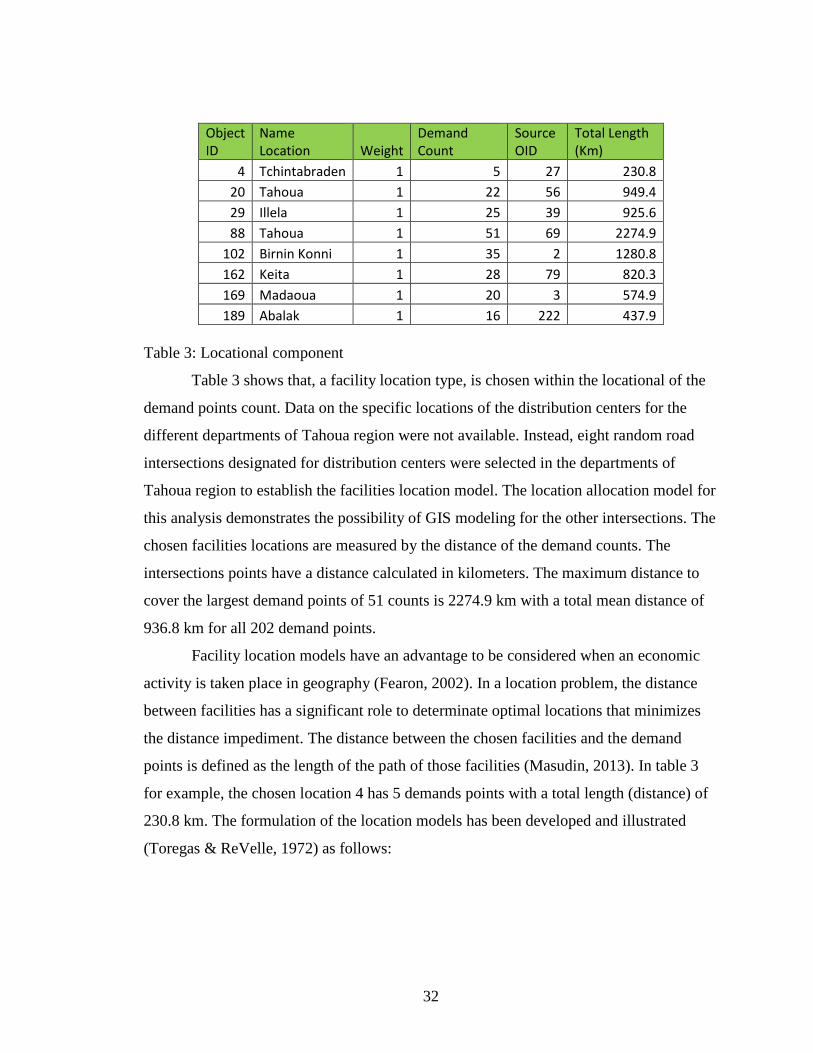
Figure 24: Eight facilities covered all demands in 230.8 km.
32
Object ID
Name Location Weight
Demand Count
Source OID
Total Length (Km)
4 Tchintabraden 1 5 27 230.8 20 Tahoua 1 22 56 949.4 29 Illela 1 25 39 925.6 88 Tahoua 1 51 69 2274.9
102 Birnin Konni 1 35 2 1280.8 162 Keita 1 28 79 820.3 169 Madaoua 1 20 3 574.9 189 Abalak 1 16 222 437.9
Table 3: Locational component
Table 3 shows that, a facility location type, is chosen within the locational of the
demand points count. Data on the specific locations of the distribution centers for the
different departments of Tahoua region were not available. Instead, eight random road
intersections designated for distribution centers were selected in the departments of
Tahoua region to establish the facilities location model. The location allocation model for
this analysis demonstrates the possibility of GIS modeling for the other intersections. The
chosen facilities locations are measured by the distance of the demand counts. The
intersections points have a distance calculated in kilometers. The maximum distance to
cover the largest demand points of 51 counts is 2274.9 km with a total mean distance of
936.8 km for all 202 demand points.
Facility location models have an advantage to be considered when an economic
activity is taken place in geography (Fearon, 2002). In a location problem, the distance
between facilities has a significant role to determinate optimal locations that minimizes
the distance impediment. The distance between the chosen facilities and the demand
points is defined as the length of the path of those facilities (Masudin, 2013). In table 3
for example, the chosen location 4 has 5 demands points with a total length (distance) of
230.8 km. The formulation of the location models has been developed and illustrated
(Toregas & ReVelle, 1972) as follows:

33
Min ∑xj j∈ J
∑xj ≥ 1 ∀ i ∈ I j∈Ni
xj ∈ {0, 1} ∀ j ∈ J
Where,
I = to the set of demand nodes
J = to the set of candidate locations
Ni = to the set of all candidate sites which can cover demand node i
xj = 1 if we locate at candidate site j and 0 otherwise
This function was assigned to minimize the number of facilities needed to cover all
demands. The maximal covering locates facilities which can maximize the number of
covered demands (R. Church & ReVelle, 1974). The maximal covering can be
formulated as follows:
Max ∑ hiZi i∈I
∑ xj = P j∈J
Zi - ∑ xj ≤ 0 ∀ i ∈ xj ∈ {0, 1} ∀ j ∈ J
Zi ∈ {0, 1} ∀ i ∈ I
Where; hi = demand at node i
p = number of facilities to be located
xj = 1 if candidate located at node j = 0 otherwise
Zi = 1 if demand I covered by location j = 0 otherwise
The second function is assigned to maximize the number of covered demands.

34
The difference between the two coverings is in the objective functions where the purpose
to minimize the number of facilities will be in the condition that each demand point has
to be covered, at least, by one facility. Also, the maximal covering selects p facility to
maximize the number of coverages demands (Daskin, 2008).
P-median
The P-median problem was first used by Hakimi (1964) to find medians on graph
to determine a median point on the network which minimizes the sum of distance
between the point and the graph’s vertices (Marianov & Serra, 2009). The first methods
that were proposed for solving the p-median were heuristic. Among these, (Daskin, 2008)
describes heuristic that randomly locates p facilities and solves the allocation problem.
The p-median problem application is widely used in public and private sector location
decisions. In public sector, the p-median is used for example for hospitals, schools, fire
emergency to solve a problem by minimizing the average distance between the
community and the public facilities (Marianov & Serra, 2009). The works of (R. L.
Church & ReVelle, 1976) proposed an optimal procedure for p-median, based on linear
programming and their formulation is as follows:
P-median =
Min ∑ hidijxij (1) i,j
∑ xij = 1 i, j = 1, 2, …n (2) j∈ j
xij ≤ yj i, j = 1, 2, …n (3)
∑ yj = P (4) j∈ j
x ij, y j ∈ {0,1} i, j = 1, 2, …n (5)
Where:
i Index of demand points
j Index of potential facility sites
n Total number of potential facility locations
hi, Weight associated to each demand point.

35
dij Distance between demand area i and potential facility at j.
xij Variable that is equal to 1 if demand area i is assigned to a facility at j, and 0
otherwise
yj Variable that is equal to 1 if there is an open facility at j, and 0 otherwise. The
objective function (1) minimizes the demand-weighted total distance, so each demand
point to be assigned to only one facility. Constraints 2) allows each demand to be
assigned. Constraints (3) limit assignments to open or selected sites. Constraint (4) states
where p facilities are to be located. Finally, constraints (5) represents the binary integer
model valued 0 or 1 for the decision variables (facility location candidates).

36
CONCLUSION AND RECOMMENDATIONS
Today, the onion is a cash crop that is experiencing significant development in
Niger mainly in the Tahoua region because of the existence of its large valley favorable
for onion production. This sector has been developed for coastal markets which absorb
most of the production. The poor distribution of rainfall over time and space puts several
departments of the region in a situation of food crop deficit. Faced with this phenomenon
many farmers practice the cultivation of onions. This activity has constraints and needs
strong efforts to develop. Onion marketing is hampered by the lack of dependable
transportation from the farms to the markets. Once the roads have improved, the onion
farming in the departments of Tahoua will be greatly enhanced. The advantages of the
onion crop in the Tahoua department includes the availability of a productive variety
adaptable to storage. The existence of good soils for production, the mastery of
production technique, storage technic, and the development of the two seasons of
production, favor a supply of Violet Galmi throughout the year for domestic and foreign
markets. However, to promote the marketing, it is very important to create a packaging
with more advertising and informative value and better conditions for the onion.
In addition to this, the regional department should take into consideration the
allocated distribution centers because the road network analysis identifies the ideal
locations serving the departments. The location of the eight distribution centers indicates
the places with the highest economic demand. It is more convenient to take the onion to
those distribution centers because it reduces the total cost of distance and time for the
farmers.

37
APPENDIX
Questionnaire
Q1: Name of farmer:
Location:
Date:
Sex: M F
Q2: Main activity
a. Farmer b. Merchant c. Other
Q3: What is the onion marketing period?
a. All year long b. Only in certain seasons
Q4: Do you have some collaborators? Yes, or No
What is their role?
Village collector b. Truck driver c.
Informers
Q5: Where do you do generally sell your onion?
a. Village b. Road c. Market
Q6: Where do you export the Nigerien onion?
Q7: What is the amount of onion that you sell monthly?
Q8: How much the onion bag cost?
Q9: Is there any seasonal variation? Yes, or No
Q10: How do you get information about the availability and price of onion?
a. Informers b. Radio c. Newspapers
d. Other

38
Q11: Do you store your onion before selling it?
Q12: What type of problems do you encounter in stage?
Q13: How are you organizing to transport the merchandise?
a. Individual b. Collective c. Other
Q14: What are the problems related to the transportation of onion?
Road poor condition b. Unsuitable transportation c. Long distance
Q15: What are the main Nigerien market where you sell your onion?
Q16: In which countries do you export your onion?
Q17: In what period of the you export more onion?
Q18: Where do you get the onion seed?
Q19: Why do you prefer the local seed but the one in the store?

39
REFERENCES
Abdou, R., Malice, M., Bakasso, Y., Saadou, M., & Baudoin, J. P. (2014). Folk
taxonomy of Niger onion diversity and analysis of farmer criteria for
characterizing the different ecotypes. Cahiers Agricultures, 23(3), 166–176.
Adamczewski, A., Hertzog, T., Jamin, J.-Y., & Tonneau, J.-P. (2015). Competition for
irrigated land: inequitable land management in the Office du Niger (Mali).
International Journal of Sustainable Development, 18(3), 161–179.
Andres, L. (2017). Définition d’un outil d’aide à la décision spatiotemporel structurant et
articulant les potentialités de développement agricole: cas du Niger. Gembloux
Agro-Bio Tech Université de Liège,Gembloux, Belgique.
Andres, L., & Lebailly, P. (2013). Le sésame dans le département d’Aguié au Niger:
analyse d’une culture aux atouts non-négligeables dans une zone agricole à forte
potentialité. Tropicultura, 31(4), 238–246.
Assane Dagna, M. (2006). Les effets de la reappropriation de la culture du “Violet de
Galmi” par les producteurs d’oignon de la region de Tahoua, sur la dynamique
du territoire local, l’organisation sociale et economique. Atelier national de
reproduction des theses, Lille. Retrieved from /z-wcorg/.
Aziz Abdoul, H., Mohamed, M., & Alhassane, T. (2015). Annuaire Statistique Regional
de Tahoua 2010-2014 (p. 184). Direction Regionale de Tahoua.
Bamgbose, A. (1999). African language development and language planning. Social
Dynamics, 25(1), 13–30.
Baoua, I. (2006). Analyse des impacts des investissements dans la gestion des ressources
naturelles sur le secteur élevage dans les régions de Maradi, Tahoua et Tillabéry
au Niger.
Bélières, J.-F., Hilhorst, T., Kébé, D., Keïta, M. S., Keïta, S., & Sanogo, O. (2011).
Irrigation et pauvreté: le cas de l’Office du Niger au Mali. Cahiers Agricultures,
20(1–2), 144-149 (1)

40
Borgarello, A. (2009). Les Filets de Sécurité Sociale au Niger.
Boukary, A. (1985). NGOS in the rural development policies in the Niger; study of a
project on Madaoua onion.
Boukary, H., Roumba, A., Adam, T., Barage, M., & Saadou, M. (2012). Interactions
entre la variabilité des écotypes de l’oignon (Allium cepa L.) et les facteurs agro-
climatiques au Niger. Tropicultura, 30(4).
Bruxelles, CSA. (2011). Etude de cas d’oignons du Niger CSA: Analyse des capacités
des petits agriculteurs familiaux et identification des stratégies qui leur
permettent de capter plus de valeur ajoutée (p. 62). Niger. Retrieved from http://
www.csa-be.org/IMG/doc_Etude_de_cas_oignons_Niger_CSA_110915_final.doc
Center for History and New Media. (n.d.). Zotero Quick Start Guide. Retrieved from
http://zotero.org/support/quick_start_guide
Church, R. L., & ReVelle, C. S. (1976). Theoretical and computational links between the
p‐median, location set‐covering, and the maximal covering location problem.
Geographical Analysis, 8(4), 406–415.
Church, R., & ReVelle, C. (1974). The maximal covering location problem. In Papers of
the Regional Science Association (Vol. 32, pp. 101–118). Springer.
Coulibaly, Y. M., Bélières, J.-F., & Koné, Y. (2006). Les exploitations agricoles
familiales du périmètre irrigué de l’Office du Niger au Mali: évolutions et
perspectives. Cahiers Agricultures, 15(6), 562-569 (1).
Daskin, M. S. (2008). What you should know about location modeling. Naval Research
Logistics (NRL), 55(4), 283–294.
David, O. (1996). Effects of devaluation of the CFA franc on onion production systems
of Niger.
David, Olivier. (1999). Les réseaux marchands africains face à l’approvisionnement
d’Abidjan: le commerce régional de l’oignon (# Allium cepa# L.). Niger-Burkina
Faso-Côte d’Ivoire (2 tomes).
David, Olivier, & Moustier, P. (1998). Lorsque le gros maigrit, le maigre meurt:
l’organisation du commerce de l’oignon en Afrique de l’Ouest. Autrepart, 6, 105–
122.

41
Fearon, D. (2002). Alfred Weber, Theory of the Location of Industries, 1909. CSISS
Classics.
Funel, J. M. (1976). Le Développement régional et sa problématique: étudiés à travers
l’expérience de Tahoua (Niger). République française, Ministère de la
coopération.
Jouve, P., & David, D. (1986). Diversité spatiale et évolution des modes d’association de
l’agriculture et de l’élevage dans la région de Maradi au Niger (zone sahélienne).
Legile, A., Noël, N., Mouton, F., & Baillet, D. (2016). Évolution des modalités
d’intervention d’un bailleur de fonds des filières agricoles: l’expérience de l’AFD.
Développement Durable et Filières Tropicales, 51.
Mallam Garba, M. (2004). Education bilingue au Niger: entre convivialité et conflits
linguistiques. Penser La Francophonie, Concepts, Actions et Outils Linguistiques,
Actes Des Premières Journées Scientifiques Communes Des Réseaux de
Chercheurs Concernant La Langue, 455–471.
Marianov, V., & Serra, D. (2009). Median problems in networks.
Martinez Rivas, M. (2009). Onion Transport and Logistics Study along the Madaoua-
Ouagadougou-Accra Corridor, Agribusiness and Trade Promotion (ATP) Project,
West Africa. Carana Corporation. August.
Masudin, I. (2013). A Review of location-Allocation Problems in Multi-echelon Suplay
Chain. Lambert Academic Publishing.
Ministry of Agricultural. (2013). Final Result of Horticultural Production (p. 56).
Republic of Niger.
Moumouni, A. D. (2006). Les effets de la réappropriation de la culture du «Violet de
Galmi» par les producteurs d’oignon de la région de Tahoua–NIGER, sur la
dynamique du territoire local, l’organisation sociale et économique. Thèse de
doctorat: Université de Toulouse-Le Mirail (France).
Mounkaila, H. (2007). Insécurité alimentaire au Niger: rôle des politiques sous-régionales
et régionales. Les États-Nations Face à l’intégration Régionale En Afrique de
l’ouest: Le Cas Du Niger, 4, 143.
42
Salifou, A., & technique (Paris), A. de coopération culturelle et. (1989). Histoire du
Niger. Nathan.
Samuel, D. (1997). Historical Dictionary of Niger, Boston & Folkestone. Scarecrow
Press.
Statistique (INS), I. N. de la, Finances, M. D., & International, I. (2013). Niger Enquête
Démographique et de Santé et à Indicateurs Multiples 2012.
Tafazzoli, S., & Mozafari, M. (2009). Classification of location models and location
softwares. In Facility Location (pp. 505–521). Springer.
Tarchiani, V., Robbiati, G., & Salifou, M. R. (2013). Filières oignon en Afrique de
l’Ouest: étude comparée des filières nigérienne et béninoise. Cahiers
Agricultures, 22(2), 112-123 (1).
Tarchiani, V., & Roua, B. (2010). La problématique foncière et la gestion pastorale entre
décentralisation et développement local: le cas de Keita au Niger. Science et
Changements Planétaires/Sécheresse, 21(3), 203–210.
Tarpaga, M. W. V., Neya, O., Rouamba, A., & Tamini, Z. (2011). Influence de la saison
de production des bulbes et de la maturité des graines sur les caractéristiques
physiologiques de la graine de l’oignon (Allium cepa L.), variété «violet de
Galmi». Journal of Animal & Plant Sciences, 9(2), 1169–1178.
Terpend, N. (1997). Guide pratique de l’approche filière. Le cas de l’approvisionnement
et de la distribution des produits alimentaires dans les villes.
Terpend, N. (2006). An Assessment of knowledge about trade and markets related to
food security in West Africa. United Nations World Food Program Rome, Italy.
THE WORLD BANK. (2010). Social Development Department Area-based
Development and Climate Change in Niger (p. 79).
Toregas, C., & ReVelle, C. (1972). Optimal location under time or distance constraints.
Papers in Regional Science, 28(1), 133–144.

43
Utazi, C. E., Sahu, S. K., Atkinson, P. M., Tejedor-Garavito, N., Lloyd, C. T., & Tatem,
A. J. (2018). Geographic coverage of demographic surveillance systems for
characterising the drivers of childhood mortality in sub-Saharan Africa. BMJ
Global Health, 3(2), e000611.
Van Vugt, S. M., Schrader, T. H., de Roo, N., Daddy, A., Douma, A., & Salifou, M. L.
(2010). Les 25 Résolutions de Konni. Wageningen UR Centre for Development
Innovation.
Waziri Mato, M. (1999). Les cultures de contre-saison dans le sud de la région de Zinder
(Niger). Université de Lausanne, Faculté des géosciences et de l’environnement.
Winfield, I. J. (2012). FAO STATISTICAL YEARBOOK 2012: WORLD FOOD AND
AGRICULTURE‐Edited by A. Prakash and M. Stigler. Journal of Fish Biology,
81(6), 2095–2096.
Yachaou, M., & Zhihong, T. (n.d.). Onion sector in Niger: an overview of “Violet de
Galmi” onion.
Zabeirou, H. (n.d.). FARMER PRACTICES OF PESTICIDE USE ON MARKET
GARDENING IN THE DEPARTEMENT OF MADAOUA-NIGER.
Environmental and Water Sciences, Public Health and Territorial Intelligence
Journal, 2(2).

CURRICULUM VITAE
Abass A. Mallam
Education
Master of Science in Geography Information Science, 2019 at Indiana University Purdue
University Indianapolis, IN
Bachelor of Science in Physical Geography, emphasis in Biogeography, 2009 at
University of Niamey, Niger
Professional Experience
City of Indianapolis, Department of Public Works, August 2018-Present. Assist the
Engineering team for:
− Storm water and pedestrian crash zone data
− Hydrant parking restrictions
− Storm drain marking
− Concrete pavement and join removal
− Traffic inventory
Research project on the onion cultivation and marketing in Keita Department, 2014-18
Indiana Rural Community Assistance Program August 2016 - January 2017
− Update rural community water and wastewater utilities
− Maintain and manage ArcPad for G.I.S mapping
City of Indianapolis, Department of Public Works, Intern, Spring 2016