abexwbah zi - oregon state...
TRANSCRIPT
Del
iver
ed b
y P
ublis
hing
Tec
hnol
ogy
to O
rego
n S
tate
Uni
vers
ity IP
128
193
164
203
on
Sat
12
Nov
201
1 22
50
45C
opyr
ight
(c)
Car
togr
aphy
and
Geo
grap
hic
Info
rmat
ion
Soc
iety
All
right
s re
serv
ed
Comparing Geometrical Properties of Global Grids
AJon Kimerling Kevin Sahr Denis White and Lian Song
ABSTRACT Transforming raw observations into geometrically regular global grids is a funda-mental data processing and storage problem underlying much of our global data analysis Thebasic geometry of traditionally employed quadrilateral-based point or area grids while well suitedto array storage and matrix manipulation may inheremly hinder numerical and geostatisticalmodeling efforts Several sciemists have noted the superior performance of triangular point gridsand associated triangular cells that can be aggregated imo hexagonal surface tessellations yet nothorough evaluation of discrete global grid alternatives has been conducted We present resultsfrom a global grid comparison study that focused on recursive tiling of polyhedral faces projectedomo the globe A set of evaluation criteria for global partitioning methods were developed Ofthese metrics for spheroidal surface area compactness and cemerpoim spacing were found to beof particular importance We present examples of these metrics applied to compare different re-cursive map projection-based and quadrilateral spherical partitionings One map projection ap-proach the Icosahedral Snyder Equal Area (ISEA) shows particular promise due to its productionof equal area triangular and hexagonal cells on the spheroid at all levels of recursive partitioning
KEYWORDS Global grids spherical surface tessellations global data models distortion analysis
Introduction
A new era of high spatial and temporal resolu-tion environmental data covering the entireglobe is about to begin ushered in by NA-
SAs Earth Observation System (EOS) and otherglobal data collection efforts Examples are the 1 kInAVHRR land cover (Loveland et al 1991) anddigital elevation model (DEM)data sets compiled aspart of the International Geosphere-Biosphere Pro-grams Data and Information System (Eidenshinkand Faundeen 1994 Hastings 1996) We shouldexpect that earth scientistswillaccelerate their use ofgeographic information systems (GIS) numericalmodeling approaches and geostatistical methodssingly or in concert to study global scale phenom-ena Phenomena of varying time scales such as cli-mate change deforestation biodiversity lossbiogeochemical cyclesand transportsbudgets in theatmosphere and oceans are beginning to be studiedas an interconnected global system Such globalanalyses will require both spatial and temporal
A Jon Kimerling is a professor of geography Kevin Sahris a research assistant and Lian Song is a former gradu-ate student research assistant in the Department of Geo-sciences Oregon State University Corvallis OR 97331Denis White is a geographer at the US EnvironmentalProtection Agency Corvallis OR 97333 Comments to AJon Kimerling at (541) 737-1225 or e-mailltkimerliageoorstedugt
integration of currently disparate data sets from awide variety of data producers (Kahn 1995) Trans-forming the raw observations underlying globalanalyses into a global grid is a fundamental dataprocessing and storage problem
A global grid is a tessellation of the Earth into ageometrically regular set of cells with associated cellcenterpoints A higWy regular global grid wouldallowus tobull Summarize and organize the multiple non-
uniformly spaced measurements over theglobe
bull Calculate gradients faithfully (eg for budgetcalculations)
bull Make comparisons of time-series of globallydistributed data (eg for detecting climatechanges)
bull Make statistically meaningful regional com-parisons of globally distributed data
bull Compare and combine data sets taken atdifferent spatial resolutions such as data frommultiple satellite measurements and fieldverification data
bull Improve the operation of numerical modelsbased on finite difference equations and
bull Document the precision as well as the locationof spatial data on the globeGeometrical regularity is the challenge Cur-
rently utilized regular global grids such as theETOP05 5 minute DEM or the NASA Earth Radia-tion Budget Experiment (ERBE) 250 global model-ing grid cannot be extended to the entire Earth
Cartography and Geographic Information Science Vol 26 No4 1999 pp 271-288
Del
iver
ed b
y P
ublis
hing
Tec
hnol
ogy
to O
rego
n S
tate
Uni
vers
ity IP
128
193
164
203
on
Sat
12
Nov
201
1 22
50
45C
opyr
ight
(c)
Car
togr
aphy
and
Geo
grap
hic
Info
rmat
ion
Soc
iety
All
right
s re
serv
ed
tetrahedron hexahedron (cube) octahedron dodecahedron icosahedron
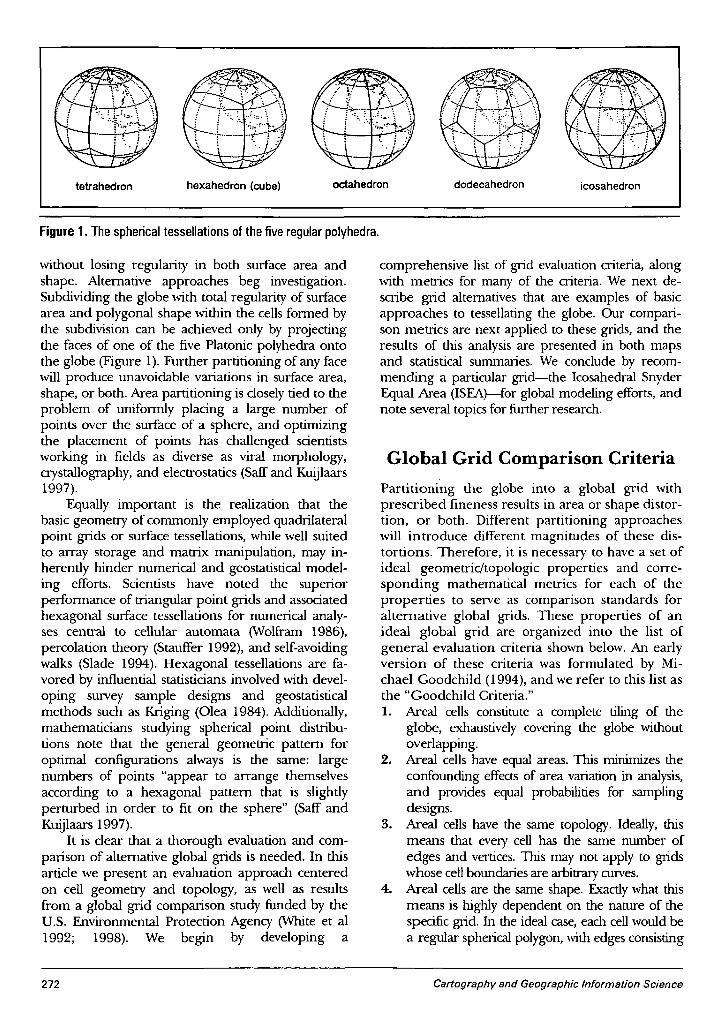
Figure 1 The spherical tessellations of the five regular polyhedra
without losing regularity in both surface area andshape Alternative approaches beg investigationSubdividing the globe with total regularity of surfacearea and polygonal shape within the cells formed bythe subdivision can be achieved only by projectingthe faces of one of the five Platonic polyhedra ontothe globe (Figure 1) Further partitioning of any facewill produce unavoidable variations in surface areashape or both Area partitioning is closelytied to theproblem of uniformly placing a large number ofpoints over the surface of a sphere and optimizingthe placement of points has challenged scientistsworking in fields as diverse as viral morphologycrystallography and electrostatics (Saffand Kuijlaars1997)
Equally important is the realization that thebasic geometry of commonly employed quadrilateralpoint grids or surface tessellations while well suitedto array storage and matrix manipulation may in-herently hinder numerical and geostatistical model-ing efforts Scientists have noted the superiorperformance of triangular point grids and associatedhexagonal surface tessellations for numerical analy-ses central to cellular automata (Wolfram 1986)percolation theory (Stauffer 1992) and self-avoidingwalks (Slade 1994) Hexagonal tessellations are fa-vored by influential statisticians involved with devel-oping survey sample designs and geostatisticalmethods such as Kriging (Olea 1984) Additionallymathematicians studying spherical point distribu-tions note that the general geometric pattern foroptimal configurations always is the same largenumbers of points appear to arrange themselvesaccording to a hexagonal pattern that is slightlyperturbed in order to fit on the sphere (Saff andKuijlaars 1997)
It is clear that a thorough evaluation and com-parison of alternative global grids is needed In thisarticle we present an evaluation approach centeredon cell geometry and topology as well as resultsfrom a global grid comparison study funded by theUS Environmental Protection Agency (White et al1992 1998) We begin by developing a
272
comprehensive list of grid evaluation criteria alongwith metrics for many of the criteria We next de-scribe grid alternatives that are examples of basicapproaches to tessellating the globe Our compari-son metrics are next applied to these grids and theresults of this analysis are presented in both mapsand statistical summaries We conclude by recom-mending a particular grid-the Icosahedral SnyderEqual Area (ISEA)--for global modeling efforts andnote several topics for further research
Global Grid Comparison CriteriaPartitioning the globe into a global grid withprescribed fineness results in area or shape distor-tion or both Different partitioning approacheswill introduce different magnitudes of these dis-tortions Therefore it is necessary to have a set ofideal geometrictopologic properties and corre-sponding mathematical metrics for each of theproperties to serve as comparison standards foralternative global grids These properties of anideal global grid are organized into the list ofgeneral evaluation criteria shown below An earlyversion of these criteria was formulated by Mi-chael Goodchild (1994) and we refer to this list asthe Goodchild Criteria1 Areal cells constitute a complete tiling of the
globe exhaustively covering the globe withoutoverlapping
2 Areal cells have equal areas This minimizes theconfounding effectsof area variation in analysisand provides equal probabilities for samplingdesigns
3 Areal cells have the same topology Ideally thismeans that every cell has the same number ofedges and verticesThis may not apply to gridswhose cellboundaries are arbitrarycurves
4 Areal cells are the same shape Exactlywhat thismeans is higWydependent on the nature of thespecific grid In the ideal case each cellwould bea regular sphericalpolygonwith edges consisting
Cartography and Geographic Information Science
Del
iver
ed b
y P
ublis
hing
Tec
hnol
ogy
to O
rego
n S
tate
Uni
vers
ity IP
128
193
164
203
on
Sat
12
Nov
201
1 22
50
45C
opyr
ight
(c)
Car
togr
aphy
and
Geo
grap
hic
Info
rmat
ion
Soc
iety
All
right
s re
serv
ed
of great circle arcs of lengths corresponding tothose of every other cell
5 Areal cells are compact Because a single vector ofvalues will be associated with all the points in asingle areal cell it is preferable that the actualvalues of all the points in the cell be as much alikeas possible Maximal compactness ensures thatthe points in a cell are as close to each other aspossible thus taking advantage of Toblers firstlaw of geography which in this case is that thecloser points are in space the more likely they areto be alike
6 Edges of cells are straight in a projection Againthis assumes that the concept of edges has mean-ing for a particular grid (ie that the cell bounda-ries are not arbitrary curves) This criterionensures the existence of a relatively convenientspace for describing visualizing and working withgrid cells
7 The midpoint of the arc connecting two adjacentcell centers coincides with the midpoint of theedge between the two cells This criterion hasproved useful in calculating transport betweencells using finite differences (Heikes and Randall1995)
8 The points and areal cells of the various resolu-tion grids which constitute the grid system form ahierarchy which displays a high degree of regular-ity If a hierarchical structure exists grid cellsmaybe subdivided recursively and a nested set ofgeometrically similar cells may be created fromthe set of smallest cells reducing the burden ofrecalculation as the fineness of resolution changesA hierarchical structure should also enable activi-ties such as efficient computer implementation ofthe grid system and multi-resolution analysisusing the grid system
9 A single areal cell contains only one grid referencepoint ie each reference point lies in a differentareal cell
10 Grid reference points are maximally centralwithin areal cells In conjunction with the lastcriterion this optimally supports the commonpractice of using the point grid as an approxima-tion to the area grid
11 Grid reference points are equidistant from theirneighbors
12 Grid reference points and areal cells display regu-larities and other properties which allow them tobe addressed in an efficient manner The gridsystem should provide an addressing system thatsupports efficient algorithms for such commongrid operations as determining cell and pointneighbors determining grid distances and mov-ing between grid resolutions
Vol 26 No4
13 The grid system has a simple relationship to thetraditional latitude-longitude graticule Since forthe indefinite future most data will be geo-referenced using the latitude-longitude graticuleefficientwaysof transferring data to and from thissystem will be required As in the case of the pla-nar rectilinear grid this is a practical considera-tion that while perhaps almost arbitrary from amathematical viewpoint cannot be ignored in theshort term
14 The grid system contains grids of any arbitrarilydefined spatial resolutionWe have already noted that it is mathematically
impossible for any global point grid or surface tessel-lation to completely fulfill all of these criteria asseveral are mutually exclusive A good general-purpose grid or tessellation might be expected tostrike a balance among all the criteria whereas thosetuned for specific applications or numerical methodsmight value certain of these criteria more highly Forexample geostatistical methods favor equal-areatessellations that completely cover the globe andhave a hierarchical structure Survey sampling de-signs for global environmental monitoring haveequal-area cells as a prime requirement whereasatmospheric transport modeling equations rely oncriterion seven Scientists involved in GIS data inte-gration and cartographic display on the other handmay value highly the last three criteria
Evaluation Criteria MetricsGlobal grid evaluation criteria are of limited util-ity unless metrics suitable for grid comparison aredeveloped for each Both topological and geomet-rical metrics must be devised for 1) checking thata criterion has been met and 2) determining howwell a criterion has been satisfied Examples of thefirst type of metrics includebull Criterion I-Ensure that the sum of cell areas
equals the sea level surface area of the globeand that the coordinates of all shared celledges are identical
bull Criterion 6-Check that the coordinates de-fining each cell edge are identical to thosecomputed from the linear equation deter-mined for the edge endpoints
bull Criterion 9-Employ a point-in-polygonfunction to check that only one samplingpoint lies in each cell
bull Criterion 8-Check to see that recursive parti-tioning a mathematical procedure essentialto create a hierarchical grid system can beperformed
273
Del
iver
ed b
y P
ublis
hing
Tec
hnol
ogy
to O
rego
n S
tate
Uni
vers
ity IP
128
193
164
203
on
Sat
12
Nov
201
1 22
50
45C
opyr
ight
(c)
Car
togr
aphy
and
Geo
grap
hic
Info
rmat
ion
Soc
iety
All
right
s re
serv
ed
Level 3
Level 2
2 x sqrt(1t x cell area)cell perimeter =
= 3545 x sqrt (cell area2r)cell perimeter (I)
cells with great circle edges (such as spheroi-dal triangles or hexagons) or of more geomet-rically complex cells requires the orientedtriangle summation approach found inKimerling (1984) These actual areas werenormalized through dividing by the averagearea for all cells in the tessellation so that allcells in a perfectly equal area global gridwould have normalized cell areas of 10Criterion 5-Planar compactness is often meas-ured by the surface-area-to-perimeter ratio(Muehrcke and Muehrcke 1997) Standardizingthis ratio to 10for a planar circleof the sameareaas the cell givesa compactnessindex applicabletoall discrete global grids This index is computedfrom the equation
(c) 9-fold Triangle Partitions
(a) 4-fold Trtangle Partitions
(d) 9-fokl Hexagon Partitions
(b) 4-fold Hexagon Partitions
bull
Level 1
Figure 2 Four- and 9-fold triangular and hexagonal partitioning of an icosahedronface at the first three levels of recursion
The tenninology of recur-sive partitioning is best under-stood from an illustration suchas Figure 2 Two types of parti-tioning called 4-fold and 9-foldare shown in the top and bottomtriangular cells This involveschecking that each full triangle(recursion level 0) can be parti-tioned into either 4 or 9 triangu-lar cells (recursion level 1) If this4- or 9-fold partitioning can becontinued to produce subtrian-gles at all higher levels of recur-sion a hierarchical triangulargrid system is achievable
Recursive partitioning facili-tates the inverse operation ofsubcell aggregation into largercells of the same or a differentgeometrical form For examplethe left half of Figure 2 illus-trates that sets of 4 9 16 25neighboring subtriangles can beassembled into progressivelycoarser spatial resolution trian-gular global grids The right halfof this figure showsthat sets of 624 96 neighboring subtrian-gles can be assembled into pro-gressively larger hexagonal cellsNotice that with 9-fold partition-ing the hexagonal cells are ori-ented identically an advantagewhen assembling global data setsat varying spatial resolutions Asimilar illustration could becreated for recursive partitioning of spherically rec-tangular quadrilaterals with the desirable rotationalinvariance present for any n-fold partitioning
We have focused on geometrical comparisonof metrics for surface area compactness andpoint spacing on both the sphere and a spheroidsuch as the GRS80 or WGS84 We were aware thatmeasures on the sphere and spheroid would givenearly identical numerical results but using sphe-roidal area metrics was essential to our demon-stration that certain grids are truly equal area onthe Earths surface All of these measures involvedetermination of geodesic distances using stan-dard ellipsoidal distance equations (Bomford1971) Examples of comparison metrics includebull Criterion 2- The spheroidal surface area of
quadrilateral cells can be computed usingstandard equations found in Maling (1992)Computing the spheroidal surface area of
274 Cartography and Geographic Information Science
Del
iver
ed b
y P
ublis
hing
Tec
hnol
ogy
to O
rego
n S
tate
Uni
vers
ity IP
128
193
164
203
on
Sat
12
Nov
201
1 22
50
45C
opyr
ight
(c)
Car
togr
aphy
and
Geo
grap
hic
Info
rmat
ion
Soc
iety
All
right
s re
serv
ed
Figure 3 Spherical zone used in Zone Standardized Com-pactness (ZSC) calculation for an icosahedron face
However we are dealing with cells on theglobeTaking the Earths sphericity into account abetter index is one that uses a pole-centered spheri-cal zone of the same area as the grid cell (Figure 3)for the ideal (10 ) compactness What we term ZoneStandardized Compactness (ZSC)is computed from
ZSC = sqrt( 4x Tt x cell area - cell area 2 r2)cell peTimeter (2)
The derivation of ZSC is given in the Appen-dix We have extended this idea to the spheroidby determining the spheroidal area to parallelperimeter ratio normalized to a spheroidal cap ofthe same surface area as the cell (Kimerling et al1995)bull Criterion 11-Grid point spacing can be meas-
ured assuming that we can determine the latitudeand longitude of points within adjacent cellsAssuming the globe to be spherical we employthe standard great circle distance equation foreach pair of adjacent coordinates
distance = r arccos (sin(lat I) sin (lat2) + cos (lat J)cos (lat2) cos (lion I -lon2 I) (3)
bull Criterion 10-Detennining grid point centralitywithin a cell can be approached as a center ofgra~ty problem Here we can use off-the-shelfalgorithms for center-of-gra~tycomputation fromlists of edge coordinates and then compare thegrid point location to the center of gra~ty todetermine the distance and direction of dC~ation
Vol 26 No4
Each of the above comparison metrics are com-puted for a single cell or grid point and can be ana-lyzed statisticallywhen computations are extended tothe entire globe (realizing that the entire populationof cells is the sample) The mean standard deviationand the range of cell metrics have been found to beuseful comparison statistics for alternative globalgrids (Whiteet al 1998)
Global Grid AlternativesNumerous surface tessellations have been proposedas global grids but the possibilitiescan be organizedinto a limited number of general categories Inspiredby Duttons (1994) general tessellation taxonomy wedeveloped a more specific hierarchical classificationscheme for global grids (Figure 4) and then selectedgrids from different classes for comparison At thebroadest level our scheme divides grids into thosebased on directly tessellating the sphere or spheroidand those that transform all or a portion of the globeto a map projection surfacewhich is tessellated in aregular manner with cell edges ancVor grid pointsthen back-projected to the sphere or spheroid
At the second level in our classification hierar-chy direct surface tessellations can be based onbull Subdividing quadrilateral cells recursivelybull Subdividing the faces of a spherical Platonic
polyhedron recursively orbull Creating a Voronoi tessellation comprised of
spherical or spheroidal Thiessen polygonsDirectly tessellated quadrilateral grids can be
further divided into what the global modeling com-munity calls equal-angle and constant-area grids(Kahn 1995) Tessellations of the globe into quadri-lateral cells of equal latitudinal and longitudinalextent are termed equal angle Examples aboundincluding the 5 x 5 poundTOP05 global DEM and theERBE 2S x 25deg 5degx 5degand 10degx 10deggrids (Brooks1981) Constant-area tessellations begin with anarbitrarily sized quadrilateral cell at the equator andthen define the parallel and meridian cell bounda-ries across the globe so as to achieve approximatelyequal-area cells This is done either by keeping thelatitude increment constant and adjusting the longi-tude increment as the pole is approached or viceversa (Brooks 1981)
Directly tessellated polyhedral grids can alsobe divided into two categories based on whetherthe partitioning of polyhedral faces is performedwith the edges of a great or a small circle Feketeand Treinishs (1990) spherical quadtree datastructure which is based on recursive subdivisionof spherical triangles obtained by projecting thefaces of an icosahedron onto a sphere is a good
275
Del
iver
ed b
y P
ublis
hing
Tec
hnol
ogy
to O
rego
n S
tate
Uni
vers
ity IP
128
193
164
203
on
Sat
12
Nov
201
1 22
50
45C
opyr
ight
(c)
Car
togr
aphy
and
Geo
grap
hic
Info
rmat
ion
Soc
iety
All
right
s re
serv
ed
Map Projection Surface Tessellations
Single PrOj~ ~tion Surface-- ---- -- --Equal Area Non-Equal Area Equal Area Non-Equal Area
Gnomonic
ex Fuller (1982)Icosahedral
ex Snyder (1992)Polyhedral EqualArea Projections
ex lukatela (1987)ex Fekete and ex Song (1997) Hipparchus Geo-
Treinish (1990) positioning ModelSpherical Quadtree Dutton (1988) QTM
Constant-Area Quadrilateral TessellationOur example is the Nimbus Earth Radiation Budget(ERB) Experiment grid with initial 4S x 4S quad-rilateral cells at the equator (Figure 6) The longitu-dinal increment increases in 12 discrete steps to 120degnear each pole Recursive partitioning into approxi-mately constant-area subcells is more problematic as2-frequency equal-angle partitioning is commonly
Global Grid Comparison Examples
Equal-Angle Quadrilateral TessellationOur example will be an initial partitioning of theglobe into thirty-two45deg x 45deg cells at recursion level0 and subsequent 9-fold recursive partitioning tolevel fiveHence grids with 45deg x 45deg 15degx 15deg5degx5deg 1 23degx 1 23deg 59degx 59deg and 527degx 527degedgeswill be analyzed Recursion level two illustrated inFigure 5 corresponds to the 5degx 5degERBEgrid
Our overall comparison of the above categories ofglobal grids based on the Goodchild criteria ispresented in Table 1 and will be discussed as part ofour recommendations We have also selected fourexamples from different categories in our taxonomyto illustrate our more detailed comparison of surfacearea compactness and centerpoint spacing varia-tion These examples described belowwere selectedto show the fundamental geometrical differencesbetween quadrilateral and polyhedral grids as wellas to contrast commonly used standard quadrilat-eral grids with polyhedral alternatives
ex Nimbus ERS
Direct SphericaVSpheroidal Tessellations----- I _Quadrilateral Polyhedral Voronoi---- ---- --Equal Angle Constant Area Great Circle Small Circle
Edges Edges
ex ETOP05ERSE 25 deg
ex Tobler and Chen ex Square Projection(1986) lambert Cylin- (same as equal angle
drical Equal Area tessellation)
loveland et al (1991)Global land
Characterization
example of great-circleedge partitioningSongs (1997) small-circle subdivision systemcreates equal-areaspherical triangles withmore mathematicallycomplex small circleedges Duttons (1988)QTM projection gridfor octahedron faces isan interesting combina-tion of great- and small-circle subdivision
Lukatelas (1987)Hipparchus Geoposition-ing Model is an excellentexample of a spheroidalVoronoi tessellationHere the outwardly sim-ple problem is comput- Figure 4 Globalgrid taxonomying a set of regularlyspaced grid points fromwhich spherical or sphe-roidal Thiessen polygons can be constructed But asGiacaglia and Lundquist (1972) note The problemof distributing in the most regular way a given num-ber of points on a sphere has been studied for centu-ries and in general is still unsolved Methods suchas finding the greatest number of small circles of agiven radius that can be placed on a spherical surfacewithout overlapping (Coxeter 1962) have been su-perseded by sampling function approaches for thesphere that begin with the edges of a spherical poly-hedron (Giacaglia and Lundquist 1972) Perfectregularity however remains an inherently unachiev-able ideal
Map projection based global tessellationscurrently can be placed in one of two categoriessingle and multiple projection surfaces Singleprojections of the globe typically cylindrical havebeen used to construct quadrilateral grids It isuseful due to the importance of satisfying crite-rion two to further divide projection surfaces intoequal area (eg Tobler and Chens (1986) Lam-bert cylindrical equal-area grid) and non-equalarea (the ETOPO 5 grid for example can bethought of as a square projection partitioned intocells 5 x 5 in length on the projection surface)categories Multiple projection surfaces are typi-cally faces of Platonic polyhedra We can alsoplace these into equal area (eg Snyder (1992)polyhedral equal area projections for the fivePlatonic polyhedra) and non-equal area (egFuller (1982) and Baumgardner and Frederickson(1985raquo projection of icosahedron faces
276 Cartography and Geographic Information Science
Del
iver
ed b
y P
ublis
hing
Tec
hnol
ogy
to O
rego
n S
tate
Uni
vers
ity IP
128
193
164
203
on
Sat
12
Nov
201
1 22
50
45C
opyr
ight
(c)
Car
togr
aphy
and
Geo
grap
hic
Info
rmat
ion
Soc
iety
All
right
s re
serv
ed
Equal Angle GridFigure 5 Equal-angle quadrilat-eral grid for a 45deglongitude by 90deglatitude sectionof the globe
Constant Area GridFigure 6 Con-stant area quad-rilateral grid for a45deg longitude by90deg latitude sec-tion of the globe
SNYDER MAP PROJECTION
Figure 7 Icosahedral Snyder Equal Area (ISEA) projection of an icosahedron face (a) Tissotangular deformation isolines (b)
equivalence throughout (Figure 7) The projection ismade equal area by adjusting the scale outward fromthe center of each edge This results in increasedshape distortion as each of the three axes from thetriangle center to comer vertices is approached Amap of angular deformation across an icosahedronface (which is the result of our Tissot distortionanalysis based on the Gaussian basic quantity ap-proach outlined in Maling (1992raquo shows this patternof distortion
The equilateral triangular projection of eachicosahedron face is subdivided recursively into equi-lateral subtriangles in either the 4-fold or the 9-foldmanner illustrated in Figure 2 The bowing of trian-gle edges along the three axes of angular deforma-tion is apparent in Figure 8 where 4-fold subdivision
subtriangles of recur-sion level four are backprojected to the globeThis edge bowing is aprimary cause of varia-tions in compactnessamong subtriangles
We noted earlierthat triangular gridsallow hexagonalgrids to be createdthrough subtriangleaggregation and thathexagonal grids haveseveral advantagesrelated to global dataanalysis The ISEAtriangular grid inher-ently allows equal-area hexagons to beassembled at varying
Tissot Angular DeformationIcosahedron Face
employed for simplicity Breaking from tradition weemploy 3-frequency equal-angle partitioning tomaintain consistency in our comparisons while usingthe same basic partitioning method The initial 4Slatitude x variable longitude cells correspond ap-proximately to recursion level two in our equal-angletessellation with partitioning carried to recursionlevel 5 (IS OS 16deg latitude by variable longitudecell edges)
Equal-Area Map Projection Surface TessellationOur example is the Icosahedral Snyder Equal- Area(ISEA) projection (Snyder 1992) which transformseach icosahedron face on the globe into an equilat-eral planar triangle while maintaining area
Vol 26 No4 277
Del
iver
ed b
y P
ublis
hing
Tec
hnol
ogy
to O
rego
n S
tate
Uni
vers
ity IP
128
193
164
203
on
Sat
12
Nov
201
1 22
50
45C
opyr
ight
(c)
Car
togr
aphy
and
Geo
grap
hic
Info
rmat
ion
Soc
iety
All
right
s re
serv
ed
PARTITIONING COMPARISONFigure 8 Icosahedron faces that are4-fold partitioned to recursion levelfour on the ISEA and Fuller-Grayprojection surfaces then re-projected on an orthographic mapprojection to simulate the Earthssphericity
Snyder Projection
4 bull FOld SubdiVISionRecursion Level 4
Fuller-Gray Projection
Figure 9 Aggregation of 54 and 6 neighboring triangles on the ISEA pro-jection into equal area hexagonal cells forming 9-fold higher resolutiongrids
levels of spatial resolution For example aggre-gating sets of 54 neighboring triangles producesthe equal-area hexagonal grid for the icosahedronface shown in Figure 9a Again apparent is thebowing of hexagon edges along the three axes ofhigher angular deformation which should intro-duce larger compactness variations
Aggregating the same subtriangles into sets ofsix neighbors (Figure 9b) creates a nine timeshigher resolution hexagonal grid with edge bow-ing more localized along the three axes Becausenine of the small hexagons (seven fulland one-third of six adjacent) form thelarge hexagon the small hexagons area 9-fold subdivision of the large hexa-gons at the next higher level of recur-sion Further 9-fold partitioning of theunderlying subtriangles allows assem-bly into 9-fold smaller hexagons athigher levels of recursion
Non-Equal Area Map Projection SurfaceTessellationWe will use the Fuller-Gray projectionwhich is based on the geometrical ideabehind R Buckminster Fullers icosahe-dral world map projection (Fuller 1982)Fuller imagined the three edges of eachicosahedron face as flexible bands curvedto lie on the spherical surface (left half ofFigure 10) Each edge would be subdi-vided and holes drilled at n equallyspaced increments and flexible bandswould be strung between correspondingholes on adjacent edges This wouldcreate a triangular network of lines onthe sphere which could be flattened tocreate a regular grid of equilateral subtri-angles (right half of Figure 10)
278
Fuller imagined the verticesof each subtrianglebeing the projection of the corresponding line inter-section point on the sphere These intersectionpoints were later found physically impossible toachieve because each triplet of intersecting lines onthe globe forms a small triangle in the plane whosecenterpoint is the best approximation of Fullersidea Gray (1994) developed exact transformationequations for this approximation producing a com-promise projection having both small area andshape distortion
(a)
(b)
Cartography and Geographic Information Science
Del
iver
ed b
y P
ublis
hing
Tec
hnol
ogy
to O
rego
n S
tate
Uni
vers
ity IP
128
193
164
203
on
Sat
12
Nov
201
1 22
50
45C
opyr
ight
(c)
Car
togr
aphy
and
Geo
grap
hic
Info
rmat
ion
Soc
iety
All
right
s re
serv
ed
Figure 10 Fullers geometrical concept of an icosahedral map projection surface (Source Fuller1982)
The equilateral-triangle Fuller-Gray projec-tion of an icosahedron face is shown in Figure 11along with area-scale and angular-deformationmaps displaying results of our Tissot distortionanalysis Note the smooth increase in area-scaleand angular deformation from the triangle centerto each edge vertex Both recursive partitioningand triangle aggregation is performed identicallyto the Snyder projection The only differenceshould be the creation of non-equal area triangu-lar and hexagonal cells that vary less in compact-ness on average and that grade smoothly fromslightly higher to lower compactness (Figure 8)
Analyses and ResultsThe ideal comparison of global grid geometricalproperties would consist of computing surface areacompactness and other metrics at each level of re-cursion down to the spatial resolution correspondingto the smallest grid cell expected to be used in globalanalysis If the smallestcellwere 1 km2 for examplethe 9-fold partitioning of an icosahedron face mustbe carried out to recursion level eight meaning thatarea compactness centerpoint distance and othermetries must be computed for over 500 million cellsNaturally an infinite number of triangular hexago-nal or quadrilateral recursion levels and cells arepossible as recursive partitioning can continueindefinitely
We have found 9-fold partitioning to recursionlevels less than six to be suitable for comparisonpurposes because surface area compactness center-point spacing and other metries are still computableat the rapidly increasing cell densities However thecomputation effort quickly becomes immense athigher levels of recursion and the results may notadd significantlyto our understanding of the surface
Vol 26 No4
tessellation or gridpoint geomeoy
The normalizedarea zone standard-ized compactness andcenterpoint distanceanalyses that followare a representativesample of our fullresearch effort Thefour grid alternativesexamined were se-lected from the lOwestudied but resultsfrom only two of thefive recursion levelsweexamined are pre-sented here to illus-
trate the essential geometrical properties of the fullrange of quadrilateral and polyhedral grid alterna-tivesWe have limited the polyhedral analysis to thehexagonal tessellation because area and shape dis-tortion characteristics of triangular partitioning arepresented in a companion article (White et al 1998)
Normalized Area Map Comparison
bull Spheroidal areas were computed from sets ofclosely spaced geodetic latitude and longitudecoordinates along each cell edge (usually 11points along an edge) For the two quadrilat-eral tessellations the bounding parallels wereon the WGS 84 spheroid However for theFuller-Gray and Snyder projections onlyspherical equations were available so a morecomplex spheroidal transformation proce-dure had to be used This involved Projectingfrom the authalic sphere for the WGS 84ellipsoid to the plane using forward projec-tion equations
bull Partitioning on the planar projection surfacebull Back projecting cell edges and centerpoints to
spherical coordinates using the inversespherical equations for each projection and
bull Converting authalic to WGS 84 geodetic lati-tude using the transformation equationsfound in Snyder (1987) This allows the ori-ented spheroidal triangle summation method(Kimerling 1984) to be applied to the four(and other) global grid alternativesMaps comparing variations in normalized
surface area for the four discrete global grid ex-amples described above are presented in Figure12 The equal-angle and constant-area grids cover45deg of longitude by 90deg of latitude (equator to
279
Del
iver
ed b
y P
ublis
hing
Tec
hnol
ogy
to O
rego
n S
tate
Uni
vers
ity IP
128
193
164
203
on
Sat
12
Nov
201
1 22
50
45C
opyr
ight
(c)
Car
togr
aphy
and
Geo
grap
hic
Info
rmat
ion
Soc
iety
All
right
s re
serv
ed
Fuller-Grey map projection
Icosahedron Face Area Distortion Angular Deformation
Tissot distortion analysis
Figure 11 Fuller-Gray map projection and Tissot distortion analysis for an icosahedron face
pole) or 1I16th of the globe Each icosahedronface of course covers 120th of the globe so thatthe surface areas of comparison surfaces are ap-proximately the same The level of recursion foreach grid was selected so that the average cell areawithin each grid is nearly the same From thesemaps in Figure 12 it is apparent thatbull The larger range in normalized area (0069 -
1569 or 150 percent) associated with theequal-angle grid makes it as expected by farthe worst alternative of the four
bull The constant-area grid has a greater range ofnormalized area than either the Snyder orFuller-Gray grids The pattern of spatialvariation is one of identical normalized areawithin east-west bands Cell areas also de-crease slowly from south to north within thethree blocks in the bottom half of the maphaving identical meridians as cell boundariesSuch regularity is not present in the rows ofcells forming the top half of the map
bull Normalized hexagon areas on the Fuller-Grayprojection decrease smoothly from a value of106 (6 percent above average) at the icosahe-dron face center to a lower value of 0944near each corner The very low normalizedarea for the triangle at each corner is causedby this being one of five spherical triangles onadjacent icosahedron faces that together formone of 12 pentagonal cells on the globe Eachpentagon area is 56th that of the averagehexagonal cell which gives the lower normal-ized area
280
bull Normalized hexagon areas on the Snyderprojection are identical and just slightly largerthan 10 so as to offset the three smaller areasof corner pentagonal cells If the pentagonareas are removed from the calculations allhexagons are measured as having a 10 nor-malized surface area a numerical demonstra-tion that the Snyder equations for theicosahedron do indeed produce an equal areamap projection surfaceWe next examine the spatial pattern of nor-
malized area for hexagons at recursion levelsthree and four for the 9-fold partitioning of theFuller-Gray and Snyder projection surfaces Theresults are presented in the four orthographicmap projections of icosahedron faces shown inFigure 13 In each of the three Snyder projectiongrids the normalized areas of hexagonal cells areidentical but the normalized area value of thegrid rapidly approaches 10 as the level of recur-sion increases This is due to the progressivelysmaller contribution of the pentagonal cornercells to the total area of the icosahedron face
At increasing levelsof recursion the Fuller-Gray projection grids show a progressive smooth-ing of normalized area variation as the level ofrecursion increases By the fourth level thesmooth pattern of reduction in normalized areafrom the icosahedron center toward each edgeclosely mirrors the Tissot area distortion isolinesdefining the continuous area distortion surface Asexpected the spatial pattern of continuous Tissotarea distortion and of discrete normalized cell
Cartography and Geographic Information Science
Del
iver
ed b
y P
ublis
hing
Tec
hnol
ogy
to O
rego
n S
tate
Uni
vers
ity IP
128
193
164
203
on
Sat
12
Nov
201
1 22
50
45C
opyr
ight
(c)
Car
togr
aphy
and
Geo
grap
hic
Info
rmat
ion
Soc
iety
All
right
s re
serv
ed
Figure 12 Normalized-area comparison for basic segments of four global grids eachshown on an orthographic map projection to simulate the Earths sphericity
1110
1569
0069
09190813077
Figure 16 displays maps of an icosahedron face onthe Fuller-Gray and Snyder projection surfaces thatdepict variations in centerpoint distance betweenadjacent hexagons for 9-fold hexagonal partitioningat three levels of recursion (similar research on
Centerpoint Distance Map Comparison
and the other cells be-coming progressivelymore square in shape asthe equator ISapproached
bull The Snyder grid centerhexagon has the lowestcompactness (ignoringthe inherently lowercompactness pentagonsegments at each corner)The bowed pairs of hexa-gon edges along eachaxis of higher angulardeformation producelower compactness hexa-gons than those fartheraway from each axiswhere higher ZSC valuesvary only slightly and
bull Except for the lower com-pactness comer pentagoncells ZSCvalues across theFuller-Graygrid are consis-tently higher than the otherthree alternativeswith thehighest value at the icosahe-dron center and a slightsmooth decrease radiallyoutward from the centerAs done with normalized
area the spatial pattern ofZSC for hexagonal grids9-fold partitioned to recur-sion levels three and four wasexamined for the Fuller-Gray
and Snyder map projection surfaces (Figure 15)Both grids show a progressive smoothing of ZSCvalues also seen in the area analysis with increas-ing levels of recursion In both grids the spatialpattern of slightly lower to higher compactnessclosely mirrors the Tissot angular deformationisoline pattern for the map projection becomingspatially indistinguishable by recursion level fourHence Tissot angular deformation can be used topredict the spatial pattern of compactnessvariation
nyder
Equal Angle
1110
09190IIJ3077
FullerGray
Constant Area
Compactness Map Comparison
areas become indistinguishable at higher levels ofrecursIOn
Results from computation of Zone StandardizedCompactness (ZSC) for the four grid alternativesare presented in Figure 14 The portions of theglobe covered and levels of recursion selected forthe area comparisons are used here as well toinsure that the average cell area of each grid issimilar These four ZSCmaps show thatbull Compactness variation is greatest by far for
the equal-angle grid as the basic cell shapesvary from narrow spherical triangles at thepole to spherical squares at the equator
bull There is relatively little variation in compact-ness across the constant-area grid in spite ofthe cell at the pole being triangular in shape
Vol 26 No4 281
Del
iver
ed b
y P
ublis
hing
Tec
hnol
ogy
to O
rego
n S
tate
Uni
vers
ity IP
128
193
164
203
on
Sat
12
Nov
201
1 22
50
45C
opyr
ight
(c)
Car
togr
aphy
and
Geo
grap
hic
Info
rmat
ion
Soc
iety
All
right
s re
serv
ed
Figure 13 Normalized-areacomparison for two recursionlevels of the Fuller-Gray andISEA grids each shown on anorthographic map projection tosimulate the Earthssphericity
9-Fold Recursion Level 31060
fl
nil r ra n der
ld e ur ion Le el 4
FullerGray
1060
O9n J
U71~
Snyder
quadrilateral centerpoint distance for the equal-angle and constant-area grids is underway) Thisexample of our centerpoint distance analysis showshow variations in great-circle distance between adja-cent pairs of hexagon centers can be mapped
The six equilateral triangles fonning each hexa-gon can be thought of as map symbols shaded ac-cording to the distance between the hexagon centerand the centerpoint of adjacent hexagons to thenorth (0deg) northeast (60deg) southeast (120deg) south(180deg) southwest (240deg) and northwest (300deg) as-suming north to be at the top of the page
At the lowest level of recursion (top-rightmap) the general pattern of larger (darker gray)and smaller (lighter gray) distances relative to theaverage (medium gray) centerpoint to centerpointdistance are aligned with the three axes of higherangular deformation for the Snyder projection aswe would expect The shortest distances are alongeach axis and the longest distances are adjacentand roughly perpendicular to each axis Thisspatial pattern of centerpoint distance variation
282
persists and becomes better defined at the nexttwo higher levels of recursion At the highest levelexamined here (bottom-right map) the largerand smaller distances clearly are localized alongeach axis grading toward average values in apropeller-like pattern that corresponds with theTissot angular deformation isolines Indeed theTissot diagram in Figure 7 is an excellent predic-tor of where variations in centerpoint distanceshould occur on the Snyder grid
The spatial pattern of centerpoint distance varia-tion for the hexagonally partitioned Fuller-Grayprojection surfaceis not easilydiscerned at the lowestlevel of recursion (upper-left map) but becomesreadily visible at the next two higher levelsAs withthe Snyder projection Tissot angular deformationisolines predict the spatial pattern of little variationin the center of the icosahedron face with progres-sivelylarger centerpoint distance variations (often inlonger-shorter distance adjacent pairs) as each edgeis approached Overall there appears to be slightlyless centerpoint distancevariation on the Fuller-Gray
Cartography and Geographic Information Science
Del
iver
ed b
y P
ublis
hing
Tec
hnol
ogy
to O
rego
n S
tate
Uni
vers
ity IP
128
193
164
203
on
Sat
12
Nov
201
1 22
50
45C
opyr
ight
(c)
Car
togr
aphy
and
Geo
grap
hic
Info
rmat
ion
Soc
iety
All
right
s re
serv
ed
Figure 14 Compactness comparison for basic segments offour global grids each shown on an orthographic map projec-tion to simulate the Earths sphericity
the icosahedron face always creates 12 penta-gons on the globe exactly 56th the area of eachhexagon the surface area standard deviation forthe Snyder grid will always be slightly greaterthan zero even though there is no area variationamong the hexagons formed However at pro-gressively higher levels of recursion the 12pentagons occupy increasingly less of the totalsurface area and the standard deviation for theentire globe rapidly approaches zero Hencethis graph shows the Snyder grid to be clearlysuperior for hexagonal subcells less than100000 km2 in area
Variation in centerpoint spacing between adja-cent cells for the four grid alternatives can be ana-lyzed by graphing logarithmically the standarddeviation in normalized centerpoint spacingagainst average cell area at increasing levels ofrecursion (Figure 18) This graph shows the gridsto perform similarly except for the poorly per-forming EqualAngleQuadrilateral grid The Fullerand Constant Area Quadrilateral grids converge athigher recursion levels to essentially identical lowstandard deviations closely followed by the Snydergrid
Average subcell compactness values for thefour grids (Figure 19) shows the superior perform-ance of icosahedral models over quadrilateralwhich is to be expected since hexagonal shapes are
bullbull~
nyder
Equal Angle
FuUerGra
Constant Area
9middotFold Recur ion Level 4
FuJlerGra ~ n der
0951
U95
09-10U9IJOll(S
9-FoldRecursion Level 3
FullerGray Snyder
Because variation in cell surface area is amajor concern for geostatisticians andothers we analyzed the variation innormalized cell area with increasinglevels of recursion Figure 17 is a loga-rithmic graph of the standard deviationin normalized-cell area versus the de-creasing average-cell area at increasinglevels of recursion for the four discreteglobal grid alternatives (but only thehexagonal grids formed by Snyder andFuller-Gray projection subtriangles)examined graphically above Recogniz-ing that the hexagonal partitioning of
Figure 15 Compactness comparison for tworecursion levels of the Fuller-Gray and ISEAgrids each shown on an orthographic mapprojection to simulate the Earths sphericity
hexagonal grid but this can only be shownconclusivelyby a statistical comparison ofalternativegrids
Statistical Comparison Results
Vol 26 NO4 283
Del
iver
ed b
y P
ublis
hing
Tec
hnol
ogy
to O
rego
n S
tate
Uni
vers
ity IP
128
193
164
203
on
Sat
12
Nov
201
1 22
50
45C
opyr
ight
(c)
Car
togr
aphy
and
Geo
grap
hic
Info
rmat
ion
Soc
iety
All
right
s re
serv
ed
140km
190km
560 km
1300 kIT
1650 kIT
425 m
SnyderProjection
RecursionLevel 7
RecursionLevel 3
RecursionLevel 5
Fuller-GrayProjection
Figure 16 Variations in hexagonal centerpoint spacing at three levels of recursionfor the Fuller and ISEA Grids on an icosahedron face
In addition to the detailed nu-merical analysis of grid-cellarea compactness and center-point spacing at different levelsof recursion we carried out anoverall comparison of numerous
Summary Rankings
inherently more compact thanrectangular shapes At all levels ofrecursion the Fuller grid is com-prised of hexagons slightly morecompact than correspondingSnyder grid hexagons both beingfar more compact than the corre-sponding constant area and equalangle grid quadrilaterals
Variation in subcell compact-ness seen by graphing the stan-dard deviation of cell compactnessvalues against average cell area(Figure 20) shows the slightlybetter performance of the Fullergrid over the Snyder grid athigher levels of recursion Theconstant-area grid has the lowestoverall standard deviation at itsinitial resolution (level 0) but itsstandard deviation increases rap-idly as the initial cells are parti-tioned in an equal-angle mannerHowever the poor performanceassociated with the equal-anglegrid at all levels of recursion isnever approached
l2 Equal Angle Quadrilateral1 05 Bgt 0- 3GlC RecursionC 01 Level Constant Area QuadrilateralbullIII 1 0 8
3C ~1 2l bull 83 4 5III
1 2 Fuller-Gray ProjectionenIII 01Glbullc(
4i0C 001
~ia 5Ebull0Z 0001
107
106
105 4 3 2
10 10 102Average Cell Area km (log10 scale)
discrete global grid alternatives in-cluding the seven presented in Table1 Eleven of the fourteen Goodchildcriteria were investigated along withtwo related criteria deemed signifi-cant for global grid comparison ForGoodchild criteria 2 4 and 5 a sum-mary ordinal ranking from 1 (verypoor) to 10 (best possible) was devel-oped based on the quantitative analy-sis of comparison metrics
Table 1 provides informationcrucial to the selection of a global
Figure 17 Normalized subcell area standarddeviation vs average cell area for four globalgrids
284 Cartography and Geographic Information Science
Del
iver
ed b
y P
ublis
hing
Tec
hnol
ogy
to O
rego
n S
tate
Uni
vers
ity IP
128
193
164
203
on
Sat
12
Nov
201
1 22
50
45C
opyr
ight
(c)
Car
togr
aphy
and
Geo
grap
hic
Info
rmat
ion
Soc
iety
All
right
s re
serv
ed
Criterion Equal Angle Constant Area Snyder Fuller-Gray Small Circle Dir Sphere Gnomonic
1 Domain is globe yes yes yes yes yes yes yes
2 Equal areal 1 7 10 8 10 6 3
3 Same topology yes no yes yes yes yes yes
4 Equal shape 1 3 7 8 7 9 9
5 Compactnessmiddot 1 4 7 8 8 8 9
6 Straight edges onprojection na2 na yes yes na na yes
7 Perimeter bisection J ni ni ni ni ni nin1
8 Hierarchy yes yes yes4 yes4 yes4 yes4 yes4
9 Single point yes yes yes yes yes yes yes
10 Maximally centered ni ni ni ni ni ni ni
11 Equidistant no no no no no no no
12 Addressing ni ni ni ni oi ni ni13 LatitudelLongitude yes yes yes yes yes yes yes
14 Arbitrary resolution yes yes yes yes yes yes yes
Geodesic edge lines no no no no no yes yes
Spatial nature of area Continuously Part continu- Constant Continuously Constant Fractal-like Continuouslyvariation varying ous part varying varying
irregular
IBest possible = 10 very good = 9 -7 very poor = 1
2 na = not applicable
J ni = not investigated
4 Only the triangular cells not the hexagonal are hierarchical in these grids
Table 1 Evaluation of Goodchilds and related comparison criteria for different global grids
Figure 18 Normalized centerpoint distance standard deviation vs average cellarea for four global grids
ConclusionsThe global grid evaluation crite-ria and associated metrics haveallowed us to compare gridsvarying widely in cell geometryand topology We have observedthat the prime areas of concernamong the small portion of theglobal data user community wehave interacted with to date areequal-area cells and a nested
spherical subdivision the small circle subdivisionmethod and the Fuller-Gray map projection forthe icosahedron If good overall performance is ofparamount concern the triangular andor hex-agonal partitioning of the Fuller-Gray projectionsurface might be selected due to the low variationin compactness of highly compact cells that vary
slightly in area in a continuouslyvarying predictable manner
2 3 4 6
JL------ ~2 1 2 3Constant Area Quadrilateral
Equal Angle Quadrilateral2 38 8
o~RecursionLevel
Snyder Projection ~Fuller-Gray 1
Projection
ampoc i 100gtQG)aiCcEG)1lIo ~ 01isNrn=G)~~S~ III 011-------------------------------
B l 11 1~ 1~ 1~ 1~2Average Cell Area km (log0 scale)
grid based on the relative importance of evalua-tion criteria from the users perspective If cellcompactness is of prime importance for examplea triangular or hexagonal grid based on partition-ing a Gnomonic map projection of an icosahe-dron face (not discussed in this article) would bethe best alternative closely followed by direct
Vol 26 No4 285
Del
iver
ed b
y P
ublis
hing
Tec
hnol
ogy
to O
rego
n S
tate
Uni
vers
ity IP
128
193
164
203
on
Sat
12
Nov
201
1 22
50
45C
opyr
ight
(c)
Car
togr
aphy
and
Geo
grap
hic
Info
rmat
ion
Soc
iety
All
right
s re
serv
ed
Figure 19 Normalized subcell average compactness VS average cell area for fourglobal grids
Figure 20 Normalized subcell compactness standard deviation vs average cellarea for four global grids
(1)
Equal Angle Quadrilateral
2 3 4 5bull 0
2 3 4 5
1 2 3 Constant Area auadrilateral
2Equal Angle Quadrilateral
3 4 5
Zone area = 2x 1tX r2 (10 - sin $)
RecursionLevel
o0-0 ---_e_----lto---
RecursionLevel
APPENDIXZone Standardized Compactness
(ZSC)Derivation
6 5 4 310 10 10 10
Average Cell Area km2 (10910 scale)
------ --_---lt~ 2 3 4
o
where r is the radius of the sphere and ltP is thelatitude of the bounding parallel
The surface area of a spherical zone is computedfrom
will give a full picture of the strengths and weak-nesses of current global grid alternatives
o
Constant AreaQuadrilateral
_~~ iFuller-Gray 1 2 Projection 3 4 5
o
Fuller-GrayProjection 1
Snyder Projection 1gt-------------------
05
00011------7---- ----------4 -----r--~2
10 10 10 10 10 102Average Cell Area km (10910scale)
CIl()CI)5 01 =() r~2Emlt3 ~- C 01=Gl 0 =0CO
111iii iii 001 =Ebulloz
IIIIII
CII CIImS 09tll ()bullbull tllClIogt Elt0o
08
hierarchy among cells (criteria 2and 8) Both the quadrilateralgrids and triangular forms ofpolyhedral grids examined herecan be partitioned recursivelyallowing a nested hierarchy tobe created Equal-area cells isthe critical criterion since cur-rently employed equal-angleand constant-area quadrilateralgrids can never be equal areaand were shown to performpoorly in this respect relative toseveral alternative grids
Only two global grids thosebased on the triangular partition-ing of the Icosahedral SnyderEqual Area (ISFA)projection andpartitioning using the Small Cir-cle Subdivision method (not dis-cussed in this article but describedin Song 1997)will produce equal-area cells on the spheroid TheSmall Circle Subdivision methodhas the advantage of producingcells slightly more compact butthe ISFA grid is currently moreefficient to compute and easier toimplement Consequently werecommend the ISFA as the bestcurrent choice for an equal areaglobal grid Whichever global gridis selected there are implementa-tion issues that must be addressedin future research includingbull Implementing an efficient
addressing scheme for bin-ning data into grid cells
bull Creating algorithms for fasttranslation of gridded data to and from geo-detic latitude and longitude
bull Developing efficient algorithms for aggrega-tion and disaggregation among nested gridlevels and
bull Implementing efficient data storage andaccess schemes for data in nested cells includ-ing metadata storage and accessWe have begun to address several of these im-
plementation facets for the ISFA grid beginningwith an ETOP05 DEM dataset binning experimentconducted at several levels of recursion (seehttpbufogeoorstedufirmatdgg for binning ex-amples) Performing similar implementation experi-ments on additional datasets using other candidategrids would provide a complementary grid compari-son that together with our geometrical comparisons
286 Cartography and Geographic Information Science
Del
iver
ed b
y P
ublis
hing
Tec
hnol
ogy
to O
rego
n S
tate
Uni
vers
ity IP
128
193
164
203
on
Sat
12
Nov
201
1 22
50
45C
opyr
ight
(c)
Car
togr
aphy
and
Geo
grap
hic
Info
rmat
ion
Soc
iety
All
right
s re
serv
ed
REFERENCES
ACKNOWLEDGMENTS
so that
EidenshinkJC andJL Faundeen 1994 The 1 km AVHRRglobal land data set First stages of implementation Inierna-tionaljournal of Remote Sensing 153443-62
Fekete G and L Treinish 1990 Sphere quadtree A newdata structure to support the visualization of sphericallydistributed data SPIE Extracting rManing from complex dataProcessing display interaction Vol 1259 pp 242-53
Fuller RB 1982 SynergeticJ NewYork MacMillanGiacaglia GEO and CA Lundquist 1972 Sampling func-
tions for geophysics Smithsonian A5trvphysical Observatory Spe-cial Report No 344 93 pp
Goodchild MF 1994 Geographical grid models for environ-mental monitoring and analysis across the globe (panelsession) In proceddings of GISUS 94 Conference PhoenixArizona
Gray RW 1994 Exact transformation equations for Fullersworld map Cartography and Geographic Informatian Systems21(4) 243-46
Hastings DA 1996 The global land l-km base elevationdigital elevation model A progress report Global ChangeNewsletter 27 11-12
Heikes R and DA Randall 1995 Numerical integration ofthe shallow-water equations on a twisted icosahedral gridPart I Basic design and results of tests Monthly WeatherReview 123 1862-80
Kahn R 1995 What shall we do with the data we are expect-ing in 1998 In Proceedings of the Massive Data SelJ WorkshopCommittee on Applied and Theoretical Statistics NationalAcademy of Sciences Washington DC
Kimerling AJ 1984 Area computation from geodetic coordi-nates on the spheroid Surveying and Mapping 44(4) 343-51
Kimerling AJ D White K Sahr and L Song 1995 Devel-opment of global sampling grid Mid-project report Samplingdesign and statistics research for EMAP Program us Environ-mental Protection Agency Corvallis Oregon
Loveland TR JW Merchant D O Ohlen and JF Brown1991 Development of a land-cover characteristics databasefor the conterminous US Photogrammetric Engineering andRemote Sensing 57(11) 1453-63
Lukatela H 1987 Hipparchus geopositioning model Anoverview In Proceedings of Auto Carto 8 Symposium Balti-more Maryland pp 87-96
Maling DH 1992 Coordinate systems and map projectioru (2nded) Oxford UK Pergamon Press
Muehrcke PC and JO Muehrcke 1997 Map we (4th ed) Madi-sonWisconsinJP Publications
Olea RO 1984 Sanlpling design optimization for spatial functionsMathematical Geowgy 16369-92
Saff EB and ABJ Kuijlaars 1997 Distnbuting many points on asphere The Mathematical Intelligencer 19(1)5-11
Slade G 1994 Self avoiding walks The MaJhematical Intelligencer16(1)29-35
Snyder JP 1987 Map projectioru-A working manual Wash-ington DC US Government Printing Office
Snyder JP 1992 An equal-area map projection for polyhe-dral globes Cartographica 29(1) 10-21
Song L 1997 Small circle subdivision method for develop-ment of global sampling grid Unpublished Masters thesisOregon State University 176 pp
Stauffer D 1992 Introduction to percolation theory (2nd ed)London UK Taylor amp Francis
Tobler WR and Z Chen 1986 A quadtree for global infor-mation storage GeographicalAnalysis 18(4) 360-71
White D A J Kimerling and WS Overton 1992 Carto-graphic and geometric components of a global samplingdesign for environmental monitoring Cartography and Geo-graphic Information Systems 195-22
White D AJ Kin1erlingK Sahr and L Song 1998 Comparingarea and shape distortion on polyhedral-based recursive partitionsof the sphere International Journal of Geographiad Information Science12 805-27
Wolfram S 1986 Cellular automaton fluids 1 Basic theoryjournal of Statistical Physics 45471-526 bull
(5)Zone perimeter = 2XTCXr(co~)
ZSG = SQ1middott(4XTCxcellarea - cellarea2lr2) I cellperimeter (6)
Zone Standardized Compactness (ZSC) isgiven by Zone perimeterCell perimeter Substi-tuting and combining equations we compute ZSCfrom
Baumgardner JR and PO Frederickson 1985 Icosahedraldiscretization of the two-sphere SIAM journal of NUrMricalAnalysis 22(6) 1107-15
Bomford G 1971 Geodesy Oxford The Clarendon Press731 pp
Brooks DR 1981 Grid systems for Earth radiation budgetexperiment applications NASA Technical Memorandum8323340 pp
Coexeter HSM 1962 The problem of packing a number ofequal nonoverlapping circles on a sphere Transactions NewYork Academy of Science Division of Mathematics Series IIvol 24 320-31
Dutton G 1988 Geodesic modeling of planetary relief Car-tographica 21 188-207
Dutton G 1994 Geographical grid models for environmentalmonitoring and analysis across the globe (panel session) InProceedings of GISUS 94 Conference Phoenix Arizona
cos$ =sqrt( IO-(IO-cellareal(2xTCX r2)) (4)
The perimeter of the spherical zone is thecircumference of the bounding parallel computedfrom
Gelarea = 2XTCxr2(lO-sin$) (2)
This research was supported by US Environ-mental Protection Agency-Oregon State Univer-sity Cooperative Agreement CR 821672 MatthewGregory Department of Geosciences graduatestudent created the centerpoint distance mapsseen in Figure 16 Dr Ralph Kahn NASA-JPLalso contributed significantly to this manuscriptThis manuscript has been subjected to EPA reviewand approved for publication The conclusionsand opinions are solely those of the authors andnot necessarily the viewsof the Agency
and
Setting the zone surface area equal to the cellarea we obtain
Vol 26 NO4 287
Del
iver
ed b
y P
ublis
hing
Tec
hnol
ogy
to O
rego
n S
tate
Uni
vers
ity IP
128
193
164
203
on
Sat
12
Nov
201
1 22
50
45C
opyr
ight
(c)
Car
togr
aphy
and
Geo
grap
hic
Info
rmat
ion
Soc
iety
All
right
s re
serv
ed
Remote Sensing for theEarth Sciences (3rd ed)Andrew Rencz
Recently adopted titlesin cartography GISremote sensingandGPS
Policy Issues in Modern art graph)DR Frazer Taylor (cd)
Wilderness NavigationBob and Mike Bums
I bullbull
ACS
Maps with the NewsMark Monmonier
Air Apparent HowMeteorologists Learnedto Map Predict andDramatize WeatherMark Monmonier
froooks
Mapping a Northern LandThe Survey of CanadaGerald McGrath and LouisSebert (eds)
Thematic Cartographyand VisualizationTerry A Slocum
1 it 11 bull
on Oirle ~y a30149j- ~24)
288 Cartography and Geographic Information Science
Del
iver
ed b
y P
ublis
hing
Tec
hnol
ogy
to O
rego
n S
tate
Uni
vers
ity IP
128
193
164
203
on
Sat
12
Nov
201
1 22
50
45C
opyr
ight
(c)
Car
togr
aphy
and
Geo
grap
hic
Info
rmat
ion
Soc
iety
All
right
s re
serv
ed
tetrahedron hexahedron (cube) octahedron dodecahedron icosahedron
Figure 1 The spherical tessellations of the five regular polyhedra
without losing regularity in both surface area andshape Alternative approaches beg investigationSubdividing the globe with total regularity of surfacearea and polygonal shape within the cells formed bythe subdivision can be achieved only by projectingthe faces of one of the five Platonic polyhedra ontothe globe (Figure 1) Further partitioning of any facewill produce unavoidable variations in surface areashape or both Area partitioning is closelytied to theproblem of uniformly placing a large number ofpoints over the surface of a sphere and optimizingthe placement of points has challenged scientistsworking in fields as diverse as viral morphologycrystallography and electrostatics (Saffand Kuijlaars1997)
Equally important is the realization that thebasic geometry of commonly employed quadrilateralpoint grids or surface tessellations while well suitedto array storage and matrix manipulation may in-herently hinder numerical and geostatistical model-ing efforts Scientists have noted the superiorperformance of triangular point grids and associatedhexagonal surface tessellations for numerical analy-ses central to cellular automata (Wolfram 1986)percolation theory (Stauffer 1992) and self-avoidingwalks (Slade 1994) Hexagonal tessellations are fa-vored by influential statisticians involved with devel-oping survey sample designs and geostatisticalmethods such as Kriging (Olea 1984) Additionallymathematicians studying spherical point distribu-tions note that the general geometric pattern foroptimal configurations always is the same largenumbers of points appear to arrange themselvesaccording to a hexagonal pattern that is slightlyperturbed in order to fit on the sphere (Saff andKuijlaars 1997)
It is clear that a thorough evaluation and com-parison of alternative global grids is needed In thisarticle we present an evaluation approach centeredon cell geometry and topology as well as resultsfrom a global grid comparison study funded by theUS Environmental Protection Agency (White et al1992 1998) We begin by developing a
272
comprehensive list of grid evaluation criteria alongwith metrics for many of the criteria We next de-scribe grid alternatives that are examples of basicapproaches to tessellating the globe Our compari-son metrics are next applied to these grids and theresults of this analysis are presented in both mapsand statistical summaries We conclude by recom-mending a particular grid-the Icosahedral SnyderEqual Area (ISEA)--for global modeling efforts andnote several topics for further research
Global Grid Comparison CriteriaPartitioning the globe into a global grid withprescribed fineness results in area or shape distor-tion or both Different partitioning approacheswill introduce different magnitudes of these dis-tortions Therefore it is necessary to have a set ofideal geometrictopologic properties and corre-sponding mathematical metrics for each of theproperties to serve as comparison standards foralternative global grids These properties of anideal global grid are organized into the list ofgeneral evaluation criteria shown below An earlyversion of these criteria was formulated by Mi-chael Goodchild (1994) and we refer to this list asthe Goodchild Criteria1 Areal cells constitute a complete tiling of the
globe exhaustively covering the globe withoutoverlapping
2 Areal cells have equal areas This minimizes theconfounding effectsof area variation in analysisand provides equal probabilities for samplingdesigns
3 Areal cells have the same topology Ideally thismeans that every cell has the same number ofedges and verticesThis may not apply to gridswhose cellboundaries are arbitrarycurves
4 Areal cells are the same shape Exactlywhat thismeans is higWydependent on the nature of thespecific grid In the ideal case each cellwould bea regular sphericalpolygonwith edges consisting
Cartography and Geographic Information Science
Del
iver
ed b
y P
ublis
hing
Tec
hnol
ogy
to O
rego
n S
tate
Uni
vers
ity IP
128
193
164
203
on
Sat
12
Nov
201
1 22
50
45C
opyr
ight
(c)
Car
togr
aphy
and
Geo
grap
hic
Info
rmat
ion
Soc
iety
All
right
s re
serv
ed
of great circle arcs of lengths corresponding tothose of every other cell
5 Areal cells are compact Because a single vector ofvalues will be associated with all the points in asingle areal cell it is preferable that the actualvalues of all the points in the cell be as much alikeas possible Maximal compactness ensures thatthe points in a cell are as close to each other aspossible thus taking advantage of Toblers firstlaw of geography which in this case is that thecloser points are in space the more likely they areto be alike
6 Edges of cells are straight in a projection Againthis assumes that the concept of edges has mean-ing for a particular grid (ie that the cell bounda-ries are not arbitrary curves) This criterionensures the existence of a relatively convenientspace for describing visualizing and working withgrid cells
7 The midpoint of the arc connecting two adjacentcell centers coincides with the midpoint of theedge between the two cells This criterion hasproved useful in calculating transport betweencells using finite differences (Heikes and Randall1995)
8 The points and areal cells of the various resolu-tion grids which constitute the grid system form ahierarchy which displays a high degree of regular-ity If a hierarchical structure exists grid cellsmaybe subdivided recursively and a nested set ofgeometrically similar cells may be created fromthe set of smallest cells reducing the burden ofrecalculation as the fineness of resolution changesA hierarchical structure should also enable activi-ties such as efficient computer implementation ofthe grid system and multi-resolution analysisusing the grid system
9 A single areal cell contains only one grid referencepoint ie each reference point lies in a differentareal cell
10 Grid reference points are maximally centralwithin areal cells In conjunction with the lastcriterion this optimally supports the commonpractice of using the point grid as an approxima-tion to the area grid
11 Grid reference points are equidistant from theirneighbors
12 Grid reference points and areal cells display regu-larities and other properties which allow them tobe addressed in an efficient manner The gridsystem should provide an addressing system thatsupports efficient algorithms for such commongrid operations as determining cell and pointneighbors determining grid distances and mov-ing between grid resolutions
Vol 26 No4
13 The grid system has a simple relationship to thetraditional latitude-longitude graticule Since forthe indefinite future most data will be geo-referenced using the latitude-longitude graticuleefficientwaysof transferring data to and from thissystem will be required As in the case of the pla-nar rectilinear grid this is a practical considera-tion that while perhaps almost arbitrary from amathematical viewpoint cannot be ignored in theshort term
14 The grid system contains grids of any arbitrarilydefined spatial resolutionWe have already noted that it is mathematically
impossible for any global point grid or surface tessel-lation to completely fulfill all of these criteria asseveral are mutually exclusive A good general-purpose grid or tessellation might be expected tostrike a balance among all the criteria whereas thosetuned for specific applications or numerical methodsmight value certain of these criteria more highly Forexample geostatistical methods favor equal-areatessellations that completely cover the globe andhave a hierarchical structure Survey sampling de-signs for global environmental monitoring haveequal-area cells as a prime requirement whereasatmospheric transport modeling equations rely oncriterion seven Scientists involved in GIS data inte-gration and cartographic display on the other handmay value highly the last three criteria
Evaluation Criteria MetricsGlobal grid evaluation criteria are of limited util-ity unless metrics suitable for grid comparison aredeveloped for each Both topological and geomet-rical metrics must be devised for 1) checking thata criterion has been met and 2) determining howwell a criterion has been satisfied Examples of thefirst type of metrics includebull Criterion I-Ensure that the sum of cell areas
equals the sea level surface area of the globeand that the coordinates of all shared celledges are identical
bull Criterion 6-Check that the coordinates de-fining each cell edge are identical to thosecomputed from the linear equation deter-mined for the edge endpoints
bull Criterion 9-Employ a point-in-polygonfunction to check that only one samplingpoint lies in each cell
bull Criterion 8-Check to see that recursive parti-tioning a mathematical procedure essentialto create a hierarchical grid system can beperformed
273
Del
iver
ed b
y P
ublis
hing
Tec
hnol
ogy
to O
rego
n S
tate
Uni
vers
ity IP
128
193
164
203
on
Sat
12
Nov
201
1 22
50
45C
opyr
ight
(c)
Car
togr
aphy
and
Geo
grap
hic
Info
rmat
ion
Soc
iety
All
right
s re
serv
ed
Level 3
Level 2
2 x sqrt(1t x cell area)cell perimeter =
= 3545 x sqrt (cell area2r)cell perimeter (I)
cells with great circle edges (such as spheroi-dal triangles or hexagons) or of more geomet-rically complex cells requires the orientedtriangle summation approach found inKimerling (1984) These actual areas werenormalized through dividing by the averagearea for all cells in the tessellation so that allcells in a perfectly equal area global gridwould have normalized cell areas of 10Criterion 5-Planar compactness is often meas-ured by the surface-area-to-perimeter ratio(Muehrcke and Muehrcke 1997) Standardizingthis ratio to 10for a planar circleof the sameareaas the cell givesa compactnessindex applicabletoall discrete global grids This index is computedfrom the equation
(c) 9-fold Triangle Partitions
(a) 4-fold Trtangle Partitions
(d) 9-fokl Hexagon Partitions
(b) 4-fold Hexagon Partitions
bull
Level 1
Figure 2 Four- and 9-fold triangular and hexagonal partitioning of an icosahedronface at the first three levels of recursion
The tenninology of recur-sive partitioning is best under-stood from an illustration suchas Figure 2 Two types of parti-tioning called 4-fold and 9-foldare shown in the top and bottomtriangular cells This involveschecking that each full triangle(recursion level 0) can be parti-tioned into either 4 or 9 triangu-lar cells (recursion level 1) If this4- or 9-fold partitioning can becontinued to produce subtrian-gles at all higher levels of recur-sion a hierarchical triangulargrid system is achievable
Recursive partitioning facili-tates the inverse operation ofsubcell aggregation into largercells of the same or a differentgeometrical form For examplethe left half of Figure 2 illus-trates that sets of 4 9 16 25neighboring subtriangles can beassembled into progressivelycoarser spatial resolution trian-gular global grids The right halfof this figure showsthat sets of 624 96 neighboring subtrian-gles can be assembled into pro-gressively larger hexagonal cellsNotice that with 9-fold partition-ing the hexagonal cells are ori-ented identically an advantagewhen assembling global data setsat varying spatial resolutions Asimilar illustration could becreated for recursive partitioning of spherically rec-tangular quadrilaterals with the desirable rotationalinvariance present for any n-fold partitioning
We have focused on geometrical comparisonof metrics for surface area compactness andpoint spacing on both the sphere and a spheroidsuch as the GRS80 or WGS84 We were aware thatmeasures on the sphere and spheroid would givenearly identical numerical results but using sphe-roidal area metrics was essential to our demon-stration that certain grids are truly equal area onthe Earths surface All of these measures involvedetermination of geodesic distances using stan-dard ellipsoidal distance equations (Bomford1971) Examples of comparison metrics includebull Criterion 2- The spheroidal surface area of
quadrilateral cells can be computed usingstandard equations found in Maling (1992)Computing the spheroidal surface area of
274 Cartography and Geographic Information Science
Del
iver
ed b
y P
ublis
hing
Tec
hnol
ogy
to O
rego
n S
tate
Uni
vers
ity IP
128
193
164
203
on
Sat
12
Nov
201
1 22
50
45C
opyr
ight
(c)
Car
togr
aphy
and
Geo
grap
hic
Info
rmat
ion
Soc
iety
All
right
s re
serv
ed
Figure 3 Spherical zone used in Zone Standardized Com-pactness (ZSC) calculation for an icosahedron face
However we are dealing with cells on theglobeTaking the Earths sphericity into account abetter index is one that uses a pole-centered spheri-cal zone of the same area as the grid cell (Figure 3)for the ideal (10 ) compactness What we term ZoneStandardized Compactness (ZSC)is computed from
ZSC = sqrt( 4x Tt x cell area - cell area 2 r2)cell peTimeter (2)
The derivation of ZSC is given in the Appen-dix We have extended this idea to the spheroidby determining the spheroidal area to parallelperimeter ratio normalized to a spheroidal cap ofthe same surface area as the cell (Kimerling et al1995)bull Criterion 11-Grid point spacing can be meas-
ured assuming that we can determine the latitudeand longitude of points within adjacent cellsAssuming the globe to be spherical we employthe standard great circle distance equation foreach pair of adjacent coordinates
distance = r arccos (sin(lat I) sin (lat2) + cos (lat J)cos (lat2) cos (lion I -lon2 I) (3)
bull Criterion 10-Detennining grid point centralitywithin a cell can be approached as a center ofgra~ty problem Here we can use off-the-shelfalgorithms for center-of-gra~tycomputation fromlists of edge coordinates and then compare thegrid point location to the center of gra~ty todetermine the distance and direction of dC~ation
Vol 26 No4
Each of the above comparison metrics are com-puted for a single cell or grid point and can be ana-lyzed statisticallywhen computations are extended tothe entire globe (realizing that the entire populationof cells is the sample) The mean standard deviationand the range of cell metrics have been found to beuseful comparison statistics for alternative globalgrids (Whiteet al 1998)
Global Grid AlternativesNumerous surface tessellations have been proposedas global grids but the possibilitiescan be organizedinto a limited number of general categories Inspiredby Duttons (1994) general tessellation taxonomy wedeveloped a more specific hierarchical classificationscheme for global grids (Figure 4) and then selectedgrids from different classes for comparison At thebroadest level our scheme divides grids into thosebased on directly tessellating the sphere or spheroidand those that transform all or a portion of the globeto a map projection surfacewhich is tessellated in aregular manner with cell edges ancVor grid pointsthen back-projected to the sphere or spheroid
At the second level in our classification hierar-chy direct surface tessellations can be based onbull Subdividing quadrilateral cells recursivelybull Subdividing the faces of a spherical Platonic
polyhedron recursively orbull Creating a Voronoi tessellation comprised of
spherical or spheroidal Thiessen polygonsDirectly tessellated quadrilateral grids can be
further divided into what the global modeling com-munity calls equal-angle and constant-area grids(Kahn 1995) Tessellations of the globe into quadri-lateral cells of equal latitudinal and longitudinalextent are termed equal angle Examples aboundincluding the 5 x 5 poundTOP05 global DEM and theERBE 2S x 25deg 5degx 5degand 10degx 10deggrids (Brooks1981) Constant-area tessellations begin with anarbitrarily sized quadrilateral cell at the equator andthen define the parallel and meridian cell bounda-ries across the globe so as to achieve approximatelyequal-area cells This is done either by keeping thelatitude increment constant and adjusting the longi-tude increment as the pole is approached or viceversa (Brooks 1981)
Directly tessellated polyhedral grids can alsobe divided into two categories based on whetherthe partitioning of polyhedral faces is performedwith the edges of a great or a small circle Feketeand Treinishs (1990) spherical quadtree datastructure which is based on recursive subdivisionof spherical triangles obtained by projecting thefaces of an icosahedron onto a sphere is a good
275
Del
iver
ed b
y P
ublis
hing
Tec
hnol
ogy
to O
rego
n S
tate
Uni
vers
ity IP
128
193
164
203
on
Sat
12
Nov
201
1 22
50
45C
opyr
ight
(c)
Car
togr
aphy
and
Geo
grap
hic
Info
rmat
ion
Soc
iety
All
right
s re
serv
ed
Map Projection Surface Tessellations
Single PrOj~ ~tion Surface-- ---- -- --Equal Area Non-Equal Area Equal Area Non-Equal Area
Gnomonic
ex Fuller (1982)Icosahedral
ex Snyder (1992)Polyhedral EqualArea Projections
ex lukatela (1987)ex Fekete and ex Song (1997) Hipparchus Geo-
Treinish (1990) positioning ModelSpherical Quadtree Dutton (1988) QTM
Constant-Area Quadrilateral TessellationOur example is the Nimbus Earth Radiation Budget(ERB) Experiment grid with initial 4S x 4S quad-rilateral cells at the equator (Figure 6) The longitu-dinal increment increases in 12 discrete steps to 120degnear each pole Recursive partitioning into approxi-mately constant-area subcells is more problematic as2-frequency equal-angle partitioning is commonly
Global Grid Comparison Examples
Equal-Angle Quadrilateral TessellationOur example will be an initial partitioning of theglobe into thirty-two45deg x 45deg cells at recursion level0 and subsequent 9-fold recursive partitioning tolevel fiveHence grids with 45deg x 45deg 15degx 15deg5degx5deg 1 23degx 1 23deg 59degx 59deg and 527degx 527degedgeswill be analyzed Recursion level two illustrated inFigure 5 corresponds to the 5degx 5degERBEgrid
Our overall comparison of the above categories ofglobal grids based on the Goodchild criteria ispresented in Table 1 and will be discussed as part ofour recommendations We have also selected fourexamples from different categories in our taxonomyto illustrate our more detailed comparison of surfacearea compactness and centerpoint spacing varia-tion These examples described belowwere selectedto show the fundamental geometrical differencesbetween quadrilateral and polyhedral grids as wellas to contrast commonly used standard quadrilat-eral grids with polyhedral alternatives
ex Nimbus ERS
Direct SphericaVSpheroidal Tessellations----- I _Quadrilateral Polyhedral Voronoi---- ---- --Equal Angle Constant Area Great Circle Small Circle
Edges Edges
ex ETOP05ERSE 25 deg
ex Tobler and Chen ex Square Projection(1986) lambert Cylin- (same as equal angle
drical Equal Area tessellation)
loveland et al (1991)Global land
Characterization
example of great-circleedge partitioningSongs (1997) small-circle subdivision systemcreates equal-areaspherical triangles withmore mathematicallycomplex small circleedges Duttons (1988)QTM projection gridfor octahedron faces isan interesting combina-tion of great- and small-circle subdivision
Lukatelas (1987)Hipparchus Geoposition-ing Model is an excellentexample of a spheroidalVoronoi tessellationHere the outwardly sim-ple problem is comput- Figure 4 Globalgrid taxonomying a set of regularlyspaced grid points fromwhich spherical or sphe-roidal Thiessen polygons can be constructed But asGiacaglia and Lundquist (1972) note The problemof distributing in the most regular way a given num-ber of points on a sphere has been studied for centu-ries and in general is still unsolved Methods suchas finding the greatest number of small circles of agiven radius that can be placed on a spherical surfacewithout overlapping (Coxeter 1962) have been su-perseded by sampling function approaches for thesphere that begin with the edges of a spherical poly-hedron (Giacaglia and Lundquist 1972) Perfectregularity however remains an inherently unachiev-able ideal
Map projection based global tessellationscurrently can be placed in one of two categoriessingle and multiple projection surfaces Singleprojections of the globe typically cylindrical havebeen used to construct quadrilateral grids It isuseful due to the importance of satisfying crite-rion two to further divide projection surfaces intoequal area (eg Tobler and Chens (1986) Lam-bert cylindrical equal-area grid) and non-equalarea (the ETOPO 5 grid for example can bethought of as a square projection partitioned intocells 5 x 5 in length on the projection surface)categories Multiple projection surfaces are typi-cally faces of Platonic polyhedra We can alsoplace these into equal area (eg Snyder (1992)polyhedral equal area projections for the fivePlatonic polyhedra) and non-equal area (egFuller (1982) and Baumgardner and Frederickson(1985raquo projection of icosahedron faces
276 Cartography and Geographic Information Science
Del
iver
ed b
y P
ublis
hing
Tec
hnol
ogy
to O
rego
n S
tate
Uni
vers
ity IP
128
193
164
203
on
Sat
12
Nov
201
1 22
50
45C
opyr
ight
(c)
Car
togr
aphy
and
Geo
grap
hic
Info
rmat
ion
Soc
iety
All
right
s re
serv
ed
Equal Angle GridFigure 5 Equal-angle quadrilat-eral grid for a 45deglongitude by 90deglatitude sectionof the globe
Constant Area GridFigure 6 Con-stant area quad-rilateral grid for a45deg longitude by90deg latitude sec-tion of the globe
SNYDER MAP PROJECTION
Figure 7 Icosahedral Snyder Equal Area (ISEA) projection of an icosahedron face (a) Tissotangular deformation isolines (b)
equivalence throughout (Figure 7) The projection ismade equal area by adjusting the scale outward fromthe center of each edge This results in increasedshape distortion as each of the three axes from thetriangle center to comer vertices is approached Amap of angular deformation across an icosahedronface (which is the result of our Tissot distortionanalysis based on the Gaussian basic quantity ap-proach outlined in Maling (1992raquo shows this patternof distortion
The equilateral triangular projection of eachicosahedron face is subdivided recursively into equi-lateral subtriangles in either the 4-fold or the 9-foldmanner illustrated in Figure 2 The bowing of trian-gle edges along the three axes of angular deforma-tion is apparent in Figure 8 where 4-fold subdivision
subtriangles of recur-sion level four are backprojected to the globeThis edge bowing is aprimary cause of varia-tions in compactnessamong subtriangles
We noted earlierthat triangular gridsallow hexagonalgrids to be createdthrough subtriangleaggregation and thathexagonal grids haveseveral advantagesrelated to global dataanalysis The ISEAtriangular grid inher-ently allows equal-area hexagons to beassembled at varying
Tissot Angular DeformationIcosahedron Face
employed for simplicity Breaking from tradition weemploy 3-frequency equal-angle partitioning tomaintain consistency in our comparisons while usingthe same basic partitioning method The initial 4Slatitude x variable longitude cells correspond ap-proximately to recursion level two in our equal-angletessellation with partitioning carried to recursionlevel 5 (IS OS 16deg latitude by variable longitudecell edges)
Equal-Area Map Projection Surface TessellationOur example is the Icosahedral Snyder Equal- Area(ISEA) projection (Snyder 1992) which transformseach icosahedron face on the globe into an equilat-eral planar triangle while maintaining area
Vol 26 No4 277
Del
iver
ed b
y P
ublis
hing
Tec
hnol
ogy
to O
rego
n S
tate
Uni
vers
ity IP
128
193
164
203
on
Sat
12
Nov
201
1 22
50
45C
opyr
ight
(c)
Car
togr
aphy
and
Geo
grap
hic
Info
rmat
ion
Soc
iety
All
right
s re
serv
ed
PARTITIONING COMPARISONFigure 8 Icosahedron faces that are4-fold partitioned to recursion levelfour on the ISEA and Fuller-Grayprojection surfaces then re-projected on an orthographic mapprojection to simulate the Earthssphericity
Snyder Projection
4 bull FOld SubdiVISionRecursion Level 4
Fuller-Gray Projection
Figure 9 Aggregation of 54 and 6 neighboring triangles on the ISEA pro-jection into equal area hexagonal cells forming 9-fold higher resolutiongrids
levels of spatial resolution For example aggre-gating sets of 54 neighboring triangles producesthe equal-area hexagonal grid for the icosahedronface shown in Figure 9a Again apparent is thebowing of hexagon edges along the three axes ofhigher angular deformation which should intro-duce larger compactness variations
Aggregating the same subtriangles into sets ofsix neighbors (Figure 9b) creates a nine timeshigher resolution hexagonal grid with edge bow-ing more localized along the three axes Becausenine of the small hexagons (seven fulland one-third of six adjacent) form thelarge hexagon the small hexagons area 9-fold subdivision of the large hexa-gons at the next higher level of recur-sion Further 9-fold partitioning of theunderlying subtriangles allows assem-bly into 9-fold smaller hexagons athigher levels of recursion
Non-Equal Area Map Projection SurfaceTessellationWe will use the Fuller-Gray projectionwhich is based on the geometrical ideabehind R Buckminster Fullers icosahe-dral world map projection (Fuller 1982)Fuller imagined the three edges of eachicosahedron face as flexible bands curvedto lie on the spherical surface (left half ofFigure 10) Each edge would be subdi-vided and holes drilled at n equallyspaced increments and flexible bandswould be strung between correspondingholes on adjacent edges This wouldcreate a triangular network of lines onthe sphere which could be flattened tocreate a regular grid of equilateral subtri-angles (right half of Figure 10)
278
Fuller imagined the verticesof each subtrianglebeing the projection of the corresponding line inter-section point on the sphere These intersectionpoints were later found physically impossible toachieve because each triplet of intersecting lines onthe globe forms a small triangle in the plane whosecenterpoint is the best approximation of Fullersidea Gray (1994) developed exact transformationequations for this approximation producing a com-promise projection having both small area andshape distortion
(a)
(b)
Cartography and Geographic Information Science
Del
iver
ed b
y P
ublis
hing
Tec
hnol
ogy
to O
rego
n S
tate
Uni
vers
ity IP
128
193
164
203
on
Sat
12
Nov
201
1 22
50
45C
opyr
ight
(c)
Car
togr
aphy
and
Geo
grap
hic
Info
rmat
ion
Soc
iety
All
right
s re
serv
ed
Figure 10 Fullers geometrical concept of an icosahedral map projection surface (Source Fuller1982)
The equilateral-triangle Fuller-Gray projec-tion of an icosahedron face is shown in Figure 11along with area-scale and angular-deformationmaps displaying results of our Tissot distortionanalysis Note the smooth increase in area-scaleand angular deformation from the triangle centerto each edge vertex Both recursive partitioningand triangle aggregation is performed identicallyto the Snyder projection The only differenceshould be the creation of non-equal area triangu-lar and hexagonal cells that vary less in compact-ness on average and that grade smoothly fromslightly higher to lower compactness (Figure 8)
Analyses and ResultsThe ideal comparison of global grid geometricalproperties would consist of computing surface areacompactness and other metrics at each level of re-cursion down to the spatial resolution correspondingto the smallest grid cell expected to be used in globalanalysis If the smallestcellwere 1 km2 for examplethe 9-fold partitioning of an icosahedron face mustbe carried out to recursion level eight meaning thatarea compactness centerpoint distance and othermetries must be computed for over 500 million cellsNaturally an infinite number of triangular hexago-nal or quadrilateral recursion levels and cells arepossible as recursive partitioning can continueindefinitely
We have found 9-fold partitioning to recursionlevels less than six to be suitable for comparisonpurposes because surface area compactness center-point spacing and other metries are still computableat the rapidly increasing cell densities However thecomputation effort quickly becomes immense athigher levels of recursion and the results may notadd significantlyto our understanding of the surface
Vol 26 No4
tessellation or gridpoint geomeoy
The normalizedarea zone standard-ized compactness andcenterpoint distanceanalyses that followare a representativesample of our fullresearch effort Thefour grid alternativesexamined were se-lected from the lOwestudied but resultsfrom only two of thefive recursion levelsweexamined are pre-sented here to illus-
trate the essential geometrical properties of the fullrange of quadrilateral and polyhedral grid alterna-tivesWe have limited the polyhedral analysis to thehexagonal tessellation because area and shape dis-tortion characteristics of triangular partitioning arepresented in a companion article (White et al 1998)
Normalized Area Map Comparison
bull Spheroidal areas were computed from sets ofclosely spaced geodetic latitude and longitudecoordinates along each cell edge (usually 11points along an edge) For the two quadrilat-eral tessellations the bounding parallels wereon the WGS 84 spheroid However for theFuller-Gray and Snyder projections onlyspherical equations were available so a morecomplex spheroidal transformation proce-dure had to be used This involved Projectingfrom the authalic sphere for the WGS 84ellipsoid to the plane using forward projec-tion equations
bull Partitioning on the planar projection surfacebull Back projecting cell edges and centerpoints to
spherical coordinates using the inversespherical equations for each projection and
bull Converting authalic to WGS 84 geodetic lati-tude using the transformation equationsfound in Snyder (1987) This allows the ori-ented spheroidal triangle summation method(Kimerling 1984) to be applied to the four(and other) global grid alternativesMaps comparing variations in normalized
surface area for the four discrete global grid ex-amples described above are presented in Figure12 The equal-angle and constant-area grids cover45deg of longitude by 90deg of latitude (equator to
279
Del
iver
ed b
y P
ublis
hing
Tec
hnol
ogy
to O
rego
n S
tate
Uni
vers
ity IP
128
193
164
203
on
Sat
12
Nov
201
1 22
50
45C
opyr
ight
(c)
Car
togr
aphy
and
Geo
grap
hic
Info
rmat
ion
Soc
iety
All
right
s re
serv
ed
Fuller-Grey map projection
Icosahedron Face Area Distortion Angular Deformation
Tissot distortion analysis
Figure 11 Fuller-Gray map projection and Tissot distortion analysis for an icosahedron face
pole) or 1I16th of the globe Each icosahedronface of course covers 120th of the globe so thatthe surface areas of comparison surfaces are ap-proximately the same The level of recursion foreach grid was selected so that the average cell areawithin each grid is nearly the same From thesemaps in Figure 12 it is apparent thatbull The larger range in normalized area (0069 -
1569 or 150 percent) associated with theequal-angle grid makes it as expected by farthe worst alternative of the four
bull The constant-area grid has a greater range ofnormalized area than either the Snyder orFuller-Gray grids The pattern of spatialvariation is one of identical normalized areawithin east-west bands Cell areas also de-crease slowly from south to north within thethree blocks in the bottom half of the maphaving identical meridians as cell boundariesSuch regularity is not present in the rows ofcells forming the top half of the map
bull Normalized hexagon areas on the Fuller-Grayprojection decrease smoothly from a value of106 (6 percent above average) at the icosahe-dron face center to a lower value of 0944near each corner The very low normalizedarea for the triangle at each corner is causedby this being one of five spherical triangles onadjacent icosahedron faces that together formone of 12 pentagonal cells on the globe Eachpentagon area is 56th that of the averagehexagonal cell which gives the lower normal-ized area
280
bull Normalized hexagon areas on the Snyderprojection are identical and just slightly largerthan 10 so as to offset the three smaller areasof corner pentagonal cells If the pentagonareas are removed from the calculations allhexagons are measured as having a 10 nor-malized surface area a numerical demonstra-tion that the Snyder equations for theicosahedron do indeed produce an equal areamap projection surfaceWe next examine the spatial pattern of nor-
malized area for hexagons at recursion levelsthree and four for the 9-fold partitioning of theFuller-Gray and Snyder projection surfaces Theresults are presented in the four orthographicmap projections of icosahedron faces shown inFigure 13 In each of the three Snyder projectiongrids the normalized areas of hexagonal cells areidentical but the normalized area value of thegrid rapidly approaches 10 as the level of recur-sion increases This is due to the progressivelysmaller contribution of the pentagonal cornercells to the total area of the icosahedron face
At increasing levelsof recursion the Fuller-Gray projection grids show a progressive smooth-ing of normalized area variation as the level ofrecursion increases By the fourth level thesmooth pattern of reduction in normalized areafrom the icosahedron center toward each edgeclosely mirrors the Tissot area distortion isolinesdefining the continuous area distortion surface Asexpected the spatial pattern of continuous Tissotarea distortion and of discrete normalized cell
Cartography and Geographic Information Science
Del
iver
ed b
y P
ublis
hing
Tec
hnol
ogy
to O
rego
n S
tate
Uni
vers
ity IP
128
193
164
203
on
Sat
12
Nov
201
1 22
50
45C
opyr
ight
(c)
Car
togr
aphy
and
Geo
grap
hic
Info
rmat
ion
Soc
iety
All
right
s re
serv
ed
Figure 12 Normalized-area comparison for basic segments of four global grids eachshown on an orthographic map projection to simulate the Earths sphericity
1110
1569
0069
09190813077
Figure 16 displays maps of an icosahedron face onthe Fuller-Gray and Snyder projection surfaces thatdepict variations in centerpoint distance betweenadjacent hexagons for 9-fold hexagonal partitioningat three levels of recursion (similar research on
Centerpoint Distance Map Comparison
and the other cells be-coming progressivelymore square in shape asthe equator ISapproached
bull The Snyder grid centerhexagon has the lowestcompactness (ignoringthe inherently lowercompactness pentagonsegments at each corner)The bowed pairs of hexa-gon edges along eachaxis of higher angulardeformation producelower compactness hexa-gons than those fartheraway from each axiswhere higher ZSC valuesvary only slightly and
bull Except for the lower com-pactness comer pentagoncells ZSCvalues across theFuller-Graygrid are consis-tently higher than the otherthree alternativeswith thehighest value at the icosahe-dron center and a slightsmooth decrease radiallyoutward from the centerAs done with normalized
area the spatial pattern ofZSC for hexagonal grids9-fold partitioned to recur-sion levels three and four wasexamined for the Fuller-Gray
and Snyder map projection surfaces (Figure 15)Both grids show a progressive smoothing of ZSCvalues also seen in the area analysis with increas-ing levels of recursion In both grids the spatialpattern of slightly lower to higher compactnessclosely mirrors the Tissot angular deformationisoline pattern for the map projection becomingspatially indistinguishable by recursion level fourHence Tissot angular deformation can be used topredict the spatial pattern of compactnessvariation
nyder
Equal Angle
1110
09190IIJ3077
FullerGray
Constant Area
Compactness Map Comparison
areas become indistinguishable at higher levels ofrecursIOn
Results from computation of Zone StandardizedCompactness (ZSC) for the four grid alternativesare presented in Figure 14 The portions of theglobe covered and levels of recursion selected forthe area comparisons are used here as well toinsure that the average cell area of each grid issimilar These four ZSCmaps show thatbull Compactness variation is greatest by far for
the equal-angle grid as the basic cell shapesvary from narrow spherical triangles at thepole to spherical squares at the equator
bull There is relatively little variation in compact-ness across the constant-area grid in spite ofthe cell at the pole being triangular in shape
Vol 26 No4 281
Del
iver
ed b
y P
ublis
hing
Tec
hnol
ogy
to O
rego
n S
tate
Uni
vers
ity IP
128
193
164
203
on
Sat
12
Nov
201
1 22
50
45C
opyr
ight
(c)
Car
togr
aphy
and
Geo
grap
hic
Info
rmat
ion
Soc
iety
All
right
s re
serv
ed
Figure 13 Normalized-areacomparison for two recursionlevels of the Fuller-Gray andISEA grids each shown on anorthographic map projection tosimulate the Earthssphericity
9-Fold Recursion Level 31060
fl
nil r ra n der
ld e ur ion Le el 4
FullerGray
1060
O9n J
U71~
Snyder
quadrilateral centerpoint distance for the equal-angle and constant-area grids is underway) Thisexample of our centerpoint distance analysis showshow variations in great-circle distance between adja-cent pairs of hexagon centers can be mapped
The six equilateral triangles fonning each hexa-gon can be thought of as map symbols shaded ac-cording to the distance between the hexagon centerand the centerpoint of adjacent hexagons to thenorth (0deg) northeast (60deg) southeast (120deg) south(180deg) southwest (240deg) and northwest (300deg) as-suming north to be at the top of the page
At the lowest level of recursion (top-rightmap) the general pattern of larger (darker gray)and smaller (lighter gray) distances relative to theaverage (medium gray) centerpoint to centerpointdistance are aligned with the three axes of higherangular deformation for the Snyder projection aswe would expect The shortest distances are alongeach axis and the longest distances are adjacentand roughly perpendicular to each axis Thisspatial pattern of centerpoint distance variation
282
persists and becomes better defined at the nexttwo higher levels of recursion At the highest levelexamined here (bottom-right map) the largerand smaller distances clearly are localized alongeach axis grading toward average values in apropeller-like pattern that corresponds with theTissot angular deformation isolines Indeed theTissot diagram in Figure 7 is an excellent predic-tor of where variations in centerpoint distanceshould occur on the Snyder grid
The spatial pattern of centerpoint distance varia-tion for the hexagonally partitioned Fuller-Grayprojection surfaceis not easilydiscerned at the lowestlevel of recursion (upper-left map) but becomesreadily visible at the next two higher levelsAs withthe Snyder projection Tissot angular deformationisolines predict the spatial pattern of little variationin the center of the icosahedron face with progres-sivelylarger centerpoint distance variations (often inlonger-shorter distance adjacent pairs) as each edgeis approached Overall there appears to be slightlyless centerpoint distancevariation on the Fuller-Gray
Cartography and Geographic Information Science
Del
iver
ed b
y P
ublis
hing
Tec
hnol
ogy
to O
rego
n S
tate
Uni
vers
ity IP
128
193
164
203
on
Sat
12
Nov
201
1 22
50
45C
opyr
ight
(c)
Car
togr
aphy
and
Geo
grap
hic
Info
rmat
ion
Soc
iety
All
right
s re
serv
ed
Figure 14 Compactness comparison for basic segments offour global grids each shown on an orthographic map projec-tion to simulate the Earths sphericity
the icosahedron face always creates 12 penta-gons on the globe exactly 56th the area of eachhexagon the surface area standard deviation forthe Snyder grid will always be slightly greaterthan zero even though there is no area variationamong the hexagons formed However at pro-gressively higher levels of recursion the 12pentagons occupy increasingly less of the totalsurface area and the standard deviation for theentire globe rapidly approaches zero Hencethis graph shows the Snyder grid to be clearlysuperior for hexagonal subcells less than100000 km2 in area
Variation in centerpoint spacing between adja-cent cells for the four grid alternatives can be ana-lyzed by graphing logarithmically the standarddeviation in normalized centerpoint spacingagainst average cell area at increasing levels ofrecursion (Figure 18) This graph shows the gridsto perform similarly except for the poorly per-forming EqualAngleQuadrilateral grid The Fullerand Constant Area Quadrilateral grids converge athigher recursion levels to essentially identical lowstandard deviations closely followed by the Snydergrid
Average subcell compactness values for thefour grids (Figure 19) shows the superior perform-ance of icosahedral models over quadrilateralwhich is to be expected since hexagonal shapes are
bullbull~
nyder
Equal Angle
FuUerGra
Constant Area
9middotFold Recur ion Level 4
FuJlerGra ~ n der
0951
U95
09-10U9IJOll(S
9-FoldRecursion Level 3
FullerGray Snyder
Because variation in cell surface area is amajor concern for geostatisticians andothers we analyzed the variation innormalized cell area with increasinglevels of recursion Figure 17 is a loga-rithmic graph of the standard deviationin normalized-cell area versus the de-creasing average-cell area at increasinglevels of recursion for the four discreteglobal grid alternatives (but only thehexagonal grids formed by Snyder andFuller-Gray projection subtriangles)examined graphically above Recogniz-ing that the hexagonal partitioning of
Figure 15 Compactness comparison for tworecursion levels of the Fuller-Gray and ISEAgrids each shown on an orthographic mapprojection to simulate the Earths sphericity
hexagonal grid but this can only be shownconclusivelyby a statistical comparison ofalternativegrids
Statistical Comparison Results
Vol 26 NO4 283
Del
iver
ed b
y P
ublis
hing
Tec
hnol
ogy
to O
rego
n S
tate
Uni
vers
ity IP
128
193
164
203
on
Sat
12
Nov
201
1 22
50
45C
opyr
ight
(c)
Car
togr
aphy
and
Geo
grap
hic
Info
rmat
ion
Soc
iety
All
right
s re
serv
ed
140km
190km
560 km
1300 kIT
1650 kIT
425 m
SnyderProjection
RecursionLevel 7
RecursionLevel 3
RecursionLevel 5
Fuller-GrayProjection
Figure 16 Variations in hexagonal centerpoint spacing at three levels of recursionfor the Fuller and ISEA Grids on an icosahedron face
In addition to the detailed nu-merical analysis of grid-cellarea compactness and center-point spacing at different levelsof recursion we carried out anoverall comparison of numerous
Summary Rankings
inherently more compact thanrectangular shapes At all levels ofrecursion the Fuller grid is com-prised of hexagons slightly morecompact than correspondingSnyder grid hexagons both beingfar more compact than the corre-sponding constant area and equalangle grid quadrilaterals
Variation in subcell compact-ness seen by graphing the stan-dard deviation of cell compactnessvalues against average cell area(Figure 20) shows the slightlybetter performance of the Fullergrid over the Snyder grid athigher levels of recursion Theconstant-area grid has the lowestoverall standard deviation at itsinitial resolution (level 0) but itsstandard deviation increases rap-idly as the initial cells are parti-tioned in an equal-angle mannerHowever the poor performanceassociated with the equal-anglegrid at all levels of recursion isnever approached
l2 Equal Angle Quadrilateral1 05 Bgt 0- 3GlC RecursionC 01 Level Constant Area QuadrilateralbullIII 1 0 8
3C ~1 2l bull 83 4 5III
1 2 Fuller-Gray ProjectionenIII 01Glbullc(
4i0C 001
~ia 5Ebull0Z 0001
107
106
105 4 3 2
10 10 102Average Cell Area km (log10 scale)
discrete global grid alternatives in-cluding the seven presented in Table1 Eleven of the fourteen Goodchildcriteria were investigated along withtwo related criteria deemed signifi-cant for global grid comparison ForGoodchild criteria 2 4 and 5 a sum-mary ordinal ranking from 1 (verypoor) to 10 (best possible) was devel-oped based on the quantitative analy-sis of comparison metrics
Table 1 provides informationcrucial to the selection of a global
Figure 17 Normalized subcell area standarddeviation vs average cell area for four globalgrids
284 Cartography and Geographic Information Science
Del
iver
ed b
y P
ublis
hing
Tec
hnol
ogy
to O
rego
n S
tate
Uni
vers
ity IP
128
193
164
203
on
Sat
12
Nov
201
1 22
50
45C
opyr
ight
(c)
Car
togr
aphy
and
Geo
grap
hic
Info
rmat
ion
Soc
iety
All
right
s re
serv
ed
Criterion Equal Angle Constant Area Snyder Fuller-Gray Small Circle Dir Sphere Gnomonic
1 Domain is globe yes yes yes yes yes yes yes
2 Equal areal 1 7 10 8 10 6 3
3 Same topology yes no yes yes yes yes yes
4 Equal shape 1 3 7 8 7 9 9
5 Compactnessmiddot 1 4 7 8 8 8 9
6 Straight edges onprojection na2 na yes yes na na yes
7 Perimeter bisection J ni ni ni ni ni nin1
8 Hierarchy yes yes yes4 yes4 yes4 yes4 yes4
9 Single point yes yes yes yes yes yes yes
10 Maximally centered ni ni ni ni ni ni ni
11 Equidistant no no no no no no no
12 Addressing ni ni ni ni oi ni ni13 LatitudelLongitude yes yes yes yes yes yes yes
14 Arbitrary resolution yes yes yes yes yes yes yes
Geodesic edge lines no no no no no yes yes
Spatial nature of area Continuously Part continu- Constant Continuously Constant Fractal-like Continuouslyvariation varying ous part varying varying
irregular
IBest possible = 10 very good = 9 -7 very poor = 1
2 na = not applicable
J ni = not investigated
4 Only the triangular cells not the hexagonal are hierarchical in these grids
Table 1 Evaluation of Goodchilds and related comparison criteria for different global grids
Figure 18 Normalized centerpoint distance standard deviation vs average cellarea for four global grids
ConclusionsThe global grid evaluation crite-ria and associated metrics haveallowed us to compare gridsvarying widely in cell geometryand topology We have observedthat the prime areas of concernamong the small portion of theglobal data user community wehave interacted with to date areequal-area cells and a nested
spherical subdivision the small circle subdivisionmethod and the Fuller-Gray map projection forthe icosahedron If good overall performance is ofparamount concern the triangular andor hex-agonal partitioning of the Fuller-Gray projectionsurface might be selected due to the low variationin compactness of highly compact cells that vary
slightly in area in a continuouslyvarying predictable manner
2 3 4 6
JL------ ~2 1 2 3Constant Area Quadrilateral
Equal Angle Quadrilateral2 38 8
o~RecursionLevel
Snyder Projection ~Fuller-Gray 1
Projection
ampoc i 100gtQG)aiCcEG)1lIo ~ 01isNrn=G)~~S~ III 011-------------------------------
B l 11 1~ 1~ 1~ 1~2Average Cell Area km (log0 scale)
grid based on the relative importance of evalua-tion criteria from the users perspective If cellcompactness is of prime importance for examplea triangular or hexagonal grid based on partition-ing a Gnomonic map projection of an icosahe-dron face (not discussed in this article) would bethe best alternative closely followed by direct
Vol 26 No4 285
Del
iver
ed b
y P
ublis
hing
Tec
hnol
ogy
to O
rego
n S
tate
Uni
vers
ity IP
128
193
164
203
on
Sat
12
Nov
201
1 22
50
45C
opyr
ight
(c)
Car
togr
aphy
and
Geo
grap
hic
Info
rmat
ion
Soc
iety
All
right
s re
serv
ed
Figure 19 Normalized subcell average compactness VS average cell area for fourglobal grids
Figure 20 Normalized subcell compactness standard deviation vs average cellarea for four global grids
(1)
Equal Angle Quadrilateral
2 3 4 5bull 0
2 3 4 5
1 2 3 Constant Area auadrilateral
2Equal Angle Quadrilateral
3 4 5
Zone area = 2x 1tX r2 (10 - sin $)
RecursionLevel
o0-0 ---_e_----lto---
RecursionLevel
APPENDIXZone Standardized Compactness
(ZSC)Derivation
6 5 4 310 10 10 10
Average Cell Area km2 (10910 scale)
------ --_---lt~ 2 3 4
o
where r is the radius of the sphere and ltP is thelatitude of the bounding parallel
The surface area of a spherical zone is computedfrom
will give a full picture of the strengths and weak-nesses of current global grid alternatives
o
Constant AreaQuadrilateral
_~~ iFuller-Gray 1 2 Projection 3 4 5
o
Fuller-GrayProjection 1
Snyder Projection 1gt-------------------
05
00011------7---- ----------4 -----r--~2
10 10 10 10 10 102Average Cell Area km (10910scale)
CIl()CI)5 01 =() r~2Emlt3 ~- C 01=Gl 0 =0CO
111iii iii 001 =Ebulloz
IIIIII
CII CIImS 09tll ()bullbull tllClIogt Elt0o
08
hierarchy among cells (criteria 2and 8) Both the quadrilateralgrids and triangular forms ofpolyhedral grids examined herecan be partitioned recursivelyallowing a nested hierarchy tobe created Equal-area cells isthe critical criterion since cur-rently employed equal-angleand constant-area quadrilateralgrids can never be equal areaand were shown to performpoorly in this respect relative toseveral alternative grids
Only two global grids thosebased on the triangular partition-ing of the Icosahedral SnyderEqual Area (ISFA)projection andpartitioning using the Small Cir-cle Subdivision method (not dis-cussed in this article but describedin Song 1997)will produce equal-area cells on the spheroid TheSmall Circle Subdivision methodhas the advantage of producingcells slightly more compact butthe ISFA grid is currently moreefficient to compute and easier toimplement Consequently werecommend the ISFA as the bestcurrent choice for an equal areaglobal grid Whichever global gridis selected there are implementa-tion issues that must be addressedin future research includingbull Implementing an efficient
addressing scheme for bin-ning data into grid cells
bull Creating algorithms for fasttranslation of gridded data to and from geo-detic latitude and longitude
bull Developing efficient algorithms for aggrega-tion and disaggregation among nested gridlevels and
bull Implementing efficient data storage andaccess schemes for data in nested cells includ-ing metadata storage and accessWe have begun to address several of these im-
plementation facets for the ISFA grid beginningwith an ETOP05 DEM dataset binning experimentconducted at several levels of recursion (seehttpbufogeoorstedufirmatdgg for binning ex-amples) Performing similar implementation experi-ments on additional datasets using other candidategrids would provide a complementary grid compari-son that together with our geometrical comparisons
286 Cartography and Geographic Information Science
Del
iver
ed b
y P
ublis
hing
Tec
hnol
ogy
to O
rego
n S
tate
Uni
vers
ity IP
128
193
164
203
on
Sat
12
Nov
201
1 22
50
45C
opyr
ight
(c)
Car
togr
aphy
and
Geo
grap
hic
Info
rmat
ion
Soc
iety
All
right
s re
serv
ed
REFERENCES
ACKNOWLEDGMENTS
so that
EidenshinkJC andJL Faundeen 1994 The 1 km AVHRRglobal land data set First stages of implementation Inierna-tionaljournal of Remote Sensing 153443-62
Fekete G and L Treinish 1990 Sphere quadtree A newdata structure to support the visualization of sphericallydistributed data SPIE Extracting rManing from complex dataProcessing display interaction Vol 1259 pp 242-53
Fuller RB 1982 SynergeticJ NewYork MacMillanGiacaglia GEO and CA Lundquist 1972 Sampling func-
tions for geophysics Smithsonian A5trvphysical Observatory Spe-cial Report No 344 93 pp
Goodchild MF 1994 Geographical grid models for environ-mental monitoring and analysis across the globe (panelsession) In proceddings of GISUS 94 Conference PhoenixArizona
Gray RW 1994 Exact transformation equations for Fullersworld map Cartography and Geographic Informatian Systems21(4) 243-46
Hastings DA 1996 The global land l-km base elevationdigital elevation model A progress report Global ChangeNewsletter 27 11-12
Heikes R and DA Randall 1995 Numerical integration ofthe shallow-water equations on a twisted icosahedral gridPart I Basic design and results of tests Monthly WeatherReview 123 1862-80
Kahn R 1995 What shall we do with the data we are expect-ing in 1998 In Proceedings of the Massive Data SelJ WorkshopCommittee on Applied and Theoretical Statistics NationalAcademy of Sciences Washington DC
Kimerling AJ 1984 Area computation from geodetic coordi-nates on the spheroid Surveying and Mapping 44(4) 343-51
Kimerling AJ D White K Sahr and L Song 1995 Devel-opment of global sampling grid Mid-project report Samplingdesign and statistics research for EMAP Program us Environ-mental Protection Agency Corvallis Oregon
Loveland TR JW Merchant D O Ohlen and JF Brown1991 Development of a land-cover characteristics databasefor the conterminous US Photogrammetric Engineering andRemote Sensing 57(11) 1453-63
Lukatela H 1987 Hipparchus geopositioning model Anoverview In Proceedings of Auto Carto 8 Symposium Balti-more Maryland pp 87-96
Maling DH 1992 Coordinate systems and map projectioru (2nded) Oxford UK Pergamon Press
Muehrcke PC and JO Muehrcke 1997 Map we (4th ed) Madi-sonWisconsinJP Publications
Olea RO 1984 Sanlpling design optimization for spatial functionsMathematical Geowgy 16369-92
Saff EB and ABJ Kuijlaars 1997 Distnbuting many points on asphere The Mathematical Intelligencer 19(1)5-11
Slade G 1994 Self avoiding walks The MaJhematical Intelligencer16(1)29-35
Snyder JP 1987 Map projectioru-A working manual Wash-ington DC US Government Printing Office
Snyder JP 1992 An equal-area map projection for polyhe-dral globes Cartographica 29(1) 10-21
Song L 1997 Small circle subdivision method for develop-ment of global sampling grid Unpublished Masters thesisOregon State University 176 pp
Stauffer D 1992 Introduction to percolation theory (2nd ed)London UK Taylor amp Francis
Tobler WR and Z Chen 1986 A quadtree for global infor-mation storage GeographicalAnalysis 18(4) 360-71
White D A J Kimerling and WS Overton 1992 Carto-graphic and geometric components of a global samplingdesign for environmental monitoring Cartography and Geo-graphic Information Systems 195-22
White D AJ Kin1erlingK Sahr and L Song 1998 Comparingarea and shape distortion on polyhedral-based recursive partitionsof the sphere International Journal of Geographiad Information Science12 805-27
Wolfram S 1986 Cellular automaton fluids 1 Basic theoryjournal of Statistical Physics 45471-526 bull
(5)Zone perimeter = 2XTCXr(co~)
ZSG = SQ1middott(4XTCxcellarea - cellarea2lr2) I cellperimeter (6)
Zone Standardized Compactness (ZSC) isgiven by Zone perimeterCell perimeter Substi-tuting and combining equations we compute ZSCfrom
Baumgardner JR and PO Frederickson 1985 Icosahedraldiscretization of the two-sphere SIAM journal of NUrMricalAnalysis 22(6) 1107-15
Bomford G 1971 Geodesy Oxford The Clarendon Press731 pp
Brooks DR 1981 Grid systems for Earth radiation budgetexperiment applications NASA Technical Memorandum8323340 pp
Coexeter HSM 1962 The problem of packing a number ofequal nonoverlapping circles on a sphere Transactions NewYork Academy of Science Division of Mathematics Series IIvol 24 320-31
Dutton G 1988 Geodesic modeling of planetary relief Car-tographica 21 188-207
Dutton G 1994 Geographical grid models for environmentalmonitoring and analysis across the globe (panel session) InProceedings of GISUS 94 Conference Phoenix Arizona
cos$ =sqrt( IO-(IO-cellareal(2xTCX r2)) (4)
The perimeter of the spherical zone is thecircumference of the bounding parallel computedfrom
Gelarea = 2XTCxr2(lO-sin$) (2)
This research was supported by US Environ-mental Protection Agency-Oregon State Univer-sity Cooperative Agreement CR 821672 MatthewGregory Department of Geosciences graduatestudent created the centerpoint distance mapsseen in Figure 16 Dr Ralph Kahn NASA-JPLalso contributed significantly to this manuscriptThis manuscript has been subjected to EPA reviewand approved for publication The conclusionsand opinions are solely those of the authors andnot necessarily the viewsof the Agency
and
Setting the zone surface area equal to the cellarea we obtain
Vol 26 NO4 287
Del
iver
ed b
y P
ublis
hing
Tec
hnol
ogy
to O
rego
n S
tate
Uni
vers
ity IP
128
193
164
203
on
Sat
12
Nov
201
1 22
50
45C
opyr
ight
(c)
Car
togr
aphy
and
Geo
grap
hic
Info
rmat
ion
Soc
iety
All
right
s re
serv
ed
Remote Sensing for theEarth Sciences (3rd ed)Andrew Rencz
Recently adopted titlesin cartography GISremote sensingandGPS
Policy Issues in Modern art graph)DR Frazer Taylor (cd)
Wilderness NavigationBob and Mike Bums
I bullbull
ACS
Maps with the NewsMark Monmonier
Air Apparent HowMeteorologists Learnedto Map Predict andDramatize WeatherMark Monmonier
froooks
Mapping a Northern LandThe Survey of CanadaGerald McGrath and LouisSebert (eds)
Thematic Cartographyand VisualizationTerry A Slocum
1 it 11 bull
on Oirle ~y a30149j- ~24)
288 Cartography and Geographic Information Science
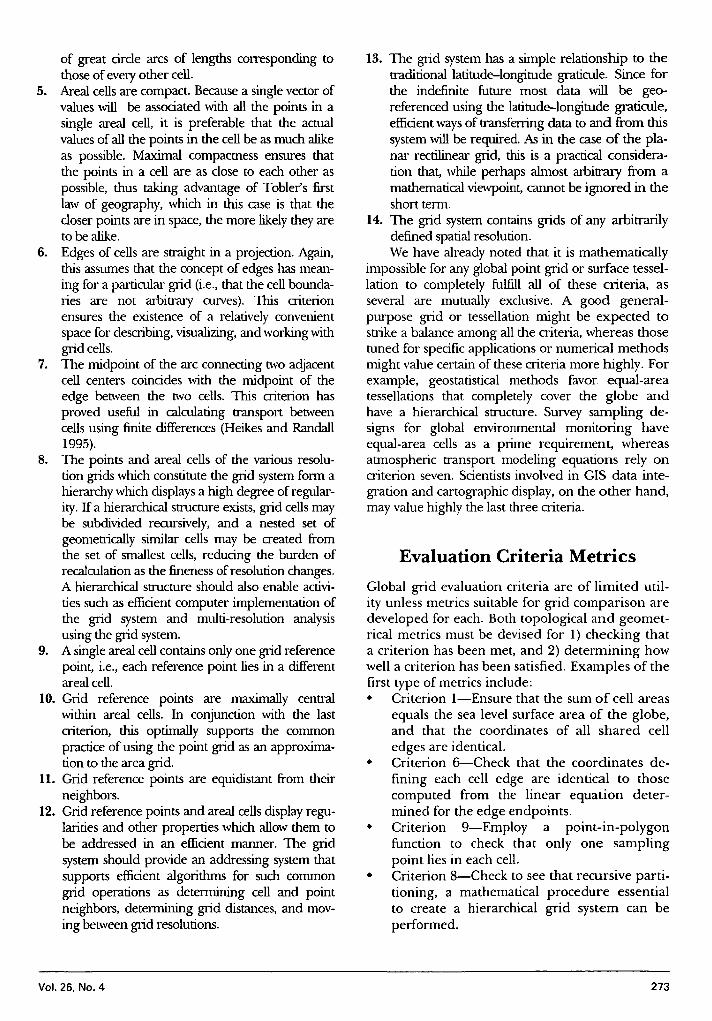
Del
iver
ed b
y P
ublis
hing
Tec
hnol
ogy
to O
rego
n S
tate
Uni
vers
ity IP
128
193
164
203
on
Sat
12
Nov
201
1 22
50
45C
opyr
ight
(c)
Car
togr
aphy
and
Geo
grap
hic
Info
rmat
ion
Soc
iety
All
right
s re
serv
ed
Level 3
Level 2
2 x sqrt(1t x cell area)cell perimeter =
= 3545 x sqrt (cell area2r)cell perimeter (I)
cells with great circle edges (such as spheroi-dal triangles or hexagons) or of more geomet-rically complex cells requires the orientedtriangle summation approach found inKimerling (1984) These actual areas werenormalized through dividing by the averagearea for all cells in the tessellation so that allcells in a perfectly equal area global gridwould have normalized cell areas of 10Criterion 5-Planar compactness is often meas-ured by the surface-area-to-perimeter ratio(Muehrcke and Muehrcke 1997) Standardizingthis ratio to 10for a planar circleof the sameareaas the cell givesa compactnessindex applicabletoall discrete global grids This index is computedfrom the equation
(c) 9-fold Triangle Partitions
(a) 4-fold Trtangle Partitions
(d) 9-fokl Hexagon Partitions
(b) 4-fold Hexagon Partitions
bull
Level 1
Figure 2 Four- and 9-fold triangular and hexagonal partitioning of an icosahedronface at the first three levels of recursion
The tenninology of recur-sive partitioning is best under-stood from an illustration suchas Figure 2 Two types of parti-tioning called 4-fold and 9-foldare shown in the top and bottomtriangular cells This involveschecking that each full triangle(recursion level 0) can be parti-tioned into either 4 or 9 triangu-lar cells (recursion level 1) If this4- or 9-fold partitioning can becontinued to produce subtrian-gles at all higher levels of recur-sion a hierarchical triangulargrid system is achievable
Recursive partitioning facili-tates the inverse operation ofsubcell aggregation into largercells of the same or a differentgeometrical form For examplethe left half of Figure 2 illus-trates that sets of 4 9 16 25neighboring subtriangles can beassembled into progressivelycoarser spatial resolution trian-gular global grids The right halfof this figure showsthat sets of 624 96 neighboring subtrian-gles can be assembled into pro-gressively larger hexagonal cellsNotice that with 9-fold partition-ing the hexagonal cells are ori-ented identically an advantagewhen assembling global data setsat varying spatial resolutions Asimilar illustration could becreated for recursive partitioning of spherically rec-tangular quadrilaterals with the desirable rotationalinvariance present for any n-fold partitioning
We have focused on geometrical comparisonof metrics for surface area compactness andpoint spacing on both the sphere and a spheroidsuch as the GRS80 or WGS84 We were aware thatmeasures on the sphere and spheroid would givenearly identical numerical results but using sphe-roidal area metrics was essential to our demon-stration that certain grids are truly equal area onthe Earths surface All of these measures involvedetermination of geodesic distances using stan-dard ellipsoidal distance equations (Bomford1971) Examples of comparison metrics includebull Criterion 2- The spheroidal surface area of
quadrilateral cells can be computed usingstandard equations found in Maling (1992)Computing the spheroidal surface area of
274 Cartography and Geographic Information Science
Del
iver
ed b
y P
ublis
hing
Tec
hnol
ogy
to O
rego
n S
tate
Uni
vers
ity IP
128
193
164
203
on
Sat
12
Nov
201
1 22
50
45C
opyr
ight
(c)
Car
togr
aphy
and
Geo
grap
hic
Info
rmat
ion
Soc
iety
All
right
s re
serv
ed
Figure 3 Spherical zone used in Zone Standardized Com-pactness (ZSC) calculation for an icosahedron face
However we are dealing with cells on theglobeTaking the Earths sphericity into account abetter index is one that uses a pole-centered spheri-cal zone of the same area as the grid cell (Figure 3)for the ideal (10 ) compactness What we term ZoneStandardized Compactness (ZSC)is computed from
ZSC = sqrt( 4x Tt x cell area - cell area 2 r2)cell peTimeter (2)
The derivation of ZSC is given in the Appen-dix We have extended this idea to the spheroidby determining the spheroidal area to parallelperimeter ratio normalized to a spheroidal cap ofthe same surface area as the cell (Kimerling et al1995)bull Criterion 11-Grid point spacing can be meas-
ured assuming that we can determine the latitudeand longitude of points within adjacent cellsAssuming the globe to be spherical we employthe standard great circle distance equation foreach pair of adjacent coordinates
distance = r arccos (sin(lat I) sin (lat2) + cos (lat J)cos (lat2) cos (lion I -lon2 I) (3)
bull Criterion 10-Detennining grid point centralitywithin a cell can be approached as a center ofgra~ty problem Here we can use off-the-shelfalgorithms for center-of-gra~tycomputation fromlists of edge coordinates and then compare thegrid point location to the center of gra~ty todetermine the distance and direction of dC~ation
Vol 26 No4
Each of the above comparison metrics are com-puted for a single cell or grid point and can be ana-lyzed statisticallywhen computations are extended tothe entire globe (realizing that the entire populationof cells is the sample) The mean standard deviationand the range of cell metrics have been found to beuseful comparison statistics for alternative globalgrids (Whiteet al 1998)
Global Grid AlternativesNumerous surface tessellations have been proposedas global grids but the possibilitiescan be organizedinto a limited number of general categories Inspiredby Duttons (1994) general tessellation taxonomy wedeveloped a more specific hierarchical classificationscheme for global grids (Figure 4) and then selectedgrids from different classes for comparison At thebroadest level our scheme divides grids into thosebased on directly tessellating the sphere or spheroidand those that transform all or a portion of the globeto a map projection surfacewhich is tessellated in aregular manner with cell edges ancVor grid pointsthen back-projected to the sphere or spheroid
At the second level in our classification hierar-chy direct surface tessellations can be based onbull Subdividing quadrilateral cells recursivelybull Subdividing the faces of a spherical Platonic
polyhedron recursively orbull Creating a Voronoi tessellation comprised of
spherical or spheroidal Thiessen polygonsDirectly tessellated quadrilateral grids can be
further divided into what the global modeling com-munity calls equal-angle and constant-area grids(Kahn 1995) Tessellations of the globe into quadri-lateral cells of equal latitudinal and longitudinalextent are termed equal angle Examples aboundincluding the 5 x 5 poundTOP05 global DEM and theERBE 2S x 25deg 5degx 5degand 10degx 10deggrids (Brooks1981) Constant-area tessellations begin with anarbitrarily sized quadrilateral cell at the equator andthen define the parallel and meridian cell bounda-ries across the globe so as to achieve approximatelyequal-area cells This is done either by keeping thelatitude increment constant and adjusting the longi-tude increment as the pole is approached or viceversa (Brooks 1981)
Directly tessellated polyhedral grids can alsobe divided into two categories based on whetherthe partitioning of polyhedral faces is performedwith the edges of a great or a small circle Feketeand Treinishs (1990) spherical quadtree datastructure which is based on recursive subdivisionof spherical triangles obtained by projecting thefaces of an icosahedron onto a sphere is a good
275
Del
iver
ed b
y P
ublis
hing
Tec
hnol
ogy
to O
rego
n S
tate
Uni
vers
ity IP
128
193
164
203
on
Sat
12
Nov
201
1 22
50
45C
opyr
ight
(c)
Car
togr
aphy
and
Geo
grap
hic
Info
rmat
ion
Soc
iety
All
right
s re
serv
ed
Map Projection Surface Tessellations
Single PrOj~ ~tion Surface-- ---- -- --Equal Area Non-Equal Area Equal Area Non-Equal Area
Gnomonic
ex Fuller (1982)Icosahedral
ex Snyder (1992)Polyhedral EqualArea Projections
ex lukatela (1987)ex Fekete and ex Song (1997) Hipparchus Geo-
Treinish (1990) positioning ModelSpherical Quadtree Dutton (1988) QTM
Constant-Area Quadrilateral TessellationOur example is the Nimbus Earth Radiation Budget(ERB) Experiment grid with initial 4S x 4S quad-rilateral cells at the equator (Figure 6) The longitu-dinal increment increases in 12 discrete steps to 120degnear each pole Recursive partitioning into approxi-mately constant-area subcells is more problematic as2-frequency equal-angle partitioning is commonly
Global Grid Comparison Examples
Equal-Angle Quadrilateral TessellationOur example will be an initial partitioning of theglobe into thirty-two45deg x 45deg cells at recursion level0 and subsequent 9-fold recursive partitioning tolevel fiveHence grids with 45deg x 45deg 15degx 15deg5degx5deg 1 23degx 1 23deg 59degx 59deg and 527degx 527degedgeswill be analyzed Recursion level two illustrated inFigure 5 corresponds to the 5degx 5degERBEgrid
Our overall comparison of the above categories ofglobal grids based on the Goodchild criteria ispresented in Table 1 and will be discussed as part ofour recommendations We have also selected fourexamples from different categories in our taxonomyto illustrate our more detailed comparison of surfacearea compactness and centerpoint spacing varia-tion These examples described belowwere selectedto show the fundamental geometrical differencesbetween quadrilateral and polyhedral grids as wellas to contrast commonly used standard quadrilat-eral grids with polyhedral alternatives
ex Nimbus ERS
Direct SphericaVSpheroidal Tessellations----- I _Quadrilateral Polyhedral Voronoi---- ---- --Equal Angle Constant Area Great Circle Small Circle
Edges Edges
ex ETOP05ERSE 25 deg
ex Tobler and Chen ex Square Projection(1986) lambert Cylin- (same as equal angle
drical Equal Area tessellation)
loveland et al (1991)Global land
Characterization
example of great-circleedge partitioningSongs (1997) small-circle subdivision systemcreates equal-areaspherical triangles withmore mathematicallycomplex small circleedges Duttons (1988)QTM projection gridfor octahedron faces isan interesting combina-tion of great- and small-circle subdivision
Lukatelas (1987)Hipparchus Geoposition-ing Model is an excellentexample of a spheroidalVoronoi tessellationHere the outwardly sim-ple problem is comput- Figure 4 Globalgrid taxonomying a set of regularlyspaced grid points fromwhich spherical or sphe-roidal Thiessen polygons can be constructed But asGiacaglia and Lundquist (1972) note The problemof distributing in the most regular way a given num-ber of points on a sphere has been studied for centu-ries and in general is still unsolved Methods suchas finding the greatest number of small circles of agiven radius that can be placed on a spherical surfacewithout overlapping (Coxeter 1962) have been su-perseded by sampling function approaches for thesphere that begin with the edges of a spherical poly-hedron (Giacaglia and Lundquist 1972) Perfectregularity however remains an inherently unachiev-able ideal
Map projection based global tessellationscurrently can be placed in one of two categoriessingle and multiple projection surfaces Singleprojections of the globe typically cylindrical havebeen used to construct quadrilateral grids It isuseful due to the importance of satisfying crite-rion two to further divide projection surfaces intoequal area (eg Tobler and Chens (1986) Lam-bert cylindrical equal-area grid) and non-equalarea (the ETOPO 5 grid for example can bethought of as a square projection partitioned intocells 5 x 5 in length on the projection surface)categories Multiple projection surfaces are typi-cally faces of Platonic polyhedra We can alsoplace these into equal area (eg Snyder (1992)polyhedral equal area projections for the fivePlatonic polyhedra) and non-equal area (egFuller (1982) and Baumgardner and Frederickson(1985raquo projection of icosahedron faces
276 Cartography and Geographic Information Science
Del
iver
ed b
y P
ublis
hing
Tec
hnol
ogy
to O
rego
n S
tate
Uni
vers
ity IP
128
193
164
203
on
Sat
12
Nov
201
1 22
50
45C
opyr
ight
(c)
Car
togr
aphy
and
Geo
grap
hic
Info
rmat
ion
Soc
iety
All
right
s re
serv
ed
Equal Angle GridFigure 5 Equal-angle quadrilat-eral grid for a 45deglongitude by 90deglatitude sectionof the globe
Constant Area GridFigure 6 Con-stant area quad-rilateral grid for a45deg longitude by90deg latitude sec-tion of the globe
SNYDER MAP PROJECTION
Figure 7 Icosahedral Snyder Equal Area (ISEA) projection of an icosahedron face (a) Tissotangular deformation isolines (b)
equivalence throughout (Figure 7) The projection ismade equal area by adjusting the scale outward fromthe center of each edge This results in increasedshape distortion as each of the three axes from thetriangle center to comer vertices is approached Amap of angular deformation across an icosahedronface (which is the result of our Tissot distortionanalysis based on the Gaussian basic quantity ap-proach outlined in Maling (1992raquo shows this patternof distortion
The equilateral triangular projection of eachicosahedron face is subdivided recursively into equi-lateral subtriangles in either the 4-fold or the 9-foldmanner illustrated in Figure 2 The bowing of trian-gle edges along the three axes of angular deforma-tion is apparent in Figure 8 where 4-fold subdivision
subtriangles of recur-sion level four are backprojected to the globeThis edge bowing is aprimary cause of varia-tions in compactnessamong subtriangles
We noted earlierthat triangular gridsallow hexagonalgrids to be createdthrough subtriangleaggregation and thathexagonal grids haveseveral advantagesrelated to global dataanalysis The ISEAtriangular grid inher-ently allows equal-area hexagons to beassembled at varying
Tissot Angular DeformationIcosahedron Face
employed for simplicity Breaking from tradition weemploy 3-frequency equal-angle partitioning tomaintain consistency in our comparisons while usingthe same basic partitioning method The initial 4Slatitude x variable longitude cells correspond ap-proximately to recursion level two in our equal-angletessellation with partitioning carried to recursionlevel 5 (IS OS 16deg latitude by variable longitudecell edges)
Equal-Area Map Projection Surface TessellationOur example is the Icosahedral Snyder Equal- Area(ISEA) projection (Snyder 1992) which transformseach icosahedron face on the globe into an equilat-eral planar triangle while maintaining area
Vol 26 No4 277
Del
iver
ed b
y P
ublis
hing
Tec
hnol
ogy
to O
rego
n S
tate
Uni
vers
ity IP
128
193
164
203
on
Sat
12
Nov
201
1 22
50
45C
opyr
ight
(c)
Car
togr
aphy
and
Geo
grap
hic
Info
rmat
ion
Soc
iety
All
right
s re
serv
ed
PARTITIONING COMPARISONFigure 8 Icosahedron faces that are4-fold partitioned to recursion levelfour on the ISEA and Fuller-Grayprojection surfaces then re-projected on an orthographic mapprojection to simulate the Earthssphericity
Snyder Projection
4 bull FOld SubdiVISionRecursion Level 4
Fuller-Gray Projection
Figure 9 Aggregation of 54 and 6 neighboring triangles on the ISEA pro-jection into equal area hexagonal cells forming 9-fold higher resolutiongrids
levels of spatial resolution For example aggre-gating sets of 54 neighboring triangles producesthe equal-area hexagonal grid for the icosahedronface shown in Figure 9a Again apparent is thebowing of hexagon edges along the three axes ofhigher angular deformation which should intro-duce larger compactness variations
Aggregating the same subtriangles into sets ofsix neighbors (Figure 9b) creates a nine timeshigher resolution hexagonal grid with edge bow-ing more localized along the three axes Becausenine of the small hexagons (seven fulland one-third of six adjacent) form thelarge hexagon the small hexagons area 9-fold subdivision of the large hexa-gons at the next higher level of recur-sion Further 9-fold partitioning of theunderlying subtriangles allows assem-bly into 9-fold smaller hexagons athigher levels of recursion
Non-Equal Area Map Projection SurfaceTessellationWe will use the Fuller-Gray projectionwhich is based on the geometrical ideabehind R Buckminster Fullers icosahe-dral world map projection (Fuller 1982)Fuller imagined the three edges of eachicosahedron face as flexible bands curvedto lie on the spherical surface (left half ofFigure 10) Each edge would be subdi-vided and holes drilled at n equallyspaced increments and flexible bandswould be strung between correspondingholes on adjacent edges This wouldcreate a triangular network of lines onthe sphere which could be flattened tocreate a regular grid of equilateral subtri-angles (right half of Figure 10)
278
Fuller imagined the verticesof each subtrianglebeing the projection of the corresponding line inter-section point on the sphere These intersectionpoints were later found physically impossible toachieve because each triplet of intersecting lines onthe globe forms a small triangle in the plane whosecenterpoint is the best approximation of Fullersidea Gray (1994) developed exact transformationequations for this approximation producing a com-promise projection having both small area andshape distortion
(a)
(b)
Cartography and Geographic Information Science
Del
iver
ed b
y P
ublis
hing
Tec
hnol
ogy
to O
rego
n S
tate
Uni
vers
ity IP
128
193
164
203
on
Sat
12
Nov
201
1 22
50
45C
opyr
ight
(c)
Car
togr
aphy
and
Geo
grap
hic
Info
rmat
ion
Soc
iety
All
right
s re
serv
ed
Figure 10 Fullers geometrical concept of an icosahedral map projection surface (Source Fuller1982)
The equilateral-triangle Fuller-Gray projec-tion of an icosahedron face is shown in Figure 11along with area-scale and angular-deformationmaps displaying results of our Tissot distortionanalysis Note the smooth increase in area-scaleand angular deformation from the triangle centerto each edge vertex Both recursive partitioningand triangle aggregation is performed identicallyto the Snyder projection The only differenceshould be the creation of non-equal area triangu-lar and hexagonal cells that vary less in compact-ness on average and that grade smoothly fromslightly higher to lower compactness (Figure 8)
Analyses and ResultsThe ideal comparison of global grid geometricalproperties would consist of computing surface areacompactness and other metrics at each level of re-cursion down to the spatial resolution correspondingto the smallest grid cell expected to be used in globalanalysis If the smallestcellwere 1 km2 for examplethe 9-fold partitioning of an icosahedron face mustbe carried out to recursion level eight meaning thatarea compactness centerpoint distance and othermetries must be computed for over 500 million cellsNaturally an infinite number of triangular hexago-nal or quadrilateral recursion levels and cells arepossible as recursive partitioning can continueindefinitely
We have found 9-fold partitioning to recursionlevels less than six to be suitable for comparisonpurposes because surface area compactness center-point spacing and other metries are still computableat the rapidly increasing cell densities However thecomputation effort quickly becomes immense athigher levels of recursion and the results may notadd significantlyto our understanding of the surface
Vol 26 No4
tessellation or gridpoint geomeoy
The normalizedarea zone standard-ized compactness andcenterpoint distanceanalyses that followare a representativesample of our fullresearch effort Thefour grid alternativesexamined were se-lected from the lOwestudied but resultsfrom only two of thefive recursion levelsweexamined are pre-sented here to illus-
trate the essential geometrical properties of the fullrange of quadrilateral and polyhedral grid alterna-tivesWe have limited the polyhedral analysis to thehexagonal tessellation because area and shape dis-tortion characteristics of triangular partitioning arepresented in a companion article (White et al 1998)
Normalized Area Map Comparison
bull Spheroidal areas were computed from sets ofclosely spaced geodetic latitude and longitudecoordinates along each cell edge (usually 11points along an edge) For the two quadrilat-eral tessellations the bounding parallels wereon the WGS 84 spheroid However for theFuller-Gray and Snyder projections onlyspherical equations were available so a morecomplex spheroidal transformation proce-dure had to be used This involved Projectingfrom the authalic sphere for the WGS 84ellipsoid to the plane using forward projec-tion equations
bull Partitioning on the planar projection surfacebull Back projecting cell edges and centerpoints to
spherical coordinates using the inversespherical equations for each projection and
bull Converting authalic to WGS 84 geodetic lati-tude using the transformation equationsfound in Snyder (1987) This allows the ori-ented spheroidal triangle summation method(Kimerling 1984) to be applied to the four(and other) global grid alternativesMaps comparing variations in normalized
surface area for the four discrete global grid ex-amples described above are presented in Figure12 The equal-angle and constant-area grids cover45deg of longitude by 90deg of latitude (equator to
279
Del
iver
ed b
y P
ublis
hing
Tec
hnol
ogy
to O
rego
n S
tate
Uni
vers
ity IP
128
193
164
203
on
Sat
12
Nov
201
1 22
50
45C
opyr
ight
(c)
Car
togr
aphy
and
Geo
grap
hic
Info
rmat
ion
Soc
iety
All
right
s re
serv
ed
Fuller-Grey map projection
Icosahedron Face Area Distortion Angular Deformation
Tissot distortion analysis
Figure 11 Fuller-Gray map projection and Tissot distortion analysis for an icosahedron face
pole) or 1I16th of the globe Each icosahedronface of course covers 120th of the globe so thatthe surface areas of comparison surfaces are ap-proximately the same The level of recursion foreach grid was selected so that the average cell areawithin each grid is nearly the same From thesemaps in Figure 12 it is apparent thatbull The larger range in normalized area (0069 -
1569 or 150 percent) associated with theequal-angle grid makes it as expected by farthe worst alternative of the four
bull The constant-area grid has a greater range ofnormalized area than either the Snyder orFuller-Gray grids The pattern of spatialvariation is one of identical normalized areawithin east-west bands Cell areas also de-crease slowly from south to north within thethree blocks in the bottom half of the maphaving identical meridians as cell boundariesSuch regularity is not present in the rows ofcells forming the top half of the map
bull Normalized hexagon areas on the Fuller-Grayprojection decrease smoothly from a value of106 (6 percent above average) at the icosahe-dron face center to a lower value of 0944near each corner The very low normalizedarea for the triangle at each corner is causedby this being one of five spherical triangles onadjacent icosahedron faces that together formone of 12 pentagonal cells on the globe Eachpentagon area is 56th that of the averagehexagonal cell which gives the lower normal-ized area
280
bull Normalized hexagon areas on the Snyderprojection are identical and just slightly largerthan 10 so as to offset the three smaller areasof corner pentagonal cells If the pentagonareas are removed from the calculations allhexagons are measured as having a 10 nor-malized surface area a numerical demonstra-tion that the Snyder equations for theicosahedron do indeed produce an equal areamap projection surfaceWe next examine the spatial pattern of nor-
malized area for hexagons at recursion levelsthree and four for the 9-fold partitioning of theFuller-Gray and Snyder projection surfaces Theresults are presented in the four orthographicmap projections of icosahedron faces shown inFigure 13 In each of the three Snyder projectiongrids the normalized areas of hexagonal cells areidentical but the normalized area value of thegrid rapidly approaches 10 as the level of recur-sion increases This is due to the progressivelysmaller contribution of the pentagonal cornercells to the total area of the icosahedron face
At increasing levelsof recursion the Fuller-Gray projection grids show a progressive smooth-ing of normalized area variation as the level ofrecursion increases By the fourth level thesmooth pattern of reduction in normalized areafrom the icosahedron center toward each edgeclosely mirrors the Tissot area distortion isolinesdefining the continuous area distortion surface Asexpected the spatial pattern of continuous Tissotarea distortion and of discrete normalized cell
Cartography and Geographic Information Science
Del
iver
ed b
y P
ublis
hing
Tec
hnol
ogy
to O
rego
n S
tate
Uni
vers
ity IP
128
193
164
203
on
Sat
12
Nov
201
1 22
50
45C
opyr
ight
(c)
Car
togr
aphy
and
Geo
grap
hic
Info
rmat
ion
Soc
iety
All
right
s re
serv
ed
Figure 12 Normalized-area comparison for basic segments of four global grids eachshown on an orthographic map projection to simulate the Earths sphericity
1110
1569
0069
09190813077
Figure 16 displays maps of an icosahedron face onthe Fuller-Gray and Snyder projection surfaces thatdepict variations in centerpoint distance betweenadjacent hexagons for 9-fold hexagonal partitioningat three levels of recursion (similar research on
Centerpoint Distance Map Comparison
and the other cells be-coming progressivelymore square in shape asthe equator ISapproached
bull The Snyder grid centerhexagon has the lowestcompactness (ignoringthe inherently lowercompactness pentagonsegments at each corner)The bowed pairs of hexa-gon edges along eachaxis of higher angulardeformation producelower compactness hexa-gons than those fartheraway from each axiswhere higher ZSC valuesvary only slightly and
bull Except for the lower com-pactness comer pentagoncells ZSCvalues across theFuller-Graygrid are consis-tently higher than the otherthree alternativeswith thehighest value at the icosahe-dron center and a slightsmooth decrease radiallyoutward from the centerAs done with normalized
area the spatial pattern ofZSC for hexagonal grids9-fold partitioned to recur-sion levels three and four wasexamined for the Fuller-Gray
and Snyder map projection surfaces (Figure 15)Both grids show a progressive smoothing of ZSCvalues also seen in the area analysis with increas-ing levels of recursion In both grids the spatialpattern of slightly lower to higher compactnessclosely mirrors the Tissot angular deformationisoline pattern for the map projection becomingspatially indistinguishable by recursion level fourHence Tissot angular deformation can be used topredict the spatial pattern of compactnessvariation
nyder
Equal Angle
1110
09190IIJ3077
FullerGray
Constant Area
Compactness Map Comparison
areas become indistinguishable at higher levels ofrecursIOn
Results from computation of Zone StandardizedCompactness (ZSC) for the four grid alternativesare presented in Figure 14 The portions of theglobe covered and levels of recursion selected forthe area comparisons are used here as well toinsure that the average cell area of each grid issimilar These four ZSCmaps show thatbull Compactness variation is greatest by far for
the equal-angle grid as the basic cell shapesvary from narrow spherical triangles at thepole to spherical squares at the equator
bull There is relatively little variation in compact-ness across the constant-area grid in spite ofthe cell at the pole being triangular in shape
Vol 26 No4 281
Del
iver
ed b
y P
ublis
hing
Tec
hnol
ogy
to O
rego
n S
tate
Uni
vers
ity IP
128
193
164
203
on
Sat
12
Nov
201
1 22
50
45C
opyr
ight
(c)
Car
togr
aphy
and
Geo
grap
hic
Info
rmat
ion
Soc
iety
All
right
s re
serv
ed
Figure 13 Normalized-areacomparison for two recursionlevels of the Fuller-Gray andISEA grids each shown on anorthographic map projection tosimulate the Earthssphericity
9-Fold Recursion Level 31060
fl
nil r ra n der
ld e ur ion Le el 4
FullerGray
1060
O9n J
U71~
Snyder
quadrilateral centerpoint distance for the equal-angle and constant-area grids is underway) Thisexample of our centerpoint distance analysis showshow variations in great-circle distance between adja-cent pairs of hexagon centers can be mapped
The six equilateral triangles fonning each hexa-gon can be thought of as map symbols shaded ac-cording to the distance between the hexagon centerand the centerpoint of adjacent hexagons to thenorth (0deg) northeast (60deg) southeast (120deg) south(180deg) southwest (240deg) and northwest (300deg) as-suming north to be at the top of the page
At the lowest level of recursion (top-rightmap) the general pattern of larger (darker gray)and smaller (lighter gray) distances relative to theaverage (medium gray) centerpoint to centerpointdistance are aligned with the three axes of higherangular deformation for the Snyder projection aswe would expect The shortest distances are alongeach axis and the longest distances are adjacentand roughly perpendicular to each axis Thisspatial pattern of centerpoint distance variation
282
persists and becomes better defined at the nexttwo higher levels of recursion At the highest levelexamined here (bottom-right map) the largerand smaller distances clearly are localized alongeach axis grading toward average values in apropeller-like pattern that corresponds with theTissot angular deformation isolines Indeed theTissot diagram in Figure 7 is an excellent predic-tor of where variations in centerpoint distanceshould occur on the Snyder grid
The spatial pattern of centerpoint distance varia-tion for the hexagonally partitioned Fuller-Grayprojection surfaceis not easilydiscerned at the lowestlevel of recursion (upper-left map) but becomesreadily visible at the next two higher levelsAs withthe Snyder projection Tissot angular deformationisolines predict the spatial pattern of little variationin the center of the icosahedron face with progres-sivelylarger centerpoint distance variations (often inlonger-shorter distance adjacent pairs) as each edgeis approached Overall there appears to be slightlyless centerpoint distancevariation on the Fuller-Gray
Cartography and Geographic Information Science
Del
iver
ed b
y P
ublis
hing
Tec
hnol
ogy
to O
rego
n S
tate
Uni
vers
ity IP
128
193
164
203
on
Sat
12
Nov
201
1 22
50
45C
opyr
ight
(c)
Car
togr
aphy
and
Geo
grap
hic
Info
rmat
ion
Soc
iety
All
right
s re
serv
ed
Figure 14 Compactness comparison for basic segments offour global grids each shown on an orthographic map projec-tion to simulate the Earths sphericity
the icosahedron face always creates 12 penta-gons on the globe exactly 56th the area of eachhexagon the surface area standard deviation forthe Snyder grid will always be slightly greaterthan zero even though there is no area variationamong the hexagons formed However at pro-gressively higher levels of recursion the 12pentagons occupy increasingly less of the totalsurface area and the standard deviation for theentire globe rapidly approaches zero Hencethis graph shows the Snyder grid to be clearlysuperior for hexagonal subcells less than100000 km2 in area
Variation in centerpoint spacing between adja-cent cells for the four grid alternatives can be ana-lyzed by graphing logarithmically the standarddeviation in normalized centerpoint spacingagainst average cell area at increasing levels ofrecursion (Figure 18) This graph shows the gridsto perform similarly except for the poorly per-forming EqualAngleQuadrilateral grid The Fullerand Constant Area Quadrilateral grids converge athigher recursion levels to essentially identical lowstandard deviations closely followed by the Snydergrid
Average subcell compactness values for thefour grids (Figure 19) shows the superior perform-ance of icosahedral models over quadrilateralwhich is to be expected since hexagonal shapes are
bullbull~
nyder
Equal Angle
FuUerGra
Constant Area
9middotFold Recur ion Level 4
FuJlerGra ~ n der
0951
U95
09-10U9IJOll(S
9-FoldRecursion Level 3
FullerGray Snyder
Because variation in cell surface area is amajor concern for geostatisticians andothers we analyzed the variation innormalized cell area with increasinglevels of recursion Figure 17 is a loga-rithmic graph of the standard deviationin normalized-cell area versus the de-creasing average-cell area at increasinglevels of recursion for the four discreteglobal grid alternatives (but only thehexagonal grids formed by Snyder andFuller-Gray projection subtriangles)examined graphically above Recogniz-ing that the hexagonal partitioning of
Figure 15 Compactness comparison for tworecursion levels of the Fuller-Gray and ISEAgrids each shown on an orthographic mapprojection to simulate the Earths sphericity
hexagonal grid but this can only be shownconclusivelyby a statistical comparison ofalternativegrids
Statistical Comparison Results
Vol 26 NO4 283
Del
iver
ed b
y P
ublis
hing
Tec
hnol
ogy
to O
rego
n S
tate
Uni
vers
ity IP
128
193
164
203
on
Sat
12
Nov
201
1 22
50
45C
opyr
ight
(c)
Car
togr
aphy
and
Geo
grap
hic
Info
rmat
ion
Soc
iety
All
right
s re
serv
ed
140km
190km
560 km
1300 kIT
1650 kIT
425 m
SnyderProjection
RecursionLevel 7
RecursionLevel 3
RecursionLevel 5
Fuller-GrayProjection
Figure 16 Variations in hexagonal centerpoint spacing at three levels of recursionfor the Fuller and ISEA Grids on an icosahedron face
In addition to the detailed nu-merical analysis of grid-cellarea compactness and center-point spacing at different levelsof recursion we carried out anoverall comparison of numerous
Summary Rankings
inherently more compact thanrectangular shapes At all levels ofrecursion the Fuller grid is com-prised of hexagons slightly morecompact than correspondingSnyder grid hexagons both beingfar more compact than the corre-sponding constant area and equalangle grid quadrilaterals
Variation in subcell compact-ness seen by graphing the stan-dard deviation of cell compactnessvalues against average cell area(Figure 20) shows the slightlybetter performance of the Fullergrid over the Snyder grid athigher levels of recursion Theconstant-area grid has the lowestoverall standard deviation at itsinitial resolution (level 0) but itsstandard deviation increases rap-idly as the initial cells are parti-tioned in an equal-angle mannerHowever the poor performanceassociated with the equal-anglegrid at all levels of recursion isnever approached
l2 Equal Angle Quadrilateral1 05 Bgt 0- 3GlC RecursionC 01 Level Constant Area QuadrilateralbullIII 1 0 8
3C ~1 2l bull 83 4 5III
1 2 Fuller-Gray ProjectionenIII 01Glbullc(
4i0C 001
~ia 5Ebull0Z 0001
107
106
105 4 3 2
10 10 102Average Cell Area km (log10 scale)
discrete global grid alternatives in-cluding the seven presented in Table1 Eleven of the fourteen Goodchildcriteria were investigated along withtwo related criteria deemed signifi-cant for global grid comparison ForGoodchild criteria 2 4 and 5 a sum-mary ordinal ranking from 1 (verypoor) to 10 (best possible) was devel-oped based on the quantitative analy-sis of comparison metrics
Table 1 provides informationcrucial to the selection of a global
Figure 17 Normalized subcell area standarddeviation vs average cell area for four globalgrids
284 Cartography and Geographic Information Science
Del
iver
ed b
y P
ublis
hing
Tec
hnol
ogy
to O
rego
n S
tate
Uni
vers
ity IP
128
193
164
203
on
Sat
12
Nov
201
1 22
50
45C
opyr
ight
(c)
Car
togr
aphy
and
Geo
grap
hic
Info
rmat
ion
Soc
iety
All
right
s re
serv
ed
Criterion Equal Angle Constant Area Snyder Fuller-Gray Small Circle Dir Sphere Gnomonic
1 Domain is globe yes yes yes yes yes yes yes
2 Equal areal 1 7 10 8 10 6 3
3 Same topology yes no yes yes yes yes yes
4 Equal shape 1 3 7 8 7 9 9
5 Compactnessmiddot 1 4 7 8 8 8 9
6 Straight edges onprojection na2 na yes yes na na yes
7 Perimeter bisection J ni ni ni ni ni nin1
8 Hierarchy yes yes yes4 yes4 yes4 yes4 yes4
9 Single point yes yes yes yes yes yes yes
10 Maximally centered ni ni ni ni ni ni ni
11 Equidistant no no no no no no no
12 Addressing ni ni ni ni oi ni ni13 LatitudelLongitude yes yes yes yes yes yes yes
14 Arbitrary resolution yes yes yes yes yes yes yes
Geodesic edge lines no no no no no yes yes
Spatial nature of area Continuously Part continu- Constant Continuously Constant Fractal-like Continuouslyvariation varying ous part varying varying
irregular
IBest possible = 10 very good = 9 -7 very poor = 1
2 na = not applicable
J ni = not investigated
4 Only the triangular cells not the hexagonal are hierarchical in these grids
Table 1 Evaluation of Goodchilds and related comparison criteria for different global grids
Figure 18 Normalized centerpoint distance standard deviation vs average cellarea for four global grids
ConclusionsThe global grid evaluation crite-ria and associated metrics haveallowed us to compare gridsvarying widely in cell geometryand topology We have observedthat the prime areas of concernamong the small portion of theglobal data user community wehave interacted with to date areequal-area cells and a nested
spherical subdivision the small circle subdivisionmethod and the Fuller-Gray map projection forthe icosahedron If good overall performance is ofparamount concern the triangular andor hex-agonal partitioning of the Fuller-Gray projectionsurface might be selected due to the low variationin compactness of highly compact cells that vary
slightly in area in a continuouslyvarying predictable manner
2 3 4 6
JL------ ~2 1 2 3Constant Area Quadrilateral
Equal Angle Quadrilateral2 38 8
o~RecursionLevel
Snyder Projection ~Fuller-Gray 1
Projection
ampoc i 100gtQG)aiCcEG)1lIo ~ 01isNrn=G)~~S~ III 011-------------------------------
B l 11 1~ 1~ 1~ 1~2Average Cell Area km (log0 scale)
grid based on the relative importance of evalua-tion criteria from the users perspective If cellcompactness is of prime importance for examplea triangular or hexagonal grid based on partition-ing a Gnomonic map projection of an icosahe-dron face (not discussed in this article) would bethe best alternative closely followed by direct
Vol 26 No4 285
Del
iver
ed b
y P
ublis
hing
Tec
hnol
ogy
to O
rego
n S
tate
Uni
vers
ity IP
128
193
164
203
on
Sat
12
Nov
201
1 22
50
45C
opyr
ight
(c)
Car
togr
aphy
and
Geo
grap
hic
Info
rmat
ion
Soc
iety
All
right
s re
serv
ed
Figure 19 Normalized subcell average compactness VS average cell area for fourglobal grids
Figure 20 Normalized subcell compactness standard deviation vs average cellarea for four global grids
(1)
Equal Angle Quadrilateral
2 3 4 5bull 0
2 3 4 5
1 2 3 Constant Area auadrilateral
2Equal Angle Quadrilateral
3 4 5
Zone area = 2x 1tX r2 (10 - sin $)
RecursionLevel
o0-0 ---_e_----lto---
RecursionLevel
APPENDIXZone Standardized Compactness
(ZSC)Derivation
6 5 4 310 10 10 10
Average Cell Area km2 (10910 scale)
------ --_---lt~ 2 3 4
o
where r is the radius of the sphere and ltP is thelatitude of the bounding parallel
The surface area of a spherical zone is computedfrom
will give a full picture of the strengths and weak-nesses of current global grid alternatives
o
Constant AreaQuadrilateral
_~~ iFuller-Gray 1 2 Projection 3 4 5
o
Fuller-GrayProjection 1
Snyder Projection 1gt-------------------
05
00011------7---- ----------4 -----r--~2
10 10 10 10 10 102Average Cell Area km (10910scale)
CIl()CI)5 01 =() r~2Emlt3 ~- C 01=Gl 0 =0CO
111iii iii 001 =Ebulloz
IIIIII
CII CIImS 09tll ()bullbull tllClIogt Elt0o
08
hierarchy among cells (criteria 2and 8) Both the quadrilateralgrids and triangular forms ofpolyhedral grids examined herecan be partitioned recursivelyallowing a nested hierarchy tobe created Equal-area cells isthe critical criterion since cur-rently employed equal-angleand constant-area quadrilateralgrids can never be equal areaand were shown to performpoorly in this respect relative toseveral alternative grids
Only two global grids thosebased on the triangular partition-ing of the Icosahedral SnyderEqual Area (ISFA)projection andpartitioning using the Small Cir-cle Subdivision method (not dis-cussed in this article but describedin Song 1997)will produce equal-area cells on the spheroid TheSmall Circle Subdivision methodhas the advantage of producingcells slightly more compact butthe ISFA grid is currently moreefficient to compute and easier toimplement Consequently werecommend the ISFA as the bestcurrent choice for an equal areaglobal grid Whichever global gridis selected there are implementa-tion issues that must be addressedin future research includingbull Implementing an efficient
addressing scheme for bin-ning data into grid cells
bull Creating algorithms for fasttranslation of gridded data to and from geo-detic latitude and longitude
bull Developing efficient algorithms for aggrega-tion and disaggregation among nested gridlevels and
bull Implementing efficient data storage andaccess schemes for data in nested cells includ-ing metadata storage and accessWe have begun to address several of these im-
plementation facets for the ISFA grid beginningwith an ETOP05 DEM dataset binning experimentconducted at several levels of recursion (seehttpbufogeoorstedufirmatdgg for binning ex-amples) Performing similar implementation experi-ments on additional datasets using other candidategrids would provide a complementary grid compari-son that together with our geometrical comparisons
286 Cartography and Geographic Information Science
Del
iver
ed b
y P
ublis
hing
Tec
hnol
ogy
to O
rego
n S
tate
Uni
vers
ity IP
128
193
164
203
on
Sat
12
Nov
201
1 22
50
45C
opyr
ight
(c)
Car
togr
aphy
and
Geo
grap
hic
Info
rmat
ion
Soc
iety
All
right
s re
serv
ed
REFERENCES
ACKNOWLEDGMENTS
so that
EidenshinkJC andJL Faundeen 1994 The 1 km AVHRRglobal land data set First stages of implementation Inierna-tionaljournal of Remote Sensing 153443-62
Fekete G and L Treinish 1990 Sphere quadtree A newdata structure to support the visualization of sphericallydistributed data SPIE Extracting rManing from complex dataProcessing display interaction Vol 1259 pp 242-53
Fuller RB 1982 SynergeticJ NewYork MacMillanGiacaglia GEO and CA Lundquist 1972 Sampling func-
tions for geophysics Smithsonian A5trvphysical Observatory Spe-cial Report No 344 93 pp
Goodchild MF 1994 Geographical grid models for environ-mental monitoring and analysis across the globe (panelsession) In proceddings of GISUS 94 Conference PhoenixArizona
Gray RW 1994 Exact transformation equations for Fullersworld map Cartography and Geographic Informatian Systems21(4) 243-46
Hastings DA 1996 The global land l-km base elevationdigital elevation model A progress report Global ChangeNewsletter 27 11-12
Heikes R and DA Randall 1995 Numerical integration ofthe shallow-water equations on a twisted icosahedral gridPart I Basic design and results of tests Monthly WeatherReview 123 1862-80
Kahn R 1995 What shall we do with the data we are expect-ing in 1998 In Proceedings of the Massive Data SelJ WorkshopCommittee on Applied and Theoretical Statistics NationalAcademy of Sciences Washington DC
Kimerling AJ 1984 Area computation from geodetic coordi-nates on the spheroid Surveying and Mapping 44(4) 343-51
Kimerling AJ D White K Sahr and L Song 1995 Devel-opment of global sampling grid Mid-project report Samplingdesign and statistics research for EMAP Program us Environ-mental Protection Agency Corvallis Oregon
Loveland TR JW Merchant D O Ohlen and JF Brown1991 Development of a land-cover characteristics databasefor the conterminous US Photogrammetric Engineering andRemote Sensing 57(11) 1453-63
Lukatela H 1987 Hipparchus geopositioning model Anoverview In Proceedings of Auto Carto 8 Symposium Balti-more Maryland pp 87-96
Maling DH 1992 Coordinate systems and map projectioru (2nded) Oxford UK Pergamon Press
Muehrcke PC and JO Muehrcke 1997 Map we (4th ed) Madi-sonWisconsinJP Publications
Olea RO 1984 Sanlpling design optimization for spatial functionsMathematical Geowgy 16369-92
Saff EB and ABJ Kuijlaars 1997 Distnbuting many points on asphere The Mathematical Intelligencer 19(1)5-11
Slade G 1994 Self avoiding walks The MaJhematical Intelligencer16(1)29-35
Snyder JP 1987 Map projectioru-A working manual Wash-ington DC US Government Printing Office
Snyder JP 1992 An equal-area map projection for polyhe-dral globes Cartographica 29(1) 10-21
Song L 1997 Small circle subdivision method for develop-ment of global sampling grid Unpublished Masters thesisOregon State University 176 pp
Stauffer D 1992 Introduction to percolation theory (2nd ed)London UK Taylor amp Francis
Tobler WR and Z Chen 1986 A quadtree for global infor-mation storage GeographicalAnalysis 18(4) 360-71
White D A J Kimerling and WS Overton 1992 Carto-graphic and geometric components of a global samplingdesign for environmental monitoring Cartography and Geo-graphic Information Systems 195-22
White D AJ Kin1erlingK Sahr and L Song 1998 Comparingarea and shape distortion on polyhedral-based recursive partitionsof the sphere International Journal of Geographiad Information Science12 805-27
Wolfram S 1986 Cellular automaton fluids 1 Basic theoryjournal of Statistical Physics 45471-526 bull
(5)Zone perimeter = 2XTCXr(co~)
ZSG = SQ1middott(4XTCxcellarea - cellarea2lr2) I cellperimeter (6)
Zone Standardized Compactness (ZSC) isgiven by Zone perimeterCell perimeter Substi-tuting and combining equations we compute ZSCfrom
Baumgardner JR and PO Frederickson 1985 Icosahedraldiscretization of the two-sphere SIAM journal of NUrMricalAnalysis 22(6) 1107-15
Bomford G 1971 Geodesy Oxford The Clarendon Press731 pp
Brooks DR 1981 Grid systems for Earth radiation budgetexperiment applications NASA Technical Memorandum8323340 pp
Coexeter HSM 1962 The problem of packing a number ofequal nonoverlapping circles on a sphere Transactions NewYork Academy of Science Division of Mathematics Series IIvol 24 320-31
Dutton G 1988 Geodesic modeling of planetary relief Car-tographica 21 188-207
Dutton G 1994 Geographical grid models for environmentalmonitoring and analysis across the globe (panel session) InProceedings of GISUS 94 Conference Phoenix Arizona
cos$ =sqrt( IO-(IO-cellareal(2xTCX r2)) (4)
The perimeter of the spherical zone is thecircumference of the bounding parallel computedfrom
Gelarea = 2XTCxr2(lO-sin$) (2)
This research was supported by US Environ-mental Protection Agency-Oregon State Univer-sity Cooperative Agreement CR 821672 MatthewGregory Department of Geosciences graduatestudent created the centerpoint distance mapsseen in Figure 16 Dr Ralph Kahn NASA-JPLalso contributed significantly to this manuscriptThis manuscript has been subjected to EPA reviewand approved for publication The conclusionsand opinions are solely those of the authors andnot necessarily the viewsof the Agency
and
Setting the zone surface area equal to the cellarea we obtain
Vol 26 NO4 287
Del
iver
ed b
y P
ublis
hing
Tec
hnol
ogy
to O
rego
n S
tate
Uni
vers
ity IP
128
193
164
203
on
Sat
12
Nov
201
1 22
50
45C
opyr
ight
(c)
Car
togr
aphy
and
Geo
grap
hic
Info
rmat
ion
Soc
iety
All
right
s re
serv
ed
Remote Sensing for theEarth Sciences (3rd ed)Andrew Rencz
Recently adopted titlesin cartography GISremote sensingandGPS
Policy Issues in Modern art graph)DR Frazer Taylor (cd)
Wilderness NavigationBob and Mike Bums
I bullbull
ACS
Maps with the NewsMark Monmonier
Air Apparent HowMeteorologists Learnedto Map Predict andDramatize WeatherMark Monmonier
froooks
Mapping a Northern LandThe Survey of CanadaGerald McGrath and LouisSebert (eds)
Thematic Cartographyand VisualizationTerry A Slocum
1 it 11 bull
on Oirle ~y a30149j- ~24)
288 Cartography and Geographic Information Science
Del
iver
ed b
y P
ublis
hing
Tec
hnol
ogy
to O
rego
n S
tate
Uni
vers
ity IP
128
193
164
203
on
Sat
12
Nov
201
1 22
50
45C
opyr
ight
(c)
Car
togr
aphy
and
Geo
grap
hic
Info
rmat
ion
Soc
iety
All
right
s re
serv
ed
Figure 3 Spherical zone used in Zone Standardized Com-pactness (ZSC) calculation for an icosahedron face
However we are dealing with cells on theglobeTaking the Earths sphericity into account abetter index is one that uses a pole-centered spheri-cal zone of the same area as the grid cell (Figure 3)for the ideal (10 ) compactness What we term ZoneStandardized Compactness (ZSC)is computed from
ZSC = sqrt( 4x Tt x cell area - cell area 2 r2)cell peTimeter (2)
The derivation of ZSC is given in the Appen-dix We have extended this idea to the spheroidby determining the spheroidal area to parallelperimeter ratio normalized to a spheroidal cap ofthe same surface area as the cell (Kimerling et al1995)bull Criterion 11-Grid point spacing can be meas-
ured assuming that we can determine the latitudeand longitude of points within adjacent cellsAssuming the globe to be spherical we employthe standard great circle distance equation foreach pair of adjacent coordinates
distance = r arccos (sin(lat I) sin (lat2) + cos (lat J)cos (lat2) cos (lion I -lon2 I) (3)
bull Criterion 10-Detennining grid point centralitywithin a cell can be approached as a center ofgra~ty problem Here we can use off-the-shelfalgorithms for center-of-gra~tycomputation fromlists of edge coordinates and then compare thegrid point location to the center of gra~ty todetermine the distance and direction of dC~ation
Vol 26 No4
Each of the above comparison metrics are com-puted for a single cell or grid point and can be ana-lyzed statisticallywhen computations are extended tothe entire globe (realizing that the entire populationof cells is the sample) The mean standard deviationand the range of cell metrics have been found to beuseful comparison statistics for alternative globalgrids (Whiteet al 1998)
Global Grid AlternativesNumerous surface tessellations have been proposedas global grids but the possibilitiescan be organizedinto a limited number of general categories Inspiredby Duttons (1994) general tessellation taxonomy wedeveloped a more specific hierarchical classificationscheme for global grids (Figure 4) and then selectedgrids from different classes for comparison At thebroadest level our scheme divides grids into thosebased on directly tessellating the sphere or spheroidand those that transform all or a portion of the globeto a map projection surfacewhich is tessellated in aregular manner with cell edges ancVor grid pointsthen back-projected to the sphere or spheroid
At the second level in our classification hierar-chy direct surface tessellations can be based onbull Subdividing quadrilateral cells recursivelybull Subdividing the faces of a spherical Platonic
polyhedron recursively orbull Creating a Voronoi tessellation comprised of
spherical or spheroidal Thiessen polygonsDirectly tessellated quadrilateral grids can be
further divided into what the global modeling com-munity calls equal-angle and constant-area grids(Kahn 1995) Tessellations of the globe into quadri-lateral cells of equal latitudinal and longitudinalextent are termed equal angle Examples aboundincluding the 5 x 5 poundTOP05 global DEM and theERBE 2S x 25deg 5degx 5degand 10degx 10deggrids (Brooks1981) Constant-area tessellations begin with anarbitrarily sized quadrilateral cell at the equator andthen define the parallel and meridian cell bounda-ries across the globe so as to achieve approximatelyequal-area cells This is done either by keeping thelatitude increment constant and adjusting the longi-tude increment as the pole is approached or viceversa (Brooks 1981)
Directly tessellated polyhedral grids can alsobe divided into two categories based on whetherthe partitioning of polyhedral faces is performedwith the edges of a great or a small circle Feketeand Treinishs (1990) spherical quadtree datastructure which is based on recursive subdivisionof spherical triangles obtained by projecting thefaces of an icosahedron onto a sphere is a good
275
Del
iver
ed b
y P
ublis
hing
Tec
hnol
ogy
to O
rego
n S
tate
Uni
vers
ity IP
128
193
164
203
on
Sat
12
Nov
201
1 22
50
45C
opyr
ight
(c)
Car
togr
aphy
and
Geo
grap
hic
Info
rmat
ion
Soc
iety
All
right
s re
serv
ed
Map Projection Surface Tessellations
Single PrOj~ ~tion Surface-- ---- -- --Equal Area Non-Equal Area Equal Area Non-Equal Area
Gnomonic
ex Fuller (1982)Icosahedral
ex Snyder (1992)Polyhedral EqualArea Projections
ex lukatela (1987)ex Fekete and ex Song (1997) Hipparchus Geo-
Treinish (1990) positioning ModelSpherical Quadtree Dutton (1988) QTM
Constant-Area Quadrilateral TessellationOur example is the Nimbus Earth Radiation Budget(ERB) Experiment grid with initial 4S x 4S quad-rilateral cells at the equator (Figure 6) The longitu-dinal increment increases in 12 discrete steps to 120degnear each pole Recursive partitioning into approxi-mately constant-area subcells is more problematic as2-frequency equal-angle partitioning is commonly
Global Grid Comparison Examples
Equal-Angle Quadrilateral TessellationOur example will be an initial partitioning of theglobe into thirty-two45deg x 45deg cells at recursion level0 and subsequent 9-fold recursive partitioning tolevel fiveHence grids with 45deg x 45deg 15degx 15deg5degx5deg 1 23degx 1 23deg 59degx 59deg and 527degx 527degedgeswill be analyzed Recursion level two illustrated inFigure 5 corresponds to the 5degx 5degERBEgrid
Our overall comparison of the above categories ofglobal grids based on the Goodchild criteria ispresented in Table 1 and will be discussed as part ofour recommendations We have also selected fourexamples from different categories in our taxonomyto illustrate our more detailed comparison of surfacearea compactness and centerpoint spacing varia-tion These examples described belowwere selectedto show the fundamental geometrical differencesbetween quadrilateral and polyhedral grids as wellas to contrast commonly used standard quadrilat-eral grids with polyhedral alternatives
ex Nimbus ERS
Direct SphericaVSpheroidal Tessellations----- I _Quadrilateral Polyhedral Voronoi---- ---- --Equal Angle Constant Area Great Circle Small Circle
Edges Edges
ex ETOP05ERSE 25 deg
ex Tobler and Chen ex Square Projection(1986) lambert Cylin- (same as equal angle
drical Equal Area tessellation)
loveland et al (1991)Global land
Characterization
example of great-circleedge partitioningSongs (1997) small-circle subdivision systemcreates equal-areaspherical triangles withmore mathematicallycomplex small circleedges Duttons (1988)QTM projection gridfor octahedron faces isan interesting combina-tion of great- and small-circle subdivision
Lukatelas (1987)Hipparchus Geoposition-ing Model is an excellentexample of a spheroidalVoronoi tessellationHere the outwardly sim-ple problem is comput- Figure 4 Globalgrid taxonomying a set of regularlyspaced grid points fromwhich spherical or sphe-roidal Thiessen polygons can be constructed But asGiacaglia and Lundquist (1972) note The problemof distributing in the most regular way a given num-ber of points on a sphere has been studied for centu-ries and in general is still unsolved Methods suchas finding the greatest number of small circles of agiven radius that can be placed on a spherical surfacewithout overlapping (Coxeter 1962) have been su-perseded by sampling function approaches for thesphere that begin with the edges of a spherical poly-hedron (Giacaglia and Lundquist 1972) Perfectregularity however remains an inherently unachiev-able ideal
Map projection based global tessellationscurrently can be placed in one of two categoriessingle and multiple projection surfaces Singleprojections of the globe typically cylindrical havebeen used to construct quadrilateral grids It isuseful due to the importance of satisfying crite-rion two to further divide projection surfaces intoequal area (eg Tobler and Chens (1986) Lam-bert cylindrical equal-area grid) and non-equalarea (the ETOPO 5 grid for example can bethought of as a square projection partitioned intocells 5 x 5 in length on the projection surface)categories Multiple projection surfaces are typi-cally faces of Platonic polyhedra We can alsoplace these into equal area (eg Snyder (1992)polyhedral equal area projections for the fivePlatonic polyhedra) and non-equal area (egFuller (1982) and Baumgardner and Frederickson(1985raquo projection of icosahedron faces
276 Cartography and Geographic Information Science
Del
iver
ed b
y P
ublis
hing
Tec
hnol
ogy
to O
rego
n S
tate
Uni
vers
ity IP
128
193
164
203
on
Sat
12
Nov
201
1 22
50
45C
opyr
ight
(c)
Car
togr
aphy
and
Geo
grap
hic
Info
rmat
ion
Soc
iety
All
right
s re
serv
ed
Equal Angle GridFigure 5 Equal-angle quadrilat-eral grid for a 45deglongitude by 90deglatitude sectionof the globe
Constant Area GridFigure 6 Con-stant area quad-rilateral grid for a45deg longitude by90deg latitude sec-tion of the globe
SNYDER MAP PROJECTION
Figure 7 Icosahedral Snyder Equal Area (ISEA) projection of an icosahedron face (a) Tissotangular deformation isolines (b)
equivalence throughout (Figure 7) The projection ismade equal area by adjusting the scale outward fromthe center of each edge This results in increasedshape distortion as each of the three axes from thetriangle center to comer vertices is approached Amap of angular deformation across an icosahedronface (which is the result of our Tissot distortionanalysis based on the Gaussian basic quantity ap-proach outlined in Maling (1992raquo shows this patternof distortion
The equilateral triangular projection of eachicosahedron face is subdivided recursively into equi-lateral subtriangles in either the 4-fold or the 9-foldmanner illustrated in Figure 2 The bowing of trian-gle edges along the three axes of angular deforma-tion is apparent in Figure 8 where 4-fold subdivision
subtriangles of recur-sion level four are backprojected to the globeThis edge bowing is aprimary cause of varia-tions in compactnessamong subtriangles
We noted earlierthat triangular gridsallow hexagonalgrids to be createdthrough subtriangleaggregation and thathexagonal grids haveseveral advantagesrelated to global dataanalysis The ISEAtriangular grid inher-ently allows equal-area hexagons to beassembled at varying
Tissot Angular DeformationIcosahedron Face
employed for simplicity Breaking from tradition weemploy 3-frequency equal-angle partitioning tomaintain consistency in our comparisons while usingthe same basic partitioning method The initial 4Slatitude x variable longitude cells correspond ap-proximately to recursion level two in our equal-angletessellation with partitioning carried to recursionlevel 5 (IS OS 16deg latitude by variable longitudecell edges)
Equal-Area Map Projection Surface TessellationOur example is the Icosahedral Snyder Equal- Area(ISEA) projection (Snyder 1992) which transformseach icosahedron face on the globe into an equilat-eral planar triangle while maintaining area
Vol 26 No4 277
Del
iver
ed b
y P
ublis
hing
Tec
hnol
ogy
to O
rego
n S
tate
Uni
vers
ity IP
128
193
164
203
on
Sat
12
Nov
201
1 22
50
45C
opyr
ight
(c)
Car
togr
aphy
and
Geo
grap
hic
Info
rmat
ion
Soc
iety
All
right
s re
serv
ed
PARTITIONING COMPARISONFigure 8 Icosahedron faces that are4-fold partitioned to recursion levelfour on the ISEA and Fuller-Grayprojection surfaces then re-projected on an orthographic mapprojection to simulate the Earthssphericity
Snyder Projection
4 bull FOld SubdiVISionRecursion Level 4
Fuller-Gray Projection
Figure 9 Aggregation of 54 and 6 neighboring triangles on the ISEA pro-jection into equal area hexagonal cells forming 9-fold higher resolutiongrids
levels of spatial resolution For example aggre-gating sets of 54 neighboring triangles producesthe equal-area hexagonal grid for the icosahedronface shown in Figure 9a Again apparent is thebowing of hexagon edges along the three axes ofhigher angular deformation which should intro-duce larger compactness variations
Aggregating the same subtriangles into sets ofsix neighbors (Figure 9b) creates a nine timeshigher resolution hexagonal grid with edge bow-ing more localized along the three axes Becausenine of the small hexagons (seven fulland one-third of six adjacent) form thelarge hexagon the small hexagons area 9-fold subdivision of the large hexa-gons at the next higher level of recur-sion Further 9-fold partitioning of theunderlying subtriangles allows assem-bly into 9-fold smaller hexagons athigher levels of recursion
Non-Equal Area Map Projection SurfaceTessellationWe will use the Fuller-Gray projectionwhich is based on the geometrical ideabehind R Buckminster Fullers icosahe-dral world map projection (Fuller 1982)Fuller imagined the three edges of eachicosahedron face as flexible bands curvedto lie on the spherical surface (left half ofFigure 10) Each edge would be subdi-vided and holes drilled at n equallyspaced increments and flexible bandswould be strung between correspondingholes on adjacent edges This wouldcreate a triangular network of lines onthe sphere which could be flattened tocreate a regular grid of equilateral subtri-angles (right half of Figure 10)
278
Fuller imagined the verticesof each subtrianglebeing the projection of the corresponding line inter-section point on the sphere These intersectionpoints were later found physically impossible toachieve because each triplet of intersecting lines onthe globe forms a small triangle in the plane whosecenterpoint is the best approximation of Fullersidea Gray (1994) developed exact transformationequations for this approximation producing a com-promise projection having both small area andshape distortion
(a)
(b)
Cartography and Geographic Information Science
Del
iver
ed b
y P
ublis
hing
Tec
hnol
ogy
to O
rego
n S
tate
Uni
vers
ity IP
128
193
164
203
on
Sat
12
Nov
201
1 22
50
45C
opyr
ight
(c)
Car
togr
aphy
and
Geo
grap
hic
Info
rmat
ion
Soc
iety
All
right
s re
serv
ed
Figure 10 Fullers geometrical concept of an icosahedral map projection surface (Source Fuller1982)
The equilateral-triangle Fuller-Gray projec-tion of an icosahedron face is shown in Figure 11along with area-scale and angular-deformationmaps displaying results of our Tissot distortionanalysis Note the smooth increase in area-scaleand angular deformation from the triangle centerto each edge vertex Both recursive partitioningand triangle aggregation is performed identicallyto the Snyder projection The only differenceshould be the creation of non-equal area triangu-lar and hexagonal cells that vary less in compact-ness on average and that grade smoothly fromslightly higher to lower compactness (Figure 8)
Analyses and ResultsThe ideal comparison of global grid geometricalproperties would consist of computing surface areacompactness and other metrics at each level of re-cursion down to the spatial resolution correspondingto the smallest grid cell expected to be used in globalanalysis If the smallestcellwere 1 km2 for examplethe 9-fold partitioning of an icosahedron face mustbe carried out to recursion level eight meaning thatarea compactness centerpoint distance and othermetries must be computed for over 500 million cellsNaturally an infinite number of triangular hexago-nal or quadrilateral recursion levels and cells arepossible as recursive partitioning can continueindefinitely
We have found 9-fold partitioning to recursionlevels less than six to be suitable for comparisonpurposes because surface area compactness center-point spacing and other metries are still computableat the rapidly increasing cell densities However thecomputation effort quickly becomes immense athigher levels of recursion and the results may notadd significantlyto our understanding of the surface
Vol 26 No4
tessellation or gridpoint geomeoy
The normalizedarea zone standard-ized compactness andcenterpoint distanceanalyses that followare a representativesample of our fullresearch effort Thefour grid alternativesexamined were se-lected from the lOwestudied but resultsfrom only two of thefive recursion levelsweexamined are pre-sented here to illus-
trate the essential geometrical properties of the fullrange of quadrilateral and polyhedral grid alterna-tivesWe have limited the polyhedral analysis to thehexagonal tessellation because area and shape dis-tortion characteristics of triangular partitioning arepresented in a companion article (White et al 1998)
Normalized Area Map Comparison
bull Spheroidal areas were computed from sets ofclosely spaced geodetic latitude and longitudecoordinates along each cell edge (usually 11points along an edge) For the two quadrilat-eral tessellations the bounding parallels wereon the WGS 84 spheroid However for theFuller-Gray and Snyder projections onlyspherical equations were available so a morecomplex spheroidal transformation proce-dure had to be used This involved Projectingfrom the authalic sphere for the WGS 84ellipsoid to the plane using forward projec-tion equations
bull Partitioning on the planar projection surfacebull Back projecting cell edges and centerpoints to
spherical coordinates using the inversespherical equations for each projection and
bull Converting authalic to WGS 84 geodetic lati-tude using the transformation equationsfound in Snyder (1987) This allows the ori-ented spheroidal triangle summation method(Kimerling 1984) to be applied to the four(and other) global grid alternativesMaps comparing variations in normalized
surface area for the four discrete global grid ex-amples described above are presented in Figure12 The equal-angle and constant-area grids cover45deg of longitude by 90deg of latitude (equator to
279
Del
iver
ed b
y P
ublis
hing
Tec
hnol
ogy
to O
rego
n S
tate
Uni
vers
ity IP
128
193
164
203
on
Sat
12
Nov
201
1 22
50
45C
opyr
ight
(c)
Car
togr
aphy
and
Geo
grap
hic
Info
rmat
ion
Soc
iety
All
right
s re
serv
ed
Fuller-Grey map projection
Icosahedron Face Area Distortion Angular Deformation
Tissot distortion analysis
Figure 11 Fuller-Gray map projection and Tissot distortion analysis for an icosahedron face
pole) or 1I16th of the globe Each icosahedronface of course covers 120th of the globe so thatthe surface areas of comparison surfaces are ap-proximately the same The level of recursion foreach grid was selected so that the average cell areawithin each grid is nearly the same From thesemaps in Figure 12 it is apparent thatbull The larger range in normalized area (0069 -
1569 or 150 percent) associated with theequal-angle grid makes it as expected by farthe worst alternative of the four
bull The constant-area grid has a greater range ofnormalized area than either the Snyder orFuller-Gray grids The pattern of spatialvariation is one of identical normalized areawithin east-west bands Cell areas also de-crease slowly from south to north within thethree blocks in the bottom half of the maphaving identical meridians as cell boundariesSuch regularity is not present in the rows ofcells forming the top half of the map
bull Normalized hexagon areas on the Fuller-Grayprojection decrease smoothly from a value of106 (6 percent above average) at the icosahe-dron face center to a lower value of 0944near each corner The very low normalizedarea for the triangle at each corner is causedby this being one of five spherical triangles onadjacent icosahedron faces that together formone of 12 pentagonal cells on the globe Eachpentagon area is 56th that of the averagehexagonal cell which gives the lower normal-ized area
280
bull Normalized hexagon areas on the Snyderprojection are identical and just slightly largerthan 10 so as to offset the three smaller areasof corner pentagonal cells If the pentagonareas are removed from the calculations allhexagons are measured as having a 10 nor-malized surface area a numerical demonstra-tion that the Snyder equations for theicosahedron do indeed produce an equal areamap projection surfaceWe next examine the spatial pattern of nor-
malized area for hexagons at recursion levelsthree and four for the 9-fold partitioning of theFuller-Gray and Snyder projection surfaces Theresults are presented in the four orthographicmap projections of icosahedron faces shown inFigure 13 In each of the three Snyder projectiongrids the normalized areas of hexagonal cells areidentical but the normalized area value of thegrid rapidly approaches 10 as the level of recur-sion increases This is due to the progressivelysmaller contribution of the pentagonal cornercells to the total area of the icosahedron face
At increasing levelsof recursion the Fuller-Gray projection grids show a progressive smooth-ing of normalized area variation as the level ofrecursion increases By the fourth level thesmooth pattern of reduction in normalized areafrom the icosahedron center toward each edgeclosely mirrors the Tissot area distortion isolinesdefining the continuous area distortion surface Asexpected the spatial pattern of continuous Tissotarea distortion and of discrete normalized cell
Cartography and Geographic Information Science
Del
iver
ed b
y P
ublis
hing
Tec
hnol
ogy
to O
rego
n S
tate
Uni
vers
ity IP
128
193
164
203
on
Sat
12
Nov
201
1 22
50
45C
opyr
ight
(c)
Car
togr
aphy
and
Geo
grap
hic
Info
rmat
ion
Soc
iety
All
right
s re
serv
ed
Figure 12 Normalized-area comparison for basic segments of four global grids eachshown on an orthographic map projection to simulate the Earths sphericity
1110
1569
0069
09190813077
Figure 16 displays maps of an icosahedron face onthe Fuller-Gray and Snyder projection surfaces thatdepict variations in centerpoint distance betweenadjacent hexagons for 9-fold hexagonal partitioningat three levels of recursion (similar research on
Centerpoint Distance Map Comparison
and the other cells be-coming progressivelymore square in shape asthe equator ISapproached
bull The Snyder grid centerhexagon has the lowestcompactness (ignoringthe inherently lowercompactness pentagonsegments at each corner)The bowed pairs of hexa-gon edges along eachaxis of higher angulardeformation producelower compactness hexa-gons than those fartheraway from each axiswhere higher ZSC valuesvary only slightly and
bull Except for the lower com-pactness comer pentagoncells ZSCvalues across theFuller-Graygrid are consis-tently higher than the otherthree alternativeswith thehighest value at the icosahe-dron center and a slightsmooth decrease radiallyoutward from the centerAs done with normalized
area the spatial pattern ofZSC for hexagonal grids9-fold partitioned to recur-sion levels three and four wasexamined for the Fuller-Gray
and Snyder map projection surfaces (Figure 15)Both grids show a progressive smoothing of ZSCvalues also seen in the area analysis with increas-ing levels of recursion In both grids the spatialpattern of slightly lower to higher compactnessclosely mirrors the Tissot angular deformationisoline pattern for the map projection becomingspatially indistinguishable by recursion level fourHence Tissot angular deformation can be used topredict the spatial pattern of compactnessvariation
nyder
Equal Angle
1110
09190IIJ3077
FullerGray
Constant Area
Compactness Map Comparison
areas become indistinguishable at higher levels ofrecursIOn
Results from computation of Zone StandardizedCompactness (ZSC) for the four grid alternativesare presented in Figure 14 The portions of theglobe covered and levels of recursion selected forthe area comparisons are used here as well toinsure that the average cell area of each grid issimilar These four ZSCmaps show thatbull Compactness variation is greatest by far for
the equal-angle grid as the basic cell shapesvary from narrow spherical triangles at thepole to spherical squares at the equator
bull There is relatively little variation in compact-ness across the constant-area grid in spite ofthe cell at the pole being triangular in shape
Vol 26 No4 281
Del
iver
ed b
y P
ublis
hing
Tec
hnol
ogy
to O
rego
n S
tate
Uni
vers
ity IP
128
193
164
203
on
Sat
12
Nov
201
1 22
50
45C
opyr
ight
(c)
Car
togr
aphy
and
Geo
grap
hic
Info
rmat
ion
Soc
iety
All
right
s re
serv
ed
Figure 13 Normalized-areacomparison for two recursionlevels of the Fuller-Gray andISEA grids each shown on anorthographic map projection tosimulate the Earthssphericity
9-Fold Recursion Level 31060
fl
nil r ra n der
ld e ur ion Le el 4
FullerGray
1060
O9n J
U71~
Snyder
quadrilateral centerpoint distance for the equal-angle and constant-area grids is underway) Thisexample of our centerpoint distance analysis showshow variations in great-circle distance between adja-cent pairs of hexagon centers can be mapped
The six equilateral triangles fonning each hexa-gon can be thought of as map symbols shaded ac-cording to the distance between the hexagon centerand the centerpoint of adjacent hexagons to thenorth (0deg) northeast (60deg) southeast (120deg) south(180deg) southwest (240deg) and northwest (300deg) as-suming north to be at the top of the page
At the lowest level of recursion (top-rightmap) the general pattern of larger (darker gray)and smaller (lighter gray) distances relative to theaverage (medium gray) centerpoint to centerpointdistance are aligned with the three axes of higherangular deformation for the Snyder projection aswe would expect The shortest distances are alongeach axis and the longest distances are adjacentand roughly perpendicular to each axis Thisspatial pattern of centerpoint distance variation
282
persists and becomes better defined at the nexttwo higher levels of recursion At the highest levelexamined here (bottom-right map) the largerand smaller distances clearly are localized alongeach axis grading toward average values in apropeller-like pattern that corresponds with theTissot angular deformation isolines Indeed theTissot diagram in Figure 7 is an excellent predic-tor of where variations in centerpoint distanceshould occur on the Snyder grid
The spatial pattern of centerpoint distance varia-tion for the hexagonally partitioned Fuller-Grayprojection surfaceis not easilydiscerned at the lowestlevel of recursion (upper-left map) but becomesreadily visible at the next two higher levelsAs withthe Snyder projection Tissot angular deformationisolines predict the spatial pattern of little variationin the center of the icosahedron face with progres-sivelylarger centerpoint distance variations (often inlonger-shorter distance adjacent pairs) as each edgeis approached Overall there appears to be slightlyless centerpoint distancevariation on the Fuller-Gray
Cartography and Geographic Information Science
Del
iver
ed b
y P
ublis
hing
Tec
hnol
ogy
to O
rego
n S
tate
Uni
vers
ity IP
128
193
164
203
on
Sat
12
Nov
201
1 22
50
45C
opyr
ight
(c)
Car
togr
aphy
and
Geo
grap
hic
Info
rmat
ion
Soc
iety
All
right
s re
serv
ed
Figure 14 Compactness comparison for basic segments offour global grids each shown on an orthographic map projec-tion to simulate the Earths sphericity
the icosahedron face always creates 12 penta-gons on the globe exactly 56th the area of eachhexagon the surface area standard deviation forthe Snyder grid will always be slightly greaterthan zero even though there is no area variationamong the hexagons formed However at pro-gressively higher levels of recursion the 12pentagons occupy increasingly less of the totalsurface area and the standard deviation for theentire globe rapidly approaches zero Hencethis graph shows the Snyder grid to be clearlysuperior for hexagonal subcells less than100000 km2 in area
Variation in centerpoint spacing between adja-cent cells for the four grid alternatives can be ana-lyzed by graphing logarithmically the standarddeviation in normalized centerpoint spacingagainst average cell area at increasing levels ofrecursion (Figure 18) This graph shows the gridsto perform similarly except for the poorly per-forming EqualAngleQuadrilateral grid The Fullerand Constant Area Quadrilateral grids converge athigher recursion levels to essentially identical lowstandard deviations closely followed by the Snydergrid
Average subcell compactness values for thefour grids (Figure 19) shows the superior perform-ance of icosahedral models over quadrilateralwhich is to be expected since hexagonal shapes are
bullbull~
nyder
Equal Angle
FuUerGra
Constant Area
9middotFold Recur ion Level 4
FuJlerGra ~ n der
0951
U95
09-10U9IJOll(S
9-FoldRecursion Level 3
FullerGray Snyder
Because variation in cell surface area is amajor concern for geostatisticians andothers we analyzed the variation innormalized cell area with increasinglevels of recursion Figure 17 is a loga-rithmic graph of the standard deviationin normalized-cell area versus the de-creasing average-cell area at increasinglevels of recursion for the four discreteglobal grid alternatives (but only thehexagonal grids formed by Snyder andFuller-Gray projection subtriangles)examined graphically above Recogniz-ing that the hexagonal partitioning of
Figure 15 Compactness comparison for tworecursion levels of the Fuller-Gray and ISEAgrids each shown on an orthographic mapprojection to simulate the Earths sphericity
hexagonal grid but this can only be shownconclusivelyby a statistical comparison ofalternativegrids
Statistical Comparison Results
Vol 26 NO4 283
Del
iver
ed b
y P
ublis
hing
Tec
hnol
ogy
to O
rego
n S
tate
Uni
vers
ity IP
128
193
164
203
on
Sat
12
Nov
201
1 22
50
45C
opyr
ight
(c)
Car
togr
aphy
and
Geo
grap
hic
Info
rmat
ion
Soc
iety
All
right
s re
serv
ed
140km
190km
560 km
1300 kIT
1650 kIT
425 m
SnyderProjection
RecursionLevel 7
RecursionLevel 3
RecursionLevel 5
Fuller-GrayProjection
Figure 16 Variations in hexagonal centerpoint spacing at three levels of recursionfor the Fuller and ISEA Grids on an icosahedron face
In addition to the detailed nu-merical analysis of grid-cellarea compactness and center-point spacing at different levelsof recursion we carried out anoverall comparison of numerous
Summary Rankings
inherently more compact thanrectangular shapes At all levels ofrecursion the Fuller grid is com-prised of hexagons slightly morecompact than correspondingSnyder grid hexagons both beingfar more compact than the corre-sponding constant area and equalangle grid quadrilaterals
Variation in subcell compact-ness seen by graphing the stan-dard deviation of cell compactnessvalues against average cell area(Figure 20) shows the slightlybetter performance of the Fullergrid over the Snyder grid athigher levels of recursion Theconstant-area grid has the lowestoverall standard deviation at itsinitial resolution (level 0) but itsstandard deviation increases rap-idly as the initial cells are parti-tioned in an equal-angle mannerHowever the poor performanceassociated with the equal-anglegrid at all levels of recursion isnever approached
l2 Equal Angle Quadrilateral1 05 Bgt 0- 3GlC RecursionC 01 Level Constant Area QuadrilateralbullIII 1 0 8
3C ~1 2l bull 83 4 5III
1 2 Fuller-Gray ProjectionenIII 01Glbullc(
4i0C 001
~ia 5Ebull0Z 0001
107
106
105 4 3 2
10 10 102Average Cell Area km (log10 scale)
discrete global grid alternatives in-cluding the seven presented in Table1 Eleven of the fourteen Goodchildcriteria were investigated along withtwo related criteria deemed signifi-cant for global grid comparison ForGoodchild criteria 2 4 and 5 a sum-mary ordinal ranking from 1 (verypoor) to 10 (best possible) was devel-oped based on the quantitative analy-sis of comparison metrics
Table 1 provides informationcrucial to the selection of a global
Figure 17 Normalized subcell area standarddeviation vs average cell area for four globalgrids
284 Cartography and Geographic Information Science
Del
iver
ed b
y P
ublis
hing
Tec
hnol
ogy
to O
rego
n S
tate
Uni
vers
ity IP
128
193
164
203
on
Sat
12
Nov
201
1 22
50
45C
opyr
ight
(c)
Car
togr
aphy
and
Geo
grap
hic
Info
rmat
ion
Soc
iety
All
right
s re
serv
ed
Criterion Equal Angle Constant Area Snyder Fuller-Gray Small Circle Dir Sphere Gnomonic
1 Domain is globe yes yes yes yes yes yes yes
2 Equal areal 1 7 10 8 10 6 3
3 Same topology yes no yes yes yes yes yes
4 Equal shape 1 3 7 8 7 9 9
5 Compactnessmiddot 1 4 7 8 8 8 9
6 Straight edges onprojection na2 na yes yes na na yes
7 Perimeter bisection J ni ni ni ni ni nin1
8 Hierarchy yes yes yes4 yes4 yes4 yes4 yes4
9 Single point yes yes yes yes yes yes yes
10 Maximally centered ni ni ni ni ni ni ni
11 Equidistant no no no no no no no
12 Addressing ni ni ni ni oi ni ni13 LatitudelLongitude yes yes yes yes yes yes yes
14 Arbitrary resolution yes yes yes yes yes yes yes
Geodesic edge lines no no no no no yes yes
Spatial nature of area Continuously Part continu- Constant Continuously Constant Fractal-like Continuouslyvariation varying ous part varying varying
irregular
IBest possible = 10 very good = 9 -7 very poor = 1
2 na = not applicable
J ni = not investigated
4 Only the triangular cells not the hexagonal are hierarchical in these grids
Table 1 Evaluation of Goodchilds and related comparison criteria for different global grids
Figure 18 Normalized centerpoint distance standard deviation vs average cellarea for four global grids
ConclusionsThe global grid evaluation crite-ria and associated metrics haveallowed us to compare gridsvarying widely in cell geometryand topology We have observedthat the prime areas of concernamong the small portion of theglobal data user community wehave interacted with to date areequal-area cells and a nested
spherical subdivision the small circle subdivisionmethod and the Fuller-Gray map projection forthe icosahedron If good overall performance is ofparamount concern the triangular andor hex-agonal partitioning of the Fuller-Gray projectionsurface might be selected due to the low variationin compactness of highly compact cells that vary
slightly in area in a continuouslyvarying predictable manner
2 3 4 6
JL------ ~2 1 2 3Constant Area Quadrilateral
Equal Angle Quadrilateral2 38 8
o~RecursionLevel
Snyder Projection ~Fuller-Gray 1
Projection
ampoc i 100gtQG)aiCcEG)1lIo ~ 01isNrn=G)~~S~ III 011-------------------------------
B l 11 1~ 1~ 1~ 1~2Average Cell Area km (log0 scale)
grid based on the relative importance of evalua-tion criteria from the users perspective If cellcompactness is of prime importance for examplea triangular or hexagonal grid based on partition-ing a Gnomonic map projection of an icosahe-dron face (not discussed in this article) would bethe best alternative closely followed by direct
Vol 26 No4 285
Del
iver
ed b
y P
ublis
hing
Tec
hnol
ogy
to O
rego
n S
tate
Uni
vers
ity IP
128
193
164
203
on
Sat
12
Nov
201
1 22
50
45C
opyr
ight
(c)
Car
togr
aphy
and
Geo
grap
hic
Info
rmat
ion
Soc
iety
All
right
s re
serv
ed
Figure 19 Normalized subcell average compactness VS average cell area for fourglobal grids
Figure 20 Normalized subcell compactness standard deviation vs average cellarea for four global grids
(1)
Equal Angle Quadrilateral
2 3 4 5bull 0
2 3 4 5
1 2 3 Constant Area auadrilateral
2Equal Angle Quadrilateral
3 4 5
Zone area = 2x 1tX r2 (10 - sin $)
RecursionLevel
o0-0 ---_e_----lto---
RecursionLevel
APPENDIXZone Standardized Compactness
(ZSC)Derivation
6 5 4 310 10 10 10
Average Cell Area km2 (10910 scale)
------ --_---lt~ 2 3 4
o
where r is the radius of the sphere and ltP is thelatitude of the bounding parallel
The surface area of a spherical zone is computedfrom
will give a full picture of the strengths and weak-nesses of current global grid alternatives
o
Constant AreaQuadrilateral
_~~ iFuller-Gray 1 2 Projection 3 4 5
o
Fuller-GrayProjection 1
Snyder Projection 1gt-------------------
05
00011------7---- ----------4 -----r--~2
10 10 10 10 10 102Average Cell Area km (10910scale)
CIl()CI)5 01 =() r~2Emlt3 ~- C 01=Gl 0 =0CO
111iii iii 001 =Ebulloz
IIIIII
CII CIImS 09tll ()bullbull tllClIogt Elt0o
08
hierarchy among cells (criteria 2and 8) Both the quadrilateralgrids and triangular forms ofpolyhedral grids examined herecan be partitioned recursivelyallowing a nested hierarchy tobe created Equal-area cells isthe critical criterion since cur-rently employed equal-angleand constant-area quadrilateralgrids can never be equal areaand were shown to performpoorly in this respect relative toseveral alternative grids
Only two global grids thosebased on the triangular partition-ing of the Icosahedral SnyderEqual Area (ISFA)projection andpartitioning using the Small Cir-cle Subdivision method (not dis-cussed in this article but describedin Song 1997)will produce equal-area cells on the spheroid TheSmall Circle Subdivision methodhas the advantage of producingcells slightly more compact butthe ISFA grid is currently moreefficient to compute and easier toimplement Consequently werecommend the ISFA as the bestcurrent choice for an equal areaglobal grid Whichever global gridis selected there are implementa-tion issues that must be addressedin future research includingbull Implementing an efficient
addressing scheme for bin-ning data into grid cells
bull Creating algorithms for fasttranslation of gridded data to and from geo-detic latitude and longitude
bull Developing efficient algorithms for aggrega-tion and disaggregation among nested gridlevels and
bull Implementing efficient data storage andaccess schemes for data in nested cells includ-ing metadata storage and accessWe have begun to address several of these im-
plementation facets for the ISFA grid beginningwith an ETOP05 DEM dataset binning experimentconducted at several levels of recursion (seehttpbufogeoorstedufirmatdgg for binning ex-amples) Performing similar implementation experi-ments on additional datasets using other candidategrids would provide a complementary grid compari-son that together with our geometrical comparisons
286 Cartography and Geographic Information Science
Del
iver
ed b
y P
ublis
hing
Tec
hnol
ogy
to O
rego
n S
tate
Uni
vers
ity IP
128
193
164
203
on
Sat
12
Nov
201
1 22
50
45C
opyr
ight
(c)
Car
togr
aphy
and
Geo
grap
hic
Info
rmat
ion
Soc
iety
All
right
s re
serv
ed
REFERENCES
ACKNOWLEDGMENTS
so that
EidenshinkJC andJL Faundeen 1994 The 1 km AVHRRglobal land data set First stages of implementation Inierna-tionaljournal of Remote Sensing 153443-62
Fekete G and L Treinish 1990 Sphere quadtree A newdata structure to support the visualization of sphericallydistributed data SPIE Extracting rManing from complex dataProcessing display interaction Vol 1259 pp 242-53
Fuller RB 1982 SynergeticJ NewYork MacMillanGiacaglia GEO and CA Lundquist 1972 Sampling func-
tions for geophysics Smithsonian A5trvphysical Observatory Spe-cial Report No 344 93 pp
Goodchild MF 1994 Geographical grid models for environ-mental monitoring and analysis across the globe (panelsession) In proceddings of GISUS 94 Conference PhoenixArizona
Gray RW 1994 Exact transformation equations for Fullersworld map Cartography and Geographic Informatian Systems21(4) 243-46
Hastings DA 1996 The global land l-km base elevationdigital elevation model A progress report Global ChangeNewsletter 27 11-12
Heikes R and DA Randall 1995 Numerical integration ofthe shallow-water equations on a twisted icosahedral gridPart I Basic design and results of tests Monthly WeatherReview 123 1862-80
Kahn R 1995 What shall we do with the data we are expect-ing in 1998 In Proceedings of the Massive Data SelJ WorkshopCommittee on Applied and Theoretical Statistics NationalAcademy of Sciences Washington DC
Kimerling AJ 1984 Area computation from geodetic coordi-nates on the spheroid Surveying and Mapping 44(4) 343-51
Kimerling AJ D White K Sahr and L Song 1995 Devel-opment of global sampling grid Mid-project report Samplingdesign and statistics research for EMAP Program us Environ-mental Protection Agency Corvallis Oregon
Loveland TR JW Merchant D O Ohlen and JF Brown1991 Development of a land-cover characteristics databasefor the conterminous US Photogrammetric Engineering andRemote Sensing 57(11) 1453-63
Lukatela H 1987 Hipparchus geopositioning model Anoverview In Proceedings of Auto Carto 8 Symposium Balti-more Maryland pp 87-96
Maling DH 1992 Coordinate systems and map projectioru (2nded) Oxford UK Pergamon Press
Muehrcke PC and JO Muehrcke 1997 Map we (4th ed) Madi-sonWisconsinJP Publications
Olea RO 1984 Sanlpling design optimization for spatial functionsMathematical Geowgy 16369-92
Saff EB and ABJ Kuijlaars 1997 Distnbuting many points on asphere The Mathematical Intelligencer 19(1)5-11
Slade G 1994 Self avoiding walks The MaJhematical Intelligencer16(1)29-35
Snyder JP 1987 Map projectioru-A working manual Wash-ington DC US Government Printing Office
Snyder JP 1992 An equal-area map projection for polyhe-dral globes Cartographica 29(1) 10-21
Song L 1997 Small circle subdivision method for develop-ment of global sampling grid Unpublished Masters thesisOregon State University 176 pp
Stauffer D 1992 Introduction to percolation theory (2nd ed)London UK Taylor amp Francis
Tobler WR and Z Chen 1986 A quadtree for global infor-mation storage GeographicalAnalysis 18(4) 360-71
White D A J Kimerling and WS Overton 1992 Carto-graphic and geometric components of a global samplingdesign for environmental monitoring Cartography and Geo-graphic Information Systems 195-22
White D AJ Kin1erlingK Sahr and L Song 1998 Comparingarea and shape distortion on polyhedral-based recursive partitionsof the sphere International Journal of Geographiad Information Science12 805-27
Wolfram S 1986 Cellular automaton fluids 1 Basic theoryjournal of Statistical Physics 45471-526 bull
(5)Zone perimeter = 2XTCXr(co~)
ZSG = SQ1middott(4XTCxcellarea - cellarea2lr2) I cellperimeter (6)
Zone Standardized Compactness (ZSC) isgiven by Zone perimeterCell perimeter Substi-tuting and combining equations we compute ZSCfrom
Baumgardner JR and PO Frederickson 1985 Icosahedraldiscretization of the two-sphere SIAM journal of NUrMricalAnalysis 22(6) 1107-15
Bomford G 1971 Geodesy Oxford The Clarendon Press731 pp
Brooks DR 1981 Grid systems for Earth radiation budgetexperiment applications NASA Technical Memorandum8323340 pp
Coexeter HSM 1962 The problem of packing a number ofequal nonoverlapping circles on a sphere Transactions NewYork Academy of Science Division of Mathematics Series IIvol 24 320-31
Dutton G 1988 Geodesic modeling of planetary relief Car-tographica 21 188-207
Dutton G 1994 Geographical grid models for environmentalmonitoring and analysis across the globe (panel session) InProceedings of GISUS 94 Conference Phoenix Arizona
cos$ =sqrt( IO-(IO-cellareal(2xTCX r2)) (4)
The perimeter of the spherical zone is thecircumference of the bounding parallel computedfrom
Gelarea = 2XTCxr2(lO-sin$) (2)
This research was supported by US Environ-mental Protection Agency-Oregon State Univer-sity Cooperative Agreement CR 821672 MatthewGregory Department of Geosciences graduatestudent created the centerpoint distance mapsseen in Figure 16 Dr Ralph Kahn NASA-JPLalso contributed significantly to this manuscriptThis manuscript has been subjected to EPA reviewand approved for publication The conclusionsand opinions are solely those of the authors andnot necessarily the viewsof the Agency
and
Setting the zone surface area equal to the cellarea we obtain
Vol 26 NO4 287
Del
iver
ed b
y P
ublis
hing
Tec
hnol
ogy
to O
rego
n S
tate
Uni
vers
ity IP
128
193
164
203
on
Sat
12
Nov
201
1 22
50
45C
opyr
ight
(c)
Car
togr
aphy
and
Geo
grap
hic
Info
rmat
ion
Soc
iety
All
right
s re
serv
ed
Remote Sensing for theEarth Sciences (3rd ed)Andrew Rencz
Recently adopted titlesin cartography GISremote sensingandGPS
Policy Issues in Modern art graph)DR Frazer Taylor (cd)
Wilderness NavigationBob and Mike Bums
I bullbull
ACS
Maps with the NewsMark Monmonier
Air Apparent HowMeteorologists Learnedto Map Predict andDramatize WeatherMark Monmonier
froooks
Mapping a Northern LandThe Survey of CanadaGerald McGrath and LouisSebert (eds)
Thematic Cartographyand VisualizationTerry A Slocum
1 it 11 bull
on Oirle ~y a30149j- ~24)
288 Cartography and Geographic Information Science
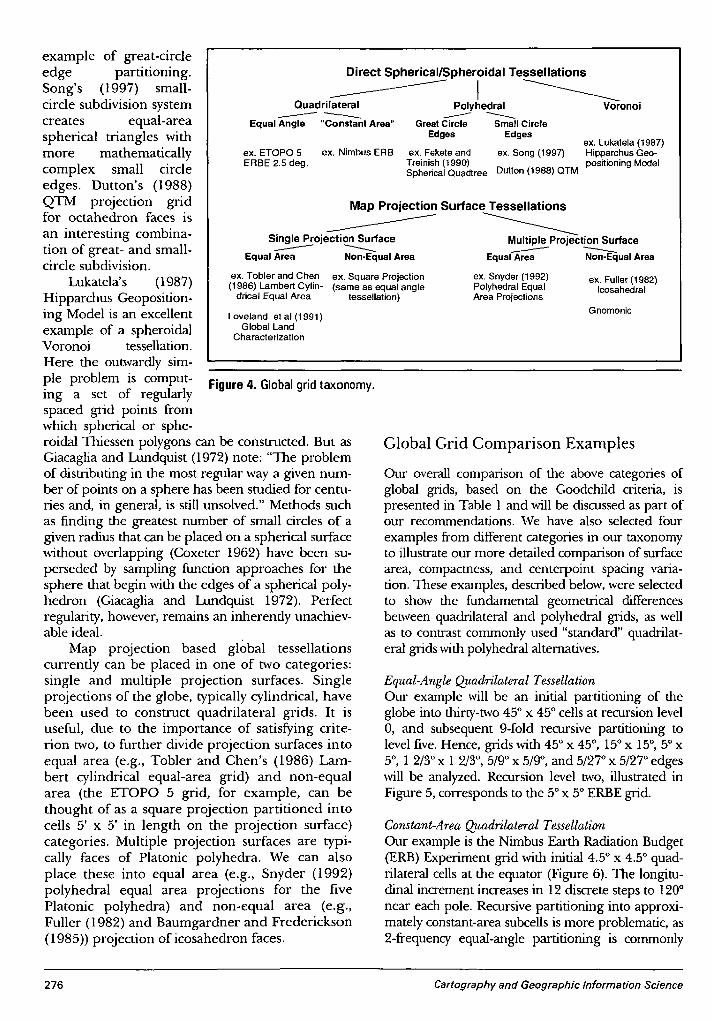
Del
iver
ed b
y P
ublis
hing
Tec
hnol
ogy
to O
rego
n S
tate
Uni
vers
ity IP
128
193
164
203
on
Sat
12
Nov
201
1 22
50
45C
opyr
ight
(c)
Car
togr
aphy
and
Geo
grap
hic
Info
rmat
ion
Soc
iety
All
right
s re
serv
ed
Map Projection Surface Tessellations
Single PrOj~ ~tion Surface-- ---- -- --Equal Area Non-Equal Area Equal Area Non-Equal Area
Gnomonic
ex Fuller (1982)Icosahedral
ex Snyder (1992)Polyhedral EqualArea Projections
ex lukatela (1987)ex Fekete and ex Song (1997) Hipparchus Geo-
Treinish (1990) positioning ModelSpherical Quadtree Dutton (1988) QTM
Constant-Area Quadrilateral TessellationOur example is the Nimbus Earth Radiation Budget(ERB) Experiment grid with initial 4S x 4S quad-rilateral cells at the equator (Figure 6) The longitu-dinal increment increases in 12 discrete steps to 120degnear each pole Recursive partitioning into approxi-mately constant-area subcells is more problematic as2-frequency equal-angle partitioning is commonly
Global Grid Comparison Examples
Equal-Angle Quadrilateral TessellationOur example will be an initial partitioning of theglobe into thirty-two45deg x 45deg cells at recursion level0 and subsequent 9-fold recursive partitioning tolevel fiveHence grids with 45deg x 45deg 15degx 15deg5degx5deg 1 23degx 1 23deg 59degx 59deg and 527degx 527degedgeswill be analyzed Recursion level two illustrated inFigure 5 corresponds to the 5degx 5degERBEgrid
Our overall comparison of the above categories ofglobal grids based on the Goodchild criteria ispresented in Table 1 and will be discussed as part ofour recommendations We have also selected fourexamples from different categories in our taxonomyto illustrate our more detailed comparison of surfacearea compactness and centerpoint spacing varia-tion These examples described belowwere selectedto show the fundamental geometrical differencesbetween quadrilateral and polyhedral grids as wellas to contrast commonly used standard quadrilat-eral grids with polyhedral alternatives
ex Nimbus ERS
Direct SphericaVSpheroidal Tessellations----- I _Quadrilateral Polyhedral Voronoi---- ---- --Equal Angle Constant Area Great Circle Small Circle
Edges Edges
ex ETOP05ERSE 25 deg
ex Tobler and Chen ex Square Projection(1986) lambert Cylin- (same as equal angle
drical Equal Area tessellation)
loveland et al (1991)Global land
Characterization
example of great-circleedge partitioningSongs (1997) small-circle subdivision systemcreates equal-areaspherical triangles withmore mathematicallycomplex small circleedges Duttons (1988)QTM projection gridfor octahedron faces isan interesting combina-tion of great- and small-circle subdivision
Lukatelas (1987)Hipparchus Geoposition-ing Model is an excellentexample of a spheroidalVoronoi tessellationHere the outwardly sim-ple problem is comput- Figure 4 Globalgrid taxonomying a set of regularlyspaced grid points fromwhich spherical or sphe-roidal Thiessen polygons can be constructed But asGiacaglia and Lundquist (1972) note The problemof distributing in the most regular way a given num-ber of points on a sphere has been studied for centu-ries and in general is still unsolved Methods suchas finding the greatest number of small circles of agiven radius that can be placed on a spherical surfacewithout overlapping (Coxeter 1962) have been su-perseded by sampling function approaches for thesphere that begin with the edges of a spherical poly-hedron (Giacaglia and Lundquist 1972) Perfectregularity however remains an inherently unachiev-able ideal
Map projection based global tessellationscurrently can be placed in one of two categoriessingle and multiple projection surfaces Singleprojections of the globe typically cylindrical havebeen used to construct quadrilateral grids It isuseful due to the importance of satisfying crite-rion two to further divide projection surfaces intoequal area (eg Tobler and Chens (1986) Lam-bert cylindrical equal-area grid) and non-equalarea (the ETOPO 5 grid for example can bethought of as a square projection partitioned intocells 5 x 5 in length on the projection surface)categories Multiple projection surfaces are typi-cally faces of Platonic polyhedra We can alsoplace these into equal area (eg Snyder (1992)polyhedral equal area projections for the fivePlatonic polyhedra) and non-equal area (egFuller (1982) and Baumgardner and Frederickson(1985raquo projection of icosahedron faces
276 Cartography and Geographic Information Science
Del
iver
ed b
y P
ublis
hing
Tec
hnol
ogy
to O
rego
n S
tate
Uni
vers
ity IP
128
193
164
203
on
Sat
12
Nov
201
1 22
50
45C
opyr
ight
(c)
Car
togr
aphy
and
Geo
grap
hic
Info
rmat
ion
Soc
iety
All
right
s re
serv
ed
Equal Angle GridFigure 5 Equal-angle quadrilat-eral grid for a 45deglongitude by 90deglatitude sectionof the globe
Constant Area GridFigure 6 Con-stant area quad-rilateral grid for a45deg longitude by90deg latitude sec-tion of the globe
SNYDER MAP PROJECTION
Figure 7 Icosahedral Snyder Equal Area (ISEA) projection of an icosahedron face (a) Tissotangular deformation isolines (b)
equivalence throughout (Figure 7) The projection ismade equal area by adjusting the scale outward fromthe center of each edge This results in increasedshape distortion as each of the three axes from thetriangle center to comer vertices is approached Amap of angular deformation across an icosahedronface (which is the result of our Tissot distortionanalysis based on the Gaussian basic quantity ap-proach outlined in Maling (1992raquo shows this patternof distortion
The equilateral triangular projection of eachicosahedron face is subdivided recursively into equi-lateral subtriangles in either the 4-fold or the 9-foldmanner illustrated in Figure 2 The bowing of trian-gle edges along the three axes of angular deforma-tion is apparent in Figure 8 where 4-fold subdivision
subtriangles of recur-sion level four are backprojected to the globeThis edge bowing is aprimary cause of varia-tions in compactnessamong subtriangles
We noted earlierthat triangular gridsallow hexagonalgrids to be createdthrough subtriangleaggregation and thathexagonal grids haveseveral advantagesrelated to global dataanalysis The ISEAtriangular grid inher-ently allows equal-area hexagons to beassembled at varying
Tissot Angular DeformationIcosahedron Face
employed for simplicity Breaking from tradition weemploy 3-frequency equal-angle partitioning tomaintain consistency in our comparisons while usingthe same basic partitioning method The initial 4Slatitude x variable longitude cells correspond ap-proximately to recursion level two in our equal-angletessellation with partitioning carried to recursionlevel 5 (IS OS 16deg latitude by variable longitudecell edges)
Equal-Area Map Projection Surface TessellationOur example is the Icosahedral Snyder Equal- Area(ISEA) projection (Snyder 1992) which transformseach icosahedron face on the globe into an equilat-eral planar triangle while maintaining area
Vol 26 No4 277
Del
iver
ed b
y P
ublis
hing
Tec
hnol
ogy
to O
rego
n S
tate
Uni
vers
ity IP
128
193
164
203
on
Sat
12
Nov
201
1 22
50
45C
opyr
ight
(c)
Car
togr
aphy
and
Geo
grap
hic
Info
rmat
ion
Soc
iety
All
right
s re
serv
ed
PARTITIONING COMPARISONFigure 8 Icosahedron faces that are4-fold partitioned to recursion levelfour on the ISEA and Fuller-Grayprojection surfaces then re-projected on an orthographic mapprojection to simulate the Earthssphericity
Snyder Projection
4 bull FOld SubdiVISionRecursion Level 4
Fuller-Gray Projection
Figure 9 Aggregation of 54 and 6 neighboring triangles on the ISEA pro-jection into equal area hexagonal cells forming 9-fold higher resolutiongrids
levels of spatial resolution For example aggre-gating sets of 54 neighboring triangles producesthe equal-area hexagonal grid for the icosahedronface shown in Figure 9a Again apparent is thebowing of hexagon edges along the three axes ofhigher angular deformation which should intro-duce larger compactness variations
Aggregating the same subtriangles into sets ofsix neighbors (Figure 9b) creates a nine timeshigher resolution hexagonal grid with edge bow-ing more localized along the three axes Becausenine of the small hexagons (seven fulland one-third of six adjacent) form thelarge hexagon the small hexagons area 9-fold subdivision of the large hexa-gons at the next higher level of recur-sion Further 9-fold partitioning of theunderlying subtriangles allows assem-bly into 9-fold smaller hexagons athigher levels of recursion
Non-Equal Area Map Projection SurfaceTessellationWe will use the Fuller-Gray projectionwhich is based on the geometrical ideabehind R Buckminster Fullers icosahe-dral world map projection (Fuller 1982)Fuller imagined the three edges of eachicosahedron face as flexible bands curvedto lie on the spherical surface (left half ofFigure 10) Each edge would be subdi-vided and holes drilled at n equallyspaced increments and flexible bandswould be strung between correspondingholes on adjacent edges This wouldcreate a triangular network of lines onthe sphere which could be flattened tocreate a regular grid of equilateral subtri-angles (right half of Figure 10)
278
Fuller imagined the verticesof each subtrianglebeing the projection of the corresponding line inter-section point on the sphere These intersectionpoints were later found physically impossible toachieve because each triplet of intersecting lines onthe globe forms a small triangle in the plane whosecenterpoint is the best approximation of Fullersidea Gray (1994) developed exact transformationequations for this approximation producing a com-promise projection having both small area andshape distortion
(a)
(b)
Cartography and Geographic Information Science
Del
iver
ed b
y P
ublis
hing
Tec
hnol
ogy
to O
rego
n S
tate
Uni
vers
ity IP
128
193
164
203
on
Sat
12
Nov
201
1 22
50
45C
opyr
ight
(c)
Car
togr
aphy
and
Geo
grap
hic
Info
rmat
ion
Soc
iety
All
right
s re
serv
ed
Figure 10 Fullers geometrical concept of an icosahedral map projection surface (Source Fuller1982)
The equilateral-triangle Fuller-Gray projec-tion of an icosahedron face is shown in Figure 11along with area-scale and angular-deformationmaps displaying results of our Tissot distortionanalysis Note the smooth increase in area-scaleand angular deformation from the triangle centerto each edge vertex Both recursive partitioningand triangle aggregation is performed identicallyto the Snyder projection The only differenceshould be the creation of non-equal area triangu-lar and hexagonal cells that vary less in compact-ness on average and that grade smoothly fromslightly higher to lower compactness (Figure 8)
Analyses and ResultsThe ideal comparison of global grid geometricalproperties would consist of computing surface areacompactness and other metrics at each level of re-cursion down to the spatial resolution correspondingto the smallest grid cell expected to be used in globalanalysis If the smallestcellwere 1 km2 for examplethe 9-fold partitioning of an icosahedron face mustbe carried out to recursion level eight meaning thatarea compactness centerpoint distance and othermetries must be computed for over 500 million cellsNaturally an infinite number of triangular hexago-nal or quadrilateral recursion levels and cells arepossible as recursive partitioning can continueindefinitely
We have found 9-fold partitioning to recursionlevels less than six to be suitable for comparisonpurposes because surface area compactness center-point spacing and other metries are still computableat the rapidly increasing cell densities However thecomputation effort quickly becomes immense athigher levels of recursion and the results may notadd significantlyto our understanding of the surface
Vol 26 No4
tessellation or gridpoint geomeoy
The normalizedarea zone standard-ized compactness andcenterpoint distanceanalyses that followare a representativesample of our fullresearch effort Thefour grid alternativesexamined were se-lected from the lOwestudied but resultsfrom only two of thefive recursion levelsweexamined are pre-sented here to illus-
trate the essential geometrical properties of the fullrange of quadrilateral and polyhedral grid alterna-tivesWe have limited the polyhedral analysis to thehexagonal tessellation because area and shape dis-tortion characteristics of triangular partitioning arepresented in a companion article (White et al 1998)
Normalized Area Map Comparison
bull Spheroidal areas were computed from sets ofclosely spaced geodetic latitude and longitudecoordinates along each cell edge (usually 11points along an edge) For the two quadrilat-eral tessellations the bounding parallels wereon the WGS 84 spheroid However for theFuller-Gray and Snyder projections onlyspherical equations were available so a morecomplex spheroidal transformation proce-dure had to be used This involved Projectingfrom the authalic sphere for the WGS 84ellipsoid to the plane using forward projec-tion equations
bull Partitioning on the planar projection surfacebull Back projecting cell edges and centerpoints to
spherical coordinates using the inversespherical equations for each projection and
bull Converting authalic to WGS 84 geodetic lati-tude using the transformation equationsfound in Snyder (1987) This allows the ori-ented spheroidal triangle summation method(Kimerling 1984) to be applied to the four(and other) global grid alternativesMaps comparing variations in normalized
surface area for the four discrete global grid ex-amples described above are presented in Figure12 The equal-angle and constant-area grids cover45deg of longitude by 90deg of latitude (equator to
279
Del
iver
ed b
y P
ublis
hing
Tec
hnol
ogy
to O
rego
n S
tate
Uni
vers
ity IP
128
193
164
203
on
Sat
12
Nov
201
1 22
50
45C
opyr
ight
(c)
Car
togr
aphy
and
Geo
grap
hic
Info
rmat
ion
Soc
iety
All
right
s re
serv
ed
Fuller-Grey map projection
Icosahedron Face Area Distortion Angular Deformation
Tissot distortion analysis
Figure 11 Fuller-Gray map projection and Tissot distortion analysis for an icosahedron face
pole) or 1I16th of the globe Each icosahedronface of course covers 120th of the globe so thatthe surface areas of comparison surfaces are ap-proximately the same The level of recursion foreach grid was selected so that the average cell areawithin each grid is nearly the same From thesemaps in Figure 12 it is apparent thatbull The larger range in normalized area (0069 -
1569 or 150 percent) associated with theequal-angle grid makes it as expected by farthe worst alternative of the four
bull The constant-area grid has a greater range ofnormalized area than either the Snyder orFuller-Gray grids The pattern of spatialvariation is one of identical normalized areawithin east-west bands Cell areas also de-crease slowly from south to north within thethree blocks in the bottom half of the maphaving identical meridians as cell boundariesSuch regularity is not present in the rows ofcells forming the top half of the map
bull Normalized hexagon areas on the Fuller-Grayprojection decrease smoothly from a value of106 (6 percent above average) at the icosahe-dron face center to a lower value of 0944near each corner The very low normalizedarea for the triangle at each corner is causedby this being one of five spherical triangles onadjacent icosahedron faces that together formone of 12 pentagonal cells on the globe Eachpentagon area is 56th that of the averagehexagonal cell which gives the lower normal-ized area
280
bull Normalized hexagon areas on the Snyderprojection are identical and just slightly largerthan 10 so as to offset the three smaller areasof corner pentagonal cells If the pentagonareas are removed from the calculations allhexagons are measured as having a 10 nor-malized surface area a numerical demonstra-tion that the Snyder equations for theicosahedron do indeed produce an equal areamap projection surfaceWe next examine the spatial pattern of nor-
malized area for hexagons at recursion levelsthree and four for the 9-fold partitioning of theFuller-Gray and Snyder projection surfaces Theresults are presented in the four orthographicmap projections of icosahedron faces shown inFigure 13 In each of the three Snyder projectiongrids the normalized areas of hexagonal cells areidentical but the normalized area value of thegrid rapidly approaches 10 as the level of recur-sion increases This is due to the progressivelysmaller contribution of the pentagonal cornercells to the total area of the icosahedron face
At increasing levelsof recursion the Fuller-Gray projection grids show a progressive smooth-ing of normalized area variation as the level ofrecursion increases By the fourth level thesmooth pattern of reduction in normalized areafrom the icosahedron center toward each edgeclosely mirrors the Tissot area distortion isolinesdefining the continuous area distortion surface Asexpected the spatial pattern of continuous Tissotarea distortion and of discrete normalized cell
Cartography and Geographic Information Science
Del
iver
ed b
y P
ublis
hing
Tec
hnol
ogy
to O
rego
n S
tate
Uni
vers
ity IP
128
193
164
203
on
Sat
12
Nov
201
1 22
50
45C
opyr
ight
(c)
Car
togr
aphy
and
Geo
grap
hic
Info
rmat
ion
Soc
iety
All
right
s re
serv
ed
Figure 12 Normalized-area comparison for basic segments of four global grids eachshown on an orthographic map projection to simulate the Earths sphericity
1110
1569
0069
09190813077
Figure 16 displays maps of an icosahedron face onthe Fuller-Gray and Snyder projection surfaces thatdepict variations in centerpoint distance betweenadjacent hexagons for 9-fold hexagonal partitioningat three levels of recursion (similar research on
Centerpoint Distance Map Comparison
and the other cells be-coming progressivelymore square in shape asthe equator ISapproached
bull The Snyder grid centerhexagon has the lowestcompactness (ignoringthe inherently lowercompactness pentagonsegments at each corner)The bowed pairs of hexa-gon edges along eachaxis of higher angulardeformation producelower compactness hexa-gons than those fartheraway from each axiswhere higher ZSC valuesvary only slightly and
bull Except for the lower com-pactness comer pentagoncells ZSCvalues across theFuller-Graygrid are consis-tently higher than the otherthree alternativeswith thehighest value at the icosahe-dron center and a slightsmooth decrease radiallyoutward from the centerAs done with normalized
area the spatial pattern ofZSC for hexagonal grids9-fold partitioned to recur-sion levels three and four wasexamined for the Fuller-Gray
and Snyder map projection surfaces (Figure 15)Both grids show a progressive smoothing of ZSCvalues also seen in the area analysis with increas-ing levels of recursion In both grids the spatialpattern of slightly lower to higher compactnessclosely mirrors the Tissot angular deformationisoline pattern for the map projection becomingspatially indistinguishable by recursion level fourHence Tissot angular deformation can be used topredict the spatial pattern of compactnessvariation
nyder
Equal Angle
1110
09190IIJ3077
FullerGray
Constant Area
Compactness Map Comparison
areas become indistinguishable at higher levels ofrecursIOn
Results from computation of Zone StandardizedCompactness (ZSC) for the four grid alternativesare presented in Figure 14 The portions of theglobe covered and levels of recursion selected forthe area comparisons are used here as well toinsure that the average cell area of each grid issimilar These four ZSCmaps show thatbull Compactness variation is greatest by far for
the equal-angle grid as the basic cell shapesvary from narrow spherical triangles at thepole to spherical squares at the equator
bull There is relatively little variation in compact-ness across the constant-area grid in spite ofthe cell at the pole being triangular in shape
Vol 26 No4 281
Del
iver
ed b
y P
ublis
hing
Tec
hnol
ogy
to O
rego
n S
tate
Uni
vers
ity IP
128
193
164
203
on
Sat
12
Nov
201
1 22
50
45C
opyr
ight
(c)
Car
togr
aphy
and
Geo
grap
hic
Info
rmat
ion
Soc
iety
All
right
s re
serv
ed
Figure 13 Normalized-areacomparison for two recursionlevels of the Fuller-Gray andISEA grids each shown on anorthographic map projection tosimulate the Earthssphericity
9-Fold Recursion Level 31060
fl
nil r ra n der
ld e ur ion Le el 4
FullerGray
1060
O9n J
U71~
Snyder
quadrilateral centerpoint distance for the equal-angle and constant-area grids is underway) Thisexample of our centerpoint distance analysis showshow variations in great-circle distance between adja-cent pairs of hexagon centers can be mapped
The six equilateral triangles fonning each hexa-gon can be thought of as map symbols shaded ac-cording to the distance between the hexagon centerand the centerpoint of adjacent hexagons to thenorth (0deg) northeast (60deg) southeast (120deg) south(180deg) southwest (240deg) and northwest (300deg) as-suming north to be at the top of the page
At the lowest level of recursion (top-rightmap) the general pattern of larger (darker gray)and smaller (lighter gray) distances relative to theaverage (medium gray) centerpoint to centerpointdistance are aligned with the three axes of higherangular deformation for the Snyder projection aswe would expect The shortest distances are alongeach axis and the longest distances are adjacentand roughly perpendicular to each axis Thisspatial pattern of centerpoint distance variation
282
persists and becomes better defined at the nexttwo higher levels of recursion At the highest levelexamined here (bottom-right map) the largerand smaller distances clearly are localized alongeach axis grading toward average values in apropeller-like pattern that corresponds with theTissot angular deformation isolines Indeed theTissot diagram in Figure 7 is an excellent predic-tor of where variations in centerpoint distanceshould occur on the Snyder grid
The spatial pattern of centerpoint distance varia-tion for the hexagonally partitioned Fuller-Grayprojection surfaceis not easilydiscerned at the lowestlevel of recursion (upper-left map) but becomesreadily visible at the next two higher levelsAs withthe Snyder projection Tissot angular deformationisolines predict the spatial pattern of little variationin the center of the icosahedron face with progres-sivelylarger centerpoint distance variations (often inlonger-shorter distance adjacent pairs) as each edgeis approached Overall there appears to be slightlyless centerpoint distancevariation on the Fuller-Gray
Cartography and Geographic Information Science
Del
iver
ed b
y P
ublis
hing
Tec
hnol
ogy
to O
rego
n S
tate
Uni
vers
ity IP
128
193
164
203
on
Sat
12
Nov
201
1 22
50
45C
opyr
ight
(c)
Car
togr
aphy
and
Geo
grap
hic
Info
rmat
ion
Soc
iety
All
right
s re
serv
ed
Figure 14 Compactness comparison for basic segments offour global grids each shown on an orthographic map projec-tion to simulate the Earths sphericity
the icosahedron face always creates 12 penta-gons on the globe exactly 56th the area of eachhexagon the surface area standard deviation forthe Snyder grid will always be slightly greaterthan zero even though there is no area variationamong the hexagons formed However at pro-gressively higher levels of recursion the 12pentagons occupy increasingly less of the totalsurface area and the standard deviation for theentire globe rapidly approaches zero Hencethis graph shows the Snyder grid to be clearlysuperior for hexagonal subcells less than100000 km2 in area
Variation in centerpoint spacing between adja-cent cells for the four grid alternatives can be ana-lyzed by graphing logarithmically the standarddeviation in normalized centerpoint spacingagainst average cell area at increasing levels ofrecursion (Figure 18) This graph shows the gridsto perform similarly except for the poorly per-forming EqualAngleQuadrilateral grid The Fullerand Constant Area Quadrilateral grids converge athigher recursion levels to essentially identical lowstandard deviations closely followed by the Snydergrid
Average subcell compactness values for thefour grids (Figure 19) shows the superior perform-ance of icosahedral models over quadrilateralwhich is to be expected since hexagonal shapes are
bullbull~
nyder
Equal Angle
FuUerGra
Constant Area
9middotFold Recur ion Level 4
FuJlerGra ~ n der
0951
U95
09-10U9IJOll(S
9-FoldRecursion Level 3
FullerGray Snyder
Because variation in cell surface area is amajor concern for geostatisticians andothers we analyzed the variation innormalized cell area with increasinglevels of recursion Figure 17 is a loga-rithmic graph of the standard deviationin normalized-cell area versus the de-creasing average-cell area at increasinglevels of recursion for the four discreteglobal grid alternatives (but only thehexagonal grids formed by Snyder andFuller-Gray projection subtriangles)examined graphically above Recogniz-ing that the hexagonal partitioning of
Figure 15 Compactness comparison for tworecursion levels of the Fuller-Gray and ISEAgrids each shown on an orthographic mapprojection to simulate the Earths sphericity
hexagonal grid but this can only be shownconclusivelyby a statistical comparison ofalternativegrids
Statistical Comparison Results
Vol 26 NO4 283
Del
iver
ed b
y P
ublis
hing
Tec
hnol
ogy
to O
rego
n S
tate
Uni
vers
ity IP
128
193
164
203
on
Sat
12
Nov
201
1 22
50
45C
opyr
ight
(c)
Car
togr
aphy
and
Geo
grap
hic
Info
rmat
ion
Soc
iety
All
right
s re
serv
ed
140km
190km
560 km
1300 kIT
1650 kIT
425 m
SnyderProjection
RecursionLevel 7
RecursionLevel 3
RecursionLevel 5
Fuller-GrayProjection
Figure 16 Variations in hexagonal centerpoint spacing at three levels of recursionfor the Fuller and ISEA Grids on an icosahedron face
In addition to the detailed nu-merical analysis of grid-cellarea compactness and center-point spacing at different levelsof recursion we carried out anoverall comparison of numerous
Summary Rankings
inherently more compact thanrectangular shapes At all levels ofrecursion the Fuller grid is com-prised of hexagons slightly morecompact than correspondingSnyder grid hexagons both beingfar more compact than the corre-sponding constant area and equalangle grid quadrilaterals
Variation in subcell compact-ness seen by graphing the stan-dard deviation of cell compactnessvalues against average cell area(Figure 20) shows the slightlybetter performance of the Fullergrid over the Snyder grid athigher levels of recursion Theconstant-area grid has the lowestoverall standard deviation at itsinitial resolution (level 0) but itsstandard deviation increases rap-idly as the initial cells are parti-tioned in an equal-angle mannerHowever the poor performanceassociated with the equal-anglegrid at all levels of recursion isnever approached
l2 Equal Angle Quadrilateral1 05 Bgt 0- 3GlC RecursionC 01 Level Constant Area QuadrilateralbullIII 1 0 8
3C ~1 2l bull 83 4 5III
1 2 Fuller-Gray ProjectionenIII 01Glbullc(
4i0C 001
~ia 5Ebull0Z 0001
107
106
105 4 3 2
10 10 102Average Cell Area km (log10 scale)
discrete global grid alternatives in-cluding the seven presented in Table1 Eleven of the fourteen Goodchildcriteria were investigated along withtwo related criteria deemed signifi-cant for global grid comparison ForGoodchild criteria 2 4 and 5 a sum-mary ordinal ranking from 1 (verypoor) to 10 (best possible) was devel-oped based on the quantitative analy-sis of comparison metrics
Table 1 provides informationcrucial to the selection of a global
Figure 17 Normalized subcell area standarddeviation vs average cell area for four globalgrids
284 Cartography and Geographic Information Science
Del
iver
ed b
y P
ublis
hing
Tec
hnol
ogy
to O
rego
n S
tate
Uni
vers
ity IP
128
193
164
203
on
Sat
12
Nov
201
1 22
50
45C
opyr
ight
(c)
Car
togr
aphy
and
Geo
grap
hic
Info
rmat
ion
Soc
iety
All
right
s re
serv
ed
Criterion Equal Angle Constant Area Snyder Fuller-Gray Small Circle Dir Sphere Gnomonic
1 Domain is globe yes yes yes yes yes yes yes
2 Equal areal 1 7 10 8 10 6 3
3 Same topology yes no yes yes yes yes yes
4 Equal shape 1 3 7 8 7 9 9
5 Compactnessmiddot 1 4 7 8 8 8 9
6 Straight edges onprojection na2 na yes yes na na yes
7 Perimeter bisection J ni ni ni ni ni nin1
8 Hierarchy yes yes yes4 yes4 yes4 yes4 yes4
9 Single point yes yes yes yes yes yes yes
10 Maximally centered ni ni ni ni ni ni ni
11 Equidistant no no no no no no no
12 Addressing ni ni ni ni oi ni ni13 LatitudelLongitude yes yes yes yes yes yes yes
14 Arbitrary resolution yes yes yes yes yes yes yes
Geodesic edge lines no no no no no yes yes
Spatial nature of area Continuously Part continu- Constant Continuously Constant Fractal-like Continuouslyvariation varying ous part varying varying
irregular
IBest possible = 10 very good = 9 -7 very poor = 1
2 na = not applicable
J ni = not investigated
4 Only the triangular cells not the hexagonal are hierarchical in these grids
Table 1 Evaluation of Goodchilds and related comparison criteria for different global grids
Figure 18 Normalized centerpoint distance standard deviation vs average cellarea for four global grids
ConclusionsThe global grid evaluation crite-ria and associated metrics haveallowed us to compare gridsvarying widely in cell geometryand topology We have observedthat the prime areas of concernamong the small portion of theglobal data user community wehave interacted with to date areequal-area cells and a nested
spherical subdivision the small circle subdivisionmethod and the Fuller-Gray map projection forthe icosahedron If good overall performance is ofparamount concern the triangular andor hex-agonal partitioning of the Fuller-Gray projectionsurface might be selected due to the low variationin compactness of highly compact cells that vary
slightly in area in a continuouslyvarying predictable manner
2 3 4 6
JL------ ~2 1 2 3Constant Area Quadrilateral
Equal Angle Quadrilateral2 38 8
o~RecursionLevel
Snyder Projection ~Fuller-Gray 1
Projection
ampoc i 100gtQG)aiCcEG)1lIo ~ 01isNrn=G)~~S~ III 011-------------------------------
B l 11 1~ 1~ 1~ 1~2Average Cell Area km (log0 scale)
grid based on the relative importance of evalua-tion criteria from the users perspective If cellcompactness is of prime importance for examplea triangular or hexagonal grid based on partition-ing a Gnomonic map projection of an icosahe-dron face (not discussed in this article) would bethe best alternative closely followed by direct
Vol 26 No4 285
Del
iver
ed b
y P
ublis
hing
Tec
hnol
ogy
to O
rego
n S
tate
Uni
vers
ity IP
128
193
164
203
on
Sat
12
Nov
201
1 22
50
45C
opyr
ight
(c)
Car
togr
aphy
and
Geo
grap
hic
Info
rmat
ion
Soc
iety
All
right
s re
serv
ed
Figure 19 Normalized subcell average compactness VS average cell area for fourglobal grids
Figure 20 Normalized subcell compactness standard deviation vs average cellarea for four global grids
(1)
Equal Angle Quadrilateral
2 3 4 5bull 0
2 3 4 5
1 2 3 Constant Area auadrilateral
2Equal Angle Quadrilateral
3 4 5
Zone area = 2x 1tX r2 (10 - sin $)
RecursionLevel
o0-0 ---_e_----lto---
RecursionLevel
APPENDIXZone Standardized Compactness
(ZSC)Derivation
6 5 4 310 10 10 10
Average Cell Area km2 (10910 scale)
------ --_---lt~ 2 3 4
o
where r is the radius of the sphere and ltP is thelatitude of the bounding parallel
The surface area of a spherical zone is computedfrom
will give a full picture of the strengths and weak-nesses of current global grid alternatives
o
Constant AreaQuadrilateral
_~~ iFuller-Gray 1 2 Projection 3 4 5
o
Fuller-GrayProjection 1
Snyder Projection 1gt-------------------
05
00011------7---- ----------4 -----r--~2
10 10 10 10 10 102Average Cell Area km (10910scale)
CIl()CI)5 01 =() r~2Emlt3 ~- C 01=Gl 0 =0CO
111iii iii 001 =Ebulloz
IIIIII
CII CIImS 09tll ()bullbull tllClIogt Elt0o
08
hierarchy among cells (criteria 2and 8) Both the quadrilateralgrids and triangular forms ofpolyhedral grids examined herecan be partitioned recursivelyallowing a nested hierarchy tobe created Equal-area cells isthe critical criterion since cur-rently employed equal-angleand constant-area quadrilateralgrids can never be equal areaand were shown to performpoorly in this respect relative toseveral alternative grids
Only two global grids thosebased on the triangular partition-ing of the Icosahedral SnyderEqual Area (ISFA)projection andpartitioning using the Small Cir-cle Subdivision method (not dis-cussed in this article but describedin Song 1997)will produce equal-area cells on the spheroid TheSmall Circle Subdivision methodhas the advantage of producingcells slightly more compact butthe ISFA grid is currently moreefficient to compute and easier toimplement Consequently werecommend the ISFA as the bestcurrent choice for an equal areaglobal grid Whichever global gridis selected there are implementa-tion issues that must be addressedin future research includingbull Implementing an efficient
addressing scheme for bin-ning data into grid cells
bull Creating algorithms for fasttranslation of gridded data to and from geo-detic latitude and longitude
bull Developing efficient algorithms for aggrega-tion and disaggregation among nested gridlevels and
bull Implementing efficient data storage andaccess schemes for data in nested cells includ-ing metadata storage and accessWe have begun to address several of these im-
plementation facets for the ISFA grid beginningwith an ETOP05 DEM dataset binning experimentconducted at several levels of recursion (seehttpbufogeoorstedufirmatdgg for binning ex-amples) Performing similar implementation experi-ments on additional datasets using other candidategrids would provide a complementary grid compari-son that together with our geometrical comparisons
286 Cartography and Geographic Information Science
Del
iver
ed b
y P
ublis
hing
Tec
hnol
ogy
to O
rego
n S
tate
Uni
vers
ity IP
128
193
164
203
on
Sat
12
Nov
201
1 22
50
45C
opyr
ight
(c)
Car
togr
aphy
and
Geo
grap
hic
Info
rmat
ion
Soc
iety
All
right
s re
serv
ed
REFERENCES
ACKNOWLEDGMENTS
so that
EidenshinkJC andJL Faundeen 1994 The 1 km AVHRRglobal land data set First stages of implementation Inierna-tionaljournal of Remote Sensing 153443-62
Fekete G and L Treinish 1990 Sphere quadtree A newdata structure to support the visualization of sphericallydistributed data SPIE Extracting rManing from complex dataProcessing display interaction Vol 1259 pp 242-53
Fuller RB 1982 SynergeticJ NewYork MacMillanGiacaglia GEO and CA Lundquist 1972 Sampling func-
tions for geophysics Smithsonian A5trvphysical Observatory Spe-cial Report No 344 93 pp
Goodchild MF 1994 Geographical grid models for environ-mental monitoring and analysis across the globe (panelsession) In proceddings of GISUS 94 Conference PhoenixArizona
Gray RW 1994 Exact transformation equations for Fullersworld map Cartography and Geographic Informatian Systems21(4) 243-46
Hastings DA 1996 The global land l-km base elevationdigital elevation model A progress report Global ChangeNewsletter 27 11-12
Heikes R and DA Randall 1995 Numerical integration ofthe shallow-water equations on a twisted icosahedral gridPart I Basic design and results of tests Monthly WeatherReview 123 1862-80
Kahn R 1995 What shall we do with the data we are expect-ing in 1998 In Proceedings of the Massive Data SelJ WorkshopCommittee on Applied and Theoretical Statistics NationalAcademy of Sciences Washington DC
Kimerling AJ 1984 Area computation from geodetic coordi-nates on the spheroid Surveying and Mapping 44(4) 343-51
Kimerling AJ D White K Sahr and L Song 1995 Devel-opment of global sampling grid Mid-project report Samplingdesign and statistics research for EMAP Program us Environ-mental Protection Agency Corvallis Oregon
Loveland TR JW Merchant D O Ohlen and JF Brown1991 Development of a land-cover characteristics databasefor the conterminous US Photogrammetric Engineering andRemote Sensing 57(11) 1453-63
Lukatela H 1987 Hipparchus geopositioning model Anoverview In Proceedings of Auto Carto 8 Symposium Balti-more Maryland pp 87-96
Maling DH 1992 Coordinate systems and map projectioru (2nded) Oxford UK Pergamon Press
Muehrcke PC and JO Muehrcke 1997 Map we (4th ed) Madi-sonWisconsinJP Publications
Olea RO 1984 Sanlpling design optimization for spatial functionsMathematical Geowgy 16369-92
Saff EB and ABJ Kuijlaars 1997 Distnbuting many points on asphere The Mathematical Intelligencer 19(1)5-11
Slade G 1994 Self avoiding walks The MaJhematical Intelligencer16(1)29-35
Snyder JP 1987 Map projectioru-A working manual Wash-ington DC US Government Printing Office
Snyder JP 1992 An equal-area map projection for polyhe-dral globes Cartographica 29(1) 10-21
Song L 1997 Small circle subdivision method for develop-ment of global sampling grid Unpublished Masters thesisOregon State University 176 pp
Stauffer D 1992 Introduction to percolation theory (2nd ed)London UK Taylor amp Francis
Tobler WR and Z Chen 1986 A quadtree for global infor-mation storage GeographicalAnalysis 18(4) 360-71
White D A J Kimerling and WS Overton 1992 Carto-graphic and geometric components of a global samplingdesign for environmental monitoring Cartography and Geo-graphic Information Systems 195-22
White D AJ Kin1erlingK Sahr and L Song 1998 Comparingarea and shape distortion on polyhedral-based recursive partitionsof the sphere International Journal of Geographiad Information Science12 805-27
Wolfram S 1986 Cellular automaton fluids 1 Basic theoryjournal of Statistical Physics 45471-526 bull
(5)Zone perimeter = 2XTCXr(co~)
ZSG = SQ1middott(4XTCxcellarea - cellarea2lr2) I cellperimeter (6)
Zone Standardized Compactness (ZSC) isgiven by Zone perimeterCell perimeter Substi-tuting and combining equations we compute ZSCfrom
Baumgardner JR and PO Frederickson 1985 Icosahedraldiscretization of the two-sphere SIAM journal of NUrMricalAnalysis 22(6) 1107-15
Bomford G 1971 Geodesy Oxford The Clarendon Press731 pp
Brooks DR 1981 Grid systems for Earth radiation budgetexperiment applications NASA Technical Memorandum8323340 pp
Coexeter HSM 1962 The problem of packing a number ofequal nonoverlapping circles on a sphere Transactions NewYork Academy of Science Division of Mathematics Series IIvol 24 320-31
Dutton G 1988 Geodesic modeling of planetary relief Car-tographica 21 188-207
Dutton G 1994 Geographical grid models for environmentalmonitoring and analysis across the globe (panel session) InProceedings of GISUS 94 Conference Phoenix Arizona
cos$ =sqrt( IO-(IO-cellareal(2xTCX r2)) (4)
The perimeter of the spherical zone is thecircumference of the bounding parallel computedfrom
Gelarea = 2XTCxr2(lO-sin$) (2)
This research was supported by US Environ-mental Protection Agency-Oregon State Univer-sity Cooperative Agreement CR 821672 MatthewGregory Department of Geosciences graduatestudent created the centerpoint distance mapsseen in Figure 16 Dr Ralph Kahn NASA-JPLalso contributed significantly to this manuscriptThis manuscript has been subjected to EPA reviewand approved for publication The conclusionsand opinions are solely those of the authors andnot necessarily the viewsof the Agency
and
Setting the zone surface area equal to the cellarea we obtain
Vol 26 NO4 287
Del
iver
ed b
y P
ublis
hing
Tec
hnol
ogy
to O
rego
n S
tate
Uni
vers
ity IP
128
193
164
203
on
Sat
12
Nov
201
1 22
50
45C
opyr
ight
(c)
Car
togr
aphy
and
Geo
grap
hic
Info
rmat
ion
Soc
iety
All
right
s re
serv
ed
Remote Sensing for theEarth Sciences (3rd ed)Andrew Rencz
Recently adopted titlesin cartography GISremote sensingandGPS
Policy Issues in Modern art graph)DR Frazer Taylor (cd)
Wilderness NavigationBob and Mike Bums
I bullbull
ACS
Maps with the NewsMark Monmonier
Air Apparent HowMeteorologists Learnedto Map Predict andDramatize WeatherMark Monmonier
froooks
Mapping a Northern LandThe Survey of CanadaGerald McGrath and LouisSebert (eds)
Thematic Cartographyand VisualizationTerry A Slocum
1 it 11 bull
on Oirle ~y a30149j- ~24)
288 Cartography and Geographic Information Science
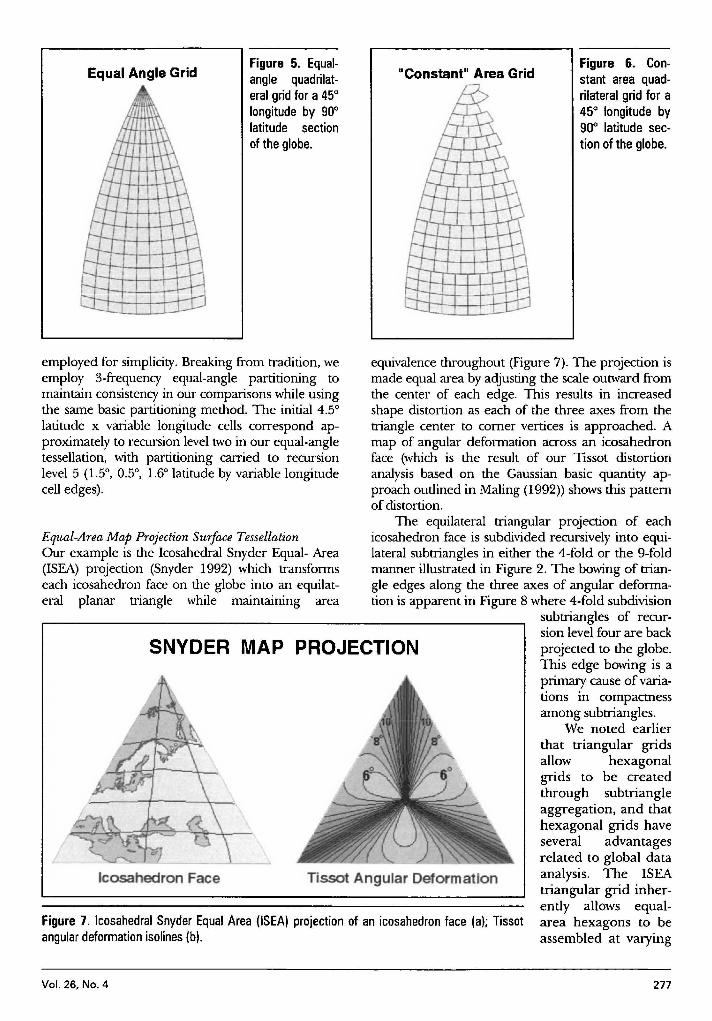
Del
iver
ed b
y P
ublis
hing
Tec
hnol
ogy
to O
rego
n S
tate
Uni
vers
ity IP
128
193
164
203
on
Sat
12
Nov
201
1 22
50
45C
opyr
ight
(c)
Car
togr
aphy
and
Geo
grap
hic
Info
rmat
ion
Soc
iety
All
right
s re
serv
ed
Equal Angle GridFigure 5 Equal-angle quadrilat-eral grid for a 45deglongitude by 90deglatitude sectionof the globe
Constant Area GridFigure 6 Con-stant area quad-rilateral grid for a45deg longitude by90deg latitude sec-tion of the globe
SNYDER MAP PROJECTION
Figure 7 Icosahedral Snyder Equal Area (ISEA) projection of an icosahedron face (a) Tissotangular deformation isolines (b)
equivalence throughout (Figure 7) The projection ismade equal area by adjusting the scale outward fromthe center of each edge This results in increasedshape distortion as each of the three axes from thetriangle center to comer vertices is approached Amap of angular deformation across an icosahedronface (which is the result of our Tissot distortionanalysis based on the Gaussian basic quantity ap-proach outlined in Maling (1992raquo shows this patternof distortion
The equilateral triangular projection of eachicosahedron face is subdivided recursively into equi-lateral subtriangles in either the 4-fold or the 9-foldmanner illustrated in Figure 2 The bowing of trian-gle edges along the three axes of angular deforma-tion is apparent in Figure 8 where 4-fold subdivision
subtriangles of recur-sion level four are backprojected to the globeThis edge bowing is aprimary cause of varia-tions in compactnessamong subtriangles
We noted earlierthat triangular gridsallow hexagonalgrids to be createdthrough subtriangleaggregation and thathexagonal grids haveseveral advantagesrelated to global dataanalysis The ISEAtriangular grid inher-ently allows equal-area hexagons to beassembled at varying
Tissot Angular DeformationIcosahedron Face
employed for simplicity Breaking from tradition weemploy 3-frequency equal-angle partitioning tomaintain consistency in our comparisons while usingthe same basic partitioning method The initial 4Slatitude x variable longitude cells correspond ap-proximately to recursion level two in our equal-angletessellation with partitioning carried to recursionlevel 5 (IS OS 16deg latitude by variable longitudecell edges)
Equal-Area Map Projection Surface TessellationOur example is the Icosahedral Snyder Equal- Area(ISEA) projection (Snyder 1992) which transformseach icosahedron face on the globe into an equilat-eral planar triangle while maintaining area
Vol 26 No4 277
Del
iver
ed b
y P
ublis
hing
Tec
hnol
ogy
to O
rego
n S
tate
Uni
vers
ity IP
128
193
164
203
on
Sat
12
Nov
201
1 22
50
45C
opyr
ight
(c)
Car
togr
aphy
and
Geo
grap
hic
Info
rmat
ion
Soc
iety
All
right
s re
serv
ed
PARTITIONING COMPARISONFigure 8 Icosahedron faces that are4-fold partitioned to recursion levelfour on the ISEA and Fuller-Grayprojection surfaces then re-projected on an orthographic mapprojection to simulate the Earthssphericity
Snyder Projection
4 bull FOld SubdiVISionRecursion Level 4
Fuller-Gray Projection
Figure 9 Aggregation of 54 and 6 neighboring triangles on the ISEA pro-jection into equal area hexagonal cells forming 9-fold higher resolutiongrids
levels of spatial resolution For example aggre-gating sets of 54 neighboring triangles producesthe equal-area hexagonal grid for the icosahedronface shown in Figure 9a Again apparent is thebowing of hexagon edges along the three axes ofhigher angular deformation which should intro-duce larger compactness variations
Aggregating the same subtriangles into sets ofsix neighbors (Figure 9b) creates a nine timeshigher resolution hexagonal grid with edge bow-ing more localized along the three axes Becausenine of the small hexagons (seven fulland one-third of six adjacent) form thelarge hexagon the small hexagons area 9-fold subdivision of the large hexa-gons at the next higher level of recur-sion Further 9-fold partitioning of theunderlying subtriangles allows assem-bly into 9-fold smaller hexagons athigher levels of recursion
Non-Equal Area Map Projection SurfaceTessellationWe will use the Fuller-Gray projectionwhich is based on the geometrical ideabehind R Buckminster Fullers icosahe-dral world map projection (Fuller 1982)Fuller imagined the three edges of eachicosahedron face as flexible bands curvedto lie on the spherical surface (left half ofFigure 10) Each edge would be subdi-vided and holes drilled at n equallyspaced increments and flexible bandswould be strung between correspondingholes on adjacent edges This wouldcreate a triangular network of lines onthe sphere which could be flattened tocreate a regular grid of equilateral subtri-angles (right half of Figure 10)
278
Fuller imagined the verticesof each subtrianglebeing the projection of the corresponding line inter-section point on the sphere These intersectionpoints were later found physically impossible toachieve because each triplet of intersecting lines onthe globe forms a small triangle in the plane whosecenterpoint is the best approximation of Fullersidea Gray (1994) developed exact transformationequations for this approximation producing a com-promise projection having both small area andshape distortion
(a)
(b)
Cartography and Geographic Information Science
Del
iver
ed b
y P
ublis
hing
Tec
hnol
ogy
to O
rego
n S
tate
Uni
vers
ity IP
128
193
164
203
on
Sat
12
Nov
201
1 22
50
45C
opyr
ight
(c)
Car
togr
aphy
and
Geo
grap
hic
Info
rmat
ion
Soc
iety
All
right
s re
serv
ed
Figure 10 Fullers geometrical concept of an icosahedral map projection surface (Source Fuller1982)
The equilateral-triangle Fuller-Gray projec-tion of an icosahedron face is shown in Figure 11along with area-scale and angular-deformationmaps displaying results of our Tissot distortionanalysis Note the smooth increase in area-scaleand angular deformation from the triangle centerto each edge vertex Both recursive partitioningand triangle aggregation is performed identicallyto the Snyder projection The only differenceshould be the creation of non-equal area triangu-lar and hexagonal cells that vary less in compact-ness on average and that grade smoothly fromslightly higher to lower compactness (Figure 8)
Analyses and ResultsThe ideal comparison of global grid geometricalproperties would consist of computing surface areacompactness and other metrics at each level of re-cursion down to the spatial resolution correspondingto the smallest grid cell expected to be used in globalanalysis If the smallestcellwere 1 km2 for examplethe 9-fold partitioning of an icosahedron face mustbe carried out to recursion level eight meaning thatarea compactness centerpoint distance and othermetries must be computed for over 500 million cellsNaturally an infinite number of triangular hexago-nal or quadrilateral recursion levels and cells arepossible as recursive partitioning can continueindefinitely
We have found 9-fold partitioning to recursionlevels less than six to be suitable for comparisonpurposes because surface area compactness center-point spacing and other metries are still computableat the rapidly increasing cell densities However thecomputation effort quickly becomes immense athigher levels of recursion and the results may notadd significantlyto our understanding of the surface
Vol 26 No4
tessellation or gridpoint geomeoy
The normalizedarea zone standard-ized compactness andcenterpoint distanceanalyses that followare a representativesample of our fullresearch effort Thefour grid alternativesexamined were se-lected from the lOwestudied but resultsfrom only two of thefive recursion levelsweexamined are pre-sented here to illus-
trate the essential geometrical properties of the fullrange of quadrilateral and polyhedral grid alterna-tivesWe have limited the polyhedral analysis to thehexagonal tessellation because area and shape dis-tortion characteristics of triangular partitioning arepresented in a companion article (White et al 1998)
Normalized Area Map Comparison
bull Spheroidal areas were computed from sets ofclosely spaced geodetic latitude and longitudecoordinates along each cell edge (usually 11points along an edge) For the two quadrilat-eral tessellations the bounding parallels wereon the WGS 84 spheroid However for theFuller-Gray and Snyder projections onlyspherical equations were available so a morecomplex spheroidal transformation proce-dure had to be used This involved Projectingfrom the authalic sphere for the WGS 84ellipsoid to the plane using forward projec-tion equations
bull Partitioning on the planar projection surfacebull Back projecting cell edges and centerpoints to
spherical coordinates using the inversespherical equations for each projection and
bull Converting authalic to WGS 84 geodetic lati-tude using the transformation equationsfound in Snyder (1987) This allows the ori-ented spheroidal triangle summation method(Kimerling 1984) to be applied to the four(and other) global grid alternativesMaps comparing variations in normalized
surface area for the four discrete global grid ex-amples described above are presented in Figure12 The equal-angle and constant-area grids cover45deg of longitude by 90deg of latitude (equator to
279
Del
iver
ed b
y P
ublis
hing
Tec
hnol
ogy
to O
rego
n S
tate
Uni
vers
ity IP
128
193
164
203
on
Sat
12
Nov
201
1 22
50
45C
opyr
ight
(c)
Car
togr
aphy
and
Geo
grap
hic
Info
rmat
ion
Soc
iety
All
right
s re
serv
ed
Fuller-Grey map projection
Icosahedron Face Area Distortion Angular Deformation
Tissot distortion analysis
Figure 11 Fuller-Gray map projection and Tissot distortion analysis for an icosahedron face
pole) or 1I16th of the globe Each icosahedronface of course covers 120th of the globe so thatthe surface areas of comparison surfaces are ap-proximately the same The level of recursion foreach grid was selected so that the average cell areawithin each grid is nearly the same From thesemaps in Figure 12 it is apparent thatbull The larger range in normalized area (0069 -
1569 or 150 percent) associated with theequal-angle grid makes it as expected by farthe worst alternative of the four
bull The constant-area grid has a greater range ofnormalized area than either the Snyder orFuller-Gray grids The pattern of spatialvariation is one of identical normalized areawithin east-west bands Cell areas also de-crease slowly from south to north within thethree blocks in the bottom half of the maphaving identical meridians as cell boundariesSuch regularity is not present in the rows ofcells forming the top half of the map
bull Normalized hexagon areas on the Fuller-Grayprojection decrease smoothly from a value of106 (6 percent above average) at the icosahe-dron face center to a lower value of 0944near each corner The very low normalizedarea for the triangle at each corner is causedby this being one of five spherical triangles onadjacent icosahedron faces that together formone of 12 pentagonal cells on the globe Eachpentagon area is 56th that of the averagehexagonal cell which gives the lower normal-ized area
280
bull Normalized hexagon areas on the Snyderprojection are identical and just slightly largerthan 10 so as to offset the three smaller areasof corner pentagonal cells If the pentagonareas are removed from the calculations allhexagons are measured as having a 10 nor-malized surface area a numerical demonstra-tion that the Snyder equations for theicosahedron do indeed produce an equal areamap projection surfaceWe next examine the spatial pattern of nor-
malized area for hexagons at recursion levelsthree and four for the 9-fold partitioning of theFuller-Gray and Snyder projection surfaces Theresults are presented in the four orthographicmap projections of icosahedron faces shown inFigure 13 In each of the three Snyder projectiongrids the normalized areas of hexagonal cells areidentical but the normalized area value of thegrid rapidly approaches 10 as the level of recur-sion increases This is due to the progressivelysmaller contribution of the pentagonal cornercells to the total area of the icosahedron face
At increasing levelsof recursion the Fuller-Gray projection grids show a progressive smooth-ing of normalized area variation as the level ofrecursion increases By the fourth level thesmooth pattern of reduction in normalized areafrom the icosahedron center toward each edgeclosely mirrors the Tissot area distortion isolinesdefining the continuous area distortion surface Asexpected the spatial pattern of continuous Tissotarea distortion and of discrete normalized cell
Cartography and Geographic Information Science
Del
iver
ed b
y P
ublis
hing
Tec
hnol
ogy
to O
rego
n S
tate
Uni
vers
ity IP
128
193
164
203
on
Sat
12
Nov
201
1 22
50
45C
opyr
ight
(c)
Car
togr
aphy
and
Geo
grap
hic
Info
rmat
ion
Soc
iety
All
right
s re
serv
ed
Figure 12 Normalized-area comparison for basic segments of four global grids eachshown on an orthographic map projection to simulate the Earths sphericity
1110
1569
0069
09190813077
Figure 16 displays maps of an icosahedron face onthe Fuller-Gray and Snyder projection surfaces thatdepict variations in centerpoint distance betweenadjacent hexagons for 9-fold hexagonal partitioningat three levels of recursion (similar research on
Centerpoint Distance Map Comparison
and the other cells be-coming progressivelymore square in shape asthe equator ISapproached
bull The Snyder grid centerhexagon has the lowestcompactness (ignoringthe inherently lowercompactness pentagonsegments at each corner)The bowed pairs of hexa-gon edges along eachaxis of higher angulardeformation producelower compactness hexa-gons than those fartheraway from each axiswhere higher ZSC valuesvary only slightly and
bull Except for the lower com-pactness comer pentagoncells ZSCvalues across theFuller-Graygrid are consis-tently higher than the otherthree alternativeswith thehighest value at the icosahe-dron center and a slightsmooth decrease radiallyoutward from the centerAs done with normalized
area the spatial pattern ofZSC for hexagonal grids9-fold partitioned to recur-sion levels three and four wasexamined for the Fuller-Gray
and Snyder map projection surfaces (Figure 15)Both grids show a progressive smoothing of ZSCvalues also seen in the area analysis with increas-ing levels of recursion In both grids the spatialpattern of slightly lower to higher compactnessclosely mirrors the Tissot angular deformationisoline pattern for the map projection becomingspatially indistinguishable by recursion level fourHence Tissot angular deformation can be used topredict the spatial pattern of compactnessvariation
nyder
Equal Angle
1110
09190IIJ3077
FullerGray
Constant Area
Compactness Map Comparison
areas become indistinguishable at higher levels ofrecursIOn
Results from computation of Zone StandardizedCompactness (ZSC) for the four grid alternativesare presented in Figure 14 The portions of theglobe covered and levels of recursion selected forthe area comparisons are used here as well toinsure that the average cell area of each grid issimilar These four ZSCmaps show thatbull Compactness variation is greatest by far for
the equal-angle grid as the basic cell shapesvary from narrow spherical triangles at thepole to spherical squares at the equator
bull There is relatively little variation in compact-ness across the constant-area grid in spite ofthe cell at the pole being triangular in shape
Vol 26 No4 281
Del
iver
ed b
y P
ublis
hing
Tec
hnol
ogy
to O
rego
n S
tate
Uni
vers
ity IP
128
193
164
203
on
Sat
12
Nov
201
1 22
50
45C
opyr
ight
(c)
Car
togr
aphy
and
Geo
grap
hic
Info
rmat
ion
Soc
iety
All
right
s re
serv
ed
Figure 13 Normalized-areacomparison for two recursionlevels of the Fuller-Gray andISEA grids each shown on anorthographic map projection tosimulate the Earthssphericity
9-Fold Recursion Level 31060
fl
nil r ra n der
ld e ur ion Le el 4
FullerGray
1060
O9n J
U71~
Snyder
quadrilateral centerpoint distance for the equal-angle and constant-area grids is underway) Thisexample of our centerpoint distance analysis showshow variations in great-circle distance between adja-cent pairs of hexagon centers can be mapped
The six equilateral triangles fonning each hexa-gon can be thought of as map symbols shaded ac-cording to the distance between the hexagon centerand the centerpoint of adjacent hexagons to thenorth (0deg) northeast (60deg) southeast (120deg) south(180deg) southwest (240deg) and northwest (300deg) as-suming north to be at the top of the page
At the lowest level of recursion (top-rightmap) the general pattern of larger (darker gray)and smaller (lighter gray) distances relative to theaverage (medium gray) centerpoint to centerpointdistance are aligned with the three axes of higherangular deformation for the Snyder projection aswe would expect The shortest distances are alongeach axis and the longest distances are adjacentand roughly perpendicular to each axis Thisspatial pattern of centerpoint distance variation
282
persists and becomes better defined at the nexttwo higher levels of recursion At the highest levelexamined here (bottom-right map) the largerand smaller distances clearly are localized alongeach axis grading toward average values in apropeller-like pattern that corresponds with theTissot angular deformation isolines Indeed theTissot diagram in Figure 7 is an excellent predic-tor of where variations in centerpoint distanceshould occur on the Snyder grid
The spatial pattern of centerpoint distance varia-tion for the hexagonally partitioned Fuller-Grayprojection surfaceis not easilydiscerned at the lowestlevel of recursion (upper-left map) but becomesreadily visible at the next two higher levelsAs withthe Snyder projection Tissot angular deformationisolines predict the spatial pattern of little variationin the center of the icosahedron face with progres-sivelylarger centerpoint distance variations (often inlonger-shorter distance adjacent pairs) as each edgeis approached Overall there appears to be slightlyless centerpoint distancevariation on the Fuller-Gray
Cartography and Geographic Information Science
Del
iver
ed b
y P
ublis
hing
Tec
hnol
ogy
to O
rego
n S
tate
Uni
vers
ity IP
128
193
164
203
on
Sat
12
Nov
201
1 22
50
45C
opyr
ight
(c)
Car
togr
aphy
and
Geo
grap
hic
Info
rmat
ion
Soc
iety
All
right
s re
serv
ed
Figure 14 Compactness comparison for basic segments offour global grids each shown on an orthographic map projec-tion to simulate the Earths sphericity
the icosahedron face always creates 12 penta-gons on the globe exactly 56th the area of eachhexagon the surface area standard deviation forthe Snyder grid will always be slightly greaterthan zero even though there is no area variationamong the hexagons formed However at pro-gressively higher levels of recursion the 12pentagons occupy increasingly less of the totalsurface area and the standard deviation for theentire globe rapidly approaches zero Hencethis graph shows the Snyder grid to be clearlysuperior for hexagonal subcells less than100000 km2 in area
Variation in centerpoint spacing between adja-cent cells for the four grid alternatives can be ana-lyzed by graphing logarithmically the standarddeviation in normalized centerpoint spacingagainst average cell area at increasing levels ofrecursion (Figure 18) This graph shows the gridsto perform similarly except for the poorly per-forming EqualAngleQuadrilateral grid The Fullerand Constant Area Quadrilateral grids converge athigher recursion levels to essentially identical lowstandard deviations closely followed by the Snydergrid
Average subcell compactness values for thefour grids (Figure 19) shows the superior perform-ance of icosahedral models over quadrilateralwhich is to be expected since hexagonal shapes are
bullbull~
nyder
Equal Angle
FuUerGra
Constant Area
9middotFold Recur ion Level 4
FuJlerGra ~ n der
0951
U95
09-10U9IJOll(S
9-FoldRecursion Level 3
FullerGray Snyder
Because variation in cell surface area is amajor concern for geostatisticians andothers we analyzed the variation innormalized cell area with increasinglevels of recursion Figure 17 is a loga-rithmic graph of the standard deviationin normalized-cell area versus the de-creasing average-cell area at increasinglevels of recursion for the four discreteglobal grid alternatives (but only thehexagonal grids formed by Snyder andFuller-Gray projection subtriangles)examined graphically above Recogniz-ing that the hexagonal partitioning of
Figure 15 Compactness comparison for tworecursion levels of the Fuller-Gray and ISEAgrids each shown on an orthographic mapprojection to simulate the Earths sphericity
hexagonal grid but this can only be shownconclusivelyby a statistical comparison ofalternativegrids
Statistical Comparison Results
Vol 26 NO4 283
Del
iver
ed b
y P
ublis
hing
Tec
hnol
ogy
to O
rego
n S
tate
Uni
vers
ity IP
128
193
164
203
on
Sat
12
Nov
201
1 22
50
45C
opyr
ight
(c)
Car
togr
aphy
and
Geo
grap
hic
Info
rmat
ion
Soc
iety
All
right
s re
serv
ed
140km
190km
560 km
1300 kIT
1650 kIT
425 m
SnyderProjection
RecursionLevel 7
RecursionLevel 3
RecursionLevel 5
Fuller-GrayProjection
Figure 16 Variations in hexagonal centerpoint spacing at three levels of recursionfor the Fuller and ISEA Grids on an icosahedron face
In addition to the detailed nu-merical analysis of grid-cellarea compactness and center-point spacing at different levelsof recursion we carried out anoverall comparison of numerous
Summary Rankings
inherently more compact thanrectangular shapes At all levels ofrecursion the Fuller grid is com-prised of hexagons slightly morecompact than correspondingSnyder grid hexagons both beingfar more compact than the corre-sponding constant area and equalangle grid quadrilaterals
Variation in subcell compact-ness seen by graphing the stan-dard deviation of cell compactnessvalues against average cell area(Figure 20) shows the slightlybetter performance of the Fullergrid over the Snyder grid athigher levels of recursion Theconstant-area grid has the lowestoverall standard deviation at itsinitial resolution (level 0) but itsstandard deviation increases rap-idly as the initial cells are parti-tioned in an equal-angle mannerHowever the poor performanceassociated with the equal-anglegrid at all levels of recursion isnever approached
l2 Equal Angle Quadrilateral1 05 Bgt 0- 3GlC RecursionC 01 Level Constant Area QuadrilateralbullIII 1 0 8
3C ~1 2l bull 83 4 5III
1 2 Fuller-Gray ProjectionenIII 01Glbullc(
4i0C 001
~ia 5Ebull0Z 0001
107
106
105 4 3 2
10 10 102Average Cell Area km (log10 scale)
discrete global grid alternatives in-cluding the seven presented in Table1 Eleven of the fourteen Goodchildcriteria were investigated along withtwo related criteria deemed signifi-cant for global grid comparison ForGoodchild criteria 2 4 and 5 a sum-mary ordinal ranking from 1 (verypoor) to 10 (best possible) was devel-oped based on the quantitative analy-sis of comparison metrics
Table 1 provides informationcrucial to the selection of a global
Figure 17 Normalized subcell area standarddeviation vs average cell area for four globalgrids
284 Cartography and Geographic Information Science
Del
iver
ed b
y P
ublis
hing
Tec
hnol
ogy
to O
rego
n S
tate
Uni
vers
ity IP
128
193
164
203
on
Sat
12
Nov
201
1 22
50
45C
opyr
ight
(c)
Car
togr
aphy
and
Geo
grap
hic
Info
rmat
ion
Soc
iety
All
right
s re
serv
ed
Criterion Equal Angle Constant Area Snyder Fuller-Gray Small Circle Dir Sphere Gnomonic
1 Domain is globe yes yes yes yes yes yes yes
2 Equal areal 1 7 10 8 10 6 3
3 Same topology yes no yes yes yes yes yes
4 Equal shape 1 3 7 8 7 9 9
5 Compactnessmiddot 1 4 7 8 8 8 9
6 Straight edges onprojection na2 na yes yes na na yes
7 Perimeter bisection J ni ni ni ni ni nin1
8 Hierarchy yes yes yes4 yes4 yes4 yes4 yes4
9 Single point yes yes yes yes yes yes yes
10 Maximally centered ni ni ni ni ni ni ni
11 Equidistant no no no no no no no
12 Addressing ni ni ni ni oi ni ni13 LatitudelLongitude yes yes yes yes yes yes yes
14 Arbitrary resolution yes yes yes yes yes yes yes
Geodesic edge lines no no no no no yes yes
Spatial nature of area Continuously Part continu- Constant Continuously Constant Fractal-like Continuouslyvariation varying ous part varying varying
irregular
IBest possible = 10 very good = 9 -7 very poor = 1
2 na = not applicable
J ni = not investigated
4 Only the triangular cells not the hexagonal are hierarchical in these grids
Table 1 Evaluation of Goodchilds and related comparison criteria for different global grids
Figure 18 Normalized centerpoint distance standard deviation vs average cellarea for four global grids
ConclusionsThe global grid evaluation crite-ria and associated metrics haveallowed us to compare gridsvarying widely in cell geometryand topology We have observedthat the prime areas of concernamong the small portion of theglobal data user community wehave interacted with to date areequal-area cells and a nested
spherical subdivision the small circle subdivisionmethod and the Fuller-Gray map projection forthe icosahedron If good overall performance is ofparamount concern the triangular andor hex-agonal partitioning of the Fuller-Gray projectionsurface might be selected due to the low variationin compactness of highly compact cells that vary
slightly in area in a continuouslyvarying predictable manner
2 3 4 6
JL------ ~2 1 2 3Constant Area Quadrilateral
Equal Angle Quadrilateral2 38 8
o~RecursionLevel
Snyder Projection ~Fuller-Gray 1
Projection
ampoc i 100gtQG)aiCcEG)1lIo ~ 01isNrn=G)~~S~ III 011-------------------------------
B l 11 1~ 1~ 1~ 1~2Average Cell Area km (log0 scale)
grid based on the relative importance of evalua-tion criteria from the users perspective If cellcompactness is of prime importance for examplea triangular or hexagonal grid based on partition-ing a Gnomonic map projection of an icosahe-dron face (not discussed in this article) would bethe best alternative closely followed by direct
Vol 26 No4 285
Del
iver
ed b
y P
ublis
hing
Tec
hnol
ogy
to O
rego
n S
tate
Uni
vers
ity IP
128
193
164
203
on
Sat
12
Nov
201
1 22
50
45C
opyr
ight
(c)
Car
togr
aphy
and
Geo
grap
hic
Info
rmat
ion
Soc
iety
All
right
s re
serv
ed
Figure 19 Normalized subcell average compactness VS average cell area for fourglobal grids
Figure 20 Normalized subcell compactness standard deviation vs average cellarea for four global grids
(1)
Equal Angle Quadrilateral
2 3 4 5bull 0
2 3 4 5
1 2 3 Constant Area auadrilateral
2Equal Angle Quadrilateral
3 4 5
Zone area = 2x 1tX r2 (10 - sin $)
RecursionLevel
o0-0 ---_e_----lto---
RecursionLevel
APPENDIXZone Standardized Compactness
(ZSC)Derivation
6 5 4 310 10 10 10
Average Cell Area km2 (10910 scale)
------ --_---lt~ 2 3 4
o
where r is the radius of the sphere and ltP is thelatitude of the bounding parallel
The surface area of a spherical zone is computedfrom
will give a full picture of the strengths and weak-nesses of current global grid alternatives
o
Constant AreaQuadrilateral
_~~ iFuller-Gray 1 2 Projection 3 4 5
o
Fuller-GrayProjection 1
Snyder Projection 1gt-------------------
05
00011------7---- ----------4 -----r--~2
10 10 10 10 10 102Average Cell Area km (10910scale)
CIl()CI)5 01 =() r~2Emlt3 ~- C 01=Gl 0 =0CO
111iii iii 001 =Ebulloz
IIIIII
CII CIImS 09tll ()bullbull tllClIogt Elt0o
08
hierarchy among cells (criteria 2and 8) Both the quadrilateralgrids and triangular forms ofpolyhedral grids examined herecan be partitioned recursivelyallowing a nested hierarchy tobe created Equal-area cells isthe critical criterion since cur-rently employed equal-angleand constant-area quadrilateralgrids can never be equal areaand were shown to performpoorly in this respect relative toseveral alternative grids
Only two global grids thosebased on the triangular partition-ing of the Icosahedral SnyderEqual Area (ISFA)projection andpartitioning using the Small Cir-cle Subdivision method (not dis-cussed in this article but describedin Song 1997)will produce equal-area cells on the spheroid TheSmall Circle Subdivision methodhas the advantage of producingcells slightly more compact butthe ISFA grid is currently moreefficient to compute and easier toimplement Consequently werecommend the ISFA as the bestcurrent choice for an equal areaglobal grid Whichever global gridis selected there are implementa-tion issues that must be addressedin future research includingbull Implementing an efficient
addressing scheme for bin-ning data into grid cells
bull Creating algorithms for fasttranslation of gridded data to and from geo-detic latitude and longitude
bull Developing efficient algorithms for aggrega-tion and disaggregation among nested gridlevels and
bull Implementing efficient data storage andaccess schemes for data in nested cells includ-ing metadata storage and accessWe have begun to address several of these im-
plementation facets for the ISFA grid beginningwith an ETOP05 DEM dataset binning experimentconducted at several levels of recursion (seehttpbufogeoorstedufirmatdgg for binning ex-amples) Performing similar implementation experi-ments on additional datasets using other candidategrids would provide a complementary grid compari-son that together with our geometrical comparisons
286 Cartography and Geographic Information Science
Del
iver
ed b
y P
ublis
hing
Tec
hnol
ogy
to O
rego
n S
tate
Uni
vers
ity IP
128
193
164
203
on
Sat
12
Nov
201
1 22
50
45C
opyr
ight
(c)
Car
togr
aphy
and
Geo
grap
hic
Info
rmat
ion
Soc
iety
All
right
s re
serv
ed
REFERENCES
ACKNOWLEDGMENTS
so that
EidenshinkJC andJL Faundeen 1994 The 1 km AVHRRglobal land data set First stages of implementation Inierna-tionaljournal of Remote Sensing 153443-62
Fekete G and L Treinish 1990 Sphere quadtree A newdata structure to support the visualization of sphericallydistributed data SPIE Extracting rManing from complex dataProcessing display interaction Vol 1259 pp 242-53
Fuller RB 1982 SynergeticJ NewYork MacMillanGiacaglia GEO and CA Lundquist 1972 Sampling func-
tions for geophysics Smithsonian A5trvphysical Observatory Spe-cial Report No 344 93 pp
Goodchild MF 1994 Geographical grid models for environ-mental monitoring and analysis across the globe (panelsession) In proceddings of GISUS 94 Conference PhoenixArizona
Gray RW 1994 Exact transformation equations for Fullersworld map Cartography and Geographic Informatian Systems21(4) 243-46
Hastings DA 1996 The global land l-km base elevationdigital elevation model A progress report Global ChangeNewsletter 27 11-12
Heikes R and DA Randall 1995 Numerical integration ofthe shallow-water equations on a twisted icosahedral gridPart I Basic design and results of tests Monthly WeatherReview 123 1862-80
Kahn R 1995 What shall we do with the data we are expect-ing in 1998 In Proceedings of the Massive Data SelJ WorkshopCommittee on Applied and Theoretical Statistics NationalAcademy of Sciences Washington DC
Kimerling AJ 1984 Area computation from geodetic coordi-nates on the spheroid Surveying and Mapping 44(4) 343-51
Kimerling AJ D White K Sahr and L Song 1995 Devel-opment of global sampling grid Mid-project report Samplingdesign and statistics research for EMAP Program us Environ-mental Protection Agency Corvallis Oregon
Loveland TR JW Merchant D O Ohlen and JF Brown1991 Development of a land-cover characteristics databasefor the conterminous US Photogrammetric Engineering andRemote Sensing 57(11) 1453-63
Lukatela H 1987 Hipparchus geopositioning model Anoverview In Proceedings of Auto Carto 8 Symposium Balti-more Maryland pp 87-96
Maling DH 1992 Coordinate systems and map projectioru (2nded) Oxford UK Pergamon Press
Muehrcke PC and JO Muehrcke 1997 Map we (4th ed) Madi-sonWisconsinJP Publications
Olea RO 1984 Sanlpling design optimization for spatial functionsMathematical Geowgy 16369-92
Saff EB and ABJ Kuijlaars 1997 Distnbuting many points on asphere The Mathematical Intelligencer 19(1)5-11
Slade G 1994 Self avoiding walks The MaJhematical Intelligencer16(1)29-35
Snyder JP 1987 Map projectioru-A working manual Wash-ington DC US Government Printing Office
Snyder JP 1992 An equal-area map projection for polyhe-dral globes Cartographica 29(1) 10-21
Song L 1997 Small circle subdivision method for develop-ment of global sampling grid Unpublished Masters thesisOregon State University 176 pp
Stauffer D 1992 Introduction to percolation theory (2nd ed)London UK Taylor amp Francis
Tobler WR and Z Chen 1986 A quadtree for global infor-mation storage GeographicalAnalysis 18(4) 360-71
White D A J Kimerling and WS Overton 1992 Carto-graphic and geometric components of a global samplingdesign for environmental monitoring Cartography and Geo-graphic Information Systems 195-22
White D AJ Kin1erlingK Sahr and L Song 1998 Comparingarea and shape distortion on polyhedral-based recursive partitionsof the sphere International Journal of Geographiad Information Science12 805-27
Wolfram S 1986 Cellular automaton fluids 1 Basic theoryjournal of Statistical Physics 45471-526 bull
(5)Zone perimeter = 2XTCXr(co~)
ZSG = SQ1middott(4XTCxcellarea - cellarea2lr2) I cellperimeter (6)
Zone Standardized Compactness (ZSC) isgiven by Zone perimeterCell perimeter Substi-tuting and combining equations we compute ZSCfrom
Baumgardner JR and PO Frederickson 1985 Icosahedraldiscretization of the two-sphere SIAM journal of NUrMricalAnalysis 22(6) 1107-15
Bomford G 1971 Geodesy Oxford The Clarendon Press731 pp
Brooks DR 1981 Grid systems for Earth radiation budgetexperiment applications NASA Technical Memorandum8323340 pp
Coexeter HSM 1962 The problem of packing a number ofequal nonoverlapping circles on a sphere Transactions NewYork Academy of Science Division of Mathematics Series IIvol 24 320-31
Dutton G 1988 Geodesic modeling of planetary relief Car-tographica 21 188-207
Dutton G 1994 Geographical grid models for environmentalmonitoring and analysis across the globe (panel session) InProceedings of GISUS 94 Conference Phoenix Arizona
cos$ =sqrt( IO-(IO-cellareal(2xTCX r2)) (4)
The perimeter of the spherical zone is thecircumference of the bounding parallel computedfrom
Gelarea = 2XTCxr2(lO-sin$) (2)
This research was supported by US Environ-mental Protection Agency-Oregon State Univer-sity Cooperative Agreement CR 821672 MatthewGregory Department of Geosciences graduatestudent created the centerpoint distance mapsseen in Figure 16 Dr Ralph Kahn NASA-JPLalso contributed significantly to this manuscriptThis manuscript has been subjected to EPA reviewand approved for publication The conclusionsand opinions are solely those of the authors andnot necessarily the viewsof the Agency
and
Setting the zone surface area equal to the cellarea we obtain
Vol 26 NO4 287
Del
iver
ed b
y P
ublis
hing
Tec
hnol
ogy
to O
rego
n S
tate
Uni
vers
ity IP
128
193
164
203
on
Sat
12
Nov
201
1 22
50
45C
opyr
ight
(c)
Car
togr
aphy
and
Geo
grap
hic
Info
rmat
ion
Soc
iety
All
right
s re
serv
ed
Remote Sensing for theEarth Sciences (3rd ed)Andrew Rencz
Recently adopted titlesin cartography GISremote sensingandGPS
Policy Issues in Modern art graph)DR Frazer Taylor (cd)
Wilderness NavigationBob and Mike Bums
I bullbull
ACS
Maps with the NewsMark Monmonier
Air Apparent HowMeteorologists Learnedto Map Predict andDramatize WeatherMark Monmonier
froooks
Mapping a Northern LandThe Survey of CanadaGerald McGrath and LouisSebert (eds)
Thematic Cartographyand VisualizationTerry A Slocum
1 it 11 bull
on Oirle ~y a30149j- ~24)
288 Cartography and Geographic Information Science
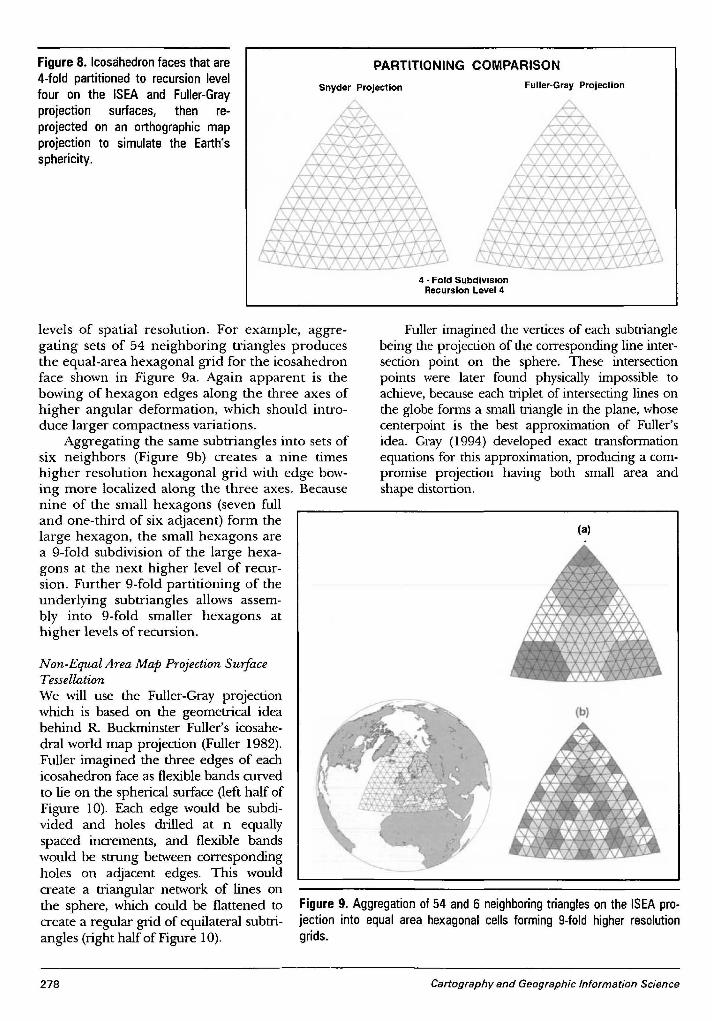
Del
iver
ed b
y P
ublis
hing
Tec
hnol
ogy
to O
rego
n S
tate
Uni
vers
ity IP
128
193
164
203
on
Sat
12
Nov
201
1 22
50
45C
opyr
ight
(c)
Car
togr
aphy
and
Geo
grap
hic
Info
rmat
ion
Soc
iety
All
right
s re
serv
ed
PARTITIONING COMPARISONFigure 8 Icosahedron faces that are4-fold partitioned to recursion levelfour on the ISEA and Fuller-Grayprojection surfaces then re-projected on an orthographic mapprojection to simulate the Earthssphericity
Snyder Projection
4 bull FOld SubdiVISionRecursion Level 4
Fuller-Gray Projection
Figure 9 Aggregation of 54 and 6 neighboring triangles on the ISEA pro-jection into equal area hexagonal cells forming 9-fold higher resolutiongrids
levels of spatial resolution For example aggre-gating sets of 54 neighboring triangles producesthe equal-area hexagonal grid for the icosahedronface shown in Figure 9a Again apparent is thebowing of hexagon edges along the three axes ofhigher angular deformation which should intro-duce larger compactness variations
Aggregating the same subtriangles into sets ofsix neighbors (Figure 9b) creates a nine timeshigher resolution hexagonal grid with edge bow-ing more localized along the three axes Becausenine of the small hexagons (seven fulland one-third of six adjacent) form thelarge hexagon the small hexagons area 9-fold subdivision of the large hexa-gons at the next higher level of recur-sion Further 9-fold partitioning of theunderlying subtriangles allows assem-bly into 9-fold smaller hexagons athigher levels of recursion
Non-Equal Area Map Projection SurfaceTessellationWe will use the Fuller-Gray projectionwhich is based on the geometrical ideabehind R Buckminster Fullers icosahe-dral world map projection (Fuller 1982)Fuller imagined the three edges of eachicosahedron face as flexible bands curvedto lie on the spherical surface (left half ofFigure 10) Each edge would be subdi-vided and holes drilled at n equallyspaced increments and flexible bandswould be strung between correspondingholes on adjacent edges This wouldcreate a triangular network of lines onthe sphere which could be flattened tocreate a regular grid of equilateral subtri-angles (right half of Figure 10)
278
Fuller imagined the verticesof each subtrianglebeing the projection of the corresponding line inter-section point on the sphere These intersectionpoints were later found physically impossible toachieve because each triplet of intersecting lines onthe globe forms a small triangle in the plane whosecenterpoint is the best approximation of Fullersidea Gray (1994) developed exact transformationequations for this approximation producing a com-promise projection having both small area andshape distortion
(a)
(b)
Cartography and Geographic Information Science
Del
iver
ed b
y P
ublis
hing
Tec
hnol
ogy
to O
rego
n S
tate
Uni
vers
ity IP
128
193
164
203
on
Sat
12
Nov
201
1 22
50
45C
opyr
ight
(c)
Car
togr
aphy
and
Geo
grap
hic
Info
rmat
ion
Soc
iety
All
right
s re
serv
ed
Figure 10 Fullers geometrical concept of an icosahedral map projection surface (Source Fuller1982)
The equilateral-triangle Fuller-Gray projec-tion of an icosahedron face is shown in Figure 11along with area-scale and angular-deformationmaps displaying results of our Tissot distortionanalysis Note the smooth increase in area-scaleand angular deformation from the triangle centerto each edge vertex Both recursive partitioningand triangle aggregation is performed identicallyto the Snyder projection The only differenceshould be the creation of non-equal area triangu-lar and hexagonal cells that vary less in compact-ness on average and that grade smoothly fromslightly higher to lower compactness (Figure 8)
Analyses and ResultsThe ideal comparison of global grid geometricalproperties would consist of computing surface areacompactness and other metrics at each level of re-cursion down to the spatial resolution correspondingto the smallest grid cell expected to be used in globalanalysis If the smallestcellwere 1 km2 for examplethe 9-fold partitioning of an icosahedron face mustbe carried out to recursion level eight meaning thatarea compactness centerpoint distance and othermetries must be computed for over 500 million cellsNaturally an infinite number of triangular hexago-nal or quadrilateral recursion levels and cells arepossible as recursive partitioning can continueindefinitely
We have found 9-fold partitioning to recursionlevels less than six to be suitable for comparisonpurposes because surface area compactness center-point spacing and other metries are still computableat the rapidly increasing cell densities However thecomputation effort quickly becomes immense athigher levels of recursion and the results may notadd significantlyto our understanding of the surface
Vol 26 No4
tessellation or gridpoint geomeoy
The normalizedarea zone standard-ized compactness andcenterpoint distanceanalyses that followare a representativesample of our fullresearch effort Thefour grid alternativesexamined were se-lected from the lOwestudied but resultsfrom only two of thefive recursion levelsweexamined are pre-sented here to illus-
trate the essential geometrical properties of the fullrange of quadrilateral and polyhedral grid alterna-tivesWe have limited the polyhedral analysis to thehexagonal tessellation because area and shape dis-tortion characteristics of triangular partitioning arepresented in a companion article (White et al 1998)
Normalized Area Map Comparison
bull Spheroidal areas were computed from sets ofclosely spaced geodetic latitude and longitudecoordinates along each cell edge (usually 11points along an edge) For the two quadrilat-eral tessellations the bounding parallels wereon the WGS 84 spheroid However for theFuller-Gray and Snyder projections onlyspherical equations were available so a morecomplex spheroidal transformation proce-dure had to be used This involved Projectingfrom the authalic sphere for the WGS 84ellipsoid to the plane using forward projec-tion equations
bull Partitioning on the planar projection surfacebull Back projecting cell edges and centerpoints to
spherical coordinates using the inversespherical equations for each projection and
bull Converting authalic to WGS 84 geodetic lati-tude using the transformation equationsfound in Snyder (1987) This allows the ori-ented spheroidal triangle summation method(Kimerling 1984) to be applied to the four(and other) global grid alternativesMaps comparing variations in normalized
surface area for the four discrete global grid ex-amples described above are presented in Figure12 The equal-angle and constant-area grids cover45deg of longitude by 90deg of latitude (equator to
279
Del
iver
ed b
y P
ublis
hing
Tec
hnol
ogy
to O
rego
n S
tate
Uni
vers
ity IP
128
193
164
203
on
Sat
12
Nov
201
1 22
50
45C
opyr
ight
(c)
Car
togr
aphy
and
Geo
grap
hic
Info
rmat
ion
Soc
iety
All
right
s re
serv
ed
Fuller-Grey map projection
Icosahedron Face Area Distortion Angular Deformation
Tissot distortion analysis
Figure 11 Fuller-Gray map projection and Tissot distortion analysis for an icosahedron face
pole) or 1I16th of the globe Each icosahedronface of course covers 120th of the globe so thatthe surface areas of comparison surfaces are ap-proximately the same The level of recursion foreach grid was selected so that the average cell areawithin each grid is nearly the same From thesemaps in Figure 12 it is apparent thatbull The larger range in normalized area (0069 -
1569 or 150 percent) associated with theequal-angle grid makes it as expected by farthe worst alternative of the four
bull The constant-area grid has a greater range ofnormalized area than either the Snyder orFuller-Gray grids The pattern of spatialvariation is one of identical normalized areawithin east-west bands Cell areas also de-crease slowly from south to north within thethree blocks in the bottom half of the maphaving identical meridians as cell boundariesSuch regularity is not present in the rows ofcells forming the top half of the map
bull Normalized hexagon areas on the Fuller-Grayprojection decrease smoothly from a value of106 (6 percent above average) at the icosahe-dron face center to a lower value of 0944near each corner The very low normalizedarea for the triangle at each corner is causedby this being one of five spherical triangles onadjacent icosahedron faces that together formone of 12 pentagonal cells on the globe Eachpentagon area is 56th that of the averagehexagonal cell which gives the lower normal-ized area
280
bull Normalized hexagon areas on the Snyderprojection are identical and just slightly largerthan 10 so as to offset the three smaller areasof corner pentagonal cells If the pentagonareas are removed from the calculations allhexagons are measured as having a 10 nor-malized surface area a numerical demonstra-tion that the Snyder equations for theicosahedron do indeed produce an equal areamap projection surfaceWe next examine the spatial pattern of nor-
malized area for hexagons at recursion levelsthree and four for the 9-fold partitioning of theFuller-Gray and Snyder projection surfaces Theresults are presented in the four orthographicmap projections of icosahedron faces shown inFigure 13 In each of the three Snyder projectiongrids the normalized areas of hexagonal cells areidentical but the normalized area value of thegrid rapidly approaches 10 as the level of recur-sion increases This is due to the progressivelysmaller contribution of the pentagonal cornercells to the total area of the icosahedron face
At increasing levelsof recursion the Fuller-Gray projection grids show a progressive smooth-ing of normalized area variation as the level ofrecursion increases By the fourth level thesmooth pattern of reduction in normalized areafrom the icosahedron center toward each edgeclosely mirrors the Tissot area distortion isolinesdefining the continuous area distortion surface Asexpected the spatial pattern of continuous Tissotarea distortion and of discrete normalized cell
Cartography and Geographic Information Science
Del
iver
ed b
y P
ublis
hing
Tec
hnol
ogy
to O
rego
n S
tate
Uni
vers
ity IP
128
193
164
203
on
Sat
12
Nov
201
1 22
50
45C
opyr
ight
(c)
Car
togr
aphy
and
Geo
grap
hic
Info
rmat
ion
Soc
iety
All
right
s re
serv
ed
Figure 12 Normalized-area comparison for basic segments of four global grids eachshown on an orthographic map projection to simulate the Earths sphericity
1110
1569
0069
09190813077
Figure 16 displays maps of an icosahedron face onthe Fuller-Gray and Snyder projection surfaces thatdepict variations in centerpoint distance betweenadjacent hexagons for 9-fold hexagonal partitioningat three levels of recursion (similar research on
Centerpoint Distance Map Comparison
and the other cells be-coming progressivelymore square in shape asthe equator ISapproached
bull The Snyder grid centerhexagon has the lowestcompactness (ignoringthe inherently lowercompactness pentagonsegments at each corner)The bowed pairs of hexa-gon edges along eachaxis of higher angulardeformation producelower compactness hexa-gons than those fartheraway from each axiswhere higher ZSC valuesvary only slightly and
bull Except for the lower com-pactness comer pentagoncells ZSCvalues across theFuller-Graygrid are consis-tently higher than the otherthree alternativeswith thehighest value at the icosahe-dron center and a slightsmooth decrease radiallyoutward from the centerAs done with normalized
area the spatial pattern ofZSC for hexagonal grids9-fold partitioned to recur-sion levels three and four wasexamined for the Fuller-Gray
and Snyder map projection surfaces (Figure 15)Both grids show a progressive smoothing of ZSCvalues also seen in the area analysis with increas-ing levels of recursion In both grids the spatialpattern of slightly lower to higher compactnessclosely mirrors the Tissot angular deformationisoline pattern for the map projection becomingspatially indistinguishable by recursion level fourHence Tissot angular deformation can be used topredict the spatial pattern of compactnessvariation
nyder
Equal Angle
1110
09190IIJ3077
FullerGray
Constant Area
Compactness Map Comparison
areas become indistinguishable at higher levels ofrecursIOn
Results from computation of Zone StandardizedCompactness (ZSC) for the four grid alternativesare presented in Figure 14 The portions of theglobe covered and levels of recursion selected forthe area comparisons are used here as well toinsure that the average cell area of each grid issimilar These four ZSCmaps show thatbull Compactness variation is greatest by far for
the equal-angle grid as the basic cell shapesvary from narrow spherical triangles at thepole to spherical squares at the equator
bull There is relatively little variation in compact-ness across the constant-area grid in spite ofthe cell at the pole being triangular in shape
Vol 26 No4 281
Del
iver
ed b
y P
ublis
hing
Tec
hnol
ogy
to O
rego
n S
tate
Uni
vers
ity IP
128
193
164
203
on
Sat
12
Nov
201
1 22
50
45C
opyr
ight
(c)
Car
togr
aphy
and
Geo
grap
hic
Info
rmat
ion
Soc
iety
All
right
s re
serv
ed
Figure 13 Normalized-areacomparison for two recursionlevels of the Fuller-Gray andISEA grids each shown on anorthographic map projection tosimulate the Earthssphericity
9-Fold Recursion Level 31060
fl
nil r ra n der
ld e ur ion Le el 4
FullerGray
1060
O9n J
U71~
Snyder
quadrilateral centerpoint distance for the equal-angle and constant-area grids is underway) Thisexample of our centerpoint distance analysis showshow variations in great-circle distance between adja-cent pairs of hexagon centers can be mapped
The six equilateral triangles fonning each hexa-gon can be thought of as map symbols shaded ac-cording to the distance between the hexagon centerand the centerpoint of adjacent hexagons to thenorth (0deg) northeast (60deg) southeast (120deg) south(180deg) southwest (240deg) and northwest (300deg) as-suming north to be at the top of the page
At the lowest level of recursion (top-rightmap) the general pattern of larger (darker gray)and smaller (lighter gray) distances relative to theaverage (medium gray) centerpoint to centerpointdistance are aligned with the three axes of higherangular deformation for the Snyder projection aswe would expect The shortest distances are alongeach axis and the longest distances are adjacentand roughly perpendicular to each axis Thisspatial pattern of centerpoint distance variation
282
persists and becomes better defined at the nexttwo higher levels of recursion At the highest levelexamined here (bottom-right map) the largerand smaller distances clearly are localized alongeach axis grading toward average values in apropeller-like pattern that corresponds with theTissot angular deformation isolines Indeed theTissot diagram in Figure 7 is an excellent predic-tor of where variations in centerpoint distanceshould occur on the Snyder grid
The spatial pattern of centerpoint distance varia-tion for the hexagonally partitioned Fuller-Grayprojection surfaceis not easilydiscerned at the lowestlevel of recursion (upper-left map) but becomesreadily visible at the next two higher levelsAs withthe Snyder projection Tissot angular deformationisolines predict the spatial pattern of little variationin the center of the icosahedron face with progres-sivelylarger centerpoint distance variations (often inlonger-shorter distance adjacent pairs) as each edgeis approached Overall there appears to be slightlyless centerpoint distancevariation on the Fuller-Gray
Cartography and Geographic Information Science
Del
iver
ed b
y P
ublis
hing
Tec
hnol
ogy
to O
rego
n S
tate
Uni
vers
ity IP
128
193
164
203
on
Sat
12
Nov
201
1 22
50
45C
opyr
ight
(c)
Car
togr
aphy
and
Geo
grap
hic
Info
rmat
ion
Soc
iety
All
right
s re
serv
ed
Figure 14 Compactness comparison for basic segments offour global grids each shown on an orthographic map projec-tion to simulate the Earths sphericity
the icosahedron face always creates 12 penta-gons on the globe exactly 56th the area of eachhexagon the surface area standard deviation forthe Snyder grid will always be slightly greaterthan zero even though there is no area variationamong the hexagons formed However at pro-gressively higher levels of recursion the 12pentagons occupy increasingly less of the totalsurface area and the standard deviation for theentire globe rapidly approaches zero Hencethis graph shows the Snyder grid to be clearlysuperior for hexagonal subcells less than100000 km2 in area
Variation in centerpoint spacing between adja-cent cells for the four grid alternatives can be ana-lyzed by graphing logarithmically the standarddeviation in normalized centerpoint spacingagainst average cell area at increasing levels ofrecursion (Figure 18) This graph shows the gridsto perform similarly except for the poorly per-forming EqualAngleQuadrilateral grid The Fullerand Constant Area Quadrilateral grids converge athigher recursion levels to essentially identical lowstandard deviations closely followed by the Snydergrid
Average subcell compactness values for thefour grids (Figure 19) shows the superior perform-ance of icosahedral models over quadrilateralwhich is to be expected since hexagonal shapes are
bullbull~
nyder
Equal Angle
FuUerGra
Constant Area
9middotFold Recur ion Level 4
FuJlerGra ~ n der
0951
U95
09-10U9IJOll(S
9-FoldRecursion Level 3
FullerGray Snyder
Because variation in cell surface area is amajor concern for geostatisticians andothers we analyzed the variation innormalized cell area with increasinglevels of recursion Figure 17 is a loga-rithmic graph of the standard deviationin normalized-cell area versus the de-creasing average-cell area at increasinglevels of recursion for the four discreteglobal grid alternatives (but only thehexagonal grids formed by Snyder andFuller-Gray projection subtriangles)examined graphically above Recogniz-ing that the hexagonal partitioning of
Figure 15 Compactness comparison for tworecursion levels of the Fuller-Gray and ISEAgrids each shown on an orthographic mapprojection to simulate the Earths sphericity
hexagonal grid but this can only be shownconclusivelyby a statistical comparison ofalternativegrids
Statistical Comparison Results
Vol 26 NO4 283
Del
iver
ed b
y P
ublis
hing
Tec
hnol
ogy
to O
rego
n S
tate
Uni
vers
ity IP
128
193
164
203
on
Sat
12
Nov
201
1 22
50
45C
opyr
ight
(c)
Car
togr
aphy
and
Geo
grap
hic
Info
rmat
ion
Soc
iety
All
right
s re
serv
ed
140km
190km
560 km
1300 kIT
1650 kIT
425 m
SnyderProjection
RecursionLevel 7
RecursionLevel 3
RecursionLevel 5
Fuller-GrayProjection
Figure 16 Variations in hexagonal centerpoint spacing at three levels of recursionfor the Fuller and ISEA Grids on an icosahedron face
In addition to the detailed nu-merical analysis of grid-cellarea compactness and center-point spacing at different levelsof recursion we carried out anoverall comparison of numerous
Summary Rankings
inherently more compact thanrectangular shapes At all levels ofrecursion the Fuller grid is com-prised of hexagons slightly morecompact than correspondingSnyder grid hexagons both beingfar more compact than the corre-sponding constant area and equalangle grid quadrilaterals
Variation in subcell compact-ness seen by graphing the stan-dard deviation of cell compactnessvalues against average cell area(Figure 20) shows the slightlybetter performance of the Fullergrid over the Snyder grid athigher levels of recursion Theconstant-area grid has the lowestoverall standard deviation at itsinitial resolution (level 0) but itsstandard deviation increases rap-idly as the initial cells are parti-tioned in an equal-angle mannerHowever the poor performanceassociated with the equal-anglegrid at all levels of recursion isnever approached
l2 Equal Angle Quadrilateral1 05 Bgt 0- 3GlC RecursionC 01 Level Constant Area QuadrilateralbullIII 1 0 8
3C ~1 2l bull 83 4 5III
1 2 Fuller-Gray ProjectionenIII 01Glbullc(
4i0C 001
~ia 5Ebull0Z 0001
107
106
105 4 3 2
10 10 102Average Cell Area km (log10 scale)
discrete global grid alternatives in-cluding the seven presented in Table1 Eleven of the fourteen Goodchildcriteria were investigated along withtwo related criteria deemed signifi-cant for global grid comparison ForGoodchild criteria 2 4 and 5 a sum-mary ordinal ranking from 1 (verypoor) to 10 (best possible) was devel-oped based on the quantitative analy-sis of comparison metrics
Table 1 provides informationcrucial to the selection of a global
Figure 17 Normalized subcell area standarddeviation vs average cell area for four globalgrids
284 Cartography and Geographic Information Science
Del
iver
ed b
y P
ublis
hing
Tec
hnol
ogy
to O
rego
n S
tate
Uni
vers
ity IP
128
193
164
203
on
Sat
12
Nov
201
1 22
50
45C
opyr
ight
(c)
Car
togr
aphy
and
Geo
grap
hic
Info
rmat
ion
Soc
iety
All
right
s re
serv
ed
Criterion Equal Angle Constant Area Snyder Fuller-Gray Small Circle Dir Sphere Gnomonic
1 Domain is globe yes yes yes yes yes yes yes
2 Equal areal 1 7 10 8 10 6 3
3 Same topology yes no yes yes yes yes yes
4 Equal shape 1 3 7 8 7 9 9
5 Compactnessmiddot 1 4 7 8 8 8 9
6 Straight edges onprojection na2 na yes yes na na yes
7 Perimeter bisection J ni ni ni ni ni nin1
8 Hierarchy yes yes yes4 yes4 yes4 yes4 yes4
9 Single point yes yes yes yes yes yes yes
10 Maximally centered ni ni ni ni ni ni ni
11 Equidistant no no no no no no no
12 Addressing ni ni ni ni oi ni ni13 LatitudelLongitude yes yes yes yes yes yes yes
14 Arbitrary resolution yes yes yes yes yes yes yes
Geodesic edge lines no no no no no yes yes
Spatial nature of area Continuously Part continu- Constant Continuously Constant Fractal-like Continuouslyvariation varying ous part varying varying
irregular
IBest possible = 10 very good = 9 -7 very poor = 1
2 na = not applicable
J ni = not investigated
4 Only the triangular cells not the hexagonal are hierarchical in these grids
Table 1 Evaluation of Goodchilds and related comparison criteria for different global grids
Figure 18 Normalized centerpoint distance standard deviation vs average cellarea for four global grids
ConclusionsThe global grid evaluation crite-ria and associated metrics haveallowed us to compare gridsvarying widely in cell geometryand topology We have observedthat the prime areas of concernamong the small portion of theglobal data user community wehave interacted with to date areequal-area cells and a nested
spherical subdivision the small circle subdivisionmethod and the Fuller-Gray map projection forthe icosahedron If good overall performance is ofparamount concern the triangular andor hex-agonal partitioning of the Fuller-Gray projectionsurface might be selected due to the low variationin compactness of highly compact cells that vary
slightly in area in a continuouslyvarying predictable manner
2 3 4 6
JL------ ~2 1 2 3Constant Area Quadrilateral
Equal Angle Quadrilateral2 38 8
o~RecursionLevel
Snyder Projection ~Fuller-Gray 1
Projection
ampoc i 100gtQG)aiCcEG)1lIo ~ 01isNrn=G)~~S~ III 011-------------------------------
B l 11 1~ 1~ 1~ 1~2Average Cell Area km (log0 scale)
grid based on the relative importance of evalua-tion criteria from the users perspective If cellcompactness is of prime importance for examplea triangular or hexagonal grid based on partition-ing a Gnomonic map projection of an icosahe-dron face (not discussed in this article) would bethe best alternative closely followed by direct
Vol 26 No4 285
Del
iver
ed b
y P
ublis
hing
Tec
hnol
ogy
to O
rego
n S
tate
Uni
vers
ity IP
128
193
164
203
on
Sat
12
Nov
201
1 22
50
45C
opyr
ight
(c)
Car
togr
aphy
and
Geo
grap
hic
Info
rmat
ion
Soc
iety
All
right
s re
serv
ed
Figure 19 Normalized subcell average compactness VS average cell area for fourglobal grids
Figure 20 Normalized subcell compactness standard deviation vs average cellarea for four global grids
(1)
Equal Angle Quadrilateral
2 3 4 5bull 0
2 3 4 5
1 2 3 Constant Area auadrilateral
2Equal Angle Quadrilateral
3 4 5
Zone area = 2x 1tX r2 (10 - sin $)
RecursionLevel
o0-0 ---_e_----lto---
RecursionLevel
APPENDIXZone Standardized Compactness
(ZSC)Derivation
6 5 4 310 10 10 10
Average Cell Area km2 (10910 scale)
------ --_---lt~ 2 3 4
o
where r is the radius of the sphere and ltP is thelatitude of the bounding parallel
The surface area of a spherical zone is computedfrom
will give a full picture of the strengths and weak-nesses of current global grid alternatives
o
Constant AreaQuadrilateral
_~~ iFuller-Gray 1 2 Projection 3 4 5
o
Fuller-GrayProjection 1
Snyder Projection 1gt-------------------
05
00011------7---- ----------4 -----r--~2
10 10 10 10 10 102Average Cell Area km (10910scale)
CIl()CI)5 01 =() r~2Emlt3 ~- C 01=Gl 0 =0CO
111iii iii 001 =Ebulloz
IIIIII
CII CIImS 09tll ()bullbull tllClIogt Elt0o
08
hierarchy among cells (criteria 2and 8) Both the quadrilateralgrids and triangular forms ofpolyhedral grids examined herecan be partitioned recursivelyallowing a nested hierarchy tobe created Equal-area cells isthe critical criterion since cur-rently employed equal-angleand constant-area quadrilateralgrids can never be equal areaand were shown to performpoorly in this respect relative toseveral alternative grids
Only two global grids thosebased on the triangular partition-ing of the Icosahedral SnyderEqual Area (ISFA)projection andpartitioning using the Small Cir-cle Subdivision method (not dis-cussed in this article but describedin Song 1997)will produce equal-area cells on the spheroid TheSmall Circle Subdivision methodhas the advantage of producingcells slightly more compact butthe ISFA grid is currently moreefficient to compute and easier toimplement Consequently werecommend the ISFA as the bestcurrent choice for an equal areaglobal grid Whichever global gridis selected there are implementa-tion issues that must be addressedin future research includingbull Implementing an efficient
addressing scheme for bin-ning data into grid cells
bull Creating algorithms for fasttranslation of gridded data to and from geo-detic latitude and longitude
bull Developing efficient algorithms for aggrega-tion and disaggregation among nested gridlevels and
bull Implementing efficient data storage andaccess schemes for data in nested cells includ-ing metadata storage and accessWe have begun to address several of these im-
plementation facets for the ISFA grid beginningwith an ETOP05 DEM dataset binning experimentconducted at several levels of recursion (seehttpbufogeoorstedufirmatdgg for binning ex-amples) Performing similar implementation experi-ments on additional datasets using other candidategrids would provide a complementary grid compari-son that together with our geometrical comparisons
286 Cartography and Geographic Information Science
Del
iver
ed b
y P
ublis
hing
Tec
hnol
ogy
to O
rego
n S
tate
Uni
vers
ity IP
128
193
164
203
on
Sat
12
Nov
201
1 22
50
45C
opyr
ight
(c)
Car
togr
aphy
and
Geo
grap
hic
Info
rmat
ion
Soc
iety
All
right
s re
serv
ed
REFERENCES
ACKNOWLEDGMENTS
so that
EidenshinkJC andJL Faundeen 1994 The 1 km AVHRRglobal land data set First stages of implementation Inierna-tionaljournal of Remote Sensing 153443-62
Fekete G and L Treinish 1990 Sphere quadtree A newdata structure to support the visualization of sphericallydistributed data SPIE Extracting rManing from complex dataProcessing display interaction Vol 1259 pp 242-53
Fuller RB 1982 SynergeticJ NewYork MacMillanGiacaglia GEO and CA Lundquist 1972 Sampling func-
tions for geophysics Smithsonian A5trvphysical Observatory Spe-cial Report No 344 93 pp
Goodchild MF 1994 Geographical grid models for environ-mental monitoring and analysis across the globe (panelsession) In proceddings of GISUS 94 Conference PhoenixArizona
Gray RW 1994 Exact transformation equations for Fullersworld map Cartography and Geographic Informatian Systems21(4) 243-46
Hastings DA 1996 The global land l-km base elevationdigital elevation model A progress report Global ChangeNewsletter 27 11-12
Heikes R and DA Randall 1995 Numerical integration ofthe shallow-water equations on a twisted icosahedral gridPart I Basic design and results of tests Monthly WeatherReview 123 1862-80
Kahn R 1995 What shall we do with the data we are expect-ing in 1998 In Proceedings of the Massive Data SelJ WorkshopCommittee on Applied and Theoretical Statistics NationalAcademy of Sciences Washington DC
Kimerling AJ 1984 Area computation from geodetic coordi-nates on the spheroid Surveying and Mapping 44(4) 343-51
Kimerling AJ D White K Sahr and L Song 1995 Devel-opment of global sampling grid Mid-project report Samplingdesign and statistics research for EMAP Program us Environ-mental Protection Agency Corvallis Oregon
Loveland TR JW Merchant D O Ohlen and JF Brown1991 Development of a land-cover characteristics databasefor the conterminous US Photogrammetric Engineering andRemote Sensing 57(11) 1453-63
Lukatela H 1987 Hipparchus geopositioning model Anoverview In Proceedings of Auto Carto 8 Symposium Balti-more Maryland pp 87-96
Maling DH 1992 Coordinate systems and map projectioru (2nded) Oxford UK Pergamon Press
Muehrcke PC and JO Muehrcke 1997 Map we (4th ed) Madi-sonWisconsinJP Publications
Olea RO 1984 Sanlpling design optimization for spatial functionsMathematical Geowgy 16369-92
Saff EB and ABJ Kuijlaars 1997 Distnbuting many points on asphere The Mathematical Intelligencer 19(1)5-11
Slade G 1994 Self avoiding walks The MaJhematical Intelligencer16(1)29-35
Snyder JP 1987 Map projectioru-A working manual Wash-ington DC US Government Printing Office
Snyder JP 1992 An equal-area map projection for polyhe-dral globes Cartographica 29(1) 10-21
Song L 1997 Small circle subdivision method for develop-ment of global sampling grid Unpublished Masters thesisOregon State University 176 pp
Stauffer D 1992 Introduction to percolation theory (2nd ed)London UK Taylor amp Francis
Tobler WR and Z Chen 1986 A quadtree for global infor-mation storage GeographicalAnalysis 18(4) 360-71
White D A J Kimerling and WS Overton 1992 Carto-graphic and geometric components of a global samplingdesign for environmental monitoring Cartography and Geo-graphic Information Systems 195-22
White D AJ Kin1erlingK Sahr and L Song 1998 Comparingarea and shape distortion on polyhedral-based recursive partitionsof the sphere International Journal of Geographiad Information Science12 805-27
Wolfram S 1986 Cellular automaton fluids 1 Basic theoryjournal of Statistical Physics 45471-526 bull
(5)Zone perimeter = 2XTCXr(co~)
ZSG = SQ1middott(4XTCxcellarea - cellarea2lr2) I cellperimeter (6)
Zone Standardized Compactness (ZSC) isgiven by Zone perimeterCell perimeter Substi-tuting and combining equations we compute ZSCfrom
Baumgardner JR and PO Frederickson 1985 Icosahedraldiscretization of the two-sphere SIAM journal of NUrMricalAnalysis 22(6) 1107-15
Bomford G 1971 Geodesy Oxford The Clarendon Press731 pp
Brooks DR 1981 Grid systems for Earth radiation budgetexperiment applications NASA Technical Memorandum8323340 pp
Coexeter HSM 1962 The problem of packing a number ofequal nonoverlapping circles on a sphere Transactions NewYork Academy of Science Division of Mathematics Series IIvol 24 320-31
Dutton G 1988 Geodesic modeling of planetary relief Car-tographica 21 188-207
Dutton G 1994 Geographical grid models for environmentalmonitoring and analysis across the globe (panel session) InProceedings of GISUS 94 Conference Phoenix Arizona
cos$ =sqrt( IO-(IO-cellareal(2xTCX r2)) (4)
The perimeter of the spherical zone is thecircumference of the bounding parallel computedfrom
Gelarea = 2XTCxr2(lO-sin$) (2)
This research was supported by US Environ-mental Protection Agency-Oregon State Univer-sity Cooperative Agreement CR 821672 MatthewGregory Department of Geosciences graduatestudent created the centerpoint distance mapsseen in Figure 16 Dr Ralph Kahn NASA-JPLalso contributed significantly to this manuscriptThis manuscript has been subjected to EPA reviewand approved for publication The conclusionsand opinions are solely those of the authors andnot necessarily the viewsof the Agency
and
Setting the zone surface area equal to the cellarea we obtain
Vol 26 NO4 287
Del
iver
ed b
y P
ublis
hing
Tec
hnol
ogy
to O
rego
n S
tate
Uni
vers
ity IP
128
193
164
203
on
Sat
12
Nov
201
1 22
50
45C
opyr
ight
(c)
Car
togr
aphy
and
Geo
grap
hic
Info
rmat
ion
Soc
iety
All
right
s re
serv
ed
Remote Sensing for theEarth Sciences (3rd ed)Andrew Rencz
Recently adopted titlesin cartography GISremote sensingandGPS
Policy Issues in Modern art graph)DR Frazer Taylor (cd)
Wilderness NavigationBob and Mike Bums
I bullbull
ACS
Maps with the NewsMark Monmonier
Air Apparent HowMeteorologists Learnedto Map Predict andDramatize WeatherMark Monmonier
froooks
Mapping a Northern LandThe Survey of CanadaGerald McGrath and LouisSebert (eds)
Thematic Cartographyand VisualizationTerry A Slocum
1 it 11 bull
on Oirle ~y a30149j- ~24)
288 Cartography and Geographic Information Science
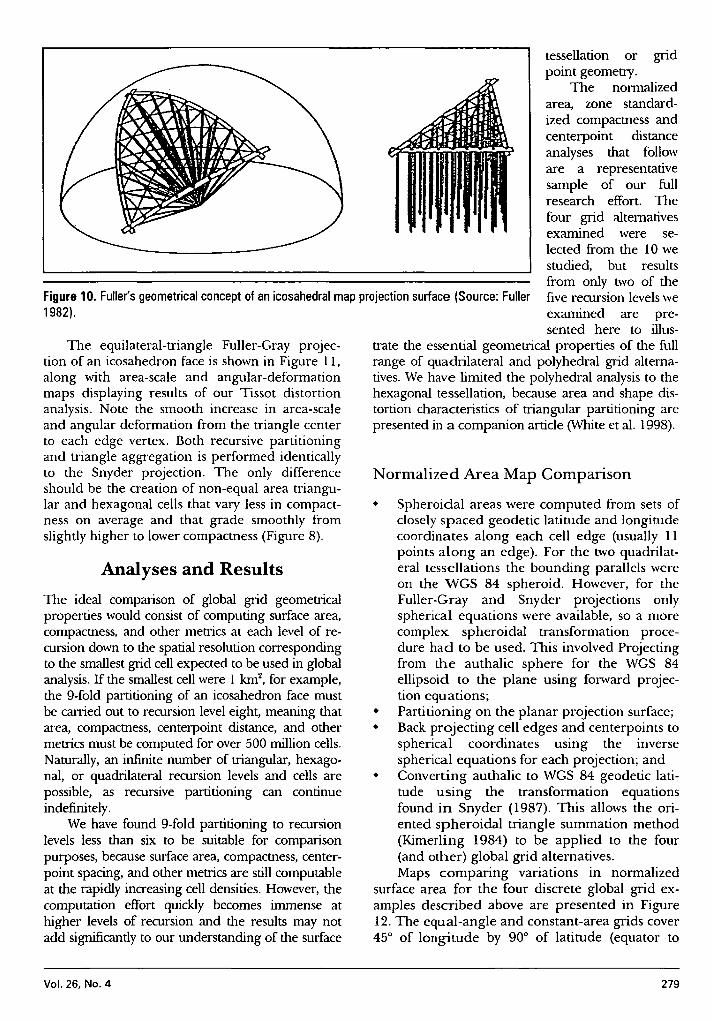
Del
iver
ed b
y P
ublis
hing
Tec
hnol
ogy
to O
rego
n S
tate
Uni
vers
ity IP
128
193
164
203
on
Sat
12
Nov
201
1 22
50
45C
opyr
ight
(c)
Car
togr
aphy
and
Geo
grap
hic
Info
rmat
ion
Soc
iety
All
right
s re
serv
ed
Figure 10 Fullers geometrical concept of an icosahedral map projection surface (Source Fuller1982)
The equilateral-triangle Fuller-Gray projec-tion of an icosahedron face is shown in Figure 11along with area-scale and angular-deformationmaps displaying results of our Tissot distortionanalysis Note the smooth increase in area-scaleand angular deformation from the triangle centerto each edge vertex Both recursive partitioningand triangle aggregation is performed identicallyto the Snyder projection The only differenceshould be the creation of non-equal area triangu-lar and hexagonal cells that vary less in compact-ness on average and that grade smoothly fromslightly higher to lower compactness (Figure 8)
Analyses and ResultsThe ideal comparison of global grid geometricalproperties would consist of computing surface areacompactness and other metrics at each level of re-cursion down to the spatial resolution correspondingto the smallest grid cell expected to be used in globalanalysis If the smallestcellwere 1 km2 for examplethe 9-fold partitioning of an icosahedron face mustbe carried out to recursion level eight meaning thatarea compactness centerpoint distance and othermetries must be computed for over 500 million cellsNaturally an infinite number of triangular hexago-nal or quadrilateral recursion levels and cells arepossible as recursive partitioning can continueindefinitely
We have found 9-fold partitioning to recursionlevels less than six to be suitable for comparisonpurposes because surface area compactness center-point spacing and other metries are still computableat the rapidly increasing cell densities However thecomputation effort quickly becomes immense athigher levels of recursion and the results may notadd significantlyto our understanding of the surface
Vol 26 No4
tessellation or gridpoint geomeoy
The normalizedarea zone standard-ized compactness andcenterpoint distanceanalyses that followare a representativesample of our fullresearch effort Thefour grid alternativesexamined were se-lected from the lOwestudied but resultsfrom only two of thefive recursion levelsweexamined are pre-sented here to illus-
trate the essential geometrical properties of the fullrange of quadrilateral and polyhedral grid alterna-tivesWe have limited the polyhedral analysis to thehexagonal tessellation because area and shape dis-tortion characteristics of triangular partitioning arepresented in a companion article (White et al 1998)
Normalized Area Map Comparison
bull Spheroidal areas were computed from sets ofclosely spaced geodetic latitude and longitudecoordinates along each cell edge (usually 11points along an edge) For the two quadrilat-eral tessellations the bounding parallels wereon the WGS 84 spheroid However for theFuller-Gray and Snyder projections onlyspherical equations were available so a morecomplex spheroidal transformation proce-dure had to be used This involved Projectingfrom the authalic sphere for the WGS 84ellipsoid to the plane using forward projec-tion equations
bull Partitioning on the planar projection surfacebull Back projecting cell edges and centerpoints to
spherical coordinates using the inversespherical equations for each projection and
bull Converting authalic to WGS 84 geodetic lati-tude using the transformation equationsfound in Snyder (1987) This allows the ori-ented spheroidal triangle summation method(Kimerling 1984) to be applied to the four(and other) global grid alternativesMaps comparing variations in normalized
surface area for the four discrete global grid ex-amples described above are presented in Figure12 The equal-angle and constant-area grids cover45deg of longitude by 90deg of latitude (equator to
279
Del
iver
ed b
y P
ublis
hing
Tec
hnol
ogy
to O
rego
n S
tate
Uni
vers
ity IP
128
193
164
203
on
Sat
12
Nov
201
1 22
50
45C
opyr
ight
(c)
Car
togr
aphy
and
Geo
grap
hic
Info
rmat
ion
Soc
iety
All
right
s re
serv
ed
Fuller-Grey map projection
Icosahedron Face Area Distortion Angular Deformation
Tissot distortion analysis
Figure 11 Fuller-Gray map projection and Tissot distortion analysis for an icosahedron face
pole) or 1I16th of the globe Each icosahedronface of course covers 120th of the globe so thatthe surface areas of comparison surfaces are ap-proximately the same The level of recursion foreach grid was selected so that the average cell areawithin each grid is nearly the same From thesemaps in Figure 12 it is apparent thatbull The larger range in normalized area (0069 -
1569 or 150 percent) associated with theequal-angle grid makes it as expected by farthe worst alternative of the four
bull The constant-area grid has a greater range ofnormalized area than either the Snyder orFuller-Gray grids The pattern of spatialvariation is one of identical normalized areawithin east-west bands Cell areas also de-crease slowly from south to north within thethree blocks in the bottom half of the maphaving identical meridians as cell boundariesSuch regularity is not present in the rows ofcells forming the top half of the map
bull Normalized hexagon areas on the Fuller-Grayprojection decrease smoothly from a value of106 (6 percent above average) at the icosahe-dron face center to a lower value of 0944near each corner The very low normalizedarea for the triangle at each corner is causedby this being one of five spherical triangles onadjacent icosahedron faces that together formone of 12 pentagonal cells on the globe Eachpentagon area is 56th that of the averagehexagonal cell which gives the lower normal-ized area
280
bull Normalized hexagon areas on the Snyderprojection are identical and just slightly largerthan 10 so as to offset the three smaller areasof corner pentagonal cells If the pentagonareas are removed from the calculations allhexagons are measured as having a 10 nor-malized surface area a numerical demonstra-tion that the Snyder equations for theicosahedron do indeed produce an equal areamap projection surfaceWe next examine the spatial pattern of nor-
malized area for hexagons at recursion levelsthree and four for the 9-fold partitioning of theFuller-Gray and Snyder projection surfaces Theresults are presented in the four orthographicmap projections of icosahedron faces shown inFigure 13 In each of the three Snyder projectiongrids the normalized areas of hexagonal cells areidentical but the normalized area value of thegrid rapidly approaches 10 as the level of recur-sion increases This is due to the progressivelysmaller contribution of the pentagonal cornercells to the total area of the icosahedron face
At increasing levelsof recursion the Fuller-Gray projection grids show a progressive smooth-ing of normalized area variation as the level ofrecursion increases By the fourth level thesmooth pattern of reduction in normalized areafrom the icosahedron center toward each edgeclosely mirrors the Tissot area distortion isolinesdefining the continuous area distortion surface Asexpected the spatial pattern of continuous Tissotarea distortion and of discrete normalized cell
Cartography and Geographic Information Science
Del
iver
ed b
y P
ublis
hing
Tec
hnol
ogy
to O
rego
n S
tate
Uni
vers
ity IP
128
193
164
203
on
Sat
12
Nov
201
1 22
50
45C
opyr
ight
(c)
Car
togr
aphy
and
Geo
grap
hic
Info
rmat
ion
Soc
iety
All
right
s re
serv
ed
Figure 12 Normalized-area comparison for basic segments of four global grids eachshown on an orthographic map projection to simulate the Earths sphericity
1110
1569
0069
09190813077
Figure 16 displays maps of an icosahedron face onthe Fuller-Gray and Snyder projection surfaces thatdepict variations in centerpoint distance betweenadjacent hexagons for 9-fold hexagonal partitioningat three levels of recursion (similar research on
Centerpoint Distance Map Comparison
and the other cells be-coming progressivelymore square in shape asthe equator ISapproached
bull The Snyder grid centerhexagon has the lowestcompactness (ignoringthe inherently lowercompactness pentagonsegments at each corner)The bowed pairs of hexa-gon edges along eachaxis of higher angulardeformation producelower compactness hexa-gons than those fartheraway from each axiswhere higher ZSC valuesvary only slightly and
bull Except for the lower com-pactness comer pentagoncells ZSCvalues across theFuller-Graygrid are consis-tently higher than the otherthree alternativeswith thehighest value at the icosahe-dron center and a slightsmooth decrease radiallyoutward from the centerAs done with normalized
area the spatial pattern ofZSC for hexagonal grids9-fold partitioned to recur-sion levels three and four wasexamined for the Fuller-Gray
and Snyder map projection surfaces (Figure 15)Both grids show a progressive smoothing of ZSCvalues also seen in the area analysis with increas-ing levels of recursion In both grids the spatialpattern of slightly lower to higher compactnessclosely mirrors the Tissot angular deformationisoline pattern for the map projection becomingspatially indistinguishable by recursion level fourHence Tissot angular deformation can be used topredict the spatial pattern of compactnessvariation
nyder
Equal Angle
1110
09190IIJ3077
FullerGray
Constant Area
Compactness Map Comparison
areas become indistinguishable at higher levels ofrecursIOn
Results from computation of Zone StandardizedCompactness (ZSC) for the four grid alternativesare presented in Figure 14 The portions of theglobe covered and levels of recursion selected forthe area comparisons are used here as well toinsure that the average cell area of each grid issimilar These four ZSCmaps show thatbull Compactness variation is greatest by far for
the equal-angle grid as the basic cell shapesvary from narrow spherical triangles at thepole to spherical squares at the equator
bull There is relatively little variation in compact-ness across the constant-area grid in spite ofthe cell at the pole being triangular in shape
Vol 26 No4 281
Del
iver
ed b
y P
ublis
hing
Tec
hnol
ogy
to O
rego
n S
tate
Uni
vers
ity IP
128
193
164
203
on
Sat
12
Nov
201
1 22
50
45C
opyr
ight
(c)
Car
togr
aphy
and
Geo
grap
hic
Info
rmat
ion
Soc
iety
All
right
s re
serv
ed
Figure 13 Normalized-areacomparison for two recursionlevels of the Fuller-Gray andISEA grids each shown on anorthographic map projection tosimulate the Earthssphericity
9-Fold Recursion Level 31060
fl
nil r ra n der
ld e ur ion Le el 4
FullerGray
1060
O9n J
U71~
Snyder
quadrilateral centerpoint distance for the equal-angle and constant-area grids is underway) Thisexample of our centerpoint distance analysis showshow variations in great-circle distance between adja-cent pairs of hexagon centers can be mapped
The six equilateral triangles fonning each hexa-gon can be thought of as map symbols shaded ac-cording to the distance between the hexagon centerand the centerpoint of adjacent hexagons to thenorth (0deg) northeast (60deg) southeast (120deg) south(180deg) southwest (240deg) and northwest (300deg) as-suming north to be at the top of the page
At the lowest level of recursion (top-rightmap) the general pattern of larger (darker gray)and smaller (lighter gray) distances relative to theaverage (medium gray) centerpoint to centerpointdistance are aligned with the three axes of higherangular deformation for the Snyder projection aswe would expect The shortest distances are alongeach axis and the longest distances are adjacentand roughly perpendicular to each axis Thisspatial pattern of centerpoint distance variation
282
persists and becomes better defined at the nexttwo higher levels of recursion At the highest levelexamined here (bottom-right map) the largerand smaller distances clearly are localized alongeach axis grading toward average values in apropeller-like pattern that corresponds with theTissot angular deformation isolines Indeed theTissot diagram in Figure 7 is an excellent predic-tor of where variations in centerpoint distanceshould occur on the Snyder grid
The spatial pattern of centerpoint distance varia-tion for the hexagonally partitioned Fuller-Grayprojection surfaceis not easilydiscerned at the lowestlevel of recursion (upper-left map) but becomesreadily visible at the next two higher levelsAs withthe Snyder projection Tissot angular deformationisolines predict the spatial pattern of little variationin the center of the icosahedron face with progres-sivelylarger centerpoint distance variations (often inlonger-shorter distance adjacent pairs) as each edgeis approached Overall there appears to be slightlyless centerpoint distancevariation on the Fuller-Gray
Cartography and Geographic Information Science
Del
iver
ed b
y P
ublis
hing
Tec
hnol
ogy
to O
rego
n S
tate
Uni
vers
ity IP
128
193
164
203
on
Sat
12
Nov
201
1 22
50
45C
opyr
ight
(c)
Car
togr
aphy
and
Geo
grap
hic
Info
rmat
ion
Soc
iety
All
right
s re
serv
ed
Figure 14 Compactness comparison for basic segments offour global grids each shown on an orthographic map projec-tion to simulate the Earths sphericity
the icosahedron face always creates 12 penta-gons on the globe exactly 56th the area of eachhexagon the surface area standard deviation forthe Snyder grid will always be slightly greaterthan zero even though there is no area variationamong the hexagons formed However at pro-gressively higher levels of recursion the 12pentagons occupy increasingly less of the totalsurface area and the standard deviation for theentire globe rapidly approaches zero Hencethis graph shows the Snyder grid to be clearlysuperior for hexagonal subcells less than100000 km2 in area
Variation in centerpoint spacing between adja-cent cells for the four grid alternatives can be ana-lyzed by graphing logarithmically the standarddeviation in normalized centerpoint spacingagainst average cell area at increasing levels ofrecursion (Figure 18) This graph shows the gridsto perform similarly except for the poorly per-forming EqualAngleQuadrilateral grid The Fullerand Constant Area Quadrilateral grids converge athigher recursion levels to essentially identical lowstandard deviations closely followed by the Snydergrid
Average subcell compactness values for thefour grids (Figure 19) shows the superior perform-ance of icosahedral models over quadrilateralwhich is to be expected since hexagonal shapes are
bullbull~
nyder
Equal Angle
FuUerGra
Constant Area
9middotFold Recur ion Level 4
FuJlerGra ~ n der
0951
U95
09-10U9IJOll(S
9-FoldRecursion Level 3
FullerGray Snyder
Because variation in cell surface area is amajor concern for geostatisticians andothers we analyzed the variation innormalized cell area with increasinglevels of recursion Figure 17 is a loga-rithmic graph of the standard deviationin normalized-cell area versus the de-creasing average-cell area at increasinglevels of recursion for the four discreteglobal grid alternatives (but only thehexagonal grids formed by Snyder andFuller-Gray projection subtriangles)examined graphically above Recogniz-ing that the hexagonal partitioning of
Figure 15 Compactness comparison for tworecursion levels of the Fuller-Gray and ISEAgrids each shown on an orthographic mapprojection to simulate the Earths sphericity
hexagonal grid but this can only be shownconclusivelyby a statistical comparison ofalternativegrids
Statistical Comparison Results
Vol 26 NO4 283
Del
iver
ed b
y P
ublis
hing
Tec
hnol
ogy
to O
rego
n S
tate
Uni
vers
ity IP
128
193
164
203
on
Sat
12
Nov
201
1 22
50
45C
opyr
ight
(c)
Car
togr
aphy
and
Geo
grap
hic
Info
rmat
ion
Soc
iety
All
right
s re
serv
ed
140km
190km
560 km
1300 kIT
1650 kIT
425 m
SnyderProjection
RecursionLevel 7
RecursionLevel 3
RecursionLevel 5
Fuller-GrayProjection
Figure 16 Variations in hexagonal centerpoint spacing at three levels of recursionfor the Fuller and ISEA Grids on an icosahedron face
In addition to the detailed nu-merical analysis of grid-cellarea compactness and center-point spacing at different levelsof recursion we carried out anoverall comparison of numerous
Summary Rankings
inherently more compact thanrectangular shapes At all levels ofrecursion the Fuller grid is com-prised of hexagons slightly morecompact than correspondingSnyder grid hexagons both beingfar more compact than the corre-sponding constant area and equalangle grid quadrilaterals
Variation in subcell compact-ness seen by graphing the stan-dard deviation of cell compactnessvalues against average cell area(Figure 20) shows the slightlybetter performance of the Fullergrid over the Snyder grid athigher levels of recursion Theconstant-area grid has the lowestoverall standard deviation at itsinitial resolution (level 0) but itsstandard deviation increases rap-idly as the initial cells are parti-tioned in an equal-angle mannerHowever the poor performanceassociated with the equal-anglegrid at all levels of recursion isnever approached
l2 Equal Angle Quadrilateral1 05 Bgt 0- 3GlC RecursionC 01 Level Constant Area QuadrilateralbullIII 1 0 8
3C ~1 2l bull 83 4 5III
1 2 Fuller-Gray ProjectionenIII 01Glbullc(
4i0C 001
~ia 5Ebull0Z 0001
107
106
105 4 3 2
10 10 102Average Cell Area km (log10 scale)
discrete global grid alternatives in-cluding the seven presented in Table1 Eleven of the fourteen Goodchildcriteria were investigated along withtwo related criteria deemed signifi-cant for global grid comparison ForGoodchild criteria 2 4 and 5 a sum-mary ordinal ranking from 1 (verypoor) to 10 (best possible) was devel-oped based on the quantitative analy-sis of comparison metrics
Table 1 provides informationcrucial to the selection of a global
Figure 17 Normalized subcell area standarddeviation vs average cell area for four globalgrids
284 Cartography and Geographic Information Science
Del
iver
ed b
y P
ublis
hing
Tec
hnol
ogy
to O
rego
n S
tate
Uni
vers
ity IP
128
193
164
203
on
Sat
12
Nov
201
1 22
50
45C
opyr
ight
(c)
Car
togr
aphy
and
Geo
grap
hic
Info
rmat
ion
Soc
iety
All
right
s re
serv
ed
Criterion Equal Angle Constant Area Snyder Fuller-Gray Small Circle Dir Sphere Gnomonic
1 Domain is globe yes yes yes yes yes yes yes
2 Equal areal 1 7 10 8 10 6 3
3 Same topology yes no yes yes yes yes yes
4 Equal shape 1 3 7 8 7 9 9
5 Compactnessmiddot 1 4 7 8 8 8 9
6 Straight edges onprojection na2 na yes yes na na yes
7 Perimeter bisection J ni ni ni ni ni nin1
8 Hierarchy yes yes yes4 yes4 yes4 yes4 yes4
9 Single point yes yes yes yes yes yes yes
10 Maximally centered ni ni ni ni ni ni ni
11 Equidistant no no no no no no no
12 Addressing ni ni ni ni oi ni ni13 LatitudelLongitude yes yes yes yes yes yes yes
14 Arbitrary resolution yes yes yes yes yes yes yes
Geodesic edge lines no no no no no yes yes
Spatial nature of area Continuously Part continu- Constant Continuously Constant Fractal-like Continuouslyvariation varying ous part varying varying
irregular
IBest possible = 10 very good = 9 -7 very poor = 1
2 na = not applicable
J ni = not investigated
4 Only the triangular cells not the hexagonal are hierarchical in these grids
Table 1 Evaluation of Goodchilds and related comparison criteria for different global grids
Figure 18 Normalized centerpoint distance standard deviation vs average cellarea for four global grids
ConclusionsThe global grid evaluation crite-ria and associated metrics haveallowed us to compare gridsvarying widely in cell geometryand topology We have observedthat the prime areas of concernamong the small portion of theglobal data user community wehave interacted with to date areequal-area cells and a nested
spherical subdivision the small circle subdivisionmethod and the Fuller-Gray map projection forthe icosahedron If good overall performance is ofparamount concern the triangular andor hex-agonal partitioning of the Fuller-Gray projectionsurface might be selected due to the low variationin compactness of highly compact cells that vary
slightly in area in a continuouslyvarying predictable manner
2 3 4 6
JL------ ~2 1 2 3Constant Area Quadrilateral
Equal Angle Quadrilateral2 38 8
o~RecursionLevel
Snyder Projection ~Fuller-Gray 1
Projection
ampoc i 100gtQG)aiCcEG)1lIo ~ 01isNrn=G)~~S~ III 011-------------------------------
B l 11 1~ 1~ 1~ 1~2Average Cell Area km (log0 scale)
grid based on the relative importance of evalua-tion criteria from the users perspective If cellcompactness is of prime importance for examplea triangular or hexagonal grid based on partition-ing a Gnomonic map projection of an icosahe-dron face (not discussed in this article) would bethe best alternative closely followed by direct
Vol 26 No4 285
Del
iver
ed b
y P
ublis
hing
Tec
hnol
ogy
to O
rego
n S
tate
Uni
vers
ity IP
128
193
164
203
on
Sat
12
Nov
201
1 22
50
45C
opyr
ight
(c)
Car
togr
aphy
and
Geo
grap
hic
Info
rmat
ion
Soc
iety
All
right
s re
serv
ed
Figure 19 Normalized subcell average compactness VS average cell area for fourglobal grids
Figure 20 Normalized subcell compactness standard deviation vs average cellarea for four global grids
(1)
Equal Angle Quadrilateral
2 3 4 5bull 0
2 3 4 5
1 2 3 Constant Area auadrilateral
2Equal Angle Quadrilateral
3 4 5
Zone area = 2x 1tX r2 (10 - sin $)
RecursionLevel
o0-0 ---_e_----lto---
RecursionLevel
APPENDIXZone Standardized Compactness
(ZSC)Derivation
6 5 4 310 10 10 10
Average Cell Area km2 (10910 scale)
------ --_---lt~ 2 3 4
o
where r is the radius of the sphere and ltP is thelatitude of the bounding parallel
The surface area of a spherical zone is computedfrom
will give a full picture of the strengths and weak-nesses of current global grid alternatives
o
Constant AreaQuadrilateral
_~~ iFuller-Gray 1 2 Projection 3 4 5
o
Fuller-GrayProjection 1
Snyder Projection 1gt-------------------
05
00011------7---- ----------4 -----r--~2
10 10 10 10 10 102Average Cell Area km (10910scale)
CIl()CI)5 01 =() r~2Emlt3 ~- C 01=Gl 0 =0CO
111iii iii 001 =Ebulloz
IIIIII
CII CIImS 09tll ()bullbull tllClIogt Elt0o
08
hierarchy among cells (criteria 2and 8) Both the quadrilateralgrids and triangular forms ofpolyhedral grids examined herecan be partitioned recursivelyallowing a nested hierarchy tobe created Equal-area cells isthe critical criterion since cur-rently employed equal-angleand constant-area quadrilateralgrids can never be equal areaand were shown to performpoorly in this respect relative toseveral alternative grids
Only two global grids thosebased on the triangular partition-ing of the Icosahedral SnyderEqual Area (ISFA)projection andpartitioning using the Small Cir-cle Subdivision method (not dis-cussed in this article but describedin Song 1997)will produce equal-area cells on the spheroid TheSmall Circle Subdivision methodhas the advantage of producingcells slightly more compact butthe ISFA grid is currently moreefficient to compute and easier toimplement Consequently werecommend the ISFA as the bestcurrent choice for an equal areaglobal grid Whichever global gridis selected there are implementa-tion issues that must be addressedin future research includingbull Implementing an efficient
addressing scheme for bin-ning data into grid cells
bull Creating algorithms for fasttranslation of gridded data to and from geo-detic latitude and longitude
bull Developing efficient algorithms for aggrega-tion and disaggregation among nested gridlevels and
bull Implementing efficient data storage andaccess schemes for data in nested cells includ-ing metadata storage and accessWe have begun to address several of these im-
plementation facets for the ISFA grid beginningwith an ETOP05 DEM dataset binning experimentconducted at several levels of recursion (seehttpbufogeoorstedufirmatdgg for binning ex-amples) Performing similar implementation experi-ments on additional datasets using other candidategrids would provide a complementary grid compari-son that together with our geometrical comparisons
286 Cartography and Geographic Information Science
Del
iver
ed b
y P
ublis
hing
Tec
hnol
ogy
to O
rego
n S
tate
Uni
vers
ity IP
128
193
164
203
on
Sat
12
Nov
201
1 22
50
45C
opyr
ight
(c)
Car
togr
aphy
and
Geo
grap
hic
Info
rmat
ion
Soc
iety
All
right
s re
serv
ed
REFERENCES
ACKNOWLEDGMENTS
so that
EidenshinkJC andJL Faundeen 1994 The 1 km AVHRRglobal land data set First stages of implementation Inierna-tionaljournal of Remote Sensing 153443-62
Fekete G and L Treinish 1990 Sphere quadtree A newdata structure to support the visualization of sphericallydistributed data SPIE Extracting rManing from complex dataProcessing display interaction Vol 1259 pp 242-53
Fuller RB 1982 SynergeticJ NewYork MacMillanGiacaglia GEO and CA Lundquist 1972 Sampling func-
tions for geophysics Smithsonian A5trvphysical Observatory Spe-cial Report No 344 93 pp
Goodchild MF 1994 Geographical grid models for environ-mental monitoring and analysis across the globe (panelsession) In proceddings of GISUS 94 Conference PhoenixArizona
Gray RW 1994 Exact transformation equations for Fullersworld map Cartography and Geographic Informatian Systems21(4) 243-46
Hastings DA 1996 The global land l-km base elevationdigital elevation model A progress report Global ChangeNewsletter 27 11-12
Heikes R and DA Randall 1995 Numerical integration ofthe shallow-water equations on a twisted icosahedral gridPart I Basic design and results of tests Monthly WeatherReview 123 1862-80
Kahn R 1995 What shall we do with the data we are expect-ing in 1998 In Proceedings of the Massive Data SelJ WorkshopCommittee on Applied and Theoretical Statistics NationalAcademy of Sciences Washington DC
Kimerling AJ 1984 Area computation from geodetic coordi-nates on the spheroid Surveying and Mapping 44(4) 343-51
Kimerling AJ D White K Sahr and L Song 1995 Devel-opment of global sampling grid Mid-project report Samplingdesign and statistics research for EMAP Program us Environ-mental Protection Agency Corvallis Oregon
Loveland TR JW Merchant D O Ohlen and JF Brown1991 Development of a land-cover characteristics databasefor the conterminous US Photogrammetric Engineering andRemote Sensing 57(11) 1453-63
Lukatela H 1987 Hipparchus geopositioning model Anoverview In Proceedings of Auto Carto 8 Symposium Balti-more Maryland pp 87-96
Maling DH 1992 Coordinate systems and map projectioru (2nded) Oxford UK Pergamon Press
Muehrcke PC and JO Muehrcke 1997 Map we (4th ed) Madi-sonWisconsinJP Publications
Olea RO 1984 Sanlpling design optimization for spatial functionsMathematical Geowgy 16369-92
Saff EB and ABJ Kuijlaars 1997 Distnbuting many points on asphere The Mathematical Intelligencer 19(1)5-11
Slade G 1994 Self avoiding walks The MaJhematical Intelligencer16(1)29-35
Snyder JP 1987 Map projectioru-A working manual Wash-ington DC US Government Printing Office
Snyder JP 1992 An equal-area map projection for polyhe-dral globes Cartographica 29(1) 10-21
Song L 1997 Small circle subdivision method for develop-ment of global sampling grid Unpublished Masters thesisOregon State University 176 pp
Stauffer D 1992 Introduction to percolation theory (2nd ed)London UK Taylor amp Francis
Tobler WR and Z Chen 1986 A quadtree for global infor-mation storage GeographicalAnalysis 18(4) 360-71
White D A J Kimerling and WS Overton 1992 Carto-graphic and geometric components of a global samplingdesign for environmental monitoring Cartography and Geo-graphic Information Systems 195-22
White D AJ Kin1erlingK Sahr and L Song 1998 Comparingarea and shape distortion on polyhedral-based recursive partitionsof the sphere International Journal of Geographiad Information Science12 805-27
Wolfram S 1986 Cellular automaton fluids 1 Basic theoryjournal of Statistical Physics 45471-526 bull
(5)Zone perimeter = 2XTCXr(co~)
ZSG = SQ1middott(4XTCxcellarea - cellarea2lr2) I cellperimeter (6)
Zone Standardized Compactness (ZSC) isgiven by Zone perimeterCell perimeter Substi-tuting and combining equations we compute ZSCfrom
Baumgardner JR and PO Frederickson 1985 Icosahedraldiscretization of the two-sphere SIAM journal of NUrMricalAnalysis 22(6) 1107-15
Bomford G 1971 Geodesy Oxford The Clarendon Press731 pp
Brooks DR 1981 Grid systems for Earth radiation budgetexperiment applications NASA Technical Memorandum8323340 pp
Coexeter HSM 1962 The problem of packing a number ofequal nonoverlapping circles on a sphere Transactions NewYork Academy of Science Division of Mathematics Series IIvol 24 320-31
Dutton G 1988 Geodesic modeling of planetary relief Car-tographica 21 188-207
Dutton G 1994 Geographical grid models for environmentalmonitoring and analysis across the globe (panel session) InProceedings of GISUS 94 Conference Phoenix Arizona
cos$ =sqrt( IO-(IO-cellareal(2xTCX r2)) (4)
The perimeter of the spherical zone is thecircumference of the bounding parallel computedfrom
Gelarea = 2XTCxr2(lO-sin$) (2)
This research was supported by US Environ-mental Protection Agency-Oregon State Univer-sity Cooperative Agreement CR 821672 MatthewGregory Department of Geosciences graduatestudent created the centerpoint distance mapsseen in Figure 16 Dr Ralph Kahn NASA-JPLalso contributed significantly to this manuscriptThis manuscript has been subjected to EPA reviewand approved for publication The conclusionsand opinions are solely those of the authors andnot necessarily the viewsof the Agency
and
Setting the zone surface area equal to the cellarea we obtain
Vol 26 NO4 287
Del
iver
ed b
y P
ublis
hing
Tec
hnol
ogy
to O
rego
n S
tate
Uni
vers
ity IP
128
193
164
203
on
Sat
12
Nov
201
1 22
50
45C
opyr
ight
(c)
Car
togr
aphy
and
Geo
grap
hic
Info
rmat
ion
Soc
iety
All
right
s re
serv
ed
Remote Sensing for theEarth Sciences (3rd ed)Andrew Rencz
Recently adopted titlesin cartography GISremote sensingandGPS
Policy Issues in Modern art graph)DR Frazer Taylor (cd)
Wilderness NavigationBob and Mike Bums
I bullbull
ACS
Maps with the NewsMark Monmonier
Air Apparent HowMeteorologists Learnedto Map Predict andDramatize WeatherMark Monmonier
froooks
Mapping a Northern LandThe Survey of CanadaGerald McGrath and LouisSebert (eds)
Thematic Cartographyand VisualizationTerry A Slocum
1 it 11 bull
on Oirle ~y a30149j- ~24)
288 Cartography and Geographic Information Science
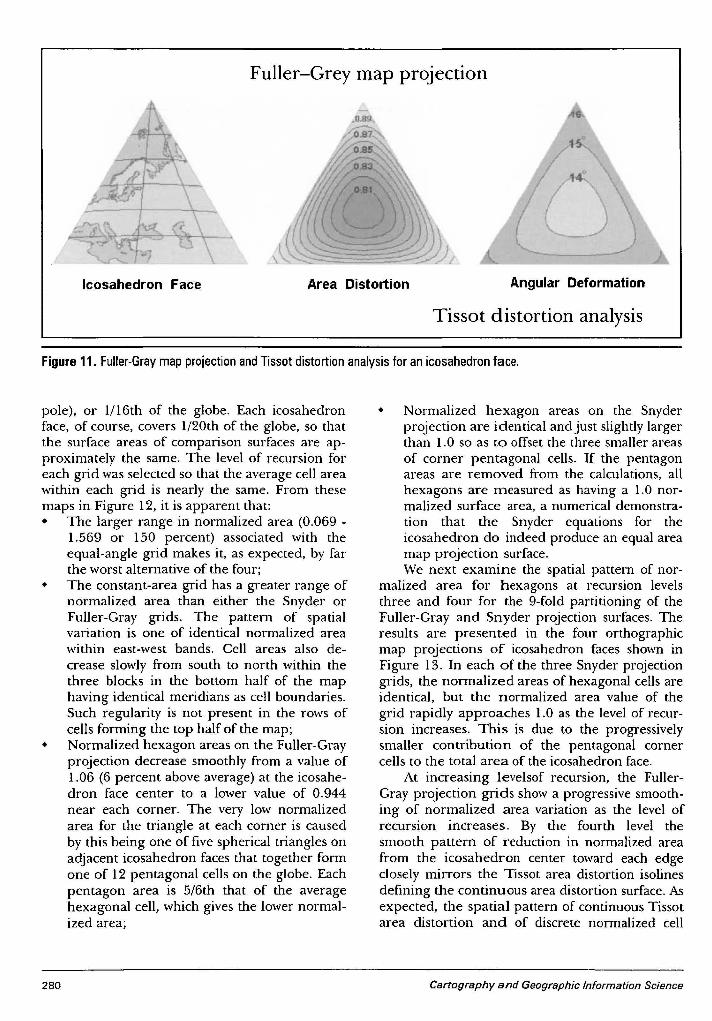
Del
iver
ed b
y P
ublis
hing
Tec
hnol
ogy
to O
rego
n S
tate
Uni
vers
ity IP
128
193
164
203
on
Sat
12
Nov
201
1 22
50
45C
opyr
ight
(c)
Car
togr
aphy
and
Geo
grap
hic
Info
rmat
ion
Soc
iety
All
right
s re
serv
ed
Fuller-Grey map projection
Icosahedron Face Area Distortion Angular Deformation
Tissot distortion analysis
Figure 11 Fuller-Gray map projection and Tissot distortion analysis for an icosahedron face
pole) or 1I16th of the globe Each icosahedronface of course covers 120th of the globe so thatthe surface areas of comparison surfaces are ap-proximately the same The level of recursion foreach grid was selected so that the average cell areawithin each grid is nearly the same From thesemaps in Figure 12 it is apparent thatbull The larger range in normalized area (0069 -
1569 or 150 percent) associated with theequal-angle grid makes it as expected by farthe worst alternative of the four
bull The constant-area grid has a greater range ofnormalized area than either the Snyder orFuller-Gray grids The pattern of spatialvariation is one of identical normalized areawithin east-west bands Cell areas also de-crease slowly from south to north within thethree blocks in the bottom half of the maphaving identical meridians as cell boundariesSuch regularity is not present in the rows ofcells forming the top half of the map
bull Normalized hexagon areas on the Fuller-Grayprojection decrease smoothly from a value of106 (6 percent above average) at the icosahe-dron face center to a lower value of 0944near each corner The very low normalizedarea for the triangle at each corner is causedby this being one of five spherical triangles onadjacent icosahedron faces that together formone of 12 pentagonal cells on the globe Eachpentagon area is 56th that of the averagehexagonal cell which gives the lower normal-ized area
280
bull Normalized hexagon areas on the Snyderprojection are identical and just slightly largerthan 10 so as to offset the three smaller areasof corner pentagonal cells If the pentagonareas are removed from the calculations allhexagons are measured as having a 10 nor-malized surface area a numerical demonstra-tion that the Snyder equations for theicosahedron do indeed produce an equal areamap projection surfaceWe next examine the spatial pattern of nor-
malized area for hexagons at recursion levelsthree and four for the 9-fold partitioning of theFuller-Gray and Snyder projection surfaces Theresults are presented in the four orthographicmap projections of icosahedron faces shown inFigure 13 In each of the three Snyder projectiongrids the normalized areas of hexagonal cells areidentical but the normalized area value of thegrid rapidly approaches 10 as the level of recur-sion increases This is due to the progressivelysmaller contribution of the pentagonal cornercells to the total area of the icosahedron face
At increasing levelsof recursion the Fuller-Gray projection grids show a progressive smooth-ing of normalized area variation as the level ofrecursion increases By the fourth level thesmooth pattern of reduction in normalized areafrom the icosahedron center toward each edgeclosely mirrors the Tissot area distortion isolinesdefining the continuous area distortion surface Asexpected the spatial pattern of continuous Tissotarea distortion and of discrete normalized cell
Cartography and Geographic Information Science
Del
iver
ed b
y P
ublis
hing
Tec
hnol
ogy
to O
rego
n S
tate
Uni
vers
ity IP
128
193
164
203
on
Sat
12
Nov
201
1 22
50
45C
opyr
ight
(c)
Car
togr
aphy
and
Geo
grap
hic
Info
rmat
ion
Soc
iety
All
right
s re
serv
ed
Figure 12 Normalized-area comparison for basic segments of four global grids eachshown on an orthographic map projection to simulate the Earths sphericity
1110
1569
0069
09190813077
Figure 16 displays maps of an icosahedron face onthe Fuller-Gray and Snyder projection surfaces thatdepict variations in centerpoint distance betweenadjacent hexagons for 9-fold hexagonal partitioningat three levels of recursion (similar research on
Centerpoint Distance Map Comparison
and the other cells be-coming progressivelymore square in shape asthe equator ISapproached
bull The Snyder grid centerhexagon has the lowestcompactness (ignoringthe inherently lowercompactness pentagonsegments at each corner)The bowed pairs of hexa-gon edges along eachaxis of higher angulardeformation producelower compactness hexa-gons than those fartheraway from each axiswhere higher ZSC valuesvary only slightly and
bull Except for the lower com-pactness comer pentagoncells ZSCvalues across theFuller-Graygrid are consis-tently higher than the otherthree alternativeswith thehighest value at the icosahe-dron center and a slightsmooth decrease radiallyoutward from the centerAs done with normalized
area the spatial pattern ofZSC for hexagonal grids9-fold partitioned to recur-sion levels three and four wasexamined for the Fuller-Gray
and Snyder map projection surfaces (Figure 15)Both grids show a progressive smoothing of ZSCvalues also seen in the area analysis with increas-ing levels of recursion In both grids the spatialpattern of slightly lower to higher compactnessclosely mirrors the Tissot angular deformationisoline pattern for the map projection becomingspatially indistinguishable by recursion level fourHence Tissot angular deformation can be used topredict the spatial pattern of compactnessvariation
nyder
Equal Angle
1110
09190IIJ3077
FullerGray
Constant Area
Compactness Map Comparison
areas become indistinguishable at higher levels ofrecursIOn
Results from computation of Zone StandardizedCompactness (ZSC) for the four grid alternativesare presented in Figure 14 The portions of theglobe covered and levels of recursion selected forthe area comparisons are used here as well toinsure that the average cell area of each grid issimilar These four ZSCmaps show thatbull Compactness variation is greatest by far for
the equal-angle grid as the basic cell shapesvary from narrow spherical triangles at thepole to spherical squares at the equator
bull There is relatively little variation in compact-ness across the constant-area grid in spite ofthe cell at the pole being triangular in shape
Vol 26 No4 281
Del
iver
ed b
y P
ublis
hing
Tec
hnol
ogy
to O
rego
n S
tate
Uni
vers
ity IP
128
193
164
203
on
Sat
12
Nov
201
1 22
50
45C
opyr
ight
(c)
Car
togr
aphy
and
Geo
grap
hic
Info
rmat
ion
Soc
iety
All
right
s re
serv
ed
Figure 13 Normalized-areacomparison for two recursionlevels of the Fuller-Gray andISEA grids each shown on anorthographic map projection tosimulate the Earthssphericity
9-Fold Recursion Level 31060
fl
nil r ra n der
ld e ur ion Le el 4
FullerGray
1060
O9n J
U71~
Snyder
quadrilateral centerpoint distance for the equal-angle and constant-area grids is underway) Thisexample of our centerpoint distance analysis showshow variations in great-circle distance between adja-cent pairs of hexagon centers can be mapped
The six equilateral triangles fonning each hexa-gon can be thought of as map symbols shaded ac-cording to the distance between the hexagon centerand the centerpoint of adjacent hexagons to thenorth (0deg) northeast (60deg) southeast (120deg) south(180deg) southwest (240deg) and northwest (300deg) as-suming north to be at the top of the page
At the lowest level of recursion (top-rightmap) the general pattern of larger (darker gray)and smaller (lighter gray) distances relative to theaverage (medium gray) centerpoint to centerpointdistance are aligned with the three axes of higherangular deformation for the Snyder projection aswe would expect The shortest distances are alongeach axis and the longest distances are adjacentand roughly perpendicular to each axis Thisspatial pattern of centerpoint distance variation
282
persists and becomes better defined at the nexttwo higher levels of recursion At the highest levelexamined here (bottom-right map) the largerand smaller distances clearly are localized alongeach axis grading toward average values in apropeller-like pattern that corresponds with theTissot angular deformation isolines Indeed theTissot diagram in Figure 7 is an excellent predic-tor of where variations in centerpoint distanceshould occur on the Snyder grid
The spatial pattern of centerpoint distance varia-tion for the hexagonally partitioned Fuller-Grayprojection surfaceis not easilydiscerned at the lowestlevel of recursion (upper-left map) but becomesreadily visible at the next two higher levelsAs withthe Snyder projection Tissot angular deformationisolines predict the spatial pattern of little variationin the center of the icosahedron face with progres-sivelylarger centerpoint distance variations (often inlonger-shorter distance adjacent pairs) as each edgeis approached Overall there appears to be slightlyless centerpoint distancevariation on the Fuller-Gray
Cartography and Geographic Information Science
Del
iver
ed b
y P
ublis
hing
Tec
hnol
ogy
to O
rego
n S
tate
Uni
vers
ity IP
128
193
164
203
on
Sat
12
Nov
201
1 22
50
45C
opyr
ight
(c)
Car
togr
aphy
and
Geo
grap
hic
Info
rmat
ion
Soc
iety
All
right
s re
serv
ed
Figure 14 Compactness comparison for basic segments offour global grids each shown on an orthographic map projec-tion to simulate the Earths sphericity
the icosahedron face always creates 12 penta-gons on the globe exactly 56th the area of eachhexagon the surface area standard deviation forthe Snyder grid will always be slightly greaterthan zero even though there is no area variationamong the hexagons formed However at pro-gressively higher levels of recursion the 12pentagons occupy increasingly less of the totalsurface area and the standard deviation for theentire globe rapidly approaches zero Hencethis graph shows the Snyder grid to be clearlysuperior for hexagonal subcells less than100000 km2 in area
Variation in centerpoint spacing between adja-cent cells for the four grid alternatives can be ana-lyzed by graphing logarithmically the standarddeviation in normalized centerpoint spacingagainst average cell area at increasing levels ofrecursion (Figure 18) This graph shows the gridsto perform similarly except for the poorly per-forming EqualAngleQuadrilateral grid The Fullerand Constant Area Quadrilateral grids converge athigher recursion levels to essentially identical lowstandard deviations closely followed by the Snydergrid
Average subcell compactness values for thefour grids (Figure 19) shows the superior perform-ance of icosahedral models over quadrilateralwhich is to be expected since hexagonal shapes are
bullbull~
nyder
Equal Angle
FuUerGra
Constant Area
9middotFold Recur ion Level 4
FuJlerGra ~ n der
0951
U95
09-10U9IJOll(S
9-FoldRecursion Level 3
FullerGray Snyder
Because variation in cell surface area is amajor concern for geostatisticians andothers we analyzed the variation innormalized cell area with increasinglevels of recursion Figure 17 is a loga-rithmic graph of the standard deviationin normalized-cell area versus the de-creasing average-cell area at increasinglevels of recursion for the four discreteglobal grid alternatives (but only thehexagonal grids formed by Snyder andFuller-Gray projection subtriangles)examined graphically above Recogniz-ing that the hexagonal partitioning of
Figure 15 Compactness comparison for tworecursion levels of the Fuller-Gray and ISEAgrids each shown on an orthographic mapprojection to simulate the Earths sphericity
hexagonal grid but this can only be shownconclusivelyby a statistical comparison ofalternativegrids
Statistical Comparison Results
Vol 26 NO4 283
Del
iver
ed b
y P
ublis
hing
Tec
hnol
ogy
to O
rego
n S
tate
Uni
vers
ity IP
128
193
164
203
on
Sat
12
Nov
201
1 22
50
45C
opyr
ight
(c)
Car
togr
aphy
and
Geo
grap
hic
Info
rmat
ion
Soc
iety
All
right
s re
serv
ed
140km
190km
560 km
1300 kIT
1650 kIT
425 m
SnyderProjection
RecursionLevel 7
RecursionLevel 3
RecursionLevel 5
Fuller-GrayProjection
Figure 16 Variations in hexagonal centerpoint spacing at three levels of recursionfor the Fuller and ISEA Grids on an icosahedron face
In addition to the detailed nu-merical analysis of grid-cellarea compactness and center-point spacing at different levelsof recursion we carried out anoverall comparison of numerous
Summary Rankings
inherently more compact thanrectangular shapes At all levels ofrecursion the Fuller grid is com-prised of hexagons slightly morecompact than correspondingSnyder grid hexagons both beingfar more compact than the corre-sponding constant area and equalangle grid quadrilaterals
Variation in subcell compact-ness seen by graphing the stan-dard deviation of cell compactnessvalues against average cell area(Figure 20) shows the slightlybetter performance of the Fullergrid over the Snyder grid athigher levels of recursion Theconstant-area grid has the lowestoverall standard deviation at itsinitial resolution (level 0) but itsstandard deviation increases rap-idly as the initial cells are parti-tioned in an equal-angle mannerHowever the poor performanceassociated with the equal-anglegrid at all levels of recursion isnever approached
l2 Equal Angle Quadrilateral1 05 Bgt 0- 3GlC RecursionC 01 Level Constant Area QuadrilateralbullIII 1 0 8
3C ~1 2l bull 83 4 5III
1 2 Fuller-Gray ProjectionenIII 01Glbullc(
4i0C 001
~ia 5Ebull0Z 0001
107
106
105 4 3 2
10 10 102Average Cell Area km (log10 scale)
discrete global grid alternatives in-cluding the seven presented in Table1 Eleven of the fourteen Goodchildcriteria were investigated along withtwo related criteria deemed signifi-cant for global grid comparison ForGoodchild criteria 2 4 and 5 a sum-mary ordinal ranking from 1 (verypoor) to 10 (best possible) was devel-oped based on the quantitative analy-sis of comparison metrics
Table 1 provides informationcrucial to the selection of a global
Figure 17 Normalized subcell area standarddeviation vs average cell area for four globalgrids
284 Cartography and Geographic Information Science
Del
iver
ed b
y P
ublis
hing
Tec
hnol
ogy
to O
rego
n S
tate
Uni
vers
ity IP
128
193
164
203
on
Sat
12
Nov
201
1 22
50
45C
opyr
ight
(c)
Car
togr
aphy
and
Geo
grap
hic
Info
rmat
ion
Soc
iety
All
right
s re
serv
ed
Criterion Equal Angle Constant Area Snyder Fuller-Gray Small Circle Dir Sphere Gnomonic
1 Domain is globe yes yes yes yes yes yes yes
2 Equal areal 1 7 10 8 10 6 3
3 Same topology yes no yes yes yes yes yes
4 Equal shape 1 3 7 8 7 9 9
5 Compactnessmiddot 1 4 7 8 8 8 9
6 Straight edges onprojection na2 na yes yes na na yes
7 Perimeter bisection J ni ni ni ni ni nin1
8 Hierarchy yes yes yes4 yes4 yes4 yes4 yes4
9 Single point yes yes yes yes yes yes yes
10 Maximally centered ni ni ni ni ni ni ni
11 Equidistant no no no no no no no
12 Addressing ni ni ni ni oi ni ni13 LatitudelLongitude yes yes yes yes yes yes yes
14 Arbitrary resolution yes yes yes yes yes yes yes
Geodesic edge lines no no no no no yes yes
Spatial nature of area Continuously Part continu- Constant Continuously Constant Fractal-like Continuouslyvariation varying ous part varying varying
irregular
IBest possible = 10 very good = 9 -7 very poor = 1
2 na = not applicable
J ni = not investigated
4 Only the triangular cells not the hexagonal are hierarchical in these grids
Table 1 Evaluation of Goodchilds and related comparison criteria for different global grids
Figure 18 Normalized centerpoint distance standard deviation vs average cellarea for four global grids
ConclusionsThe global grid evaluation crite-ria and associated metrics haveallowed us to compare gridsvarying widely in cell geometryand topology We have observedthat the prime areas of concernamong the small portion of theglobal data user community wehave interacted with to date areequal-area cells and a nested
spherical subdivision the small circle subdivisionmethod and the Fuller-Gray map projection forthe icosahedron If good overall performance is ofparamount concern the triangular andor hex-agonal partitioning of the Fuller-Gray projectionsurface might be selected due to the low variationin compactness of highly compact cells that vary
slightly in area in a continuouslyvarying predictable manner
2 3 4 6
JL------ ~2 1 2 3Constant Area Quadrilateral
Equal Angle Quadrilateral2 38 8
o~RecursionLevel
Snyder Projection ~Fuller-Gray 1
Projection
ampoc i 100gtQG)aiCcEG)1lIo ~ 01isNrn=G)~~S~ III 011-------------------------------
B l 11 1~ 1~ 1~ 1~2Average Cell Area km (log0 scale)
grid based on the relative importance of evalua-tion criteria from the users perspective If cellcompactness is of prime importance for examplea triangular or hexagonal grid based on partition-ing a Gnomonic map projection of an icosahe-dron face (not discussed in this article) would bethe best alternative closely followed by direct
Vol 26 No4 285
Del
iver
ed b
y P
ublis
hing
Tec
hnol
ogy
to O
rego
n S
tate
Uni
vers
ity IP
128
193
164
203
on
Sat
12
Nov
201
1 22
50
45C
opyr
ight
(c)
Car
togr
aphy
and
Geo
grap
hic
Info
rmat
ion
Soc
iety
All
right
s re
serv
ed
Figure 19 Normalized subcell average compactness VS average cell area for fourglobal grids
Figure 20 Normalized subcell compactness standard deviation vs average cellarea for four global grids
(1)
Equal Angle Quadrilateral
2 3 4 5bull 0
2 3 4 5
1 2 3 Constant Area auadrilateral
2Equal Angle Quadrilateral
3 4 5
Zone area = 2x 1tX r2 (10 - sin $)
RecursionLevel
o0-0 ---_e_----lto---
RecursionLevel
APPENDIXZone Standardized Compactness
(ZSC)Derivation
6 5 4 310 10 10 10
Average Cell Area km2 (10910 scale)
------ --_---lt~ 2 3 4
o
where r is the radius of the sphere and ltP is thelatitude of the bounding parallel
The surface area of a spherical zone is computedfrom
will give a full picture of the strengths and weak-nesses of current global grid alternatives
o
Constant AreaQuadrilateral
_~~ iFuller-Gray 1 2 Projection 3 4 5
o
Fuller-GrayProjection 1
Snyder Projection 1gt-------------------
05
00011------7---- ----------4 -----r--~2
10 10 10 10 10 102Average Cell Area km (10910scale)
CIl()CI)5 01 =() r~2Emlt3 ~- C 01=Gl 0 =0CO
111iii iii 001 =Ebulloz
IIIIII
CII CIImS 09tll ()bullbull tllClIogt Elt0o
08
hierarchy among cells (criteria 2and 8) Both the quadrilateralgrids and triangular forms ofpolyhedral grids examined herecan be partitioned recursivelyallowing a nested hierarchy tobe created Equal-area cells isthe critical criterion since cur-rently employed equal-angleand constant-area quadrilateralgrids can never be equal areaand were shown to performpoorly in this respect relative toseveral alternative grids
Only two global grids thosebased on the triangular partition-ing of the Icosahedral SnyderEqual Area (ISFA)projection andpartitioning using the Small Cir-cle Subdivision method (not dis-cussed in this article but describedin Song 1997)will produce equal-area cells on the spheroid TheSmall Circle Subdivision methodhas the advantage of producingcells slightly more compact butthe ISFA grid is currently moreefficient to compute and easier toimplement Consequently werecommend the ISFA as the bestcurrent choice for an equal areaglobal grid Whichever global gridis selected there are implementa-tion issues that must be addressedin future research includingbull Implementing an efficient
addressing scheme for bin-ning data into grid cells
bull Creating algorithms for fasttranslation of gridded data to and from geo-detic latitude and longitude
bull Developing efficient algorithms for aggrega-tion and disaggregation among nested gridlevels and
bull Implementing efficient data storage andaccess schemes for data in nested cells includ-ing metadata storage and accessWe have begun to address several of these im-
plementation facets for the ISFA grid beginningwith an ETOP05 DEM dataset binning experimentconducted at several levels of recursion (seehttpbufogeoorstedufirmatdgg for binning ex-amples) Performing similar implementation experi-ments on additional datasets using other candidategrids would provide a complementary grid compari-son that together with our geometrical comparisons
286 Cartography and Geographic Information Science
Del
iver
ed b
y P
ublis
hing
Tec
hnol
ogy
to O
rego
n S
tate
Uni
vers
ity IP
128
193
164
203
on
Sat
12
Nov
201
1 22
50
45C
opyr
ight
(c)
Car
togr
aphy
and
Geo
grap
hic
Info
rmat
ion
Soc
iety
All
right
s re
serv
ed
REFERENCES
ACKNOWLEDGMENTS
so that
EidenshinkJC andJL Faundeen 1994 The 1 km AVHRRglobal land data set First stages of implementation Inierna-tionaljournal of Remote Sensing 153443-62
Fekete G and L Treinish 1990 Sphere quadtree A newdata structure to support the visualization of sphericallydistributed data SPIE Extracting rManing from complex dataProcessing display interaction Vol 1259 pp 242-53
Fuller RB 1982 SynergeticJ NewYork MacMillanGiacaglia GEO and CA Lundquist 1972 Sampling func-
tions for geophysics Smithsonian A5trvphysical Observatory Spe-cial Report No 344 93 pp
Goodchild MF 1994 Geographical grid models for environ-mental monitoring and analysis across the globe (panelsession) In proceddings of GISUS 94 Conference PhoenixArizona
Gray RW 1994 Exact transformation equations for Fullersworld map Cartography and Geographic Informatian Systems21(4) 243-46
Hastings DA 1996 The global land l-km base elevationdigital elevation model A progress report Global ChangeNewsletter 27 11-12
Heikes R and DA Randall 1995 Numerical integration ofthe shallow-water equations on a twisted icosahedral gridPart I Basic design and results of tests Monthly WeatherReview 123 1862-80
Kahn R 1995 What shall we do with the data we are expect-ing in 1998 In Proceedings of the Massive Data SelJ WorkshopCommittee on Applied and Theoretical Statistics NationalAcademy of Sciences Washington DC
Kimerling AJ 1984 Area computation from geodetic coordi-nates on the spheroid Surveying and Mapping 44(4) 343-51
Kimerling AJ D White K Sahr and L Song 1995 Devel-opment of global sampling grid Mid-project report Samplingdesign and statistics research for EMAP Program us Environ-mental Protection Agency Corvallis Oregon
Loveland TR JW Merchant D O Ohlen and JF Brown1991 Development of a land-cover characteristics databasefor the conterminous US Photogrammetric Engineering andRemote Sensing 57(11) 1453-63
Lukatela H 1987 Hipparchus geopositioning model Anoverview In Proceedings of Auto Carto 8 Symposium Balti-more Maryland pp 87-96
Maling DH 1992 Coordinate systems and map projectioru (2nded) Oxford UK Pergamon Press
Muehrcke PC and JO Muehrcke 1997 Map we (4th ed) Madi-sonWisconsinJP Publications
Olea RO 1984 Sanlpling design optimization for spatial functionsMathematical Geowgy 16369-92
Saff EB and ABJ Kuijlaars 1997 Distnbuting many points on asphere The Mathematical Intelligencer 19(1)5-11
Slade G 1994 Self avoiding walks The MaJhematical Intelligencer16(1)29-35
Snyder JP 1987 Map projectioru-A working manual Wash-ington DC US Government Printing Office
Snyder JP 1992 An equal-area map projection for polyhe-dral globes Cartographica 29(1) 10-21
Song L 1997 Small circle subdivision method for develop-ment of global sampling grid Unpublished Masters thesisOregon State University 176 pp
Stauffer D 1992 Introduction to percolation theory (2nd ed)London UK Taylor amp Francis
Tobler WR and Z Chen 1986 A quadtree for global infor-mation storage GeographicalAnalysis 18(4) 360-71
White D A J Kimerling and WS Overton 1992 Carto-graphic and geometric components of a global samplingdesign for environmental monitoring Cartography and Geo-graphic Information Systems 195-22
White D AJ Kin1erlingK Sahr and L Song 1998 Comparingarea and shape distortion on polyhedral-based recursive partitionsof the sphere International Journal of Geographiad Information Science12 805-27
Wolfram S 1986 Cellular automaton fluids 1 Basic theoryjournal of Statistical Physics 45471-526 bull
(5)Zone perimeter = 2XTCXr(co~)
ZSG = SQ1middott(4XTCxcellarea - cellarea2lr2) I cellperimeter (6)
Zone Standardized Compactness (ZSC) isgiven by Zone perimeterCell perimeter Substi-tuting and combining equations we compute ZSCfrom
Baumgardner JR and PO Frederickson 1985 Icosahedraldiscretization of the two-sphere SIAM journal of NUrMricalAnalysis 22(6) 1107-15
Bomford G 1971 Geodesy Oxford The Clarendon Press731 pp
Brooks DR 1981 Grid systems for Earth radiation budgetexperiment applications NASA Technical Memorandum8323340 pp
Coexeter HSM 1962 The problem of packing a number ofequal nonoverlapping circles on a sphere Transactions NewYork Academy of Science Division of Mathematics Series IIvol 24 320-31
Dutton G 1988 Geodesic modeling of planetary relief Car-tographica 21 188-207
Dutton G 1994 Geographical grid models for environmentalmonitoring and analysis across the globe (panel session) InProceedings of GISUS 94 Conference Phoenix Arizona
cos$ =sqrt( IO-(IO-cellareal(2xTCX r2)) (4)
The perimeter of the spherical zone is thecircumference of the bounding parallel computedfrom
Gelarea = 2XTCxr2(lO-sin$) (2)
This research was supported by US Environ-mental Protection Agency-Oregon State Univer-sity Cooperative Agreement CR 821672 MatthewGregory Department of Geosciences graduatestudent created the centerpoint distance mapsseen in Figure 16 Dr Ralph Kahn NASA-JPLalso contributed significantly to this manuscriptThis manuscript has been subjected to EPA reviewand approved for publication The conclusionsand opinions are solely those of the authors andnot necessarily the viewsof the Agency
and
Setting the zone surface area equal to the cellarea we obtain
Vol 26 NO4 287
Del
iver
ed b
y P
ublis
hing
Tec
hnol
ogy
to O
rego
n S
tate
Uni
vers
ity IP
128
193
164
203
on
Sat
12
Nov
201
1 22
50
45C
opyr
ight
(c)
Car
togr
aphy
and
Geo
grap
hic
Info
rmat
ion
Soc
iety
All
right
s re
serv
ed
Remote Sensing for theEarth Sciences (3rd ed)Andrew Rencz
Recently adopted titlesin cartography GISremote sensingandGPS
Policy Issues in Modern art graph)DR Frazer Taylor (cd)
Wilderness NavigationBob and Mike Bums
I bullbull
ACS
Maps with the NewsMark Monmonier
Air Apparent HowMeteorologists Learnedto Map Predict andDramatize WeatherMark Monmonier
froooks
Mapping a Northern LandThe Survey of CanadaGerald McGrath and LouisSebert (eds)
Thematic Cartographyand VisualizationTerry A Slocum
1 it 11 bull
on Oirle ~y a30149j- ~24)
288 Cartography and Geographic Information Science
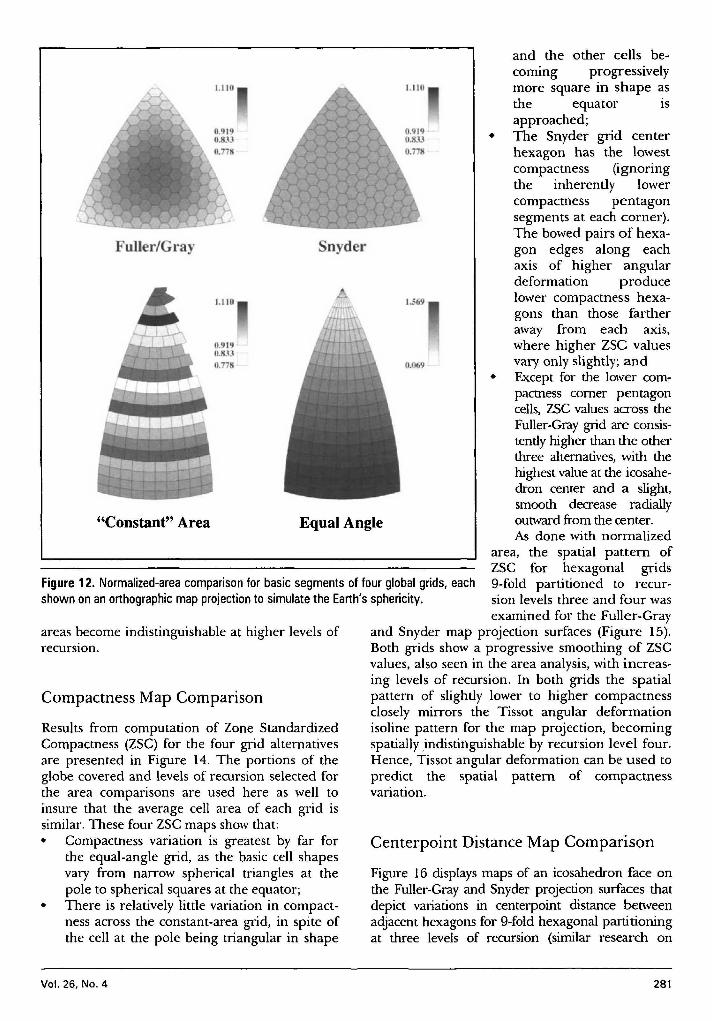
Del
iver
ed b
y P
ublis
hing
Tec
hnol
ogy
to O
rego
n S
tate
Uni
vers
ity IP
128
193
164
203
on
Sat
12
Nov
201
1 22
50
45C
opyr
ight
(c)
Car
togr
aphy
and
Geo
grap
hic
Info
rmat
ion
Soc
iety
All
right
s re
serv
ed
Figure 12 Normalized-area comparison for basic segments of four global grids eachshown on an orthographic map projection to simulate the Earths sphericity
1110
1569
0069
09190813077
Figure 16 displays maps of an icosahedron face onthe Fuller-Gray and Snyder projection surfaces thatdepict variations in centerpoint distance betweenadjacent hexagons for 9-fold hexagonal partitioningat three levels of recursion (similar research on
Centerpoint Distance Map Comparison
and the other cells be-coming progressivelymore square in shape asthe equator ISapproached
bull The Snyder grid centerhexagon has the lowestcompactness (ignoringthe inherently lowercompactness pentagonsegments at each corner)The bowed pairs of hexa-gon edges along eachaxis of higher angulardeformation producelower compactness hexa-gons than those fartheraway from each axiswhere higher ZSC valuesvary only slightly and
bull Except for the lower com-pactness comer pentagoncells ZSCvalues across theFuller-Graygrid are consis-tently higher than the otherthree alternativeswith thehighest value at the icosahe-dron center and a slightsmooth decrease radiallyoutward from the centerAs done with normalized
area the spatial pattern ofZSC for hexagonal grids9-fold partitioned to recur-sion levels three and four wasexamined for the Fuller-Gray
and Snyder map projection surfaces (Figure 15)Both grids show a progressive smoothing of ZSCvalues also seen in the area analysis with increas-ing levels of recursion In both grids the spatialpattern of slightly lower to higher compactnessclosely mirrors the Tissot angular deformationisoline pattern for the map projection becomingspatially indistinguishable by recursion level fourHence Tissot angular deformation can be used topredict the spatial pattern of compactnessvariation
nyder
Equal Angle
1110
09190IIJ3077
FullerGray
Constant Area
Compactness Map Comparison
areas become indistinguishable at higher levels ofrecursIOn
Results from computation of Zone StandardizedCompactness (ZSC) for the four grid alternativesare presented in Figure 14 The portions of theglobe covered and levels of recursion selected forthe area comparisons are used here as well toinsure that the average cell area of each grid issimilar These four ZSCmaps show thatbull Compactness variation is greatest by far for
the equal-angle grid as the basic cell shapesvary from narrow spherical triangles at thepole to spherical squares at the equator
bull There is relatively little variation in compact-ness across the constant-area grid in spite ofthe cell at the pole being triangular in shape
Vol 26 No4 281
Del
iver
ed b
y P
ublis
hing
Tec
hnol
ogy
to O
rego
n S
tate
Uni
vers
ity IP
128
193
164
203
on
Sat
12
Nov
201
1 22
50
45C
opyr
ight
(c)
Car
togr
aphy
and
Geo
grap
hic
Info
rmat
ion
Soc
iety
All
right
s re
serv
ed
Figure 13 Normalized-areacomparison for two recursionlevels of the Fuller-Gray andISEA grids each shown on anorthographic map projection tosimulate the Earthssphericity
9-Fold Recursion Level 31060
fl
nil r ra n der
ld e ur ion Le el 4
FullerGray
1060
O9n J
U71~
Snyder
quadrilateral centerpoint distance for the equal-angle and constant-area grids is underway) Thisexample of our centerpoint distance analysis showshow variations in great-circle distance between adja-cent pairs of hexagon centers can be mapped
The six equilateral triangles fonning each hexa-gon can be thought of as map symbols shaded ac-cording to the distance between the hexagon centerand the centerpoint of adjacent hexagons to thenorth (0deg) northeast (60deg) southeast (120deg) south(180deg) southwest (240deg) and northwest (300deg) as-suming north to be at the top of the page
At the lowest level of recursion (top-rightmap) the general pattern of larger (darker gray)and smaller (lighter gray) distances relative to theaverage (medium gray) centerpoint to centerpointdistance are aligned with the three axes of higherangular deformation for the Snyder projection aswe would expect The shortest distances are alongeach axis and the longest distances are adjacentand roughly perpendicular to each axis Thisspatial pattern of centerpoint distance variation
282
persists and becomes better defined at the nexttwo higher levels of recursion At the highest levelexamined here (bottom-right map) the largerand smaller distances clearly are localized alongeach axis grading toward average values in apropeller-like pattern that corresponds with theTissot angular deformation isolines Indeed theTissot diagram in Figure 7 is an excellent predic-tor of where variations in centerpoint distanceshould occur on the Snyder grid
The spatial pattern of centerpoint distance varia-tion for the hexagonally partitioned Fuller-Grayprojection surfaceis not easilydiscerned at the lowestlevel of recursion (upper-left map) but becomesreadily visible at the next two higher levelsAs withthe Snyder projection Tissot angular deformationisolines predict the spatial pattern of little variationin the center of the icosahedron face with progres-sivelylarger centerpoint distance variations (often inlonger-shorter distance adjacent pairs) as each edgeis approached Overall there appears to be slightlyless centerpoint distancevariation on the Fuller-Gray
Cartography and Geographic Information Science
Del
iver
ed b
y P
ublis
hing
Tec
hnol
ogy
to O
rego
n S
tate
Uni
vers
ity IP
128
193
164
203
on
Sat
12
Nov
201
1 22
50
45C
opyr
ight
(c)
Car
togr
aphy
and
Geo
grap
hic
Info
rmat
ion
Soc
iety
All
right
s re
serv
ed
Figure 14 Compactness comparison for basic segments offour global grids each shown on an orthographic map projec-tion to simulate the Earths sphericity
the icosahedron face always creates 12 penta-gons on the globe exactly 56th the area of eachhexagon the surface area standard deviation forthe Snyder grid will always be slightly greaterthan zero even though there is no area variationamong the hexagons formed However at pro-gressively higher levels of recursion the 12pentagons occupy increasingly less of the totalsurface area and the standard deviation for theentire globe rapidly approaches zero Hencethis graph shows the Snyder grid to be clearlysuperior for hexagonal subcells less than100000 km2 in area
Variation in centerpoint spacing between adja-cent cells for the four grid alternatives can be ana-lyzed by graphing logarithmically the standarddeviation in normalized centerpoint spacingagainst average cell area at increasing levels ofrecursion (Figure 18) This graph shows the gridsto perform similarly except for the poorly per-forming EqualAngleQuadrilateral grid The Fullerand Constant Area Quadrilateral grids converge athigher recursion levels to essentially identical lowstandard deviations closely followed by the Snydergrid
Average subcell compactness values for thefour grids (Figure 19) shows the superior perform-ance of icosahedral models over quadrilateralwhich is to be expected since hexagonal shapes are
bullbull~
nyder
Equal Angle
FuUerGra
Constant Area
9middotFold Recur ion Level 4
FuJlerGra ~ n der
0951
U95
09-10U9IJOll(S
9-FoldRecursion Level 3
FullerGray Snyder
Because variation in cell surface area is amajor concern for geostatisticians andothers we analyzed the variation innormalized cell area with increasinglevels of recursion Figure 17 is a loga-rithmic graph of the standard deviationin normalized-cell area versus the de-creasing average-cell area at increasinglevels of recursion for the four discreteglobal grid alternatives (but only thehexagonal grids formed by Snyder andFuller-Gray projection subtriangles)examined graphically above Recogniz-ing that the hexagonal partitioning of
Figure 15 Compactness comparison for tworecursion levels of the Fuller-Gray and ISEAgrids each shown on an orthographic mapprojection to simulate the Earths sphericity
hexagonal grid but this can only be shownconclusivelyby a statistical comparison ofalternativegrids
Statistical Comparison Results
Vol 26 NO4 283
Del
iver
ed b
y P
ublis
hing
Tec
hnol
ogy
to O
rego
n S
tate
Uni
vers
ity IP
128
193
164
203
on
Sat
12
Nov
201
1 22
50
45C
opyr
ight
(c)
Car
togr
aphy
and
Geo
grap
hic
Info
rmat
ion
Soc
iety
All
right
s re
serv
ed
140km
190km
560 km
1300 kIT
1650 kIT
425 m
SnyderProjection
RecursionLevel 7
RecursionLevel 3
RecursionLevel 5
Fuller-GrayProjection
Figure 16 Variations in hexagonal centerpoint spacing at three levels of recursionfor the Fuller and ISEA Grids on an icosahedron face
In addition to the detailed nu-merical analysis of grid-cellarea compactness and center-point spacing at different levelsof recursion we carried out anoverall comparison of numerous
Summary Rankings
inherently more compact thanrectangular shapes At all levels ofrecursion the Fuller grid is com-prised of hexagons slightly morecompact than correspondingSnyder grid hexagons both beingfar more compact than the corre-sponding constant area and equalangle grid quadrilaterals
Variation in subcell compact-ness seen by graphing the stan-dard deviation of cell compactnessvalues against average cell area(Figure 20) shows the slightlybetter performance of the Fullergrid over the Snyder grid athigher levels of recursion Theconstant-area grid has the lowestoverall standard deviation at itsinitial resolution (level 0) but itsstandard deviation increases rap-idly as the initial cells are parti-tioned in an equal-angle mannerHowever the poor performanceassociated with the equal-anglegrid at all levels of recursion isnever approached
l2 Equal Angle Quadrilateral1 05 Bgt 0- 3GlC RecursionC 01 Level Constant Area QuadrilateralbullIII 1 0 8
3C ~1 2l bull 83 4 5III
1 2 Fuller-Gray ProjectionenIII 01Glbullc(
4i0C 001
~ia 5Ebull0Z 0001
107
106
105 4 3 2
10 10 102Average Cell Area km (log10 scale)
discrete global grid alternatives in-cluding the seven presented in Table1 Eleven of the fourteen Goodchildcriteria were investigated along withtwo related criteria deemed signifi-cant for global grid comparison ForGoodchild criteria 2 4 and 5 a sum-mary ordinal ranking from 1 (verypoor) to 10 (best possible) was devel-oped based on the quantitative analy-sis of comparison metrics
Table 1 provides informationcrucial to the selection of a global
Figure 17 Normalized subcell area standarddeviation vs average cell area for four globalgrids
284 Cartography and Geographic Information Science
Del
iver
ed b
y P
ublis
hing
Tec
hnol
ogy
to O
rego
n S
tate
Uni
vers
ity IP
128
193
164
203
on
Sat
12
Nov
201
1 22
50
45C
opyr
ight
(c)
Car
togr
aphy
and
Geo
grap
hic
Info
rmat
ion
Soc
iety
All
right
s re
serv
ed
Criterion Equal Angle Constant Area Snyder Fuller-Gray Small Circle Dir Sphere Gnomonic
1 Domain is globe yes yes yes yes yes yes yes
2 Equal areal 1 7 10 8 10 6 3
3 Same topology yes no yes yes yes yes yes
4 Equal shape 1 3 7 8 7 9 9
5 Compactnessmiddot 1 4 7 8 8 8 9
6 Straight edges onprojection na2 na yes yes na na yes
7 Perimeter bisection J ni ni ni ni ni nin1
8 Hierarchy yes yes yes4 yes4 yes4 yes4 yes4
9 Single point yes yes yes yes yes yes yes
10 Maximally centered ni ni ni ni ni ni ni
11 Equidistant no no no no no no no
12 Addressing ni ni ni ni oi ni ni13 LatitudelLongitude yes yes yes yes yes yes yes
14 Arbitrary resolution yes yes yes yes yes yes yes
Geodesic edge lines no no no no no yes yes
Spatial nature of area Continuously Part continu- Constant Continuously Constant Fractal-like Continuouslyvariation varying ous part varying varying
irregular
IBest possible = 10 very good = 9 -7 very poor = 1
2 na = not applicable
J ni = not investigated
4 Only the triangular cells not the hexagonal are hierarchical in these grids
Table 1 Evaluation of Goodchilds and related comparison criteria for different global grids
Figure 18 Normalized centerpoint distance standard deviation vs average cellarea for four global grids
ConclusionsThe global grid evaluation crite-ria and associated metrics haveallowed us to compare gridsvarying widely in cell geometryand topology We have observedthat the prime areas of concernamong the small portion of theglobal data user community wehave interacted with to date areequal-area cells and a nested
spherical subdivision the small circle subdivisionmethod and the Fuller-Gray map projection forthe icosahedron If good overall performance is ofparamount concern the triangular andor hex-agonal partitioning of the Fuller-Gray projectionsurface might be selected due to the low variationin compactness of highly compact cells that vary
slightly in area in a continuouslyvarying predictable manner
2 3 4 6
JL------ ~2 1 2 3Constant Area Quadrilateral
Equal Angle Quadrilateral2 38 8
o~RecursionLevel
Snyder Projection ~Fuller-Gray 1
Projection
ampoc i 100gtQG)aiCcEG)1lIo ~ 01isNrn=G)~~S~ III 011-------------------------------
B l 11 1~ 1~ 1~ 1~2Average Cell Area km (log0 scale)
grid based on the relative importance of evalua-tion criteria from the users perspective If cellcompactness is of prime importance for examplea triangular or hexagonal grid based on partition-ing a Gnomonic map projection of an icosahe-dron face (not discussed in this article) would bethe best alternative closely followed by direct
Vol 26 No4 285
Del
iver
ed b
y P
ublis
hing
Tec
hnol
ogy
to O
rego
n S
tate
Uni
vers
ity IP
128
193
164
203
on
Sat
12
Nov
201
1 22
50
45C
opyr
ight
(c)
Car
togr
aphy
and
Geo
grap
hic
Info
rmat
ion
Soc
iety
All
right
s re
serv
ed
Figure 19 Normalized subcell average compactness VS average cell area for fourglobal grids
Figure 20 Normalized subcell compactness standard deviation vs average cellarea for four global grids
(1)
Equal Angle Quadrilateral
2 3 4 5bull 0
2 3 4 5
1 2 3 Constant Area auadrilateral
2Equal Angle Quadrilateral
3 4 5
Zone area = 2x 1tX r2 (10 - sin $)
RecursionLevel
o0-0 ---_e_----lto---
RecursionLevel
APPENDIXZone Standardized Compactness
(ZSC)Derivation
6 5 4 310 10 10 10
Average Cell Area km2 (10910 scale)
------ --_---lt~ 2 3 4
o
where r is the radius of the sphere and ltP is thelatitude of the bounding parallel
The surface area of a spherical zone is computedfrom
will give a full picture of the strengths and weak-nesses of current global grid alternatives
o
Constant AreaQuadrilateral
_~~ iFuller-Gray 1 2 Projection 3 4 5
o
Fuller-GrayProjection 1
Snyder Projection 1gt-------------------
05
00011------7---- ----------4 -----r--~2
10 10 10 10 10 102Average Cell Area km (10910scale)
CIl()CI)5 01 =() r~2Emlt3 ~- C 01=Gl 0 =0CO
111iii iii 001 =Ebulloz
IIIIII
CII CIImS 09tll ()bullbull tllClIogt Elt0o
08
hierarchy among cells (criteria 2and 8) Both the quadrilateralgrids and triangular forms ofpolyhedral grids examined herecan be partitioned recursivelyallowing a nested hierarchy tobe created Equal-area cells isthe critical criterion since cur-rently employed equal-angleand constant-area quadrilateralgrids can never be equal areaand were shown to performpoorly in this respect relative toseveral alternative grids
Only two global grids thosebased on the triangular partition-ing of the Icosahedral SnyderEqual Area (ISFA)projection andpartitioning using the Small Cir-cle Subdivision method (not dis-cussed in this article but describedin Song 1997)will produce equal-area cells on the spheroid TheSmall Circle Subdivision methodhas the advantage of producingcells slightly more compact butthe ISFA grid is currently moreefficient to compute and easier toimplement Consequently werecommend the ISFA as the bestcurrent choice for an equal areaglobal grid Whichever global gridis selected there are implementa-tion issues that must be addressedin future research includingbull Implementing an efficient
addressing scheme for bin-ning data into grid cells
bull Creating algorithms for fasttranslation of gridded data to and from geo-detic latitude and longitude
bull Developing efficient algorithms for aggrega-tion and disaggregation among nested gridlevels and
bull Implementing efficient data storage andaccess schemes for data in nested cells includ-ing metadata storage and accessWe have begun to address several of these im-
plementation facets for the ISFA grid beginningwith an ETOP05 DEM dataset binning experimentconducted at several levels of recursion (seehttpbufogeoorstedufirmatdgg for binning ex-amples) Performing similar implementation experi-ments on additional datasets using other candidategrids would provide a complementary grid compari-son that together with our geometrical comparisons
286 Cartography and Geographic Information Science
Del
iver
ed b
y P
ublis
hing
Tec
hnol
ogy
to O
rego
n S
tate
Uni
vers
ity IP
128
193
164
203
on
Sat
12
Nov
201
1 22
50
45C
opyr
ight
(c)
Car
togr
aphy
and
Geo
grap
hic
Info
rmat
ion
Soc
iety
All
right
s re
serv
ed
REFERENCES
ACKNOWLEDGMENTS
so that
EidenshinkJC andJL Faundeen 1994 The 1 km AVHRRglobal land data set First stages of implementation Inierna-tionaljournal of Remote Sensing 153443-62
Fekete G and L Treinish 1990 Sphere quadtree A newdata structure to support the visualization of sphericallydistributed data SPIE Extracting rManing from complex dataProcessing display interaction Vol 1259 pp 242-53
Fuller RB 1982 SynergeticJ NewYork MacMillanGiacaglia GEO and CA Lundquist 1972 Sampling func-
tions for geophysics Smithsonian A5trvphysical Observatory Spe-cial Report No 344 93 pp
Goodchild MF 1994 Geographical grid models for environ-mental monitoring and analysis across the globe (panelsession) In proceddings of GISUS 94 Conference PhoenixArizona
Gray RW 1994 Exact transformation equations for Fullersworld map Cartography and Geographic Informatian Systems21(4) 243-46
Hastings DA 1996 The global land l-km base elevationdigital elevation model A progress report Global ChangeNewsletter 27 11-12
Heikes R and DA Randall 1995 Numerical integration ofthe shallow-water equations on a twisted icosahedral gridPart I Basic design and results of tests Monthly WeatherReview 123 1862-80
Kahn R 1995 What shall we do with the data we are expect-ing in 1998 In Proceedings of the Massive Data SelJ WorkshopCommittee on Applied and Theoretical Statistics NationalAcademy of Sciences Washington DC
Kimerling AJ 1984 Area computation from geodetic coordi-nates on the spheroid Surveying and Mapping 44(4) 343-51
Kimerling AJ D White K Sahr and L Song 1995 Devel-opment of global sampling grid Mid-project report Samplingdesign and statistics research for EMAP Program us Environ-mental Protection Agency Corvallis Oregon
Loveland TR JW Merchant D O Ohlen and JF Brown1991 Development of a land-cover characteristics databasefor the conterminous US Photogrammetric Engineering andRemote Sensing 57(11) 1453-63
Lukatela H 1987 Hipparchus geopositioning model Anoverview In Proceedings of Auto Carto 8 Symposium Balti-more Maryland pp 87-96
Maling DH 1992 Coordinate systems and map projectioru (2nded) Oxford UK Pergamon Press
Muehrcke PC and JO Muehrcke 1997 Map we (4th ed) Madi-sonWisconsinJP Publications
Olea RO 1984 Sanlpling design optimization for spatial functionsMathematical Geowgy 16369-92
Saff EB and ABJ Kuijlaars 1997 Distnbuting many points on asphere The Mathematical Intelligencer 19(1)5-11
Slade G 1994 Self avoiding walks The MaJhematical Intelligencer16(1)29-35
Snyder JP 1987 Map projectioru-A working manual Wash-ington DC US Government Printing Office
Snyder JP 1992 An equal-area map projection for polyhe-dral globes Cartographica 29(1) 10-21
Song L 1997 Small circle subdivision method for develop-ment of global sampling grid Unpublished Masters thesisOregon State University 176 pp
Stauffer D 1992 Introduction to percolation theory (2nd ed)London UK Taylor amp Francis
Tobler WR and Z Chen 1986 A quadtree for global infor-mation storage GeographicalAnalysis 18(4) 360-71
White D A J Kimerling and WS Overton 1992 Carto-graphic and geometric components of a global samplingdesign for environmental monitoring Cartography and Geo-graphic Information Systems 195-22
White D AJ Kin1erlingK Sahr and L Song 1998 Comparingarea and shape distortion on polyhedral-based recursive partitionsof the sphere International Journal of Geographiad Information Science12 805-27
Wolfram S 1986 Cellular automaton fluids 1 Basic theoryjournal of Statistical Physics 45471-526 bull
(5)Zone perimeter = 2XTCXr(co~)
ZSG = SQ1middott(4XTCxcellarea - cellarea2lr2) I cellperimeter (6)
Zone Standardized Compactness (ZSC) isgiven by Zone perimeterCell perimeter Substi-tuting and combining equations we compute ZSCfrom
Baumgardner JR and PO Frederickson 1985 Icosahedraldiscretization of the two-sphere SIAM journal of NUrMricalAnalysis 22(6) 1107-15
Bomford G 1971 Geodesy Oxford The Clarendon Press731 pp
Brooks DR 1981 Grid systems for Earth radiation budgetexperiment applications NASA Technical Memorandum8323340 pp
Coexeter HSM 1962 The problem of packing a number ofequal nonoverlapping circles on a sphere Transactions NewYork Academy of Science Division of Mathematics Series IIvol 24 320-31
Dutton G 1988 Geodesic modeling of planetary relief Car-tographica 21 188-207
Dutton G 1994 Geographical grid models for environmentalmonitoring and analysis across the globe (panel session) InProceedings of GISUS 94 Conference Phoenix Arizona
cos$ =sqrt( IO-(IO-cellareal(2xTCX r2)) (4)
The perimeter of the spherical zone is thecircumference of the bounding parallel computedfrom
Gelarea = 2XTCxr2(lO-sin$) (2)
This research was supported by US Environ-mental Protection Agency-Oregon State Univer-sity Cooperative Agreement CR 821672 MatthewGregory Department of Geosciences graduatestudent created the centerpoint distance mapsseen in Figure 16 Dr Ralph Kahn NASA-JPLalso contributed significantly to this manuscriptThis manuscript has been subjected to EPA reviewand approved for publication The conclusionsand opinions are solely those of the authors andnot necessarily the viewsof the Agency
and
Setting the zone surface area equal to the cellarea we obtain
Vol 26 NO4 287
Del
iver
ed b
y P
ublis
hing
Tec
hnol
ogy
to O
rego
n S
tate
Uni
vers
ity IP
128
193
164
203
on
Sat
12
Nov
201
1 22
50
45C
opyr
ight
(c)
Car
togr
aphy
and
Geo
grap
hic
Info
rmat
ion
Soc
iety
All
right
s re
serv
ed
Remote Sensing for theEarth Sciences (3rd ed)Andrew Rencz
Recently adopted titlesin cartography GISremote sensingandGPS
Policy Issues in Modern art graph)DR Frazer Taylor (cd)
Wilderness NavigationBob and Mike Bums
I bullbull
ACS
Maps with the NewsMark Monmonier
Air Apparent HowMeteorologists Learnedto Map Predict andDramatize WeatherMark Monmonier
froooks
Mapping a Northern LandThe Survey of CanadaGerald McGrath and LouisSebert (eds)
Thematic Cartographyand VisualizationTerry A Slocum
1 it 11 bull
on Oirle ~y a30149j- ~24)
288 Cartography and Geographic Information Science
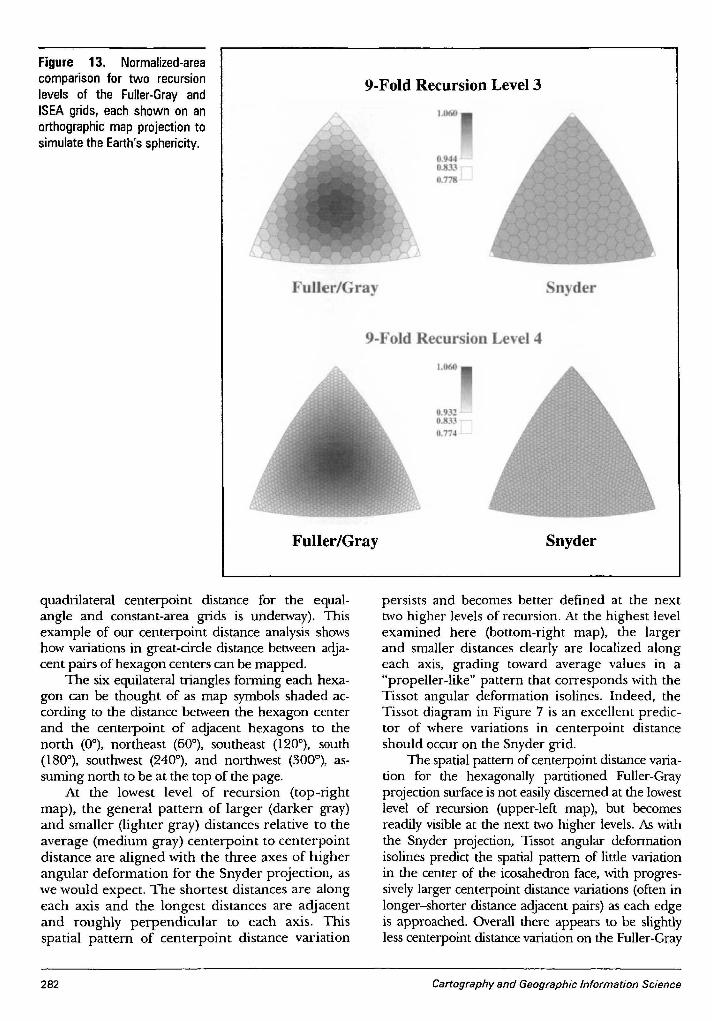
Del
iver
ed b
y P
ublis
hing
Tec
hnol
ogy
to O
rego
n S
tate
Uni
vers
ity IP
128
193
164
203
on
Sat
12
Nov
201
1 22
50
45C
opyr
ight
(c)
Car
togr
aphy
and
Geo
grap
hic
Info
rmat
ion
Soc
iety
All
right
s re
serv
ed
Figure 13 Normalized-areacomparison for two recursionlevels of the Fuller-Gray andISEA grids each shown on anorthographic map projection tosimulate the Earthssphericity
9-Fold Recursion Level 31060
fl
nil r ra n der
ld e ur ion Le el 4
FullerGray
1060
O9n J
U71~
Snyder
quadrilateral centerpoint distance for the equal-angle and constant-area grids is underway) Thisexample of our centerpoint distance analysis showshow variations in great-circle distance between adja-cent pairs of hexagon centers can be mapped
The six equilateral triangles fonning each hexa-gon can be thought of as map symbols shaded ac-cording to the distance between the hexagon centerand the centerpoint of adjacent hexagons to thenorth (0deg) northeast (60deg) southeast (120deg) south(180deg) southwest (240deg) and northwest (300deg) as-suming north to be at the top of the page
At the lowest level of recursion (top-rightmap) the general pattern of larger (darker gray)and smaller (lighter gray) distances relative to theaverage (medium gray) centerpoint to centerpointdistance are aligned with the three axes of higherangular deformation for the Snyder projection aswe would expect The shortest distances are alongeach axis and the longest distances are adjacentand roughly perpendicular to each axis Thisspatial pattern of centerpoint distance variation
282
persists and becomes better defined at the nexttwo higher levels of recursion At the highest levelexamined here (bottom-right map) the largerand smaller distances clearly are localized alongeach axis grading toward average values in apropeller-like pattern that corresponds with theTissot angular deformation isolines Indeed theTissot diagram in Figure 7 is an excellent predic-tor of where variations in centerpoint distanceshould occur on the Snyder grid
The spatial pattern of centerpoint distance varia-tion for the hexagonally partitioned Fuller-Grayprojection surfaceis not easilydiscerned at the lowestlevel of recursion (upper-left map) but becomesreadily visible at the next two higher levelsAs withthe Snyder projection Tissot angular deformationisolines predict the spatial pattern of little variationin the center of the icosahedron face with progres-sivelylarger centerpoint distance variations (often inlonger-shorter distance adjacent pairs) as each edgeis approached Overall there appears to be slightlyless centerpoint distancevariation on the Fuller-Gray
Cartography and Geographic Information Science
Del
iver
ed b
y P
ublis
hing
Tec
hnol
ogy
to O
rego
n S
tate
Uni
vers
ity IP
128
193
164
203
on
Sat
12
Nov
201
1 22
50
45C
opyr
ight
(c)
Car
togr
aphy
and
Geo
grap
hic
Info
rmat
ion
Soc
iety
All
right
s re
serv
ed
Figure 14 Compactness comparison for basic segments offour global grids each shown on an orthographic map projec-tion to simulate the Earths sphericity
the icosahedron face always creates 12 penta-gons on the globe exactly 56th the area of eachhexagon the surface area standard deviation forthe Snyder grid will always be slightly greaterthan zero even though there is no area variationamong the hexagons formed However at pro-gressively higher levels of recursion the 12pentagons occupy increasingly less of the totalsurface area and the standard deviation for theentire globe rapidly approaches zero Hencethis graph shows the Snyder grid to be clearlysuperior for hexagonal subcells less than100000 km2 in area
Variation in centerpoint spacing between adja-cent cells for the four grid alternatives can be ana-lyzed by graphing logarithmically the standarddeviation in normalized centerpoint spacingagainst average cell area at increasing levels ofrecursion (Figure 18) This graph shows the gridsto perform similarly except for the poorly per-forming EqualAngleQuadrilateral grid The Fullerand Constant Area Quadrilateral grids converge athigher recursion levels to essentially identical lowstandard deviations closely followed by the Snydergrid
Average subcell compactness values for thefour grids (Figure 19) shows the superior perform-ance of icosahedral models over quadrilateralwhich is to be expected since hexagonal shapes are
bullbull~
nyder
Equal Angle
FuUerGra
Constant Area
9middotFold Recur ion Level 4
FuJlerGra ~ n der
0951
U95
09-10U9IJOll(S
9-FoldRecursion Level 3
FullerGray Snyder
Because variation in cell surface area is amajor concern for geostatisticians andothers we analyzed the variation innormalized cell area with increasinglevels of recursion Figure 17 is a loga-rithmic graph of the standard deviationin normalized-cell area versus the de-creasing average-cell area at increasinglevels of recursion for the four discreteglobal grid alternatives (but only thehexagonal grids formed by Snyder andFuller-Gray projection subtriangles)examined graphically above Recogniz-ing that the hexagonal partitioning of
Figure 15 Compactness comparison for tworecursion levels of the Fuller-Gray and ISEAgrids each shown on an orthographic mapprojection to simulate the Earths sphericity
hexagonal grid but this can only be shownconclusivelyby a statistical comparison ofalternativegrids
Statistical Comparison Results
Vol 26 NO4 283
Del
iver
ed b
y P
ublis
hing
Tec
hnol
ogy
to O
rego
n S
tate
Uni
vers
ity IP
128
193
164
203
on
Sat
12
Nov
201
1 22
50
45C
opyr
ight
(c)
Car
togr
aphy
and
Geo
grap
hic
Info
rmat
ion
Soc
iety
All
right
s re
serv
ed
140km
190km
560 km
1300 kIT
1650 kIT
425 m
SnyderProjection
RecursionLevel 7
RecursionLevel 3
RecursionLevel 5
Fuller-GrayProjection
Figure 16 Variations in hexagonal centerpoint spacing at three levels of recursionfor the Fuller and ISEA Grids on an icosahedron face
In addition to the detailed nu-merical analysis of grid-cellarea compactness and center-point spacing at different levelsof recursion we carried out anoverall comparison of numerous
Summary Rankings
inherently more compact thanrectangular shapes At all levels ofrecursion the Fuller grid is com-prised of hexagons slightly morecompact than correspondingSnyder grid hexagons both beingfar more compact than the corre-sponding constant area and equalangle grid quadrilaterals
Variation in subcell compact-ness seen by graphing the stan-dard deviation of cell compactnessvalues against average cell area(Figure 20) shows the slightlybetter performance of the Fullergrid over the Snyder grid athigher levels of recursion Theconstant-area grid has the lowestoverall standard deviation at itsinitial resolution (level 0) but itsstandard deviation increases rap-idly as the initial cells are parti-tioned in an equal-angle mannerHowever the poor performanceassociated with the equal-anglegrid at all levels of recursion isnever approached
l2 Equal Angle Quadrilateral1 05 Bgt 0- 3GlC RecursionC 01 Level Constant Area QuadrilateralbullIII 1 0 8
3C ~1 2l bull 83 4 5III
1 2 Fuller-Gray ProjectionenIII 01Glbullc(
4i0C 001
~ia 5Ebull0Z 0001
107
106
105 4 3 2
10 10 102Average Cell Area km (log10 scale)
discrete global grid alternatives in-cluding the seven presented in Table1 Eleven of the fourteen Goodchildcriteria were investigated along withtwo related criteria deemed signifi-cant for global grid comparison ForGoodchild criteria 2 4 and 5 a sum-mary ordinal ranking from 1 (verypoor) to 10 (best possible) was devel-oped based on the quantitative analy-sis of comparison metrics
Table 1 provides informationcrucial to the selection of a global
Figure 17 Normalized subcell area standarddeviation vs average cell area for four globalgrids
284 Cartography and Geographic Information Science
Del
iver
ed b
y P
ublis
hing
Tec
hnol
ogy
to O
rego
n S
tate
Uni
vers
ity IP
128
193
164
203
on
Sat
12
Nov
201
1 22
50
45C
opyr
ight
(c)
Car
togr
aphy
and
Geo
grap
hic
Info
rmat
ion
Soc
iety
All
right
s re
serv
ed
Criterion Equal Angle Constant Area Snyder Fuller-Gray Small Circle Dir Sphere Gnomonic
1 Domain is globe yes yes yes yes yes yes yes
2 Equal areal 1 7 10 8 10 6 3
3 Same topology yes no yes yes yes yes yes
4 Equal shape 1 3 7 8 7 9 9
5 Compactnessmiddot 1 4 7 8 8 8 9
6 Straight edges onprojection na2 na yes yes na na yes
7 Perimeter bisection J ni ni ni ni ni nin1
8 Hierarchy yes yes yes4 yes4 yes4 yes4 yes4
9 Single point yes yes yes yes yes yes yes
10 Maximally centered ni ni ni ni ni ni ni
11 Equidistant no no no no no no no
12 Addressing ni ni ni ni oi ni ni13 LatitudelLongitude yes yes yes yes yes yes yes
14 Arbitrary resolution yes yes yes yes yes yes yes
Geodesic edge lines no no no no no yes yes
Spatial nature of area Continuously Part continu- Constant Continuously Constant Fractal-like Continuouslyvariation varying ous part varying varying
irregular
IBest possible = 10 very good = 9 -7 very poor = 1
2 na = not applicable
J ni = not investigated
4 Only the triangular cells not the hexagonal are hierarchical in these grids
Table 1 Evaluation of Goodchilds and related comparison criteria for different global grids
Figure 18 Normalized centerpoint distance standard deviation vs average cellarea for four global grids
ConclusionsThe global grid evaluation crite-ria and associated metrics haveallowed us to compare gridsvarying widely in cell geometryand topology We have observedthat the prime areas of concernamong the small portion of theglobal data user community wehave interacted with to date areequal-area cells and a nested
spherical subdivision the small circle subdivisionmethod and the Fuller-Gray map projection forthe icosahedron If good overall performance is ofparamount concern the triangular andor hex-agonal partitioning of the Fuller-Gray projectionsurface might be selected due to the low variationin compactness of highly compact cells that vary
slightly in area in a continuouslyvarying predictable manner
2 3 4 6
JL------ ~2 1 2 3Constant Area Quadrilateral
Equal Angle Quadrilateral2 38 8
o~RecursionLevel
Snyder Projection ~Fuller-Gray 1
Projection
ampoc i 100gtQG)aiCcEG)1lIo ~ 01isNrn=G)~~S~ III 011-------------------------------
B l 11 1~ 1~ 1~ 1~2Average Cell Area km (log0 scale)
grid based on the relative importance of evalua-tion criteria from the users perspective If cellcompactness is of prime importance for examplea triangular or hexagonal grid based on partition-ing a Gnomonic map projection of an icosahe-dron face (not discussed in this article) would bethe best alternative closely followed by direct
Vol 26 No4 285
Del
iver
ed b
y P
ublis
hing
Tec
hnol
ogy
to O
rego
n S
tate
Uni
vers
ity IP
128
193
164
203
on
Sat
12
Nov
201
1 22
50
45C
opyr
ight
(c)
Car
togr
aphy
and
Geo
grap
hic
Info
rmat
ion
Soc
iety
All
right
s re
serv
ed
Figure 19 Normalized subcell average compactness VS average cell area for fourglobal grids
Figure 20 Normalized subcell compactness standard deviation vs average cellarea for four global grids
(1)
Equal Angle Quadrilateral
2 3 4 5bull 0
2 3 4 5
1 2 3 Constant Area auadrilateral
2Equal Angle Quadrilateral
3 4 5
Zone area = 2x 1tX r2 (10 - sin $)
RecursionLevel
o0-0 ---_e_----lto---
RecursionLevel
APPENDIXZone Standardized Compactness
(ZSC)Derivation
6 5 4 310 10 10 10
Average Cell Area km2 (10910 scale)
------ --_---lt~ 2 3 4
o
where r is the radius of the sphere and ltP is thelatitude of the bounding parallel
The surface area of a spherical zone is computedfrom
will give a full picture of the strengths and weak-nesses of current global grid alternatives
o
Constant AreaQuadrilateral
_~~ iFuller-Gray 1 2 Projection 3 4 5
o
Fuller-GrayProjection 1
Snyder Projection 1gt-------------------
05
00011------7---- ----------4 -----r--~2
10 10 10 10 10 102Average Cell Area km (10910scale)
CIl()CI)5 01 =() r~2Emlt3 ~- C 01=Gl 0 =0CO
111iii iii 001 =Ebulloz
IIIIII
CII CIImS 09tll ()bullbull tllClIogt Elt0o
08
hierarchy among cells (criteria 2and 8) Both the quadrilateralgrids and triangular forms ofpolyhedral grids examined herecan be partitioned recursivelyallowing a nested hierarchy tobe created Equal-area cells isthe critical criterion since cur-rently employed equal-angleand constant-area quadrilateralgrids can never be equal areaand were shown to performpoorly in this respect relative toseveral alternative grids
Only two global grids thosebased on the triangular partition-ing of the Icosahedral SnyderEqual Area (ISFA)projection andpartitioning using the Small Cir-cle Subdivision method (not dis-cussed in this article but describedin Song 1997)will produce equal-area cells on the spheroid TheSmall Circle Subdivision methodhas the advantage of producingcells slightly more compact butthe ISFA grid is currently moreefficient to compute and easier toimplement Consequently werecommend the ISFA as the bestcurrent choice for an equal areaglobal grid Whichever global gridis selected there are implementa-tion issues that must be addressedin future research includingbull Implementing an efficient
addressing scheme for bin-ning data into grid cells
bull Creating algorithms for fasttranslation of gridded data to and from geo-detic latitude and longitude
bull Developing efficient algorithms for aggrega-tion and disaggregation among nested gridlevels and
bull Implementing efficient data storage andaccess schemes for data in nested cells includ-ing metadata storage and accessWe have begun to address several of these im-
plementation facets for the ISFA grid beginningwith an ETOP05 DEM dataset binning experimentconducted at several levels of recursion (seehttpbufogeoorstedufirmatdgg for binning ex-amples) Performing similar implementation experi-ments on additional datasets using other candidategrids would provide a complementary grid compari-son that together with our geometrical comparisons
286 Cartography and Geographic Information Science
Del
iver
ed b
y P
ublis
hing
Tec
hnol
ogy
to O
rego
n S
tate
Uni
vers
ity IP
128
193
164
203
on
Sat
12
Nov
201
1 22
50
45C
opyr
ight
(c)
Car
togr
aphy
and
Geo
grap
hic
Info
rmat
ion
Soc
iety
All
right
s re
serv
ed
REFERENCES
ACKNOWLEDGMENTS
so that
EidenshinkJC andJL Faundeen 1994 The 1 km AVHRRglobal land data set First stages of implementation Inierna-tionaljournal of Remote Sensing 153443-62
Fekete G and L Treinish 1990 Sphere quadtree A newdata structure to support the visualization of sphericallydistributed data SPIE Extracting rManing from complex dataProcessing display interaction Vol 1259 pp 242-53
Fuller RB 1982 SynergeticJ NewYork MacMillanGiacaglia GEO and CA Lundquist 1972 Sampling func-
tions for geophysics Smithsonian A5trvphysical Observatory Spe-cial Report No 344 93 pp
Goodchild MF 1994 Geographical grid models for environ-mental monitoring and analysis across the globe (panelsession) In proceddings of GISUS 94 Conference PhoenixArizona
Gray RW 1994 Exact transformation equations for Fullersworld map Cartography and Geographic Informatian Systems21(4) 243-46
Hastings DA 1996 The global land l-km base elevationdigital elevation model A progress report Global ChangeNewsletter 27 11-12
Heikes R and DA Randall 1995 Numerical integration ofthe shallow-water equations on a twisted icosahedral gridPart I Basic design and results of tests Monthly WeatherReview 123 1862-80
Kahn R 1995 What shall we do with the data we are expect-ing in 1998 In Proceedings of the Massive Data SelJ WorkshopCommittee on Applied and Theoretical Statistics NationalAcademy of Sciences Washington DC
Kimerling AJ 1984 Area computation from geodetic coordi-nates on the spheroid Surveying and Mapping 44(4) 343-51
Kimerling AJ D White K Sahr and L Song 1995 Devel-opment of global sampling grid Mid-project report Samplingdesign and statistics research for EMAP Program us Environ-mental Protection Agency Corvallis Oregon
Loveland TR JW Merchant D O Ohlen and JF Brown1991 Development of a land-cover characteristics databasefor the conterminous US Photogrammetric Engineering andRemote Sensing 57(11) 1453-63
Lukatela H 1987 Hipparchus geopositioning model Anoverview In Proceedings of Auto Carto 8 Symposium Balti-more Maryland pp 87-96
Maling DH 1992 Coordinate systems and map projectioru (2nded) Oxford UK Pergamon Press
Muehrcke PC and JO Muehrcke 1997 Map we (4th ed) Madi-sonWisconsinJP Publications
Olea RO 1984 Sanlpling design optimization for spatial functionsMathematical Geowgy 16369-92
Saff EB and ABJ Kuijlaars 1997 Distnbuting many points on asphere The Mathematical Intelligencer 19(1)5-11
Slade G 1994 Self avoiding walks The MaJhematical Intelligencer16(1)29-35
Snyder JP 1987 Map projectioru-A working manual Wash-ington DC US Government Printing Office
Snyder JP 1992 An equal-area map projection for polyhe-dral globes Cartographica 29(1) 10-21
Song L 1997 Small circle subdivision method for develop-ment of global sampling grid Unpublished Masters thesisOregon State University 176 pp
Stauffer D 1992 Introduction to percolation theory (2nd ed)London UK Taylor amp Francis
Tobler WR and Z Chen 1986 A quadtree for global infor-mation storage GeographicalAnalysis 18(4) 360-71
White D A J Kimerling and WS Overton 1992 Carto-graphic and geometric components of a global samplingdesign for environmental monitoring Cartography and Geo-graphic Information Systems 195-22
White D AJ Kin1erlingK Sahr and L Song 1998 Comparingarea and shape distortion on polyhedral-based recursive partitionsof the sphere International Journal of Geographiad Information Science12 805-27
Wolfram S 1986 Cellular automaton fluids 1 Basic theoryjournal of Statistical Physics 45471-526 bull
(5)Zone perimeter = 2XTCXr(co~)
ZSG = SQ1middott(4XTCxcellarea - cellarea2lr2) I cellperimeter (6)
Zone Standardized Compactness (ZSC) isgiven by Zone perimeterCell perimeter Substi-tuting and combining equations we compute ZSCfrom
Baumgardner JR and PO Frederickson 1985 Icosahedraldiscretization of the two-sphere SIAM journal of NUrMricalAnalysis 22(6) 1107-15
Bomford G 1971 Geodesy Oxford The Clarendon Press731 pp
Brooks DR 1981 Grid systems for Earth radiation budgetexperiment applications NASA Technical Memorandum8323340 pp
Coexeter HSM 1962 The problem of packing a number ofequal nonoverlapping circles on a sphere Transactions NewYork Academy of Science Division of Mathematics Series IIvol 24 320-31
Dutton G 1988 Geodesic modeling of planetary relief Car-tographica 21 188-207
Dutton G 1994 Geographical grid models for environmentalmonitoring and analysis across the globe (panel session) InProceedings of GISUS 94 Conference Phoenix Arizona
cos$ =sqrt( IO-(IO-cellareal(2xTCX r2)) (4)
The perimeter of the spherical zone is thecircumference of the bounding parallel computedfrom
Gelarea = 2XTCxr2(lO-sin$) (2)
This research was supported by US Environ-mental Protection Agency-Oregon State Univer-sity Cooperative Agreement CR 821672 MatthewGregory Department of Geosciences graduatestudent created the centerpoint distance mapsseen in Figure 16 Dr Ralph Kahn NASA-JPLalso contributed significantly to this manuscriptThis manuscript has been subjected to EPA reviewand approved for publication The conclusionsand opinions are solely those of the authors andnot necessarily the viewsof the Agency
and
Setting the zone surface area equal to the cellarea we obtain
Vol 26 NO4 287
Del
iver
ed b
y P
ublis
hing
Tec
hnol
ogy
to O
rego
n S
tate
Uni
vers
ity IP
128
193
164
203
on
Sat
12
Nov
201
1 22
50
45C
opyr
ight
(c)
Car
togr
aphy
and
Geo
grap
hic
Info
rmat
ion
Soc
iety
All
right
s re
serv
ed
Remote Sensing for theEarth Sciences (3rd ed)Andrew Rencz
Recently adopted titlesin cartography GISremote sensingandGPS
Policy Issues in Modern art graph)DR Frazer Taylor (cd)
Wilderness NavigationBob and Mike Bums
I bullbull
ACS
Maps with the NewsMark Monmonier
Air Apparent HowMeteorologists Learnedto Map Predict andDramatize WeatherMark Monmonier
froooks
Mapping a Northern LandThe Survey of CanadaGerald McGrath and LouisSebert (eds)
Thematic Cartographyand VisualizationTerry A Slocum
1 it 11 bull
on Oirle ~y a30149j- ~24)
288 Cartography and Geographic Information Science
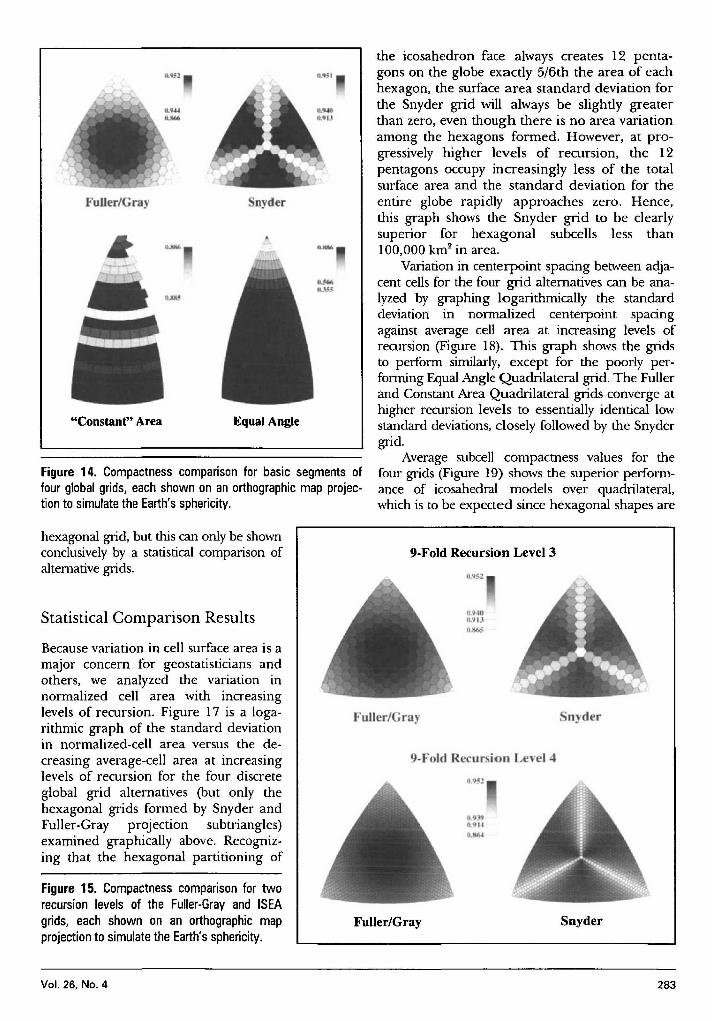
Del
iver
ed b
y P
ublis
hing
Tec
hnol
ogy
to O
rego
n S
tate
Uni
vers
ity IP
128
193
164
203
on
Sat
12
Nov
201
1 22
50
45C
opyr
ight
(c)
Car
togr
aphy
and
Geo
grap
hic
Info
rmat
ion
Soc
iety
All
right
s re
serv
ed
Figure 14 Compactness comparison for basic segments offour global grids each shown on an orthographic map projec-tion to simulate the Earths sphericity
the icosahedron face always creates 12 penta-gons on the globe exactly 56th the area of eachhexagon the surface area standard deviation forthe Snyder grid will always be slightly greaterthan zero even though there is no area variationamong the hexagons formed However at pro-gressively higher levels of recursion the 12pentagons occupy increasingly less of the totalsurface area and the standard deviation for theentire globe rapidly approaches zero Hencethis graph shows the Snyder grid to be clearlysuperior for hexagonal subcells less than100000 km2 in area
Variation in centerpoint spacing between adja-cent cells for the four grid alternatives can be ana-lyzed by graphing logarithmically the standarddeviation in normalized centerpoint spacingagainst average cell area at increasing levels ofrecursion (Figure 18) This graph shows the gridsto perform similarly except for the poorly per-forming EqualAngleQuadrilateral grid The Fullerand Constant Area Quadrilateral grids converge athigher recursion levels to essentially identical lowstandard deviations closely followed by the Snydergrid
Average subcell compactness values for thefour grids (Figure 19) shows the superior perform-ance of icosahedral models over quadrilateralwhich is to be expected since hexagonal shapes are
bullbull~
nyder
Equal Angle
FuUerGra
Constant Area
9middotFold Recur ion Level 4
FuJlerGra ~ n der
0951
U95
09-10U9IJOll(S
9-FoldRecursion Level 3
FullerGray Snyder
Because variation in cell surface area is amajor concern for geostatisticians andothers we analyzed the variation innormalized cell area with increasinglevels of recursion Figure 17 is a loga-rithmic graph of the standard deviationin normalized-cell area versus the de-creasing average-cell area at increasinglevels of recursion for the four discreteglobal grid alternatives (but only thehexagonal grids formed by Snyder andFuller-Gray projection subtriangles)examined graphically above Recogniz-ing that the hexagonal partitioning of
Figure 15 Compactness comparison for tworecursion levels of the Fuller-Gray and ISEAgrids each shown on an orthographic mapprojection to simulate the Earths sphericity
hexagonal grid but this can only be shownconclusivelyby a statistical comparison ofalternativegrids
Statistical Comparison Results
Vol 26 NO4 283
Del
iver
ed b
y P
ublis
hing
Tec
hnol
ogy
to O
rego
n S
tate
Uni
vers
ity IP
128
193
164
203
on
Sat
12
Nov
201
1 22
50
45C
opyr
ight
(c)
Car
togr
aphy
and
Geo
grap
hic
Info
rmat
ion
Soc
iety
All
right
s re
serv
ed
140km
190km
560 km
1300 kIT
1650 kIT
425 m
SnyderProjection
RecursionLevel 7
RecursionLevel 3
RecursionLevel 5
Fuller-GrayProjection
Figure 16 Variations in hexagonal centerpoint spacing at three levels of recursionfor the Fuller and ISEA Grids on an icosahedron face
In addition to the detailed nu-merical analysis of grid-cellarea compactness and center-point spacing at different levelsof recursion we carried out anoverall comparison of numerous
Summary Rankings
inherently more compact thanrectangular shapes At all levels ofrecursion the Fuller grid is com-prised of hexagons slightly morecompact than correspondingSnyder grid hexagons both beingfar more compact than the corre-sponding constant area and equalangle grid quadrilaterals
Variation in subcell compact-ness seen by graphing the stan-dard deviation of cell compactnessvalues against average cell area(Figure 20) shows the slightlybetter performance of the Fullergrid over the Snyder grid athigher levels of recursion Theconstant-area grid has the lowestoverall standard deviation at itsinitial resolution (level 0) but itsstandard deviation increases rap-idly as the initial cells are parti-tioned in an equal-angle mannerHowever the poor performanceassociated with the equal-anglegrid at all levels of recursion isnever approached
l2 Equal Angle Quadrilateral1 05 Bgt 0- 3GlC RecursionC 01 Level Constant Area QuadrilateralbullIII 1 0 8
3C ~1 2l bull 83 4 5III
1 2 Fuller-Gray ProjectionenIII 01Glbullc(
4i0C 001
~ia 5Ebull0Z 0001
107
106
105 4 3 2
10 10 102Average Cell Area km (log10 scale)
discrete global grid alternatives in-cluding the seven presented in Table1 Eleven of the fourteen Goodchildcriteria were investigated along withtwo related criteria deemed signifi-cant for global grid comparison ForGoodchild criteria 2 4 and 5 a sum-mary ordinal ranking from 1 (verypoor) to 10 (best possible) was devel-oped based on the quantitative analy-sis of comparison metrics
Table 1 provides informationcrucial to the selection of a global
Figure 17 Normalized subcell area standarddeviation vs average cell area for four globalgrids
284 Cartography and Geographic Information Science
Del
iver
ed b
y P
ublis
hing
Tec
hnol
ogy
to O
rego
n S
tate
Uni
vers
ity IP
128
193
164
203
on
Sat
12
Nov
201
1 22
50
45C
opyr
ight
(c)
Car
togr
aphy
and
Geo
grap
hic
Info
rmat
ion
Soc
iety
All
right
s re
serv
ed
Criterion Equal Angle Constant Area Snyder Fuller-Gray Small Circle Dir Sphere Gnomonic
1 Domain is globe yes yes yes yes yes yes yes
2 Equal areal 1 7 10 8 10 6 3
3 Same topology yes no yes yes yes yes yes
4 Equal shape 1 3 7 8 7 9 9
5 Compactnessmiddot 1 4 7 8 8 8 9
6 Straight edges onprojection na2 na yes yes na na yes
7 Perimeter bisection J ni ni ni ni ni nin1
8 Hierarchy yes yes yes4 yes4 yes4 yes4 yes4
9 Single point yes yes yes yes yes yes yes
10 Maximally centered ni ni ni ni ni ni ni
11 Equidistant no no no no no no no
12 Addressing ni ni ni ni oi ni ni13 LatitudelLongitude yes yes yes yes yes yes yes
14 Arbitrary resolution yes yes yes yes yes yes yes
Geodesic edge lines no no no no no yes yes
Spatial nature of area Continuously Part continu- Constant Continuously Constant Fractal-like Continuouslyvariation varying ous part varying varying
irregular
IBest possible = 10 very good = 9 -7 very poor = 1
2 na = not applicable
J ni = not investigated
4 Only the triangular cells not the hexagonal are hierarchical in these grids
Table 1 Evaluation of Goodchilds and related comparison criteria for different global grids
Figure 18 Normalized centerpoint distance standard deviation vs average cellarea for four global grids
ConclusionsThe global grid evaluation crite-ria and associated metrics haveallowed us to compare gridsvarying widely in cell geometryand topology We have observedthat the prime areas of concernamong the small portion of theglobal data user community wehave interacted with to date areequal-area cells and a nested
spherical subdivision the small circle subdivisionmethod and the Fuller-Gray map projection forthe icosahedron If good overall performance is ofparamount concern the triangular andor hex-agonal partitioning of the Fuller-Gray projectionsurface might be selected due to the low variationin compactness of highly compact cells that vary
slightly in area in a continuouslyvarying predictable manner
2 3 4 6
JL------ ~2 1 2 3Constant Area Quadrilateral
Equal Angle Quadrilateral2 38 8
o~RecursionLevel
Snyder Projection ~Fuller-Gray 1
Projection
ampoc i 100gtQG)aiCcEG)1lIo ~ 01isNrn=G)~~S~ III 011-------------------------------
B l 11 1~ 1~ 1~ 1~2Average Cell Area km (log0 scale)
grid based on the relative importance of evalua-tion criteria from the users perspective If cellcompactness is of prime importance for examplea triangular or hexagonal grid based on partition-ing a Gnomonic map projection of an icosahe-dron face (not discussed in this article) would bethe best alternative closely followed by direct
Vol 26 No4 285
Del
iver
ed b
y P
ublis
hing
Tec
hnol
ogy
to O
rego
n S
tate
Uni
vers
ity IP
128
193
164
203
on
Sat
12
Nov
201
1 22
50
45C
opyr
ight
(c)
Car
togr
aphy
and
Geo
grap
hic
Info
rmat
ion
Soc
iety
All
right
s re
serv
ed
Figure 19 Normalized subcell average compactness VS average cell area for fourglobal grids
Figure 20 Normalized subcell compactness standard deviation vs average cellarea for four global grids
(1)
Equal Angle Quadrilateral
2 3 4 5bull 0
2 3 4 5
1 2 3 Constant Area auadrilateral
2Equal Angle Quadrilateral
3 4 5
Zone area = 2x 1tX r2 (10 - sin $)
RecursionLevel
o0-0 ---_e_----lto---
RecursionLevel
APPENDIXZone Standardized Compactness
(ZSC)Derivation
6 5 4 310 10 10 10
Average Cell Area km2 (10910 scale)
------ --_---lt~ 2 3 4
o
where r is the radius of the sphere and ltP is thelatitude of the bounding parallel
The surface area of a spherical zone is computedfrom
will give a full picture of the strengths and weak-nesses of current global grid alternatives
o
Constant AreaQuadrilateral
_~~ iFuller-Gray 1 2 Projection 3 4 5
o
Fuller-GrayProjection 1
Snyder Projection 1gt-------------------
05
00011------7---- ----------4 -----r--~2
10 10 10 10 10 102Average Cell Area km (10910scale)
CIl()CI)5 01 =() r~2Emlt3 ~- C 01=Gl 0 =0CO
111iii iii 001 =Ebulloz
IIIIII
CII CIImS 09tll ()bullbull tllClIogt Elt0o
08
hierarchy among cells (criteria 2and 8) Both the quadrilateralgrids and triangular forms ofpolyhedral grids examined herecan be partitioned recursivelyallowing a nested hierarchy tobe created Equal-area cells isthe critical criterion since cur-rently employed equal-angleand constant-area quadrilateralgrids can never be equal areaand were shown to performpoorly in this respect relative toseveral alternative grids
Only two global grids thosebased on the triangular partition-ing of the Icosahedral SnyderEqual Area (ISFA)projection andpartitioning using the Small Cir-cle Subdivision method (not dis-cussed in this article but describedin Song 1997)will produce equal-area cells on the spheroid TheSmall Circle Subdivision methodhas the advantage of producingcells slightly more compact butthe ISFA grid is currently moreefficient to compute and easier toimplement Consequently werecommend the ISFA as the bestcurrent choice for an equal areaglobal grid Whichever global gridis selected there are implementa-tion issues that must be addressedin future research includingbull Implementing an efficient
addressing scheme for bin-ning data into grid cells
bull Creating algorithms for fasttranslation of gridded data to and from geo-detic latitude and longitude
bull Developing efficient algorithms for aggrega-tion and disaggregation among nested gridlevels and
bull Implementing efficient data storage andaccess schemes for data in nested cells includ-ing metadata storage and accessWe have begun to address several of these im-
plementation facets for the ISFA grid beginningwith an ETOP05 DEM dataset binning experimentconducted at several levels of recursion (seehttpbufogeoorstedufirmatdgg for binning ex-amples) Performing similar implementation experi-ments on additional datasets using other candidategrids would provide a complementary grid compari-son that together with our geometrical comparisons
286 Cartography and Geographic Information Science
Del
iver
ed b
y P
ublis
hing
Tec
hnol
ogy
to O
rego
n S
tate
Uni
vers
ity IP
128
193
164
203
on
Sat
12
Nov
201
1 22
50
45C
opyr
ight
(c)
Car
togr
aphy
and
Geo
grap
hic
Info
rmat
ion
Soc
iety
All
right
s re
serv
ed
REFERENCES
ACKNOWLEDGMENTS
so that
EidenshinkJC andJL Faundeen 1994 The 1 km AVHRRglobal land data set First stages of implementation Inierna-tionaljournal of Remote Sensing 153443-62
Fekete G and L Treinish 1990 Sphere quadtree A newdata structure to support the visualization of sphericallydistributed data SPIE Extracting rManing from complex dataProcessing display interaction Vol 1259 pp 242-53
Fuller RB 1982 SynergeticJ NewYork MacMillanGiacaglia GEO and CA Lundquist 1972 Sampling func-
tions for geophysics Smithsonian A5trvphysical Observatory Spe-cial Report No 344 93 pp
Goodchild MF 1994 Geographical grid models for environ-mental monitoring and analysis across the globe (panelsession) In proceddings of GISUS 94 Conference PhoenixArizona
Gray RW 1994 Exact transformation equations for Fullersworld map Cartography and Geographic Informatian Systems21(4) 243-46
Hastings DA 1996 The global land l-km base elevationdigital elevation model A progress report Global ChangeNewsletter 27 11-12
Heikes R and DA Randall 1995 Numerical integration ofthe shallow-water equations on a twisted icosahedral gridPart I Basic design and results of tests Monthly WeatherReview 123 1862-80
Kahn R 1995 What shall we do with the data we are expect-ing in 1998 In Proceedings of the Massive Data SelJ WorkshopCommittee on Applied and Theoretical Statistics NationalAcademy of Sciences Washington DC
Kimerling AJ 1984 Area computation from geodetic coordi-nates on the spheroid Surveying and Mapping 44(4) 343-51
Kimerling AJ D White K Sahr and L Song 1995 Devel-opment of global sampling grid Mid-project report Samplingdesign and statistics research for EMAP Program us Environ-mental Protection Agency Corvallis Oregon
Loveland TR JW Merchant D O Ohlen and JF Brown1991 Development of a land-cover characteristics databasefor the conterminous US Photogrammetric Engineering andRemote Sensing 57(11) 1453-63
Lukatela H 1987 Hipparchus geopositioning model Anoverview In Proceedings of Auto Carto 8 Symposium Balti-more Maryland pp 87-96
Maling DH 1992 Coordinate systems and map projectioru (2nded) Oxford UK Pergamon Press
Muehrcke PC and JO Muehrcke 1997 Map we (4th ed) Madi-sonWisconsinJP Publications
Olea RO 1984 Sanlpling design optimization for spatial functionsMathematical Geowgy 16369-92
Saff EB and ABJ Kuijlaars 1997 Distnbuting many points on asphere The Mathematical Intelligencer 19(1)5-11
Slade G 1994 Self avoiding walks The MaJhematical Intelligencer16(1)29-35
Snyder JP 1987 Map projectioru-A working manual Wash-ington DC US Government Printing Office
Snyder JP 1992 An equal-area map projection for polyhe-dral globes Cartographica 29(1) 10-21
Song L 1997 Small circle subdivision method for develop-ment of global sampling grid Unpublished Masters thesisOregon State University 176 pp
Stauffer D 1992 Introduction to percolation theory (2nd ed)London UK Taylor amp Francis
Tobler WR and Z Chen 1986 A quadtree for global infor-mation storage GeographicalAnalysis 18(4) 360-71
White D A J Kimerling and WS Overton 1992 Carto-graphic and geometric components of a global samplingdesign for environmental monitoring Cartography and Geo-graphic Information Systems 195-22
White D AJ Kin1erlingK Sahr and L Song 1998 Comparingarea and shape distortion on polyhedral-based recursive partitionsof the sphere International Journal of Geographiad Information Science12 805-27
Wolfram S 1986 Cellular automaton fluids 1 Basic theoryjournal of Statistical Physics 45471-526 bull
(5)Zone perimeter = 2XTCXr(co~)
ZSG = SQ1middott(4XTCxcellarea - cellarea2lr2) I cellperimeter (6)
Zone Standardized Compactness (ZSC) isgiven by Zone perimeterCell perimeter Substi-tuting and combining equations we compute ZSCfrom
Baumgardner JR and PO Frederickson 1985 Icosahedraldiscretization of the two-sphere SIAM journal of NUrMricalAnalysis 22(6) 1107-15
Bomford G 1971 Geodesy Oxford The Clarendon Press731 pp
Brooks DR 1981 Grid systems for Earth radiation budgetexperiment applications NASA Technical Memorandum8323340 pp
Coexeter HSM 1962 The problem of packing a number ofequal nonoverlapping circles on a sphere Transactions NewYork Academy of Science Division of Mathematics Series IIvol 24 320-31
Dutton G 1988 Geodesic modeling of planetary relief Car-tographica 21 188-207
Dutton G 1994 Geographical grid models for environmentalmonitoring and analysis across the globe (panel session) InProceedings of GISUS 94 Conference Phoenix Arizona
cos$ =sqrt( IO-(IO-cellareal(2xTCX r2)) (4)
The perimeter of the spherical zone is thecircumference of the bounding parallel computedfrom
Gelarea = 2XTCxr2(lO-sin$) (2)
This research was supported by US Environ-mental Protection Agency-Oregon State Univer-sity Cooperative Agreement CR 821672 MatthewGregory Department of Geosciences graduatestudent created the centerpoint distance mapsseen in Figure 16 Dr Ralph Kahn NASA-JPLalso contributed significantly to this manuscriptThis manuscript has been subjected to EPA reviewand approved for publication The conclusionsand opinions are solely those of the authors andnot necessarily the viewsof the Agency
and
Setting the zone surface area equal to the cellarea we obtain
Vol 26 NO4 287
Del
iver
ed b
y P
ublis
hing
Tec
hnol
ogy
to O
rego
n S
tate
Uni
vers
ity IP
128
193
164
203
on
Sat
12
Nov
201
1 22
50
45C
opyr
ight
(c)
Car
togr
aphy
and
Geo
grap
hic
Info
rmat
ion
Soc
iety
All
right
s re
serv
ed
Remote Sensing for theEarth Sciences (3rd ed)Andrew Rencz
Recently adopted titlesin cartography GISremote sensingandGPS
Policy Issues in Modern art graph)DR Frazer Taylor (cd)
Wilderness NavigationBob and Mike Bums
I bullbull
ACS
Maps with the NewsMark Monmonier
Air Apparent HowMeteorologists Learnedto Map Predict andDramatize WeatherMark Monmonier
froooks
Mapping a Northern LandThe Survey of CanadaGerald McGrath and LouisSebert (eds)
Thematic Cartographyand VisualizationTerry A Slocum
1 it 11 bull
on Oirle ~y a30149j- ~24)
288 Cartography and Geographic Information Science
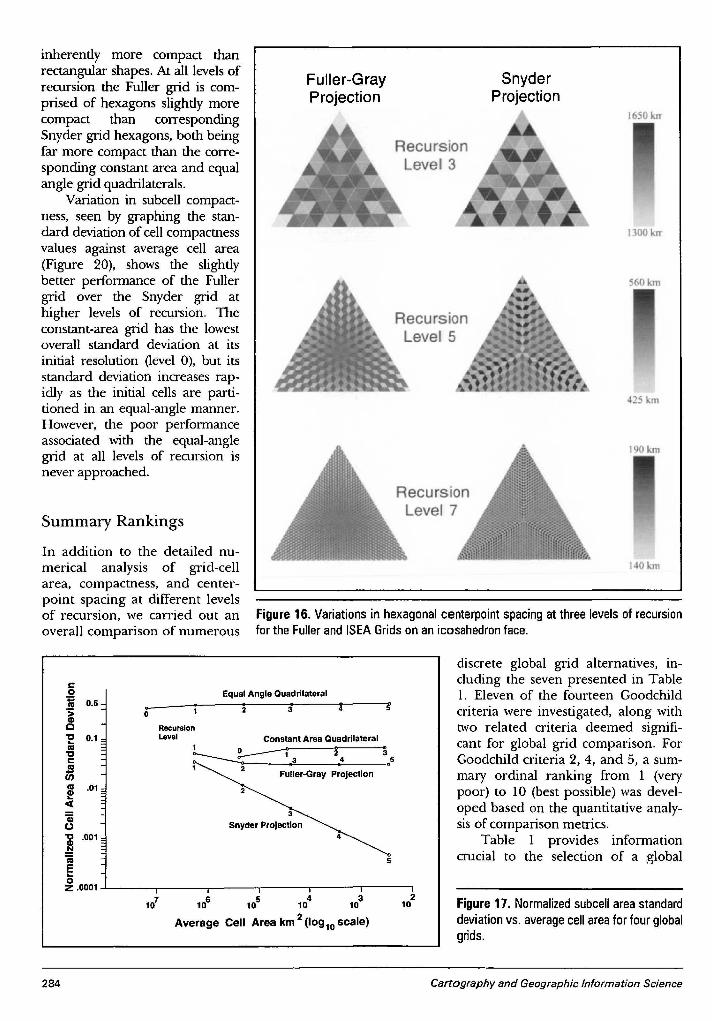
Del
iver
ed b
y P
ublis
hing
Tec
hnol
ogy
to O
rego
n S
tate
Uni
vers
ity IP
128
193
164
203
on
Sat
12
Nov
201
1 22
50
45C
opyr
ight
(c)
Car
togr
aphy
and
Geo
grap
hic
Info
rmat
ion
Soc
iety
All
right
s re
serv
ed
140km
190km
560 km
1300 kIT
1650 kIT
425 m
SnyderProjection
RecursionLevel 7
RecursionLevel 3
RecursionLevel 5
Fuller-GrayProjection
Figure 16 Variations in hexagonal centerpoint spacing at three levels of recursionfor the Fuller and ISEA Grids on an icosahedron face
In addition to the detailed nu-merical analysis of grid-cellarea compactness and center-point spacing at different levelsof recursion we carried out anoverall comparison of numerous
Summary Rankings
inherently more compact thanrectangular shapes At all levels ofrecursion the Fuller grid is com-prised of hexagons slightly morecompact than correspondingSnyder grid hexagons both beingfar more compact than the corre-sponding constant area and equalangle grid quadrilaterals
Variation in subcell compact-ness seen by graphing the stan-dard deviation of cell compactnessvalues against average cell area(Figure 20) shows the slightlybetter performance of the Fullergrid over the Snyder grid athigher levels of recursion Theconstant-area grid has the lowestoverall standard deviation at itsinitial resolution (level 0) but itsstandard deviation increases rap-idly as the initial cells are parti-tioned in an equal-angle mannerHowever the poor performanceassociated with the equal-anglegrid at all levels of recursion isnever approached
l2 Equal Angle Quadrilateral1 05 Bgt 0- 3GlC RecursionC 01 Level Constant Area QuadrilateralbullIII 1 0 8
3C ~1 2l bull 83 4 5III
1 2 Fuller-Gray ProjectionenIII 01Glbullc(
4i0C 001
~ia 5Ebull0Z 0001
107
106
105 4 3 2
10 10 102Average Cell Area km (log10 scale)
discrete global grid alternatives in-cluding the seven presented in Table1 Eleven of the fourteen Goodchildcriteria were investigated along withtwo related criteria deemed signifi-cant for global grid comparison ForGoodchild criteria 2 4 and 5 a sum-mary ordinal ranking from 1 (verypoor) to 10 (best possible) was devel-oped based on the quantitative analy-sis of comparison metrics
Table 1 provides informationcrucial to the selection of a global
Figure 17 Normalized subcell area standarddeviation vs average cell area for four globalgrids
284 Cartography and Geographic Information Science
Del
iver
ed b
y P
ublis
hing
Tec
hnol
ogy
to O
rego
n S
tate
Uni
vers
ity IP
128
193
164
203
on
Sat
12
Nov
201
1 22
50
45C
opyr
ight
(c)
Car
togr
aphy
and
Geo
grap
hic
Info
rmat
ion
Soc
iety
All
right
s re
serv
ed
Criterion Equal Angle Constant Area Snyder Fuller-Gray Small Circle Dir Sphere Gnomonic
1 Domain is globe yes yes yes yes yes yes yes
2 Equal areal 1 7 10 8 10 6 3
3 Same topology yes no yes yes yes yes yes
4 Equal shape 1 3 7 8 7 9 9
5 Compactnessmiddot 1 4 7 8 8 8 9
6 Straight edges onprojection na2 na yes yes na na yes
7 Perimeter bisection J ni ni ni ni ni nin1
8 Hierarchy yes yes yes4 yes4 yes4 yes4 yes4
9 Single point yes yes yes yes yes yes yes
10 Maximally centered ni ni ni ni ni ni ni
11 Equidistant no no no no no no no
12 Addressing ni ni ni ni oi ni ni13 LatitudelLongitude yes yes yes yes yes yes yes
14 Arbitrary resolution yes yes yes yes yes yes yes
Geodesic edge lines no no no no no yes yes
Spatial nature of area Continuously Part continu- Constant Continuously Constant Fractal-like Continuouslyvariation varying ous part varying varying
irregular
IBest possible = 10 very good = 9 -7 very poor = 1
2 na = not applicable
J ni = not investigated
4 Only the triangular cells not the hexagonal are hierarchical in these grids
Table 1 Evaluation of Goodchilds and related comparison criteria for different global grids
Figure 18 Normalized centerpoint distance standard deviation vs average cellarea for four global grids
ConclusionsThe global grid evaluation crite-ria and associated metrics haveallowed us to compare gridsvarying widely in cell geometryand topology We have observedthat the prime areas of concernamong the small portion of theglobal data user community wehave interacted with to date areequal-area cells and a nested
spherical subdivision the small circle subdivisionmethod and the Fuller-Gray map projection forthe icosahedron If good overall performance is ofparamount concern the triangular andor hex-agonal partitioning of the Fuller-Gray projectionsurface might be selected due to the low variationin compactness of highly compact cells that vary
slightly in area in a continuouslyvarying predictable manner
2 3 4 6
JL------ ~2 1 2 3Constant Area Quadrilateral
Equal Angle Quadrilateral2 38 8
o~RecursionLevel
Snyder Projection ~Fuller-Gray 1
Projection
ampoc i 100gtQG)aiCcEG)1lIo ~ 01isNrn=G)~~S~ III 011-------------------------------
B l 11 1~ 1~ 1~ 1~2Average Cell Area km (log0 scale)
grid based on the relative importance of evalua-tion criteria from the users perspective If cellcompactness is of prime importance for examplea triangular or hexagonal grid based on partition-ing a Gnomonic map projection of an icosahe-dron face (not discussed in this article) would bethe best alternative closely followed by direct
Vol 26 No4 285
Del
iver
ed b
y P
ublis
hing
Tec
hnol
ogy
to O
rego
n S
tate
Uni
vers
ity IP
128
193
164
203
on
Sat
12
Nov
201
1 22
50
45C
opyr
ight
(c)
Car
togr
aphy
and
Geo
grap
hic
Info
rmat
ion
Soc
iety
All
right
s re
serv
ed
Figure 19 Normalized subcell average compactness VS average cell area for fourglobal grids
Figure 20 Normalized subcell compactness standard deviation vs average cellarea for four global grids
(1)
Equal Angle Quadrilateral
2 3 4 5bull 0
2 3 4 5
1 2 3 Constant Area auadrilateral
2Equal Angle Quadrilateral
3 4 5
Zone area = 2x 1tX r2 (10 - sin $)
RecursionLevel
o0-0 ---_e_----lto---
RecursionLevel
APPENDIXZone Standardized Compactness
(ZSC)Derivation
6 5 4 310 10 10 10
Average Cell Area km2 (10910 scale)
------ --_---lt~ 2 3 4
o
where r is the radius of the sphere and ltP is thelatitude of the bounding parallel
The surface area of a spherical zone is computedfrom
will give a full picture of the strengths and weak-nesses of current global grid alternatives
o
Constant AreaQuadrilateral
_~~ iFuller-Gray 1 2 Projection 3 4 5
o
Fuller-GrayProjection 1
Snyder Projection 1gt-------------------
05
00011------7---- ----------4 -----r--~2
10 10 10 10 10 102Average Cell Area km (10910scale)
CIl()CI)5 01 =() r~2Emlt3 ~- C 01=Gl 0 =0CO
111iii iii 001 =Ebulloz
IIIIII
CII CIImS 09tll ()bullbull tllClIogt Elt0o
08
hierarchy among cells (criteria 2and 8) Both the quadrilateralgrids and triangular forms ofpolyhedral grids examined herecan be partitioned recursivelyallowing a nested hierarchy tobe created Equal-area cells isthe critical criterion since cur-rently employed equal-angleand constant-area quadrilateralgrids can never be equal areaand were shown to performpoorly in this respect relative toseveral alternative grids
Only two global grids thosebased on the triangular partition-ing of the Icosahedral SnyderEqual Area (ISFA)projection andpartitioning using the Small Cir-cle Subdivision method (not dis-cussed in this article but describedin Song 1997)will produce equal-area cells on the spheroid TheSmall Circle Subdivision methodhas the advantage of producingcells slightly more compact butthe ISFA grid is currently moreefficient to compute and easier toimplement Consequently werecommend the ISFA as the bestcurrent choice for an equal areaglobal grid Whichever global gridis selected there are implementa-tion issues that must be addressedin future research includingbull Implementing an efficient
addressing scheme for bin-ning data into grid cells
bull Creating algorithms for fasttranslation of gridded data to and from geo-detic latitude and longitude
bull Developing efficient algorithms for aggrega-tion and disaggregation among nested gridlevels and
bull Implementing efficient data storage andaccess schemes for data in nested cells includ-ing metadata storage and accessWe have begun to address several of these im-
plementation facets for the ISFA grid beginningwith an ETOP05 DEM dataset binning experimentconducted at several levels of recursion (seehttpbufogeoorstedufirmatdgg for binning ex-amples) Performing similar implementation experi-ments on additional datasets using other candidategrids would provide a complementary grid compari-son that together with our geometrical comparisons
286 Cartography and Geographic Information Science
Del
iver
ed b
y P
ublis
hing
Tec
hnol
ogy
to O
rego
n S
tate
Uni
vers
ity IP
128
193
164
203
on
Sat
12
Nov
201
1 22
50
45C
opyr
ight
(c)
Car
togr
aphy
and
Geo
grap
hic
Info
rmat
ion
Soc
iety
All
right
s re
serv
ed
REFERENCES
ACKNOWLEDGMENTS
so that
EidenshinkJC andJL Faundeen 1994 The 1 km AVHRRglobal land data set First stages of implementation Inierna-tionaljournal of Remote Sensing 153443-62
Fekete G and L Treinish 1990 Sphere quadtree A newdata structure to support the visualization of sphericallydistributed data SPIE Extracting rManing from complex dataProcessing display interaction Vol 1259 pp 242-53
Fuller RB 1982 SynergeticJ NewYork MacMillanGiacaglia GEO and CA Lundquist 1972 Sampling func-
tions for geophysics Smithsonian A5trvphysical Observatory Spe-cial Report No 344 93 pp
Goodchild MF 1994 Geographical grid models for environ-mental monitoring and analysis across the globe (panelsession) In proceddings of GISUS 94 Conference PhoenixArizona
Gray RW 1994 Exact transformation equations for Fullersworld map Cartography and Geographic Informatian Systems21(4) 243-46
Hastings DA 1996 The global land l-km base elevationdigital elevation model A progress report Global ChangeNewsletter 27 11-12
Heikes R and DA Randall 1995 Numerical integration ofthe shallow-water equations on a twisted icosahedral gridPart I Basic design and results of tests Monthly WeatherReview 123 1862-80
Kahn R 1995 What shall we do with the data we are expect-ing in 1998 In Proceedings of the Massive Data SelJ WorkshopCommittee on Applied and Theoretical Statistics NationalAcademy of Sciences Washington DC
Kimerling AJ 1984 Area computation from geodetic coordi-nates on the spheroid Surveying and Mapping 44(4) 343-51
Kimerling AJ D White K Sahr and L Song 1995 Devel-opment of global sampling grid Mid-project report Samplingdesign and statistics research for EMAP Program us Environ-mental Protection Agency Corvallis Oregon
Loveland TR JW Merchant D O Ohlen and JF Brown1991 Development of a land-cover characteristics databasefor the conterminous US Photogrammetric Engineering andRemote Sensing 57(11) 1453-63
Lukatela H 1987 Hipparchus geopositioning model Anoverview In Proceedings of Auto Carto 8 Symposium Balti-more Maryland pp 87-96
Maling DH 1992 Coordinate systems and map projectioru (2nded) Oxford UK Pergamon Press
Muehrcke PC and JO Muehrcke 1997 Map we (4th ed) Madi-sonWisconsinJP Publications
Olea RO 1984 Sanlpling design optimization for spatial functionsMathematical Geowgy 16369-92
Saff EB and ABJ Kuijlaars 1997 Distnbuting many points on asphere The Mathematical Intelligencer 19(1)5-11
Slade G 1994 Self avoiding walks The MaJhematical Intelligencer16(1)29-35
Snyder JP 1987 Map projectioru-A working manual Wash-ington DC US Government Printing Office
Snyder JP 1992 An equal-area map projection for polyhe-dral globes Cartographica 29(1) 10-21
Song L 1997 Small circle subdivision method for develop-ment of global sampling grid Unpublished Masters thesisOregon State University 176 pp
Stauffer D 1992 Introduction to percolation theory (2nd ed)London UK Taylor amp Francis
Tobler WR and Z Chen 1986 A quadtree for global infor-mation storage GeographicalAnalysis 18(4) 360-71
White D A J Kimerling and WS Overton 1992 Carto-graphic and geometric components of a global samplingdesign for environmental monitoring Cartography and Geo-graphic Information Systems 195-22
White D AJ Kin1erlingK Sahr and L Song 1998 Comparingarea and shape distortion on polyhedral-based recursive partitionsof the sphere International Journal of Geographiad Information Science12 805-27
Wolfram S 1986 Cellular automaton fluids 1 Basic theoryjournal of Statistical Physics 45471-526 bull
(5)Zone perimeter = 2XTCXr(co~)
ZSG = SQ1middott(4XTCxcellarea - cellarea2lr2) I cellperimeter (6)
Zone Standardized Compactness (ZSC) isgiven by Zone perimeterCell perimeter Substi-tuting and combining equations we compute ZSCfrom
Baumgardner JR and PO Frederickson 1985 Icosahedraldiscretization of the two-sphere SIAM journal of NUrMricalAnalysis 22(6) 1107-15
Bomford G 1971 Geodesy Oxford The Clarendon Press731 pp
Brooks DR 1981 Grid systems for Earth radiation budgetexperiment applications NASA Technical Memorandum8323340 pp
Coexeter HSM 1962 The problem of packing a number ofequal nonoverlapping circles on a sphere Transactions NewYork Academy of Science Division of Mathematics Series IIvol 24 320-31
Dutton G 1988 Geodesic modeling of planetary relief Car-tographica 21 188-207
Dutton G 1994 Geographical grid models for environmentalmonitoring and analysis across the globe (panel session) InProceedings of GISUS 94 Conference Phoenix Arizona
cos$ =sqrt( IO-(IO-cellareal(2xTCX r2)) (4)
The perimeter of the spherical zone is thecircumference of the bounding parallel computedfrom
Gelarea = 2XTCxr2(lO-sin$) (2)
This research was supported by US Environ-mental Protection Agency-Oregon State Univer-sity Cooperative Agreement CR 821672 MatthewGregory Department of Geosciences graduatestudent created the centerpoint distance mapsseen in Figure 16 Dr Ralph Kahn NASA-JPLalso contributed significantly to this manuscriptThis manuscript has been subjected to EPA reviewand approved for publication The conclusionsand opinions are solely those of the authors andnot necessarily the viewsof the Agency
and
Setting the zone surface area equal to the cellarea we obtain
Vol 26 NO4 287
Del
iver
ed b
y P
ublis
hing
Tec
hnol
ogy
to O
rego
n S
tate
Uni
vers
ity IP
128
193
164
203
on
Sat
12
Nov
201
1 22
50
45C
opyr
ight
(c)
Car
togr
aphy
and
Geo
grap
hic
Info
rmat
ion
Soc
iety
All
right
s re
serv
ed
Remote Sensing for theEarth Sciences (3rd ed)Andrew Rencz
Recently adopted titlesin cartography GISremote sensingandGPS
Policy Issues in Modern art graph)DR Frazer Taylor (cd)
Wilderness NavigationBob and Mike Bums
I bullbull
ACS
Maps with the NewsMark Monmonier
Air Apparent HowMeteorologists Learnedto Map Predict andDramatize WeatherMark Monmonier
froooks
Mapping a Northern LandThe Survey of CanadaGerald McGrath and LouisSebert (eds)
Thematic Cartographyand VisualizationTerry A Slocum
1 it 11 bull
on Oirle ~y a30149j- ~24)
288 Cartography and Geographic Information Science
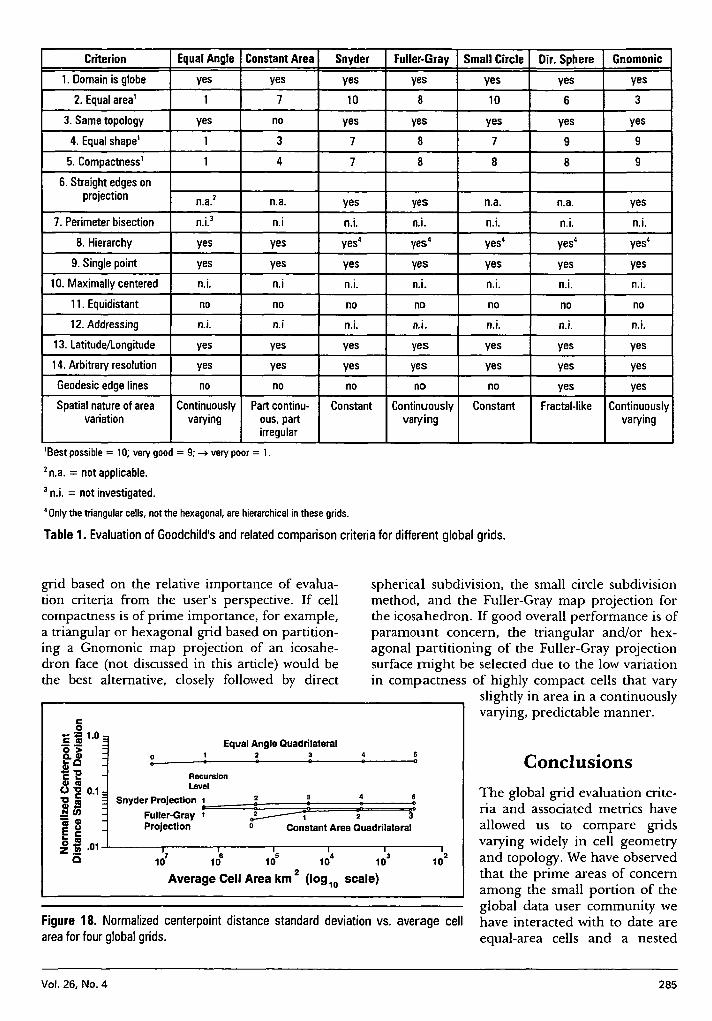
Del
iver
ed b
y P
ublis
hing
Tec
hnol
ogy
to O
rego
n S
tate
Uni
vers
ity IP
128
193
164
203
on
Sat
12
Nov
201
1 22
50
45C
opyr
ight
(c)
Car
togr
aphy
and
Geo
grap
hic
Info
rmat
ion
Soc
iety
All
right
s re
serv
ed
Criterion Equal Angle Constant Area Snyder Fuller-Gray Small Circle Dir Sphere Gnomonic
1 Domain is globe yes yes yes yes yes yes yes
2 Equal areal 1 7 10 8 10 6 3
3 Same topology yes no yes yes yes yes yes
4 Equal shape 1 3 7 8 7 9 9
5 Compactnessmiddot 1 4 7 8 8 8 9
6 Straight edges onprojection na2 na yes yes na na yes
7 Perimeter bisection J ni ni ni ni ni nin1
8 Hierarchy yes yes yes4 yes4 yes4 yes4 yes4
9 Single point yes yes yes yes yes yes yes
10 Maximally centered ni ni ni ni ni ni ni
11 Equidistant no no no no no no no
12 Addressing ni ni ni ni oi ni ni13 LatitudelLongitude yes yes yes yes yes yes yes
14 Arbitrary resolution yes yes yes yes yes yes yes
Geodesic edge lines no no no no no yes yes
Spatial nature of area Continuously Part continu- Constant Continuously Constant Fractal-like Continuouslyvariation varying ous part varying varying
irregular
IBest possible = 10 very good = 9 -7 very poor = 1
2 na = not applicable
J ni = not investigated
4 Only the triangular cells not the hexagonal are hierarchical in these grids
Table 1 Evaluation of Goodchilds and related comparison criteria for different global grids
Figure 18 Normalized centerpoint distance standard deviation vs average cellarea for four global grids
ConclusionsThe global grid evaluation crite-ria and associated metrics haveallowed us to compare gridsvarying widely in cell geometryand topology We have observedthat the prime areas of concernamong the small portion of theglobal data user community wehave interacted with to date areequal-area cells and a nested
spherical subdivision the small circle subdivisionmethod and the Fuller-Gray map projection forthe icosahedron If good overall performance is ofparamount concern the triangular andor hex-agonal partitioning of the Fuller-Gray projectionsurface might be selected due to the low variationin compactness of highly compact cells that vary
slightly in area in a continuouslyvarying predictable manner
2 3 4 6
JL------ ~2 1 2 3Constant Area Quadrilateral
Equal Angle Quadrilateral2 38 8
o~RecursionLevel
Snyder Projection ~Fuller-Gray 1
Projection
ampoc i 100gtQG)aiCcEG)1lIo ~ 01isNrn=G)~~S~ III 011-------------------------------
B l 11 1~ 1~ 1~ 1~2Average Cell Area km (log0 scale)
grid based on the relative importance of evalua-tion criteria from the users perspective If cellcompactness is of prime importance for examplea triangular or hexagonal grid based on partition-ing a Gnomonic map projection of an icosahe-dron face (not discussed in this article) would bethe best alternative closely followed by direct
Vol 26 No4 285
Del
iver
ed b
y P
ublis
hing
Tec
hnol
ogy
to O
rego
n S
tate
Uni
vers
ity IP
128
193
164
203
on
Sat
12
Nov
201
1 22
50
45C
opyr
ight
(c)
Car
togr
aphy
and
Geo
grap
hic
Info
rmat
ion
Soc
iety
All
right
s re
serv
ed
Figure 19 Normalized subcell average compactness VS average cell area for fourglobal grids
Figure 20 Normalized subcell compactness standard deviation vs average cellarea for four global grids
(1)
Equal Angle Quadrilateral
2 3 4 5bull 0
2 3 4 5
1 2 3 Constant Area auadrilateral
2Equal Angle Quadrilateral
3 4 5
Zone area = 2x 1tX r2 (10 - sin $)
RecursionLevel
o0-0 ---_e_----lto---
RecursionLevel
APPENDIXZone Standardized Compactness
(ZSC)Derivation
6 5 4 310 10 10 10
Average Cell Area km2 (10910 scale)
------ --_---lt~ 2 3 4
o
where r is the radius of the sphere and ltP is thelatitude of the bounding parallel
The surface area of a spherical zone is computedfrom
will give a full picture of the strengths and weak-nesses of current global grid alternatives
o
Constant AreaQuadrilateral
_~~ iFuller-Gray 1 2 Projection 3 4 5
o
Fuller-GrayProjection 1
Snyder Projection 1gt-------------------
05
00011------7---- ----------4 -----r--~2
10 10 10 10 10 102Average Cell Area km (10910scale)
CIl()CI)5 01 =() r~2Emlt3 ~- C 01=Gl 0 =0CO
111iii iii 001 =Ebulloz
IIIIII
CII CIImS 09tll ()bullbull tllClIogt Elt0o
08
hierarchy among cells (criteria 2and 8) Both the quadrilateralgrids and triangular forms ofpolyhedral grids examined herecan be partitioned recursivelyallowing a nested hierarchy tobe created Equal-area cells isthe critical criterion since cur-rently employed equal-angleand constant-area quadrilateralgrids can never be equal areaand were shown to performpoorly in this respect relative toseveral alternative grids
Only two global grids thosebased on the triangular partition-ing of the Icosahedral SnyderEqual Area (ISFA)projection andpartitioning using the Small Cir-cle Subdivision method (not dis-cussed in this article but describedin Song 1997)will produce equal-area cells on the spheroid TheSmall Circle Subdivision methodhas the advantage of producingcells slightly more compact butthe ISFA grid is currently moreefficient to compute and easier toimplement Consequently werecommend the ISFA as the bestcurrent choice for an equal areaglobal grid Whichever global gridis selected there are implementa-tion issues that must be addressedin future research includingbull Implementing an efficient
addressing scheme for bin-ning data into grid cells
bull Creating algorithms for fasttranslation of gridded data to and from geo-detic latitude and longitude
bull Developing efficient algorithms for aggrega-tion and disaggregation among nested gridlevels and
bull Implementing efficient data storage andaccess schemes for data in nested cells includ-ing metadata storage and accessWe have begun to address several of these im-
plementation facets for the ISFA grid beginningwith an ETOP05 DEM dataset binning experimentconducted at several levels of recursion (seehttpbufogeoorstedufirmatdgg for binning ex-amples) Performing similar implementation experi-ments on additional datasets using other candidategrids would provide a complementary grid compari-son that together with our geometrical comparisons
286 Cartography and Geographic Information Science
Del
iver
ed b
y P
ublis
hing
Tec
hnol
ogy
to O
rego
n S
tate
Uni
vers
ity IP
128
193
164
203
on
Sat
12
Nov
201
1 22
50
45C
opyr
ight
(c)
Car
togr
aphy
and
Geo
grap
hic
Info
rmat
ion
Soc
iety
All
right
s re
serv
ed
REFERENCES
ACKNOWLEDGMENTS
so that
EidenshinkJC andJL Faundeen 1994 The 1 km AVHRRglobal land data set First stages of implementation Inierna-tionaljournal of Remote Sensing 153443-62
Fekete G and L Treinish 1990 Sphere quadtree A newdata structure to support the visualization of sphericallydistributed data SPIE Extracting rManing from complex dataProcessing display interaction Vol 1259 pp 242-53
Fuller RB 1982 SynergeticJ NewYork MacMillanGiacaglia GEO and CA Lundquist 1972 Sampling func-
tions for geophysics Smithsonian A5trvphysical Observatory Spe-cial Report No 344 93 pp
Goodchild MF 1994 Geographical grid models for environ-mental monitoring and analysis across the globe (panelsession) In proceddings of GISUS 94 Conference PhoenixArizona
Gray RW 1994 Exact transformation equations for Fullersworld map Cartography and Geographic Informatian Systems21(4) 243-46
Hastings DA 1996 The global land l-km base elevationdigital elevation model A progress report Global ChangeNewsletter 27 11-12
Heikes R and DA Randall 1995 Numerical integration ofthe shallow-water equations on a twisted icosahedral gridPart I Basic design and results of tests Monthly WeatherReview 123 1862-80
Kahn R 1995 What shall we do with the data we are expect-ing in 1998 In Proceedings of the Massive Data SelJ WorkshopCommittee on Applied and Theoretical Statistics NationalAcademy of Sciences Washington DC
Kimerling AJ 1984 Area computation from geodetic coordi-nates on the spheroid Surveying and Mapping 44(4) 343-51
Kimerling AJ D White K Sahr and L Song 1995 Devel-opment of global sampling grid Mid-project report Samplingdesign and statistics research for EMAP Program us Environ-mental Protection Agency Corvallis Oregon
Loveland TR JW Merchant D O Ohlen and JF Brown1991 Development of a land-cover characteristics databasefor the conterminous US Photogrammetric Engineering andRemote Sensing 57(11) 1453-63
Lukatela H 1987 Hipparchus geopositioning model Anoverview In Proceedings of Auto Carto 8 Symposium Balti-more Maryland pp 87-96
Maling DH 1992 Coordinate systems and map projectioru (2nded) Oxford UK Pergamon Press
Muehrcke PC and JO Muehrcke 1997 Map we (4th ed) Madi-sonWisconsinJP Publications
Olea RO 1984 Sanlpling design optimization for spatial functionsMathematical Geowgy 16369-92
Saff EB and ABJ Kuijlaars 1997 Distnbuting many points on asphere The Mathematical Intelligencer 19(1)5-11
Slade G 1994 Self avoiding walks The MaJhematical Intelligencer16(1)29-35
Snyder JP 1987 Map projectioru-A working manual Wash-ington DC US Government Printing Office
Snyder JP 1992 An equal-area map projection for polyhe-dral globes Cartographica 29(1) 10-21
Song L 1997 Small circle subdivision method for develop-ment of global sampling grid Unpublished Masters thesisOregon State University 176 pp
Stauffer D 1992 Introduction to percolation theory (2nd ed)London UK Taylor amp Francis
Tobler WR and Z Chen 1986 A quadtree for global infor-mation storage GeographicalAnalysis 18(4) 360-71
White D A J Kimerling and WS Overton 1992 Carto-graphic and geometric components of a global samplingdesign for environmental monitoring Cartography and Geo-graphic Information Systems 195-22
White D AJ Kin1erlingK Sahr and L Song 1998 Comparingarea and shape distortion on polyhedral-based recursive partitionsof the sphere International Journal of Geographiad Information Science12 805-27
Wolfram S 1986 Cellular automaton fluids 1 Basic theoryjournal of Statistical Physics 45471-526 bull
(5)Zone perimeter = 2XTCXr(co~)
ZSG = SQ1middott(4XTCxcellarea - cellarea2lr2) I cellperimeter (6)
Zone Standardized Compactness (ZSC) isgiven by Zone perimeterCell perimeter Substi-tuting and combining equations we compute ZSCfrom
Baumgardner JR and PO Frederickson 1985 Icosahedraldiscretization of the two-sphere SIAM journal of NUrMricalAnalysis 22(6) 1107-15
Bomford G 1971 Geodesy Oxford The Clarendon Press731 pp
Brooks DR 1981 Grid systems for Earth radiation budgetexperiment applications NASA Technical Memorandum8323340 pp
Coexeter HSM 1962 The problem of packing a number ofequal nonoverlapping circles on a sphere Transactions NewYork Academy of Science Division of Mathematics Series IIvol 24 320-31
Dutton G 1988 Geodesic modeling of planetary relief Car-tographica 21 188-207
Dutton G 1994 Geographical grid models for environmentalmonitoring and analysis across the globe (panel session) InProceedings of GISUS 94 Conference Phoenix Arizona
cos$ =sqrt( IO-(IO-cellareal(2xTCX r2)) (4)
The perimeter of the spherical zone is thecircumference of the bounding parallel computedfrom
Gelarea = 2XTCxr2(lO-sin$) (2)
This research was supported by US Environ-mental Protection Agency-Oregon State Univer-sity Cooperative Agreement CR 821672 MatthewGregory Department of Geosciences graduatestudent created the centerpoint distance mapsseen in Figure 16 Dr Ralph Kahn NASA-JPLalso contributed significantly to this manuscriptThis manuscript has been subjected to EPA reviewand approved for publication The conclusionsand opinions are solely those of the authors andnot necessarily the viewsof the Agency
and
Setting the zone surface area equal to the cellarea we obtain
Vol 26 NO4 287
Del
iver
ed b
y P
ublis
hing
Tec
hnol
ogy
to O
rego
n S
tate
Uni
vers
ity IP
128
193
164
203
on
Sat
12
Nov
201
1 22
50
45C
opyr
ight
(c)
Car
togr
aphy
and
Geo
grap
hic
Info
rmat
ion
Soc
iety
All
right
s re
serv
ed
Remote Sensing for theEarth Sciences (3rd ed)Andrew Rencz
Recently adopted titlesin cartography GISremote sensingandGPS
Policy Issues in Modern art graph)DR Frazer Taylor (cd)
Wilderness NavigationBob and Mike Bums
I bullbull
ACS
Maps with the NewsMark Monmonier
Air Apparent HowMeteorologists Learnedto Map Predict andDramatize WeatherMark Monmonier
froooks
Mapping a Northern LandThe Survey of CanadaGerald McGrath and LouisSebert (eds)
Thematic Cartographyand VisualizationTerry A Slocum
1 it 11 bull
on Oirle ~y a30149j- ~24)
288 Cartography and Geographic Information Science
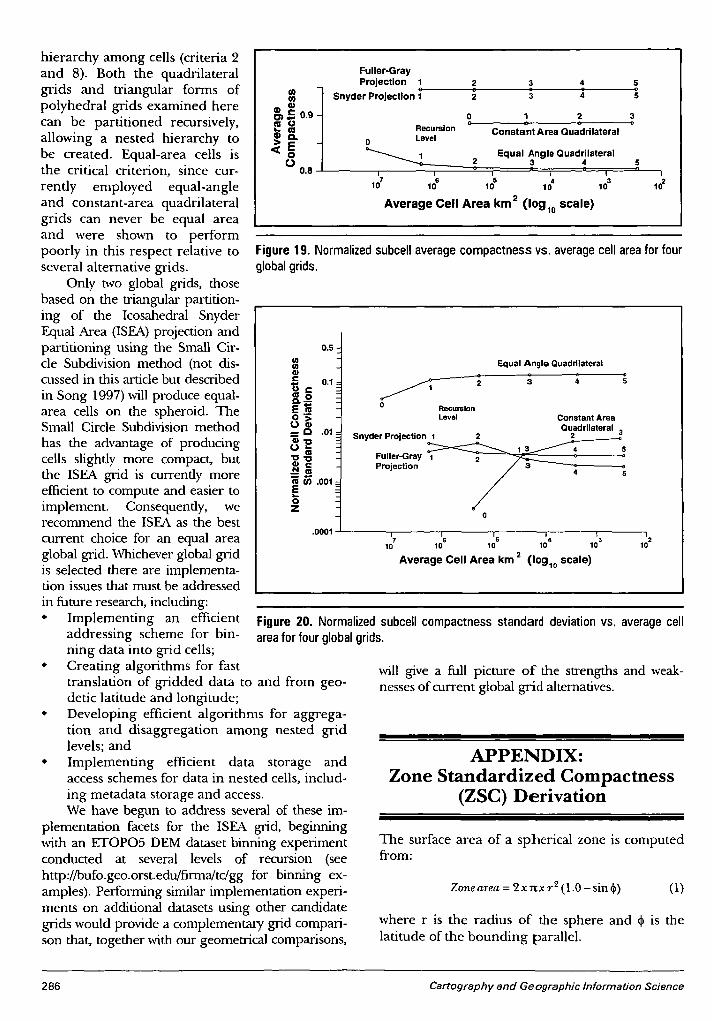
Del
iver
ed b
y P
ublis
hing
Tec
hnol
ogy
to O
rego
n S
tate
Uni
vers
ity IP
128
193
164
203
on
Sat
12
Nov
201
1 22
50
45C
opyr
ight
(c)
Car
togr
aphy
and
Geo
grap
hic
Info
rmat
ion
Soc
iety
All
right
s re
serv
ed
Figure 19 Normalized subcell average compactness VS average cell area for fourglobal grids
Figure 20 Normalized subcell compactness standard deviation vs average cellarea for four global grids
(1)
Equal Angle Quadrilateral
2 3 4 5bull 0
2 3 4 5
1 2 3 Constant Area auadrilateral
2Equal Angle Quadrilateral
3 4 5
Zone area = 2x 1tX r2 (10 - sin $)
RecursionLevel
o0-0 ---_e_----lto---
RecursionLevel
APPENDIXZone Standardized Compactness
(ZSC)Derivation
6 5 4 310 10 10 10
Average Cell Area km2 (10910 scale)
------ --_---lt~ 2 3 4
o
where r is the radius of the sphere and ltP is thelatitude of the bounding parallel
The surface area of a spherical zone is computedfrom
will give a full picture of the strengths and weak-nesses of current global grid alternatives
o
Constant AreaQuadrilateral
_~~ iFuller-Gray 1 2 Projection 3 4 5
o
Fuller-GrayProjection 1
Snyder Projection 1gt-------------------
05
00011------7---- ----------4 -----r--~2
10 10 10 10 10 102Average Cell Area km (10910scale)
CIl()CI)5 01 =() r~2Emlt3 ~- C 01=Gl 0 =0CO
111iii iii 001 =Ebulloz
IIIIII
CII CIImS 09tll ()bullbull tllClIogt Elt0o
08
hierarchy among cells (criteria 2and 8) Both the quadrilateralgrids and triangular forms ofpolyhedral grids examined herecan be partitioned recursivelyallowing a nested hierarchy tobe created Equal-area cells isthe critical criterion since cur-rently employed equal-angleand constant-area quadrilateralgrids can never be equal areaand were shown to performpoorly in this respect relative toseveral alternative grids
Only two global grids thosebased on the triangular partition-ing of the Icosahedral SnyderEqual Area (ISFA)projection andpartitioning using the Small Cir-cle Subdivision method (not dis-cussed in this article but describedin Song 1997)will produce equal-area cells on the spheroid TheSmall Circle Subdivision methodhas the advantage of producingcells slightly more compact butthe ISFA grid is currently moreefficient to compute and easier toimplement Consequently werecommend the ISFA as the bestcurrent choice for an equal areaglobal grid Whichever global gridis selected there are implementa-tion issues that must be addressedin future research includingbull Implementing an efficient
addressing scheme for bin-ning data into grid cells
bull Creating algorithms for fasttranslation of gridded data to and from geo-detic latitude and longitude
bull Developing efficient algorithms for aggrega-tion and disaggregation among nested gridlevels and
bull Implementing efficient data storage andaccess schemes for data in nested cells includ-ing metadata storage and accessWe have begun to address several of these im-
plementation facets for the ISFA grid beginningwith an ETOP05 DEM dataset binning experimentconducted at several levels of recursion (seehttpbufogeoorstedufirmatdgg for binning ex-amples) Performing similar implementation experi-ments on additional datasets using other candidategrids would provide a complementary grid compari-son that together with our geometrical comparisons
286 Cartography and Geographic Information Science
Del
iver
ed b
y P
ublis
hing
Tec
hnol
ogy
to O
rego
n S
tate
Uni
vers
ity IP
128
193
164
203
on
Sat
12
Nov
201
1 22
50
45C
opyr
ight
(c)
Car
togr
aphy
and
Geo
grap
hic
Info
rmat
ion
Soc
iety
All
right
s re
serv
ed
REFERENCES
ACKNOWLEDGMENTS
so that
EidenshinkJC andJL Faundeen 1994 The 1 km AVHRRglobal land data set First stages of implementation Inierna-tionaljournal of Remote Sensing 153443-62
Fekete G and L Treinish 1990 Sphere quadtree A newdata structure to support the visualization of sphericallydistributed data SPIE Extracting rManing from complex dataProcessing display interaction Vol 1259 pp 242-53
Fuller RB 1982 SynergeticJ NewYork MacMillanGiacaglia GEO and CA Lundquist 1972 Sampling func-
tions for geophysics Smithsonian A5trvphysical Observatory Spe-cial Report No 344 93 pp
Goodchild MF 1994 Geographical grid models for environ-mental monitoring and analysis across the globe (panelsession) In proceddings of GISUS 94 Conference PhoenixArizona
Gray RW 1994 Exact transformation equations for Fullersworld map Cartography and Geographic Informatian Systems21(4) 243-46
Hastings DA 1996 The global land l-km base elevationdigital elevation model A progress report Global ChangeNewsletter 27 11-12
Heikes R and DA Randall 1995 Numerical integration ofthe shallow-water equations on a twisted icosahedral gridPart I Basic design and results of tests Monthly WeatherReview 123 1862-80
Kahn R 1995 What shall we do with the data we are expect-ing in 1998 In Proceedings of the Massive Data SelJ WorkshopCommittee on Applied and Theoretical Statistics NationalAcademy of Sciences Washington DC
Kimerling AJ 1984 Area computation from geodetic coordi-nates on the spheroid Surveying and Mapping 44(4) 343-51
Kimerling AJ D White K Sahr and L Song 1995 Devel-opment of global sampling grid Mid-project report Samplingdesign and statistics research for EMAP Program us Environ-mental Protection Agency Corvallis Oregon
Loveland TR JW Merchant D O Ohlen and JF Brown1991 Development of a land-cover characteristics databasefor the conterminous US Photogrammetric Engineering andRemote Sensing 57(11) 1453-63
Lukatela H 1987 Hipparchus geopositioning model Anoverview In Proceedings of Auto Carto 8 Symposium Balti-more Maryland pp 87-96
Maling DH 1992 Coordinate systems and map projectioru (2nded) Oxford UK Pergamon Press
Muehrcke PC and JO Muehrcke 1997 Map we (4th ed) Madi-sonWisconsinJP Publications
Olea RO 1984 Sanlpling design optimization for spatial functionsMathematical Geowgy 16369-92
Saff EB and ABJ Kuijlaars 1997 Distnbuting many points on asphere The Mathematical Intelligencer 19(1)5-11
Slade G 1994 Self avoiding walks The MaJhematical Intelligencer16(1)29-35
Snyder JP 1987 Map projectioru-A working manual Wash-ington DC US Government Printing Office
Snyder JP 1992 An equal-area map projection for polyhe-dral globes Cartographica 29(1) 10-21
Song L 1997 Small circle subdivision method for develop-ment of global sampling grid Unpublished Masters thesisOregon State University 176 pp
Stauffer D 1992 Introduction to percolation theory (2nd ed)London UK Taylor amp Francis
Tobler WR and Z Chen 1986 A quadtree for global infor-mation storage GeographicalAnalysis 18(4) 360-71
White D A J Kimerling and WS Overton 1992 Carto-graphic and geometric components of a global samplingdesign for environmental monitoring Cartography and Geo-graphic Information Systems 195-22
White D AJ Kin1erlingK Sahr and L Song 1998 Comparingarea and shape distortion on polyhedral-based recursive partitionsof the sphere International Journal of Geographiad Information Science12 805-27
Wolfram S 1986 Cellular automaton fluids 1 Basic theoryjournal of Statistical Physics 45471-526 bull
(5)Zone perimeter = 2XTCXr(co~)
ZSG = SQ1middott(4XTCxcellarea - cellarea2lr2) I cellperimeter (6)
Zone Standardized Compactness (ZSC) isgiven by Zone perimeterCell perimeter Substi-tuting and combining equations we compute ZSCfrom
Baumgardner JR and PO Frederickson 1985 Icosahedraldiscretization of the two-sphere SIAM journal of NUrMricalAnalysis 22(6) 1107-15
Bomford G 1971 Geodesy Oxford The Clarendon Press731 pp
Brooks DR 1981 Grid systems for Earth radiation budgetexperiment applications NASA Technical Memorandum8323340 pp
Coexeter HSM 1962 The problem of packing a number ofequal nonoverlapping circles on a sphere Transactions NewYork Academy of Science Division of Mathematics Series IIvol 24 320-31
Dutton G 1988 Geodesic modeling of planetary relief Car-tographica 21 188-207
Dutton G 1994 Geographical grid models for environmentalmonitoring and analysis across the globe (panel session) InProceedings of GISUS 94 Conference Phoenix Arizona
cos$ =sqrt( IO-(IO-cellareal(2xTCX r2)) (4)
The perimeter of the spherical zone is thecircumference of the bounding parallel computedfrom
Gelarea = 2XTCxr2(lO-sin$) (2)
This research was supported by US Environ-mental Protection Agency-Oregon State Univer-sity Cooperative Agreement CR 821672 MatthewGregory Department of Geosciences graduatestudent created the centerpoint distance mapsseen in Figure 16 Dr Ralph Kahn NASA-JPLalso contributed significantly to this manuscriptThis manuscript has been subjected to EPA reviewand approved for publication The conclusionsand opinions are solely those of the authors andnot necessarily the viewsof the Agency
and
Setting the zone surface area equal to the cellarea we obtain
Vol 26 NO4 287
Del
iver
ed b
y P
ublis
hing
Tec
hnol
ogy
to O
rego
n S
tate
Uni
vers
ity IP
128
193
164
203
on
Sat
12
Nov
201
1 22
50
45C
opyr
ight
(c)
Car
togr
aphy
and
Geo
grap
hic
Info
rmat
ion
Soc
iety
All
right
s re
serv
ed
Remote Sensing for theEarth Sciences (3rd ed)Andrew Rencz
Recently adopted titlesin cartography GISremote sensingandGPS
Policy Issues in Modern art graph)DR Frazer Taylor (cd)
Wilderness NavigationBob and Mike Bums
I bullbull
ACS
Maps with the NewsMark Monmonier
Air Apparent HowMeteorologists Learnedto Map Predict andDramatize WeatherMark Monmonier
froooks
Mapping a Northern LandThe Survey of CanadaGerald McGrath and LouisSebert (eds)
Thematic Cartographyand VisualizationTerry A Slocum
1 it 11 bull
on Oirle ~y a30149j- ~24)
288 Cartography and Geographic Information Science
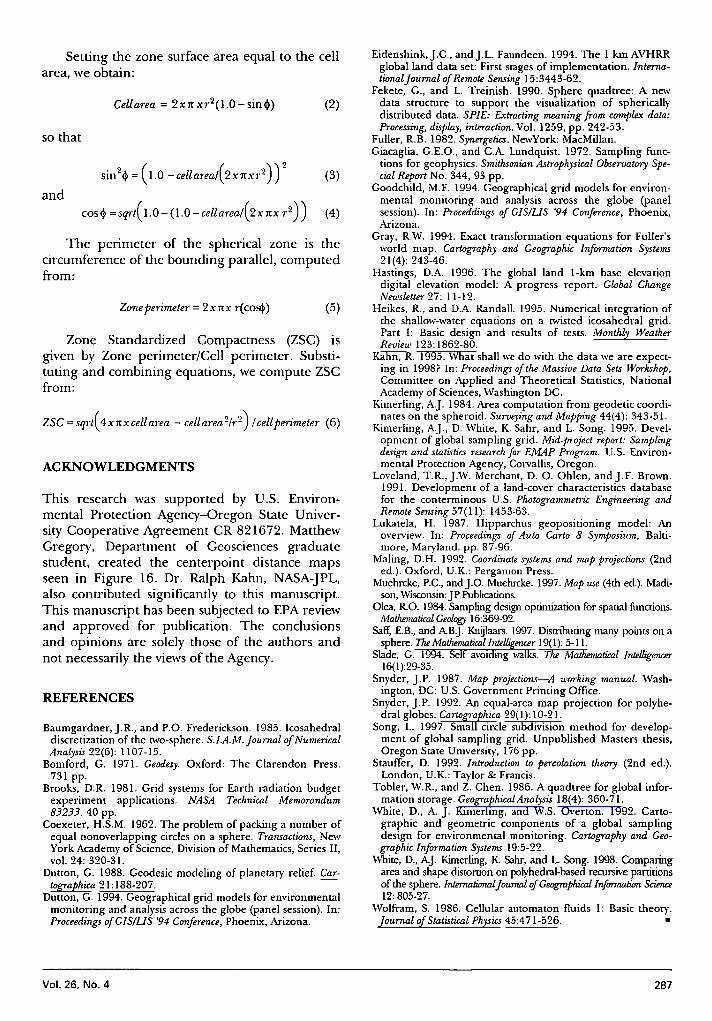
Del
iver
ed b
y P
ublis
hing
Tec
hnol
ogy
to O
rego
n S
tate
Uni
vers
ity IP
128
193
164
203
on
Sat
12
Nov
201
1 22
50
45C
opyr
ight
(c)
Car
togr
aphy
and
Geo
grap
hic
Info
rmat
ion
Soc
iety
All
right
s re
serv
ed
REFERENCES
ACKNOWLEDGMENTS
so that
EidenshinkJC andJL Faundeen 1994 The 1 km AVHRRglobal land data set First stages of implementation Inierna-tionaljournal of Remote Sensing 153443-62
Fekete G and L Treinish 1990 Sphere quadtree A newdata structure to support the visualization of sphericallydistributed data SPIE Extracting rManing from complex dataProcessing display interaction Vol 1259 pp 242-53
Fuller RB 1982 SynergeticJ NewYork MacMillanGiacaglia GEO and CA Lundquist 1972 Sampling func-
tions for geophysics Smithsonian A5trvphysical Observatory Spe-cial Report No 344 93 pp
Goodchild MF 1994 Geographical grid models for environ-mental monitoring and analysis across the globe (panelsession) In proceddings of GISUS 94 Conference PhoenixArizona
Gray RW 1994 Exact transformation equations for Fullersworld map Cartography and Geographic Informatian Systems21(4) 243-46
Hastings DA 1996 The global land l-km base elevationdigital elevation model A progress report Global ChangeNewsletter 27 11-12
Heikes R and DA Randall 1995 Numerical integration ofthe shallow-water equations on a twisted icosahedral gridPart I Basic design and results of tests Monthly WeatherReview 123 1862-80
Kahn R 1995 What shall we do with the data we are expect-ing in 1998 In Proceedings of the Massive Data SelJ WorkshopCommittee on Applied and Theoretical Statistics NationalAcademy of Sciences Washington DC
Kimerling AJ 1984 Area computation from geodetic coordi-nates on the spheroid Surveying and Mapping 44(4) 343-51
Kimerling AJ D White K Sahr and L Song 1995 Devel-opment of global sampling grid Mid-project report Samplingdesign and statistics research for EMAP Program us Environ-mental Protection Agency Corvallis Oregon
Loveland TR JW Merchant D O Ohlen and JF Brown1991 Development of a land-cover characteristics databasefor the conterminous US Photogrammetric Engineering andRemote Sensing 57(11) 1453-63
Lukatela H 1987 Hipparchus geopositioning model Anoverview In Proceedings of Auto Carto 8 Symposium Balti-more Maryland pp 87-96
Maling DH 1992 Coordinate systems and map projectioru (2nded) Oxford UK Pergamon Press
Muehrcke PC and JO Muehrcke 1997 Map we (4th ed) Madi-sonWisconsinJP Publications
Olea RO 1984 Sanlpling design optimization for spatial functionsMathematical Geowgy 16369-92
Saff EB and ABJ Kuijlaars 1997 Distnbuting many points on asphere The Mathematical Intelligencer 19(1)5-11
Slade G 1994 Self avoiding walks The MaJhematical Intelligencer16(1)29-35
Snyder JP 1987 Map projectioru-A working manual Wash-ington DC US Government Printing Office
Snyder JP 1992 An equal-area map projection for polyhe-dral globes Cartographica 29(1) 10-21
Song L 1997 Small circle subdivision method for develop-ment of global sampling grid Unpublished Masters thesisOregon State University 176 pp
Stauffer D 1992 Introduction to percolation theory (2nd ed)London UK Taylor amp Francis
Tobler WR and Z Chen 1986 A quadtree for global infor-mation storage GeographicalAnalysis 18(4) 360-71
White D A J Kimerling and WS Overton 1992 Carto-graphic and geometric components of a global samplingdesign for environmental monitoring Cartography and Geo-graphic Information Systems 195-22
White D AJ Kin1erlingK Sahr and L Song 1998 Comparingarea and shape distortion on polyhedral-based recursive partitionsof the sphere International Journal of Geographiad Information Science12 805-27
Wolfram S 1986 Cellular automaton fluids 1 Basic theoryjournal of Statistical Physics 45471-526 bull
(5)Zone perimeter = 2XTCXr(co~)
ZSG = SQ1middott(4XTCxcellarea - cellarea2lr2) I cellperimeter (6)
Zone Standardized Compactness (ZSC) isgiven by Zone perimeterCell perimeter Substi-tuting and combining equations we compute ZSCfrom
Baumgardner JR and PO Frederickson 1985 Icosahedraldiscretization of the two-sphere SIAM journal of NUrMricalAnalysis 22(6) 1107-15
Bomford G 1971 Geodesy Oxford The Clarendon Press731 pp
Brooks DR 1981 Grid systems for Earth radiation budgetexperiment applications NASA Technical Memorandum8323340 pp
Coexeter HSM 1962 The problem of packing a number ofequal nonoverlapping circles on a sphere Transactions NewYork Academy of Science Division of Mathematics Series IIvol 24 320-31
Dutton G 1988 Geodesic modeling of planetary relief Car-tographica 21 188-207
Dutton G 1994 Geographical grid models for environmentalmonitoring and analysis across the globe (panel session) InProceedings of GISUS 94 Conference Phoenix Arizona
cos$ =sqrt( IO-(IO-cellareal(2xTCX r2)) (4)
The perimeter of the spherical zone is thecircumference of the bounding parallel computedfrom
Gelarea = 2XTCxr2(lO-sin$) (2)
This research was supported by US Environ-mental Protection Agency-Oregon State Univer-sity Cooperative Agreement CR 821672 MatthewGregory Department of Geosciences graduatestudent created the centerpoint distance mapsseen in Figure 16 Dr Ralph Kahn NASA-JPLalso contributed significantly to this manuscriptThis manuscript has been subjected to EPA reviewand approved for publication The conclusionsand opinions are solely those of the authors andnot necessarily the viewsof the Agency
and
Setting the zone surface area equal to the cellarea we obtain
Vol 26 NO4 287
Del
iver
ed b
y P
ublis
hing
Tec
hnol
ogy
to O
rego
n S
tate
Uni
vers
ity IP
128
193
164
203
on
Sat
12
Nov
201
1 22
50
45C
opyr
ight
(c)
Car
togr
aphy
and
Geo
grap
hic
Info
rmat
ion
Soc
iety
All
right
s re
serv
ed
Remote Sensing for theEarth Sciences (3rd ed)Andrew Rencz
Recently adopted titlesin cartography GISremote sensingandGPS
Policy Issues in Modern art graph)DR Frazer Taylor (cd)
Wilderness NavigationBob and Mike Bums
I bullbull
ACS
Maps with the NewsMark Monmonier
Air Apparent HowMeteorologists Learnedto Map Predict andDramatize WeatherMark Monmonier
froooks
Mapping a Northern LandThe Survey of CanadaGerald McGrath and LouisSebert (eds)
Thematic Cartographyand VisualizationTerry A Slocum
1 it 11 bull
on Oirle ~y a30149j- ~24)
288 Cartography and Geographic Information Science